Zip Codes with the Highest Percentage of Self-Employed / Not Incorporated in Oregon
RELATED REPORTS & OPTIONS
Self-Employed / Not Incorporated
Oregon
Compare Zip Codes
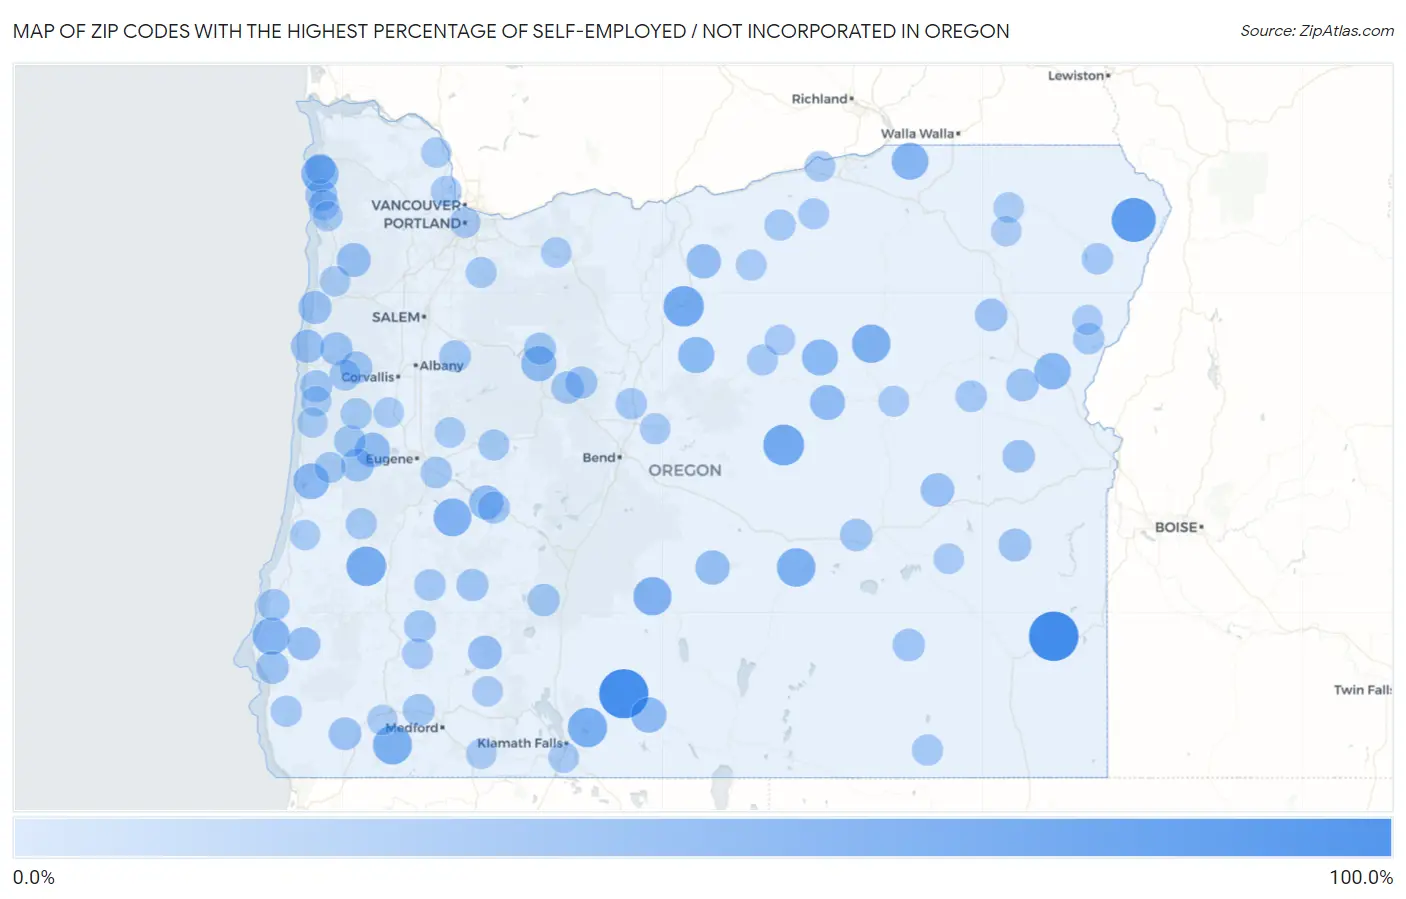
Map of Zip Codes with the Highest Percentage of Self-Employed / Not Incorporated in Oregon
0.0%
100.0%
Zip Codes with the Highest Percentage of Self-Employed / Not Incorporated in Oregon
| Zip Code | % Self-Employed / Not Incorporated | vs State | vs National | |
| 1. | 97902 | 85.7% | 6.9%(+78.8)#1 | 5.8%(+79.9)#64 |
| 2. | 97621 | 84.5% | 6.9%(+77.6)#2 | 5.8%(+78.7)#66 |
| 3. | 97842 | 64.3% | 6.9%(+57.4)#3 | 5.8%(+58.5)#119 |
| 4. | 97751 | 51.6% | 6.9%(+44.7)#4 | 5.8%(+45.8)#203 |
| 5. | 97057 | 50.0% | 6.9%(+43.1)#5 | 5.8%(+44.2)#234 |
| 6. | 97486 | 47.0% | 6.9%(+40.0)#6 | 5.8%(+41.1)#270 |
| 7. | 97625 | 45.7% | 6.9%(+38.7)#7 | 5.8%(+39.8)#291 |
| 8. | 97544 | 44.5% | 6.9%(+37.5)#8 | 5.8%(+38.6)#309 |
| 9. | 97758 | 42.9% | 6.9%(+35.9)#9 | 5.8%(+37.0)#340 |
| 10. | 97856 | 42.5% | 6.9%(+35.6)#10 | 5.8%(+36.7)#351 |
| 11. | 97638 | 41.3% | 6.9%(+34.4)#11 | 5.8%(+35.5)#377 |
| 12. | 97434 | 39.6% | 6.9%(+32.7)#12 | 5.8%(+33.8)#413 |
| 13. | 97102 | 37.1% | 6.9%(+30.2)#13 | 5.8%(+31.3)#486 |
| 14. | 97450 | 37.1% | 6.9%(+30.1)#14 | 5.8%(+31.2)#490 |
| 15. | 97835 | 36.6% | 6.9%(+29.7)#15 | 5.8%(+30.7)#504 |
| 16. | 97905 | 34.5% | 6.9%(+27.6)#16 | 5.8%(+28.7)#564 |
| 17. | 97848 | 33.3% | 6.9%(+26.4)#17 | 5.8%(+27.5)#603 |
| 18. | 97711 | 33.3% | 6.9%(+26.4)#18 | 5.8%(+27.5)#616 |
| 19. | 97493 | 32.3% | 6.9%(+25.4)#19 | 5.8%(+26.4)#661 |
| 20. | 97622 | 30.6% | 6.9%(+23.7)#20 | 5.8%(+24.8)#740 |
| 21. | 97350 | 29.4% | 6.9%(+22.5)#21 | 5.8%(+23.6)#804 |
| 22. | 97825 | 28.8% | 6.9%(+21.9)#22 | 5.8%(+23.0)#834 |
| 23. | 97461 | 28.0% | 6.9%(+21.1)#23 | 5.8%(+22.2)#892 |
| 24. | 97033 | 26.9% | 6.9%(+20.0)#24 | 5.8%(+21.1)#961 |
| 25. | 97641 | 26.7% | 6.9%(+19.8)#25 | 5.8%(+20.9)#978 |
| 26. | 97492 | 26.2% | 6.9%(+19.3)#26 | 5.8%(+20.4)#1,027 |
| 27. | 97108 | 25.3% | 6.9%(+18.4)#27 | 5.8%(+19.5)#1,121 |
| 28. | 97536 | 24.3% | 6.9%(+17.4)#28 | 5.8%(+18.5)#1,230 |
| 29. | 97904 | 23.8% | 6.9%(+16.9)#29 | 5.8%(+17.9)#1,279 |
| 30. | 97466 | 22.8% | 6.9%(+15.9)#30 | 5.8%(+17.0)#1,381 |
| 31. | 97369 | 22.2% | 6.9%(+15.3)#31 | 5.8%(+16.4)#1,440 |
| 32. | 97364 | 22.1% | 6.9%(+15.2)#32 | 5.8%(+16.3)#1,462 |
| 33. | 97490 | 21.2% | 6.9%(+14.3)#33 | 5.8%(+15.4)#1,608 |
| 34. | 97906 | 20.7% | 6.9%(+13.8)#34 | 5.8%(+14.9)#1,689 |
| 35. | 97465 | 20.2% | 6.9%(+13.3)#35 | 5.8%(+14.4)#1,772 |
| 36. | 97538 | 20.1% | 6.9%(+13.2)#36 | 5.8%(+14.3)#1,790 |
| 37. | 97833 | 20.1% | 6.9%(+13.2)#37 | 5.8%(+14.3)#1,792 |
| 38. | 97357 | 20.0% | 6.9%(+13.1)#38 | 5.8%(+14.2)#1,817 |
| 39. | 97920 | 20.0% | 6.9%(+13.1)#39 | 5.8%(+14.2)#1,831 |
| 40. | 97819 | 20.0% | 6.9%(+13.1)#40 | 5.8%(+14.2)#1,834 |
| 41. | 97721 | 19.4% | 6.9%(+12.5)#41 | 5.8%(+13.6)#1,926 |
| 42. | 97738 | 19.4% | 6.9%(+12.5)#42 | 5.8%(+13.6)#1,929 |
| 43. | 97759 | 19.3% | 6.9%(+12.4)#43 | 5.8%(+13.5)#1,949 |
| 44. | 97731 | 18.8% | 6.9%(+11.9)#44 | 5.8%(+13.0)#2,078 |
| 45. | 97326 | 18.8% | 6.9%(+11.8)#45 | 5.8%(+12.9)#2,097 |
| 46. | 97447 | 18.7% | 6.9%(+11.8)#46 | 5.8%(+12.9)#2,105 |
| 47. | 97730 | 18.2% | 6.9%(+11.3)#47 | 5.8%(+12.4)#2,264 |
| 48. | 97376 | 17.9% | 6.9%(+11.0)#48 | 5.8%(+12.1)#2,331 |
| 49. | 97463 | 17.9% | 6.9%(+11.0)#49 | 5.8%(+12.1)#2,333 |
| 50. | 97525 | 17.7% | 6.9%(+10.8)#50 | 5.8%(+11.9)#2,388 |
| 51. | 97342 | 17.5% | 6.9%(+10.6)#51 | 5.8%(+11.7)#2,466 |
| 52. | 97411 | 17.5% | 6.9%(+10.6)#52 | 5.8%(+11.7)#2,468 |
| 53. | 97429 | 17.5% | 6.9%(+10.6)#53 | 5.8%(+11.7)#2,473 |
| 54. | 97374 | 17.1% | 6.9%(+10.2)#54 | 5.8%(+11.3)#2,593 |
| 55. | 97430 | 16.9% | 6.9%(+10.0)#55 | 5.8%(+11.1)#2,651 |
| 56. | 97130 | 16.9% | 6.9%(+10.0)#56 | 5.8%(+11.1)#2,654 |
| 57. | 97455 | 16.2% | 6.9%(+9.30)#57 | 5.8%(+10.4)#2,900 |
| 58. | 97443 | 16.1% | 6.9%(+9.15)#58 | 5.8%(+10.2)#2,952 |
| 59. | 97884 | 16.0% | 6.9%(+9.09)#59 | 5.8%(+10.2)#2,974 |
| 60. | 97760 | 15.6% | 6.9%(+8.72)#60 | 5.8%(+9.81)#3,150 |
| 61. | 97846 | 15.4% | 6.9%(+8.48)#61 | 5.8%(+9.58)#3,231 |
| 62. | 97870 | 15.3% | 6.9%(+8.44)#62 | 5.8%(+9.53)#3,259 |
| 63. | 97843 | 15.1% | 6.9%(+8.14)#63 | 5.8%(+9.24)#3,396 |
| 64. | 97324 | 14.8% | 6.9%(+7.90)#64 | 5.8%(+8.99)#3,515 |
| 65. | 97444 | 14.7% | 6.9%(+7.80)#65 | 5.8%(+8.89)#3,561 |
| 66. | 97436 | 14.5% | 6.9%(+7.61)#66 | 5.8%(+8.70)#3,645 |
| 67. | 97343 | 14.4% | 6.9%(+7.53)#67 | 5.8%(+8.62)#3,682 |
| 68. | 97710 | 14.3% | 6.9%(+7.38)#68 | 5.8%(+8.47)#3,759 |
| 69. | 97750 | 14.2% | 6.9%(+7.29)#69 | 5.8%(+8.38)#3,806 |
| 70. | 97453 | 14.1% | 6.9%(+7.22)#70 | 5.8%(+8.31)#3,835 |
| 71. | 97042 | 14.0% | 6.9%(+7.13)#71 | 5.8%(+8.22)#3,878 |
| 72. | 97488 | 14.0% | 6.9%(+7.11)#72 | 5.8%(+8.20)#3,889 |
| 73. | 97845 | 13.6% | 6.9%(+6.69)#73 | 5.8%(+7.79)#4,127 |
| 74. | 97823 | 13.6% | 6.9%(+6.65)#74 | 5.8%(+7.74)#4,152 |
| 75. | 97839 | 13.5% | 6.9%(+6.61)#75 | 5.8%(+7.70)#4,182 |
| 76. | 97753 | 13.5% | 6.9%(+6.60)#76 | 5.8%(+7.70)#4,186 |
| 77. | 97410 | 13.3% | 6.9%(+6.43)#77 | 5.8%(+7.52)#4,288 |
| 78. | 97231 | 13.2% | 6.9%(+6.34)#78 | 5.8%(+7.43)#4,354 |
| 79. | 97844 | 12.9% | 6.9%(+5.97)#79 | 5.8%(+7.06)#4,603 |
| 80. | 97204 | 12.8% | 6.9%(+5.90)#80 | 5.8%(+6.99)#4,660 |
| 81. | 97874 | 12.7% | 6.9%(+5.82)#81 | 5.8%(+6.91)#4,712 |
| 82. | 97634 | 12.7% | 6.9%(+5.81)#82 | 5.8%(+6.90)#4,720 |
| 83. | 97136 | 12.7% | 6.9%(+5.79)#83 | 5.8%(+6.88)#4,729 |
| 84. | 97732 | 12.5% | 6.9%(+5.59)#84 | 5.8%(+6.68)#4,894 |
| 85. | 97122 | 12.2% | 6.9%(+5.34)#85 | 5.8%(+6.43)#5,079 |
| 86. | 97449 | 12.2% | 6.9%(+5.29)#86 | 5.8%(+6.39)#5,116 |
| 87. | 97827 | 12.2% | 6.9%(+5.29)#87 | 5.8%(+6.38)#5,118 |
| 88. | 97049 | 12.2% | 6.9%(+5.27)#88 | 5.8%(+6.36)#5,137 |
| 89. | 97522 | 12.2% | 6.9%(+5.25)#89 | 5.8%(+6.35)#5,157 |
| 90. | 97454 | 12.2% | 6.9%(+5.25)#90 | 5.8%(+6.34)#5,160 |
| 91. | 97520 | 12.1% | 6.9%(+5.19)#91 | 5.8%(+6.28)#5,213 |
| 92. | 97394 | 12.1% | 6.9%(+5.17)#92 | 5.8%(+6.26)#5,224 |
| 93. | 97527 | 12.0% | 6.9%(+5.06)#93 | 5.8%(+6.15)#5,312 |
| 94. | 97054 | 11.8% | 6.9%(+4.93)#94 | 5.8%(+6.03)#5,404 |
| 95. | 97107 | 11.8% | 6.9%(+4.85)#95 | 5.8%(+5.94)#5,491 |
| 96. | 97841 | 11.7% | 6.9%(+4.75)#96 | 5.8%(+5.85)#5,568 |
| 97. | 97145 | 11.6% | 6.9%(+4.72)#97 | 5.8%(+5.81)#5,599 |
| 98. | 97456 | 11.6% | 6.9%(+4.68)#98 | 5.8%(+5.77)#5,631 |
| 99. | 97834 | 11.5% | 6.9%(+4.56)#99 | 5.8%(+5.65)#5,734 |
| 100. | 97498 | 11.5% | 6.9%(+4.56)#100 | 5.8%(+5.65)#5,739 |
Common Questions
What are the Top 10 Zip Codes with the Highest Percentage of Self-Employed / Not Incorporated in Oregon?
Top 10 Zip Codes with the Highest Percentage of Self-Employed / Not Incorporated in Oregon are:
What zip code has the Highest Percentage of Self-Employed / Not Incorporated in Oregon?
97902 has the Highest Percentage of Self-Employed / Not Incorporated in Oregon with 85.7%.
What is the Percentage of Self-Employed / Not Incorporated in the State of Oregon?
Percentage of Self-Employed / Not Incorporated in Oregon is 6.9%.
What is the Percentage of Self-Employed / Not Incorporated in the United States?
Percentage of Self-Employed / Not Incorporated in the United States is 5.8%.