Zip Codes with the Highest Percentage of Self-Employed / Not Incorporated in Wyoming
RELATED REPORTS & OPTIONS
Self-Employed / Not Incorporated
Wyoming
Compare Zip Codes
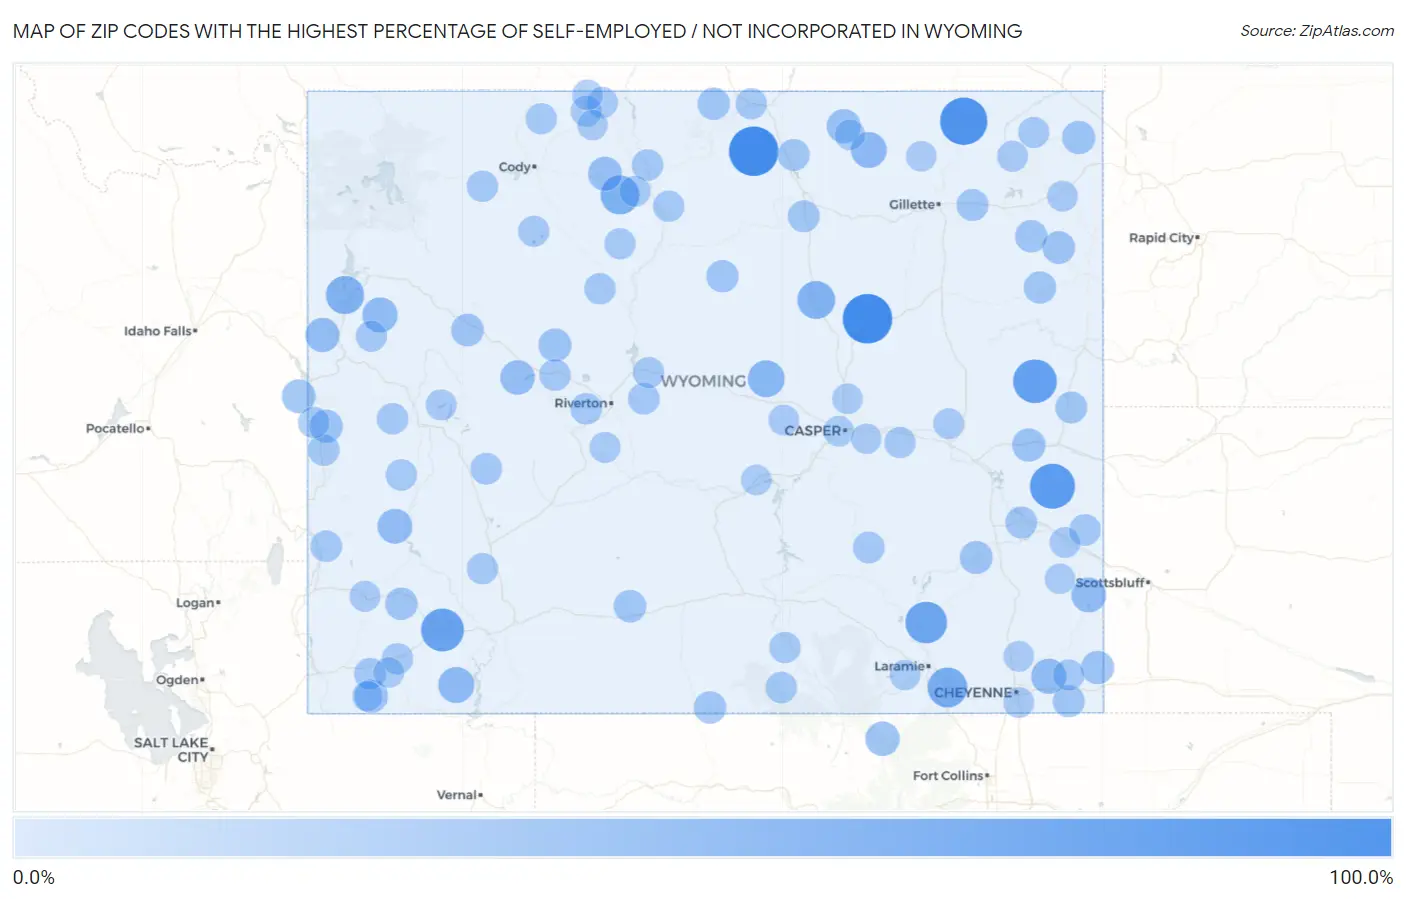
Map of Zip Codes with the Highest Percentage of Self-Employed / Not Incorporated in Wyoming
0.0%
100.0%
Zip Codes with the Highest Percentage of Self-Employed / Not Incorporated in Wyoming
| Zip Code | % Self-Employed / Not Incorporated | vs State | vs National | |
| 1. | 82833 | 100.0% | 6.7%(+93.3)#1 | 5.8%(+94.2)#5 |
| 2. | 82640 | 100.0% | 6.7%(+93.3)#2 | 5.8%(+94.2)#14 |
| 3. | 82731 | 88.4% | 6.7%(+81.7)#3 | 5.8%(+82.6)#60 |
| 4. | 82219 | 76.9% | 6.7%(+70.2)#4 | 5.8%(+71.1)#83 |
| 5. | 82222 | 70.2% | 6.7%(+63.5)#5 | 5.8%(+64.4)#98 |
| 6. | 82929 | 66.7% | 6.7%(+60.0)#6 | 5.8%(+60.9)#112 |
| 7. | 82051 | 60.7% | 6.7%(+54.0)#7 | 5.8%(+54.9)#138 |
| 8. | 82073 | 51.3% | 6.7%(+44.6)#8 | 5.8%(+45.5)#207 |
| 9. | 82434 | 45.9% | 6.7%(+39.2)#9 | 5.8%(+40.1)#287 |
| 10. | 83012 | 42.5% | 6.7%(+35.8)#10 | 5.8%(+36.7)#352 |
| 11. | 82639 | 41.5% | 6.7%(+34.8)#11 | 5.8%(+35.7)#371 |
| 12. | 82648 | 36.2% | 6.7%(+29.5)#12 | 5.8%(+30.4)#520 |
| 13. | 82938 | 32.1% | 6.7%(+25.4)#13 | 5.8%(+26.3)#670 |
| 14. | 82831 | 31.4% | 6.7%(+24.7)#14 | 5.8%(+25.6)#701 |
| 15. | 83011 | 28.5% | 6.7%(+21.7)#15 | 5.8%(+22.6)#864 |
| 16. | 82060 | 28.2% | 6.7%(+21.4)#16 | 5.8%(+22.3)#881 |
| 17. | 82217 | 26.7% | 6.7%(+20.0)#17 | 5.8%(+20.9)#994 |
| 18. | 83123 | 26.4% | 6.7%(+19.7)#18 | 5.8%(+20.6)#1,007 |
| 19. | 82512 | 24.7% | 6.7%(+17.9)#19 | 5.8%(+18.8)#1,189 |
| 20. | 82063 | 24.0% | 6.7%(+17.3)#20 | 5.8%(+18.2)#1,254 |
| 21. | 83014 | 23.8% | 6.7%(+17.1)#21 | 5.8%(+18.0)#1,277 |
| 22. | 82835 | 23.0% | 6.7%(+16.3)#22 | 5.8%(+17.2)#1,357 |
| 23. | 82411 | 22.6% | 6.7%(+15.9)#23 | 5.8%(+16.8)#1,399 |
| 24. | 83120 | 20.9% | 6.7%(+14.1)#24 | 5.8%(+15.0)#1,664 |
| 25. | 82227 | 18.9% | 6.7%(+12.1)#25 | 5.8%(+13.0)#2,075 |
| 26. | 82944 | 18.8% | 6.7%(+12.1)#26 | 5.8%(+13.0)#2,085 |
| 27. | 82082 | 18.5% | 6.7%(+11.7)#27 | 5.8%(+12.6)#2,181 |
| 28. | 83112 | 18.3% | 6.7%(+11.6)#28 | 5.8%(+12.5)#2,218 |
| 29. | 82710 | 18.1% | 6.7%(+11.3)#29 | 5.8%(+12.2)#2,297 |
| 30. | 82523 | 17.5% | 6.7%(+10.7)#30 | 5.8%(+11.6)#2,476 |
| 31. | 82201 | 17.2% | 6.7%(+10.5)#31 | 5.8%(+11.4)#2,572 |
| 32. | 82723 | 16.3% | 6.7%(+9.61)#32 | 5.8%(+10.5)#2,862 |
| 33. | 82513 | 15.6% | 6.7%(+8.92)#33 | 5.8%(+9.82)#3,147 |
| 34. | 82336 | 15.4% | 6.7%(+8.72)#34 | 5.8%(+9.62)#3,221 |
| 35. | 83124 | 14.9% | 6.7%(+8.23)#35 | 5.8%(+9.13)#3,448 |
| 36. | 82838 | 14.5% | 6.7%(+7.79)#36 | 5.8%(+8.69)#3,655 |
| 37. | 82730 | 14.4% | 6.7%(+7.69)#37 | 5.8%(+8.59)#3,696 |
| 38. | 82323 | 14.3% | 6.7%(+7.57)#38 | 5.8%(+8.47)#3,742 |
| 39. | 82701 | 14.1% | 6.7%(+7.41)#39 | 5.8%(+8.31)#3,842 |
| 40. | 82442 | 14.0% | 6.7%(+7.30)#40 | 5.8%(+8.20)#3,892 |
| 41. | 82727 | 12.6% | 6.7%(+5.89)#41 | 5.8%(+6.79)#4,799 |
| 42. | 82054 | 12.0% | 6.7%(+5.31)#42 | 5.8%(+6.21)#5,272 |
| 43. | 82834 | 12.0% | 6.7%(+5.24)#43 | 5.8%(+6.14)#5,316 |
| 44. | 82832 | 11.9% | 6.7%(+5.21)#44 | 5.8%(+6.11)#5,331 |
| 45. | 82225 | 11.9% | 6.7%(+5.15)#45 | 5.8%(+6.05)#5,383 |
| 46. | 82214 | 11.9% | 6.7%(+5.14)#46 | 5.8%(+6.04)#5,392 |
| 47. | 82933 | 11.2% | 6.7%(+4.48)#47 | 5.8%(+5.38)#6,005 |
| 48. | 82329 | 11.2% | 6.7%(+4.46)#48 | 5.8%(+5.36)#6,025 |
| 49. | 82516 | 10.9% | 6.7%(+4.21)#49 | 5.8%(+5.11)#6,291 |
| 50. | 82923 | 10.9% | 6.7%(+4.20)#50 | 5.8%(+5.10)#6,295 |
| 51. | 82240 | 10.7% | 6.7%(+3.94)#51 | 5.8%(+4.84)#6,587 |
| 52. | 83110 | 10.6% | 6.7%(+3.92)#52 | 5.8%(+4.82)#6,617 |
| 53. | 82501 | 10.6% | 6.7%(+3.86)#53 | 5.8%(+4.76)#6,673 |
| 54. | 83114 | 10.5% | 6.7%(+3.79)#54 | 5.8%(+4.69)#6,764 |
| 55. | 82426 | 10.4% | 6.7%(+3.67)#55 | 5.8%(+4.57)#6,907 |
| 56. | 82325 | 10.3% | 6.7%(+3.54)#56 | 5.8%(+4.44)#7,051 |
| 57. | 82510 | 10.2% | 6.7%(+3.52)#57 | 5.8%(+4.42)#7,084 |
| 58. | 83115 | 10.0% | 6.7%(+3.28)#58 | 5.8%(+4.18)#7,363 |
| 59. | 82443 | 9.8% | 6.7%(+3.05)#59 | 5.8%(+3.95)#7,669 |
| 60. | 83113 | 9.7% | 6.7%(+3.03)#60 | 5.8%(+3.93)#7,699 |
| 61. | 82414 | 9.2% | 6.7%(+2.49)#61 | 5.8%(+3.39)#8,449 |
| 62. | 82839 | 9.1% | 6.7%(+2.43)#62 | 5.8%(+3.33)#8,551 |
| 63. | 83127 | 9.1% | 6.7%(+2.38)#63 | 5.8%(+3.28)#8,627 |
| 64. | 82937 | 8.9% | 6.7%(+2.19)#64 | 5.8%(+3.09)#8,945 |
| 65. | 82331 | 8.9% | 6.7%(+2.16)#65 | 5.8%(+3.06)#9,007 |
| 66. | 82432 | 8.9% | 6.7%(+2.16)#66 | 5.8%(+3.06)#9,013 |
| 67. | 82932 | 8.8% | 6.7%(+2.13)#67 | 5.8%(+3.03)#9,064 |
| 68. | 82637 | 8.8% | 6.7%(+2.13)#68 | 5.8%(+3.03)#9,076 |
| 69. | 82401 | 8.7% | 6.7%(+1.94)#69 | 5.8%(+2.84)#9,374 |
| 70. | 82433 | 8.5% | 6.7%(+1.81)#70 | 5.8%(+2.71)#9,616 |
| 71. | 82053 | 8.5% | 6.7%(+1.76)#71 | 5.8%(+2.66)#9,702 |
| 72. | 82435 | 8.3% | 6.7%(+1.60)#72 | 5.8%(+2.50)#10,034 |
| 73. | 83001 | 8.2% | 6.7%(+1.50)#73 | 5.8%(+2.40)#10,196 |
| 74. | 82649 | 8.2% | 6.7%(+1.44)#74 | 5.8%(+2.34)#10,326 |
| 75. | 82720 | 8.0% | 6.7%(+1.29)#75 | 5.8%(+2.19)#10,613 |
| 76. | 82420 | 7.8% | 6.7%(+1.08)#76 | 5.8%(+1.98)#11,078 |
| 77. | 82520 | 7.8% | 6.7%(+1.08)#77 | 5.8%(+1.98)#11,088 |
| 78. | 82421 | 7.6% | 6.7%(+0.911)#78 | 5.8%(+1.81)#11,469 |
| 79. | 83116 | 7.4% | 6.7%(+0.650)#79 | 5.8%(+1.55)#12,136 |
| 80. | 82721 | 7.3% | 6.7%(+0.611)#80 | 5.8%(+1.51)#12,225 |
| 81. | 82410 | 7.3% | 6.7%(+0.536)#81 | 5.8%(+1.44)#12,387 |
| 82. | 82941 | 7.2% | 6.7%(+0.516)#82 | 5.8%(+1.42)#12,431 |
| 83. | 82223 | 6.9% | 6.7%(+0.229)#83 | 5.8%(+1.13)#13,199 |
| 84. | 82633 | 6.8% | 6.7%(+0.119)#84 | 5.8%(+1.02)#13,490 |
| 85. | 82729 | 6.8% | 6.7%(+0.099)#85 | 5.8%(+1.000)#13,551 |
| 86. | 82423 | 6.6% | 6.7%(-0.137)#86 | 5.8%(+0.763)#14,209 |
| 87. | 82604 | 6.2% | 6.7%(-0.483)#87 | 5.8%(+0.417)#15,307 |
| 88. | 82644 | 6.2% | 6.7%(-0.538)#88 | 5.8%(+0.362)#15,489 |
| 89. | 82620 | 6.1% | 6.7%(-0.635)#89 | 5.8%(+0.266)#15,796 |
| 90. | 82007 | 6.0% | 6.7%(-0.698)#90 | 5.8%(+0.203)#16,013 |
| 91. | 82009 | 5.9% | 6.7%(-0.861)#91 | 5.8%(+0.039)#16,527 |
| 92. | 82070 | 5.6% | 6.7%(-1.15)#92 | 5.8%(-0.255)#17,552 |
| 93. | 82244 | 5.4% | 6.7%(-1.27)#93 | 5.8%(-0.368)#17,958 |
| 94. | 82601 | 5.4% | 6.7%(-1.28)#94 | 5.8%(-0.383)#18,016 |
| 95. | 82716 | 5.3% | 6.7%(-1.39)#95 | 5.8%(-0.491)#18,423 |
| 96. | 82837 | 5.3% | 6.7%(-1.45)#96 | 5.8%(-0.552)#18,664 |
| 97. | 82636 | 5.2% | 6.7%(-1.51)#97 | 5.8%(-0.614)#18,909 |
| 98. | 82412 | 5.0% | 6.7%(-1.67)#98 | 5.8%(-0.774)#19,512 |
| 99. | 82930 | 5.0% | 6.7%(-1.71)#99 | 5.8%(-0.807)#19,636 |
| 100. | 82939 | 5.0% | 6.7%(-1.72)#100 | 5.8%(-0.816)#19,668 |
1
2Common Questions
What are the Top 10 Zip Codes with the Highest Percentage of Self-Employed / Not Incorporated in Wyoming?
Top 10 Zip Codes with the Highest Percentage of Self-Employed / Not Incorporated in Wyoming are:
What zip code has the Highest Percentage of Self-Employed / Not Incorporated in Wyoming?
82833 has the Highest Percentage of Self-Employed / Not Incorporated in Wyoming with 100.0%.
What is the Percentage of Self-Employed / Not Incorporated in the State of Wyoming?
Percentage of Self-Employed / Not Incorporated in Wyoming is 6.7%.
What is the Percentage of Self-Employed / Not Incorporated in the United States?
Percentage of Self-Employed / Not Incorporated in the United States is 5.8%.