Zip Codes with the Highest Percentage of Self-Employed / Not Incorporated in Oklahoma
RELATED REPORTS & OPTIONS
Self-Employed / Not Incorporated
Oklahoma
Compare Zip Codes
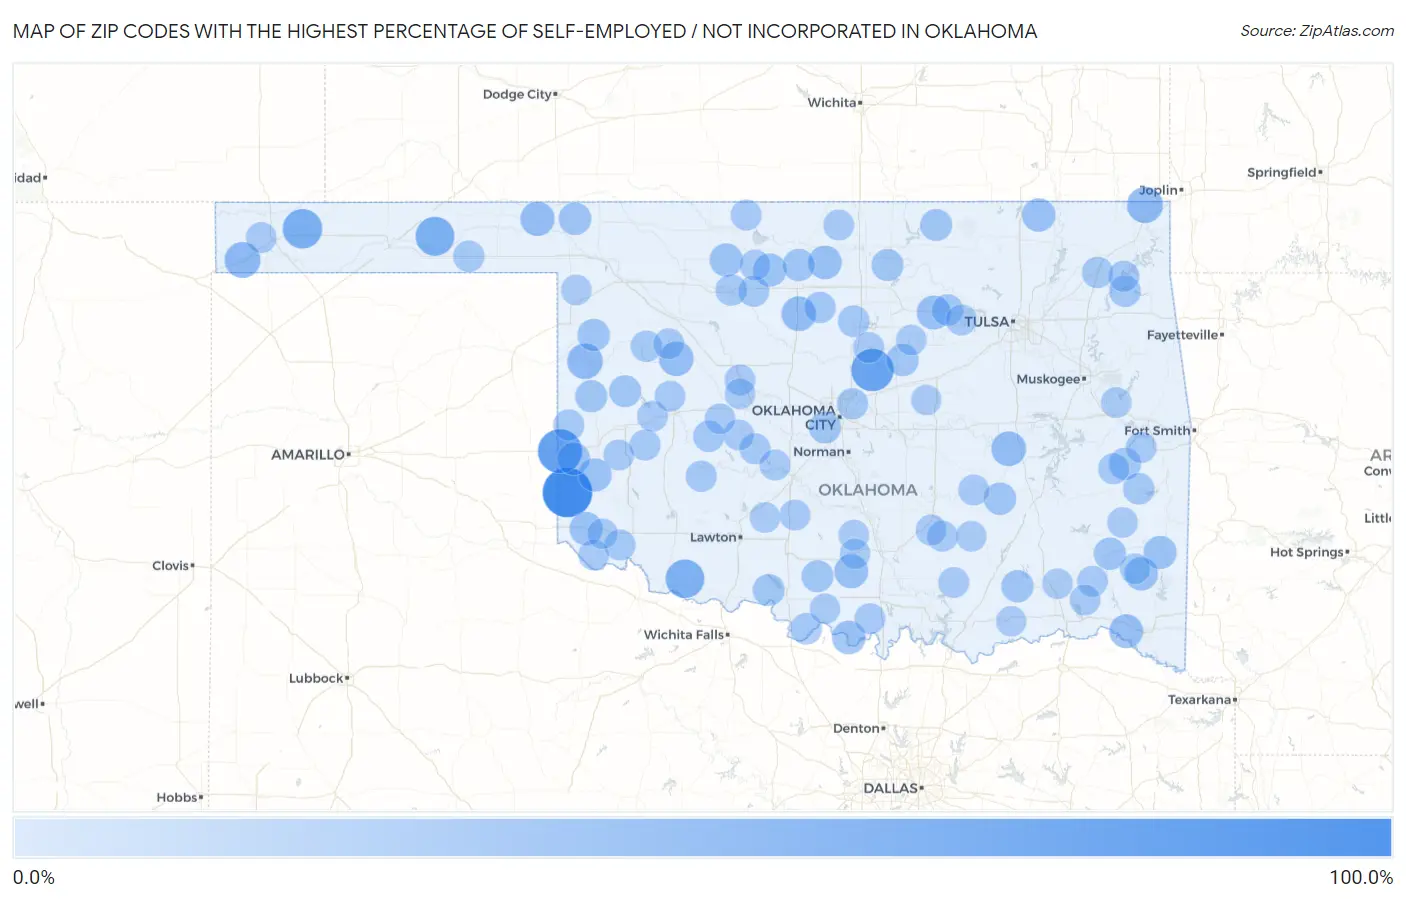
Map of Zip Codes with the Highest Percentage of Self-Employed / Not Incorporated in Oklahoma
0.0%
100.0%
Zip Codes with the Highest Percentage of Self-Employed / Not Incorporated in Oklahoma
| Zip Code | % Self-Employed / Not Incorporated | vs State | vs National | |
| 1. | 73571 | 100.0% | 6.5%(+93.5)#1 | 5.8%(+94.2)#24 |
| 2. | 73668 | 75.0% | 6.5%(+68.5)#2 | 5.8%(+69.2)#86 |
| 3. | 73058 | 66.7% | 6.5%(+60.1)#3 | 5.8%(+60.9)#107 |
| 4. | 73947 | 53.4% | 6.5%(+46.9)#4 | 5.8%(+47.6)#181 |
| 5. | 73901 | 50.6% | 6.5%(+44.0)#5 | 5.8%(+44.7)#213 |
| 6. | 73551 | 50.0% | 6.5%(+43.5)#6 | 5.8%(+44.2)#224 |
| 7. | 74360 | 37.5% | 6.5%(+31.0)#7 | 5.8%(+31.7)#477 |
| 8. | 73937 | 37.4% | 6.5%(+30.9)#8 | 5.8%(+31.6)#479 |
| 9. | 73638 | 36.2% | 6.5%(+29.7)#9 | 5.8%(+30.4)#521 |
| 10. | 74839 | 32.1% | 6.5%(+25.5)#10 | 5.8%(+26.3)#669 |
| 11. | 73720 | 32.0% | 6.5%(+25.5)#11 | 5.8%(+26.2)#673 |
| 12. | 73659 | 31.1% | 6.5%(+24.6)#12 | 5.8%(+25.3)#714 |
| 13. | 73844 | 29.7% | 6.5%(+23.2)#13 | 5.8%(+23.9)#789 |
| 14. | 74045 | 29.2% | 6.5%(+22.6)#14 | 5.8%(+23.4)#819 |
| 15. | 73437 | 28.6% | 6.5%(+22.0)#15 | 5.8%(+22.8)#861 |
| 16. | 74736 | 28.3% | 6.5%(+21.8)#16 | 5.8%(+22.5)#873 |
| 17. | 74640 | 27.5% | 6.5%(+21.0)#17 | 5.8%(+21.7)#923 |
| 18. | 73441 | 27.3% | 6.5%(+20.7)#18 | 5.8%(+21.5)#944 |
| 19. | 74724 | 26.7% | 6.5%(+20.1)#19 | 5.8%(+20.9)#992 |
| 20. | 74083 | 26.4% | 6.5%(+19.9)#20 | 5.8%(+20.6)#1,010 |
| 21. | 74957 | 25.8% | 6.5%(+19.3)#21 | 5.8%(+20.0)#1,061 |
| 22. | 73544 | 25.8% | 6.5%(+19.2)#22 | 5.8%(+20.0)#1,071 |
| 23. | 73726 | 25.7% | 6.5%(+19.1)#23 | 5.8%(+19.8)#1,083 |
| 24. | 73673 | 25.4% | 6.5%(+18.9)#24 | 5.8%(+19.6)#1,114 |
| 25. | 73739 | 25.2% | 6.5%(+18.7)#25 | 5.8%(+19.4)#1,126 |
| 26. | 73645 | 23.3% | 6.5%(+16.7)#26 | 5.8%(+17.4)#1,327 |
| 27. | 73855 | 22.8% | 6.5%(+16.3)#27 | 5.8%(+17.0)#1,375 |
| 28. | 74570 | 22.4% | 6.5%(+15.8)#28 | 5.8%(+16.6)#1,428 |
| 29. | 74875 | 21.9% | 6.5%(+15.4)#29 | 5.8%(+16.1)#1,493 |
| 30. | 74558 | 21.8% | 6.5%(+15.2)#30 | 5.8%(+16.0)#1,514 |
| 31. | 73832 | 21.7% | 6.5%(+15.2)#31 | 5.8%(+15.9)#1,531 |
| 32. | 74555 | 21.3% | 6.5%(+14.8)#32 | 5.8%(+15.5)#1,588 |
| 33. | 73753 | 21.1% | 6.5%(+14.6)#33 | 5.8%(+15.3)#1,625 |
| 34. | 74944 | 20.9% | 6.5%(+14.4)#34 | 5.8%(+15.1)#1,648 |
| 35. | 73628 | 20.9% | 6.5%(+14.4)#35 | 5.8%(+15.1)#1,657 |
| 36. | 74652 | 20.2% | 6.5%(+13.7)#36 | 5.8%(+14.4)#1,774 |
| 37. | 74644 | 19.9% | 6.5%(+13.4)#37 | 5.8%(+14.1)#1,849 |
| 38. | 73548 | 19.8% | 6.5%(+13.3)#38 | 5.8%(+14.0)#1,856 |
| 39. | 73097 | 19.8% | 6.5%(+13.3)#39 | 5.8%(+14.0)#1,865 |
| 40. | 73442 | 19.8% | 6.5%(+13.3)#40 | 5.8%(+14.0)#1,866 |
| 41. | 73650 | 19.6% | 6.5%(+13.1)#41 | 5.8%(+13.8)#1,896 |
| 42. | 73073 | 18.5% | 6.5%(+12.0)#42 | 5.8%(+12.7)#2,163 |
| 43. | 74366 | 18.3% | 6.5%(+11.8)#43 | 5.8%(+12.5)#2,214 |
| 44. | 74034 | 17.9% | 6.5%(+11.3)#44 | 5.8%(+12.0)#2,355 |
| 45. | 73569 | 17.7% | 6.5%(+11.2)#45 | 5.8%(+11.9)#2,396 |
| 46. | 73021 | 17.7% | 6.5%(+11.2)#46 | 5.8%(+11.9)#2,399 |
| 47. | 73733 | 17.6% | 6.5%(+11.1)#47 | 5.8%(+11.8)#2,412 |
| 48. | 74935 | 17.5% | 6.5%(+11.0)#48 | 5.8%(+11.7)#2,465 |
| 49. | 73931 | 17.3% | 6.5%(+10.8)#49 | 5.8%(+11.5)#2,539 |
| 50. | 73835 | 17.2% | 6.5%(+10.7)#50 | 5.8%(+11.4)#2,571 |
| 51. | 73729 | 17.0% | 6.5%(+10.5)#51 | 5.8%(+11.2)#2,619 |
| 52. | 73151 | 16.8% | 6.5%(+10.3)#52 | 5.8%(+11.0)#2,678 |
| 53. | 74332 | 16.7% | 6.5%(+10.2)#53 | 5.8%(+10.9)#2,726 |
| 54. | 73062 | 16.5% | 6.5%(+9.94)#54 | 5.8%(+10.7)#2,815 |
| 55. | 73666 | 16.4% | 6.5%(+9.89)#55 | 5.8%(+10.6)#2,837 |
| 56. | 74943 | 16.3% | 6.5%(+9.75)#56 | 5.8%(+10.5)#2,873 |
| 57. | 73560 | 16.1% | 6.5%(+9.53)#57 | 5.8%(+10.2)#2,946 |
| 58. | 73641 | 16.0% | 6.5%(+9.52)#58 | 5.8%(+10.2)#2,956 |
| 59. | 74340 | 16.0% | 6.5%(+9.47)#59 | 5.8%(+10.2)#2,972 |
| 60. | 73042 | 16.0% | 6.5%(+9.45)#60 | 5.8%(+10.2)#2,980 |
| 61. | 73768 | 15.9% | 6.5%(+9.35)#61 | 5.8%(+10.1)#3,032 |
| 62. | 73722 | 15.6% | 6.5%(+9.12)#62 | 5.8%(+9.83)#3,142 |
| 63. | 73092 | 15.5% | 6.5%(+8.97)#63 | 5.8%(+9.68)#3,199 |
| 64. | 73082 | 15.4% | 6.5%(+8.91)#64 | 5.8%(+9.62)#3,218 |
| 65. | 73027 | 15.4% | 6.5%(+8.89)#65 | 5.8%(+9.60)#3,225 |
| 66. | 74842 | 15.4% | 6.5%(+8.86)#66 | 5.8%(+9.57)#3,239 |
| 67. | 74843 | 15.3% | 6.5%(+8.80)#67 | 5.8%(+9.51)#3,269 |
| 68. | 74941 | 15.2% | 6.5%(+8.71)#68 | 5.8%(+9.43)#3,311 |
| 69. | 73537 | 15.2% | 6.5%(+8.67)#69 | 5.8%(+9.38)#3,325 |
| 70. | 74827 | 15.2% | 6.5%(+8.63)#70 | 5.8%(+9.34)#3,348 |
| 71. | 73647 | 15.1% | 6.5%(+8.58)#71 | 5.8%(+9.30)#3,363 |
| 72. | 74081 | 15.1% | 6.5%(+8.55)#72 | 5.8%(+9.26)#3,379 |
| 73. | 73453 | 15.1% | 6.5%(+8.55)#73 | 5.8%(+9.26)#3,385 |
| 74. | 73450 | 15.1% | 6.5%(+8.53)#74 | 5.8%(+9.24)#3,392 |
| 75. | 73933 | 15.0% | 6.5%(+8.47)#75 | 5.8%(+9.18)#3,429 |
| 76. | 73627 | 15.0% | 6.5%(+8.44)#76 | 5.8%(+9.15)#3,435 |
| 77. | 73667 | 14.9% | 6.5%(+8.42)#77 | 5.8%(+9.13)#3,445 |
| 78. | 73043 | 14.9% | 6.5%(+8.40)#78 | 5.8%(+9.11)#3,456 |
| 79. | 74562 | 14.8% | 6.5%(+8.32)#79 | 5.8%(+9.03)#3,499 |
| 80. | 73053 | 14.8% | 6.5%(+8.27)#80 | 5.8%(+8.98)#3,517 |
| 81. | 74636 | 14.8% | 6.5%(+8.25)#81 | 5.8%(+8.96)#3,529 |
| 82. | 73741 | 14.6% | 6.5%(+8.11)#82 | 5.8%(+8.82)#3,596 |
| 83. | 73620 | 14.6% | 6.5%(+8.04)#83 | 5.8%(+8.75)#3,620 |
| 84. | 74760 | 14.5% | 6.5%(+8.02)#84 | 5.8%(+8.73)#3,630 |
| 85. | 74534 | 14.3% | 6.5%(+7.76)#85 | 5.8%(+8.47)#3,751 |
| 86. | 73048 | 14.1% | 6.5%(+7.59)#86 | 5.8%(+8.30)#3,844 |
| 87. | 73040 | 14.1% | 6.5%(+7.58)#87 | 5.8%(+8.29)#3,852 |
| 88. | 73567 | 14.0% | 6.5%(+7.49)#88 | 5.8%(+8.20)#3,890 |
| 89. | 74435 | 13.9% | 6.5%(+7.39)#89 | 5.8%(+8.10)#3,945 |
| 90. | 74722 | 13.9% | 6.5%(+7.39)#90 | 5.8%(+8.10)#3,948 |
| 91. | 74523 | 13.8% | 6.5%(+7.31)#91 | 5.8%(+8.02)#3,995 |
| 92. | 74062 | 13.8% | 6.5%(+7.31)#92 | 5.8%(+8.02)#3,997 |
| 93. | 74571 | 13.8% | 6.5%(+7.26)#93 | 5.8%(+7.97)#4,024 |
| 94. | 73843 | 13.8% | 6.5%(+7.23)#94 | 5.8%(+7.94)#4,038 |
| 95. | 73433 | 13.7% | 6.5%(+7.12)#95 | 5.8%(+7.84)#4,097 |
| 96. | 73532 | 13.5% | 6.5%(+6.98)#96 | 5.8%(+7.69)#4,189 |
| 97. | 74869 | 13.3% | 6.5%(+6.78)#97 | 5.8%(+7.49)#4,310 |
| 98. | 73456 | 13.3% | 6.5%(+6.78)#98 | 5.8%(+7.49)#4,318 |
| 99. | 73444 | 13.2% | 6.5%(+6.71)#99 | 5.8%(+7.42)#4,365 |
| 100. | 74723 | 13.2% | 6.5%(+6.67)#100 | 5.8%(+7.38)#4,389 |
Common Questions
What are the Top 10 Zip Codes with the Highest Percentage of Self-Employed / Not Incorporated in Oklahoma?
Top 10 Zip Codes with the Highest Percentage of Self-Employed / Not Incorporated in Oklahoma are:
What zip code has the Highest Percentage of Self-Employed / Not Incorporated in Oklahoma?
73571 has the Highest Percentage of Self-Employed / Not Incorporated in Oklahoma with 100.0%.
What is the Percentage of Self-Employed / Not Incorporated in the State of Oklahoma?
Percentage of Self-Employed / Not Incorporated in Oklahoma is 6.5%.
What is the Percentage of Self-Employed / Not Incorporated in the United States?
Percentage of Self-Employed / Not Incorporated in the United States is 5.8%.