Zip Codes with the Highest Percentage of Self-Employed / Not Incorporated in Ohio
RELATED REPORTS & OPTIONS
Self-Employed / Not Incorporated
Ohio
Compare Zip Codes
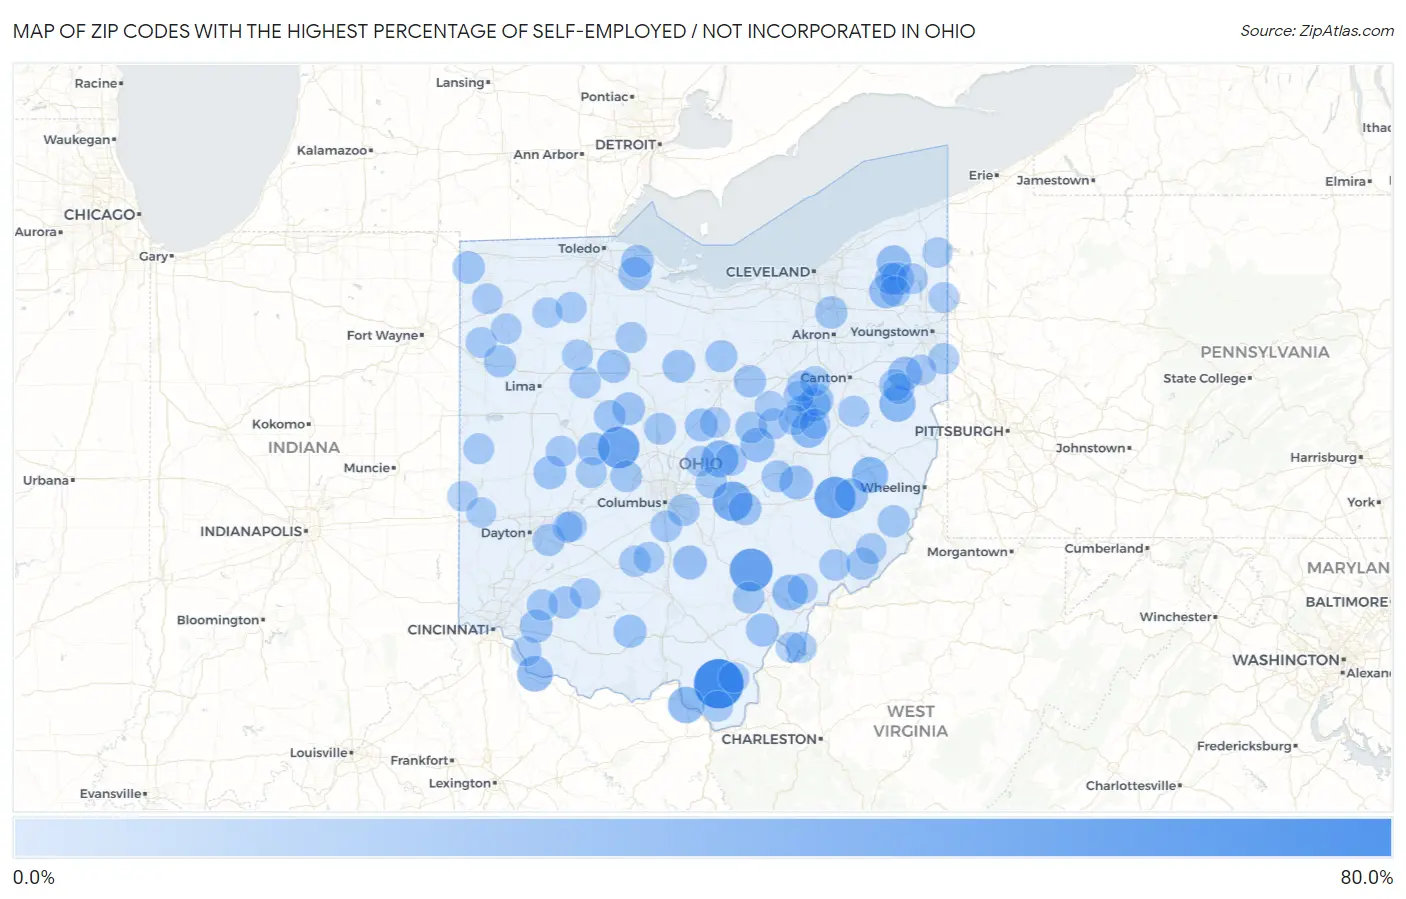
Map of Zip Codes with the Highest Percentage of Self-Employed / Not Incorporated in Ohio
0.0%
80.0%
Zip Codes with the Highest Percentage of Self-Employed / Not Incorporated in Ohio
| Zip Code | % Self-Employed / Not Incorporated | vs State | vs National | |
| 1. | 45688 | 60.9% | 4.8%(+56.0)#1 | 5.8%(+55.1)#136 |
| 2. | 43111 | 43.5% | 4.8%(+38.7)#2 | 5.8%(+37.7)#327 |
| 3. | 43007 | 40.0% | 4.8%(+35.2)#3 | 5.8%(+34.2)#407 |
| 4. | 43750 | 39.1% | 4.8%(+34.3)#4 | 5.8%(+33.3)#428 |
| 5. | 43030 | 34.9% | 4.8%(+30.0)#5 | 5.8%(+29.0)#560 |
| 6. | 43027 | 27.6% | 4.8%(+22.8)#6 | 5.8%(+21.8)#914 |
| 7. | 45636 | 26.7% | 4.8%(+21.9)#7 | 5.8%(+20.9)#983 |
| 8. | 43983 | 25.8% | 4.8%(+21.0)#8 | 5.8%(+20.0)#1,060 |
| 9. | 44651 | 25.8% | 4.8%(+21.0)#9 | 5.8%(+20.0)#1,067 |
| 10. | 45112 | 25.0% | 4.8%(+20.2)#10 | 5.8%(+19.2)#1,156 |
| 11. | 45778 | 24.7% | 4.8%(+19.9)#11 | 5.8%(+18.9)#1,181 |
| 12. | 43804 | 24.0% | 4.8%(+19.2)#12 | 5.8%(+18.2)#1,251 |
| 13. | 44099 | 21.4% | 4.8%(+16.5)#13 | 5.8%(+15.6)#1,581 |
| 14. | 44080 | 21.2% | 4.8%(+16.4)#14 | 5.8%(+15.4)#1,604 |
| 15. | 43843 | 20.9% | 4.8%(+16.1)#15 | 5.8%(+15.1)#1,651 |
| 16. | 44493 | 20.6% | 4.8%(+15.8)#16 | 5.8%(+14.8)#1,704 |
| 17. | 43156 | 20.2% | 4.8%(+15.4)#17 | 5.8%(+14.4)#1,768 |
| 18. | 43802 | 20.1% | 4.8%(+15.3)#18 | 5.8%(+14.3)#1,786 |
| 19. | 44690 | 19.2% | 4.8%(+14.4)#19 | 5.8%(+13.4)#1,966 |
| 20. | 43778 | 19.0% | 4.8%(+14.2)#20 | 5.8%(+13.2)#2,029 |
| 21. | 43416 | 19.0% | 4.8%(+14.2)#21 | 5.8%(+13.2)#2,041 |
| 22. | 45317 | 18.6% | 4.8%(+13.7)#22 | 5.8%(+12.8)#2,153 |
| 23. | 45775 | 18.5% | 4.8%(+13.6)#23 | 5.8%(+12.6)#2,182 |
| 24. | 45646 | 18.4% | 4.8%(+13.6)#24 | 5.8%(+12.6)#2,203 |
| 25. | 43359 | 18.4% | 4.8%(+13.5)#25 | 5.8%(+12.6)#2,208 |
| 26. | 45160 | 18.3% | 4.8%(+13.5)#26 | 5.8%(+12.5)#2,221 |
| 27. | 44439 | 18.3% | 4.8%(+13.5)#27 | 5.8%(+12.5)#2,241 |
| 28. | 44610 | 18.2% | 4.8%(+13.4)#28 | 5.8%(+12.4)#2,265 |
| 29. | 43739 | 17.9% | 4.8%(+13.1)#29 | 5.8%(+12.1)#2,326 |
| 30. | 43317 | 17.9% | 4.8%(+13.1)#30 | 5.8%(+12.1)#2,336 |
| 31. | 43341 | 17.6% | 4.8%(+12.8)#31 | 5.8%(+11.8)#2,409 |
| 32. | 44881 | 17.6% | 4.8%(+12.8)#32 | 5.8%(+11.8)#2,415 |
| 33. | 43432 | 17.6% | 4.8%(+12.8)#33 | 5.8%(+11.8)#2,433 |
| 34. | 44062 | 17.1% | 4.8%(+12.3)#34 | 5.8%(+11.3)#2,595 |
| 35. | 43360 | 16.9% | 4.8%(+12.1)#35 | 5.8%(+11.1)#2,661 |
| 36. | 44264 | 16.8% | 4.8%(+12.0)#36 | 5.8%(+11.0)#2,696 |
| 37. | 45148 | 16.7% | 4.8%(+11.9)#37 | 5.8%(+10.9)#2,715 |
| 38. | 43505 | 16.7% | 4.8%(+11.8)#38 | 5.8%(+10.9)#2,755 |
| 39. | 45863 | 16.5% | 4.8%(+11.7)#39 | 5.8%(+10.7)#2,799 |
| 40. | 44838 | 16.5% | 4.8%(+11.7)#40 | 5.8%(+10.7)#2,805 |
| 41. | 44689 | 16.3% | 4.8%(+11.5)#41 | 5.8%(+10.5)#2,871 |
| 42. | 45789 | 16.2% | 4.8%(+11.4)#42 | 5.8%(+10.4)#2,911 |
| 43. | 43340 | 16.1% | 4.8%(+11.3)#43 | 5.8%(+10.3)#2,934 |
| 44. | 44878 | 15.9% | 4.8%(+11.1)#44 | 5.8%(+10.1)#3,001 |
| 45. | 43109 | 15.8% | 4.8%(+11.0)#45 | 5.8%(+9.97)#3,083 |
| 46. | 43716 | 15.7% | 4.8%(+10.9)#46 | 5.8%(+9.89)#3,119 |
| 47. | 45301 | 15.6% | 4.8%(+10.8)#47 | 5.8%(+9.79)#3,158 |
| 48. | 44625 | 15.3% | 4.8%(+10.5)#48 | 5.8%(+9.50)#3,273 |
| 49. | 43356 | 15.3% | 4.8%(+10.5)#49 | 5.8%(+9.49)#3,279 |
| 50. | 43842 | 15.2% | 4.8%(+10.4)#50 | 5.8%(+9.37)#3,335 |
| 51. | 43014 | 15.1% | 4.8%(+10.3)#51 | 5.8%(+9.29)#3,367 |
| 52. | 45766 | 15.1% | 4.8%(+10.2)#52 | 5.8%(+9.24)#3,394 |
| 53. | 43077 | 15.0% | 4.8%(+10.2)#53 | 5.8%(+9.23)#3,399 |
| 54. | 45835 | 14.8% | 4.8%(+9.99)#54 | 5.8%(+9.00)#3,512 |
| 55. | 43137 | 14.8% | 4.8%(+9.93)#55 | 5.8%(+8.94)#3,537 |
| 56. | 43001 | 14.4% | 4.8%(+9.61)#56 | 5.8%(+8.62)#3,686 |
| 57. | 43080 | 14.3% | 4.8%(+9.49)#57 | 5.8%(+8.50)#3,725 |
| 58. | 43145 | 14.3% | 4.8%(+9.44)#58 | 5.8%(+8.45)#3,766 |
| 59. | 45744 | 14.2% | 4.8%(+9.39)#59 | 5.8%(+8.40)#3,794 |
| 60. | 45162 | 14.2% | 4.8%(+9.33)#60 | 5.8%(+8.34)#3,821 |
| 61. | 44427 | 13.8% | 4.8%(+8.97)#61 | 5.8%(+7.98)#4,008 |
| 62. | 44454 | 13.8% | 4.8%(+8.93)#62 | 5.8%(+7.94)#4,039 |
| 63. | 44853 | 13.6% | 4.8%(+8.73)#63 | 5.8%(+7.74)#4,151 |
| 64. | 43164 | 13.4% | 4.8%(+8.59)#64 | 5.8%(+7.60)#4,241 |
| 65. | 44656 | 13.3% | 4.8%(+8.52)#65 | 5.8%(+7.53)#4,277 |
| 66. | 43511 | 13.3% | 4.8%(+8.48)#66 | 5.8%(+7.49)#4,311 |
| 67. | 45881 | 13.3% | 4.8%(+8.48)#67 | 5.8%(+7.49)#4,313 |
| 68. | 44606 | 13.3% | 4.8%(+8.47)#68 | 5.8%(+7.48)#4,321 |
| 69. | 45851 | 13.2% | 4.8%(+8.34)#69 | 5.8%(+7.35)#4,414 |
| 70. | 45316 | 13.1% | 4.8%(+8.31)#70 | 5.8%(+7.32)#4,439 |
| 71. | 43318 | 13.0% | 4.8%(+8.22)#71 | 5.8%(+7.23)#4,485 |
| 72. | 43009 | 13.0% | 4.8%(+8.22)#72 | 5.8%(+7.22)#4,503 |
| 73. | 44627 | 13.0% | 4.8%(+8.16)#73 | 5.8%(+7.16)#4,541 |
| 74. | 45159 | 12.9% | 4.8%(+8.08)#74 | 5.8%(+7.09)#4,579 |
| 75. | 45645 | 12.9% | 4.8%(+8.06)#75 | 5.8%(+7.07)#4,593 |
| 76. | 45770 | 12.9% | 4.8%(+8.06)#76 | 5.8%(+7.07)#4,595 |
| 77. | 45348 | 12.9% | 4.8%(+8.06)#77 | 5.8%(+7.06)#4,599 |
| 78. | 45658 | 12.9% | 4.8%(+8.04)#78 | 5.8%(+7.05)#4,610 |
| 79. | 45873 | 12.8% | 4.8%(+7.94)#79 | 5.8%(+6.95)#4,677 |
| 80. | 44637 | 12.7% | 4.8%(+7.92)#80 | 5.8%(+6.93)#4,690 |
| 81. | 43013 | 12.7% | 4.8%(+7.92)#81 | 5.8%(+6.93)#4,699 |
| 82. | 44450 | 12.6% | 4.8%(+7.77)#82 | 5.8%(+6.78)#4,808 |
| 83. | 44404 | 12.6% | 4.8%(+7.73)#83 | 5.8%(+6.74)#4,851 |
| 84. | 45734 | 12.5% | 4.8%(+7.68)#84 | 5.8%(+6.68)#4,887 |
| 85. | 43556 | 12.4% | 4.8%(+7.61)#85 | 5.8%(+6.62)#4,944 |
| 86. | 44491 | 12.3% | 4.8%(+7.45)#86 | 5.8%(+6.46)#5,063 |
| 87. | 43019 | 12.2% | 4.8%(+7.40)#87 | 5.8%(+6.40)#5,101 |
| 88. | 44431 | 12.2% | 4.8%(+7.34)#88 | 5.8%(+6.35)#5,148 |
| 89. | 45771 | 12.1% | 4.8%(+7.31)#89 | 5.8%(+6.32)#5,178 |
| 90. | 44611 | 12.0% | 4.8%(+7.13)#90 | 5.8%(+6.14)#5,321 |
| 91. | 45387 | 11.9% | 4.8%(+7.08)#91 | 5.8%(+6.09)#5,357 |
| 92. | 45332 | 11.8% | 4.8%(+7.01)#92 | 5.8%(+6.02)#5,412 |
| 93. | 45724 | 11.8% | 4.8%(+6.99)#93 | 5.8%(+5.99)#5,442 |
| 94. | 44654 | 11.8% | 4.8%(+6.97)#94 | 5.8%(+5.97)#5,461 |
| 95. | 43524 | 11.7% | 4.8%(+6.91)#95 | 5.8%(+5.92)#5,506 |
| 96. | 44681 | 11.7% | 4.8%(+6.89)#96 | 5.8%(+5.90)#5,533 |
| 97. | 44003 | 11.6% | 4.8%(+6.80)#97 | 5.8%(+5.81)#5,603 |
| 98. | 45382 | 11.5% | 4.8%(+6.69)#98 | 5.8%(+5.70)#5,686 |
| 99. | 44618 | 11.5% | 4.8%(+6.66)#99 | 5.8%(+5.67)#5,723 |
| 100. | 45157 | 11.4% | 4.8%(+6.57)#100 | 5.8%(+5.58)#5,821 |
Common Questions
What are the Top 10 Zip Codes with the Highest Percentage of Self-Employed / Not Incorporated in Ohio?
Top 10 Zip Codes with the Highest Percentage of Self-Employed / Not Incorporated in Ohio are:
What zip code has the Highest Percentage of Self-Employed / Not Incorporated in Ohio?
45688 has the Highest Percentage of Self-Employed / Not Incorporated in Ohio with 60.9%.
What is the Percentage of Self-Employed / Not Incorporated in the State of Ohio?
Percentage of Self-Employed / Not Incorporated in Ohio is 4.8%.
What is the Percentage of Self-Employed / Not Incorporated in the United States?
Percentage of Self-Employed / Not Incorporated in the United States is 5.8%.