Zip Codes with the Highest Percentage of Self-Employed / Not Incorporated in Illinois
RELATED REPORTS & OPTIONS
Self-Employed / Not Incorporated
Illinois
Compare Zip Codes
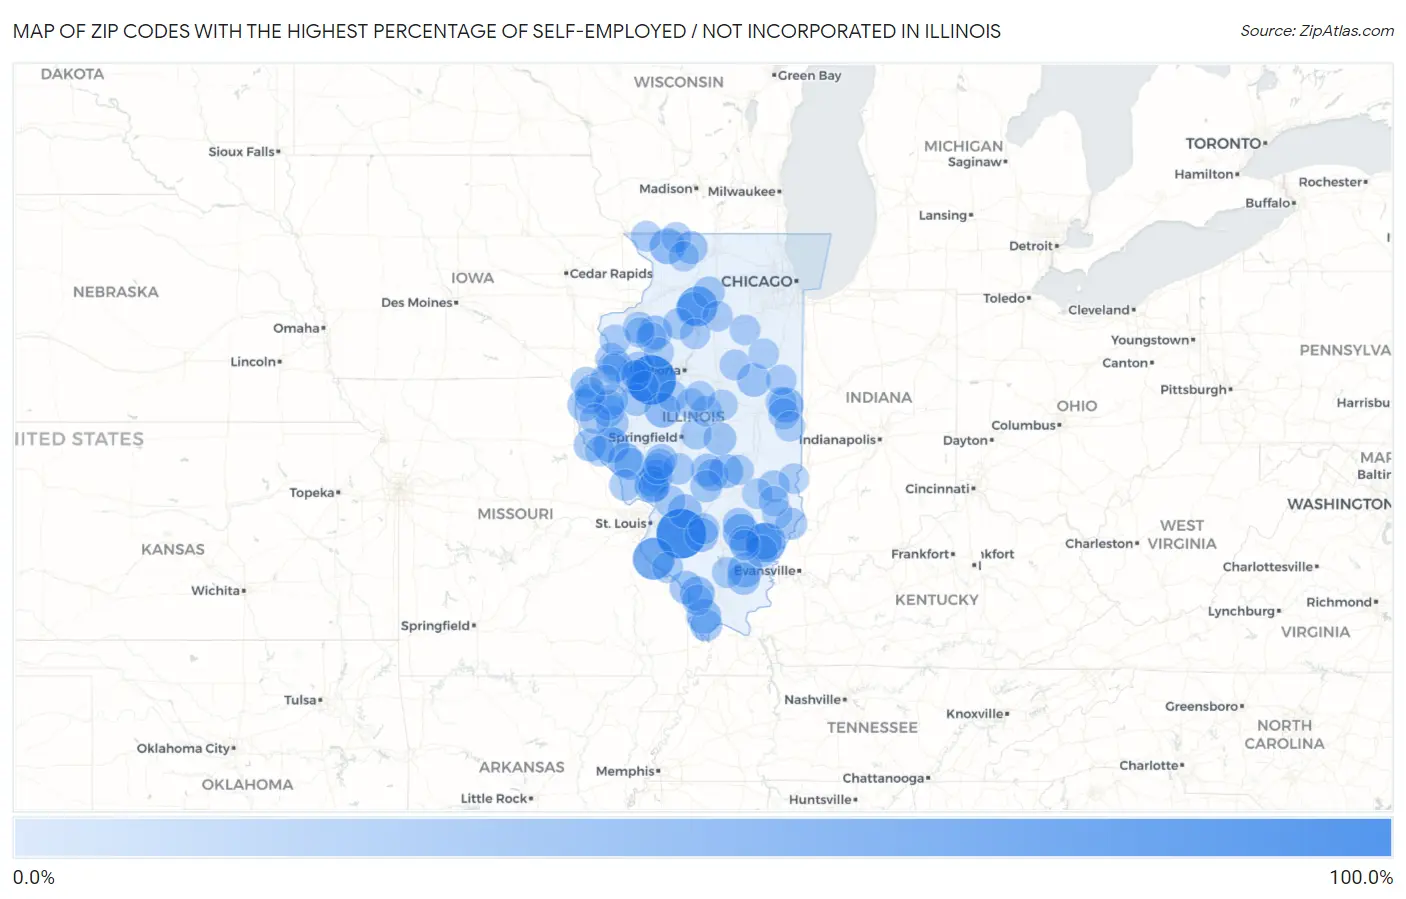
Map of Zip Codes with the Highest Percentage of Self-Employed / Not Incorporated in Illinois
0.0%
100.0%
Zip Codes with the Highest Percentage of Self-Employed / Not Incorporated in Illinois
| Zip Code | % Self-Employed / Not Incorporated | vs State | vs National | |
| 1. | 61433 | 100.0% | 4.5%(+95.5)#1 | 5.8%(+94.2)#35 |
| 2. | 62266 | 100.0% | 4.5%(+95.5)#2 | 5.8%(+94.2)#43 |
| 3. | 62279 | 64.7% | 4.5%(+60.2)#3 | 5.8%(+58.9)#117 |
| 4. | 61374 | 57.1% | 4.5%(+52.6)#4 | 5.8%(+51.3)#157 |
| 5. | 62833 | 53.1% | 4.5%(+48.6)#5 | 5.8%(+47.3)#186 |
| 6. | 62850 | 42.3% | 4.5%(+37.8)#6 | 5.8%(+36.5)#356 |
| 7. | 62843 | 42.1% | 4.5%(+37.6)#7 | 5.8%(+36.3)#360 |
| 8. | 62030 | 38.5% | 4.5%(+33.9)#8 | 5.8%(+32.6)#448 |
| 9. | 62357 | 37.7% | 4.5%(+33.1)#9 | 5.8%(+31.9)#466 |
| 10. | 61044 | 37.2% | 4.5%(+32.6)#10 | 5.8%(+31.4)#485 |
| 11. | 62655 | 36.0% | 4.5%(+31.4)#11 | 5.8%(+30.2)#531 |
| 12. | 61831 | 33.9% | 4.5%(+29.4)#12 | 5.8%(+28.1)#581 |
| 13. | 62961 | 33.3% | 4.5%(+28.8)#13 | 5.8%(+27.5)#615 |
| 14. | 62817 | 33.1% | 4.5%(+28.5)#14 | 5.8%(+27.3)#627 |
| 15. | 62361 | 32.9% | 4.5%(+28.3)#15 | 5.8%(+27.1)#634 |
| 16. | 62975 | 32.6% | 4.5%(+28.0)#16 | 5.8%(+26.7)#649 |
| 17. | 62438 | 30.3% | 4.5%(+25.8)#17 | 5.8%(+24.5)#751 |
| 18. | 62273 | 30.1% | 4.5%(+25.6)#18 | 5.8%(+24.3)#760 |
| 19. | 61419 | 29.5% | 4.5%(+25.0)#19 | 5.8%(+23.7)#800 |
| 20. | 62803 | 29.4% | 4.5%(+24.9)#20 | 5.8%(+23.6)#801 |
| 21. | 61773 | 28.6% | 4.5%(+24.0)#21 | 5.8%(+22.8)#851 |
| 22. | 61328 | 26.9% | 4.5%(+22.4)#22 | 5.8%(+21.1)#962 |
| 23. | 62950 | 26.9% | 4.5%(+22.3)#23 | 5.8%(+21.1)#968 |
| 24. | 61470 | 26.1% | 4.5%(+21.6)#24 | 5.8%(+20.3)#1,035 |
| 25. | 62630 | 25.5% | 4.5%(+21.0)#25 | 5.8%(+19.7)#1,097 |
| 26. | 62083 | 25.0% | 4.5%(+20.5)#26 | 5.8%(+19.2)#1,149 |
| 27. | 62532 | 25.0% | 4.5%(+20.5)#27 | 5.8%(+19.2)#1,152 |
| 28. | 61067 | 24.7% | 4.5%(+20.2)#28 | 5.8%(+18.9)#1,180 |
| 29. | 62343 | 24.3% | 4.5%(+19.8)#29 | 5.8%(+18.5)#1,232 |
| 30. | 62373 | 23.5% | 4.5%(+19.0)#30 | 5.8%(+17.7)#1,303 |
| 31. | 62553 | 23.4% | 4.5%(+18.9)#31 | 5.8%(+17.6)#1,314 |
| 32. | 62977 | 22.9% | 4.5%(+18.4)#32 | 5.8%(+17.1)#1,362 |
| 33. | 62375 | 22.4% | 4.5%(+17.9)#33 | 5.8%(+16.6)#1,427 |
| 34. | 62820 | 22.2% | 4.5%(+17.7)#34 | 5.8%(+16.4)#1,447 |
| 35. | 62667 | 22.1% | 4.5%(+17.5)#35 | 5.8%(+16.2)#1,469 |
| 36. | 62976 | 21.4% | 4.5%(+16.9)#36 | 5.8%(+15.6)#1,573 |
| 37. | 62899 | 21.0% | 4.5%(+16.5)#37 | 5.8%(+15.2)#1,628 |
| 38. | 62063 | 21.0% | 4.5%(+16.5)#38 | 5.8%(+15.2)#1,633 |
| 39. | 62050 | 21.0% | 4.5%(+16.5)#39 | 5.8%(+15.2)#1,638 |
| 40. | 62011 | 21.0% | 4.5%(+16.5)#40 | 5.8%(+15.2)#1,639 |
| 41. | 61378 | 21.0% | 4.5%(+16.4)#41 | 5.8%(+15.2)#1,641 |
| 42. | 62346 | 20.8% | 4.5%(+16.3)#42 | 5.8%(+15.0)#1,670 |
| 43. | 62460 | 20.6% | 4.5%(+16.0)#43 | 5.8%(+14.7)#1,718 |
| 44. | 62481 | 20.1% | 4.5%(+15.6)#44 | 5.8%(+14.3)#1,781 |
| 45. | 61484 | 20.0% | 4.5%(+15.5)#45 | 5.8%(+14.2)#1,803 |
| 46. | 62047 | 19.3% | 4.5%(+14.7)#46 | 5.8%(+13.4)#1,957 |
| 47. | 62367 | 19.1% | 4.5%(+14.5)#47 | 5.8%(+13.3)#2,011 |
| 48. | 61314 | 19.1% | 4.5%(+14.5)#48 | 5.8%(+13.3)#2,015 |
| 49. | 61418 | 18.9% | 4.5%(+14.3)#49 | 5.8%(+13.0)#2,073 |
| 50. | 61474 | 18.6% | 4.5%(+14.1)#50 | 5.8%(+12.8)#2,135 |
| 51. | 62572 | 18.5% | 4.5%(+14.0)#51 | 5.8%(+12.7)#2,159 |
| 52. | 62097 | 18.5% | 4.5%(+14.0)#52 | 5.8%(+12.7)#2,167 |
| 53. | 62079 | 18.3% | 4.5%(+13.8)#53 | 5.8%(+12.5)#2,215 |
| 54. | 62515 | 18.1% | 4.5%(+13.6)#54 | 5.8%(+12.3)#2,276 |
| 55. | 61812 | 18.0% | 4.5%(+13.4)#55 | 5.8%(+12.2)#2,315 |
| 56. | 61468 | 18.0% | 4.5%(+13.4)#56 | 5.8%(+12.2)#2,316 |
| 57. | 62649 | 17.9% | 4.5%(+13.4)#57 | 5.8%(+12.1)#2,327 |
| 58. | 62354 | 17.8% | 4.5%(+13.3)#58 | 5.8%(+12.0)#2,376 |
| 59. | 61532 | 17.6% | 4.5%(+13.1)#59 | 5.8%(+11.8)#2,411 |
| 60. | 62241 | 17.4% | 4.5%(+12.9)#60 | 5.8%(+11.6)#2,487 |
| 61. | 62905 | 17.3% | 4.5%(+12.7)#61 | 5.8%(+11.5)#2,538 |
| 62. | 62313 | 17.3% | 4.5%(+12.7)#62 | 5.8%(+11.4)#2,546 |
| 63. | 62856 | 16.9% | 4.5%(+12.4)#63 | 5.8%(+11.1)#2,662 |
| 64. | 61857 | 16.9% | 4.5%(+12.3)#64 | 5.8%(+11.1)#2,663 |
| 65. | 62250 | 16.8% | 4.5%(+12.3)#65 | 5.8%(+11.0)#2,677 |
| 66. | 62512 | 16.7% | 4.5%(+12.2)#66 | 5.8%(+10.9)#2,712 |
| 67. | 62311 | 16.7% | 4.5%(+12.1)#67 | 5.8%(+10.9)#2,733 |
| 68. | 61478 | 16.7% | 4.5%(+12.1)#68 | 5.8%(+10.9)#2,736 |
| 69. | 62334 | 16.7% | 4.5%(+12.1)#69 | 5.8%(+10.9)#2,751 |
| 70. | 61476 | 16.4% | 4.5%(+11.8)#70 | 5.8%(+10.6)#2,843 |
| 71. | 61726 | 16.3% | 4.5%(+11.8)#71 | 5.8%(+10.5)#2,866 |
| 72. | 61414 | 16.1% | 4.5%(+11.5)#72 | 5.8%(+10.2)#2,949 |
| 73. | 61477 | 16.0% | 4.5%(+11.5)#73 | 5.8%(+10.2)#2,961 |
| 74. | 62886 | 15.9% | 4.5%(+11.4)#74 | 5.8%(+10.1)#3,016 |
| 75. | 60924 | 15.8% | 4.5%(+11.3)#75 | 5.8%(+10.0)#3,057 |
| 76. | 62325 | 15.7% | 4.5%(+11.2)#76 | 5.8%(+9.91)#3,104 |
| 77. | 61373 | 15.7% | 4.5%(+11.1)#77 | 5.8%(+9.86)#3,131 |
| 78. | 62895 | 15.5% | 4.5%(+11.0)#78 | 5.8%(+9.67)#3,205 |
| 79. | 61460 | 15.5% | 4.5%(+10.9)#79 | 5.8%(+9.66)#3,211 |
| 80. | 61777 | 15.4% | 4.5%(+10.9)#80 | 5.8%(+9.60)#3,226 |
| 81. | 61075 | 15.4% | 4.5%(+10.9)#81 | 5.8%(+9.60)#3,227 |
| 82. | 61050 | 15.3% | 4.5%(+10.8)#82 | 5.8%(+9.53)#3,261 |
| 83. | 61450 | 15.3% | 4.5%(+10.8)#83 | 5.8%(+9.51)#3,270 |
| 84. | 62643 | 15.3% | 4.5%(+10.8)#84 | 5.8%(+9.50)#3,272 |
| 85. | 61850 | 15.2% | 4.5%(+10.7)#85 | 5.8%(+9.37)#3,331 |
| 86. | 61415 | 15.2% | 4.5%(+10.6)#86 | 5.8%(+9.35)#3,340 |
| 87. | 61560 | 15.2% | 4.5%(+10.6)#87 | 5.8%(+9.34)#3,346 |
| 88. | 60479 | 15.1% | 4.5%(+10.6)#88 | 5.8%(+9.31)#3,359 |
| 89. | 62479 | 15.1% | 4.5%(+10.5)#89 | 5.8%(+9.25)#3,388 |
| 90. | 62674 | 15.0% | 4.5%(+10.4)#90 | 5.8%(+9.15)#3,438 |
| 91. | 60946 | 14.9% | 4.5%(+10.4)#91 | 5.8%(+9.08)#3,472 |
| 92. | 62421 | 14.6% | 4.5%(+10.1)#92 | 5.8%(+8.82)#3,597 |
| 93. | 62477 | 14.5% | 4.5%(+9.95)#93 | 5.8%(+8.67)#3,659 |
| 94. | 61721 | 14.5% | 4.5%(+9.92)#94 | 5.8%(+8.64)#3,672 |
| 95. | 61007 | 14.5% | 4.5%(+9.92)#95 | 5.8%(+8.64)#3,673 |
| 96. | 62356 | 14.4% | 4.5%(+9.88)#96 | 5.8%(+8.60)#3,694 |
| 97. | 61489 | 14.3% | 4.5%(+9.75)#97 | 5.8%(+8.47)#3,734 |
| 98. | 61413 | 14.2% | 4.5%(+9.69)#98 | 5.8%(+8.41)#3,789 |
| 99. | 62459 | 14.1% | 4.5%(+9.54)#99 | 5.8%(+8.26)#3,862 |
| 100. | 62465 | 14.0% | 4.5%(+9.44)#100 | 5.8%(+8.16)#3,911 |
Common Questions
What are the Top 10 Zip Codes with the Highest Percentage of Self-Employed / Not Incorporated in Illinois?
Top 10 Zip Codes with the Highest Percentage of Self-Employed / Not Incorporated in Illinois are:
What zip code has the Highest Percentage of Self-Employed / Not Incorporated in Illinois?
61433 has the Highest Percentage of Self-Employed / Not Incorporated in Illinois with 100.0%.
What is the Percentage of Self-Employed / Not Incorporated in the State of Illinois?
Percentage of Self-Employed / Not Incorporated in Illinois is 4.5%.
What is the Percentage of Self-Employed / Not Incorporated in the United States?
Percentage of Self-Employed / Not Incorporated in the United States is 5.8%.