Zip Codes with the Highest Percentage of Self-Employed / Not Incorporated in Puerto Rico
RELATED REPORTS & OPTIONS
Self-Employed / Not Incorporated
Puerto Rico
Compare Zip Codes
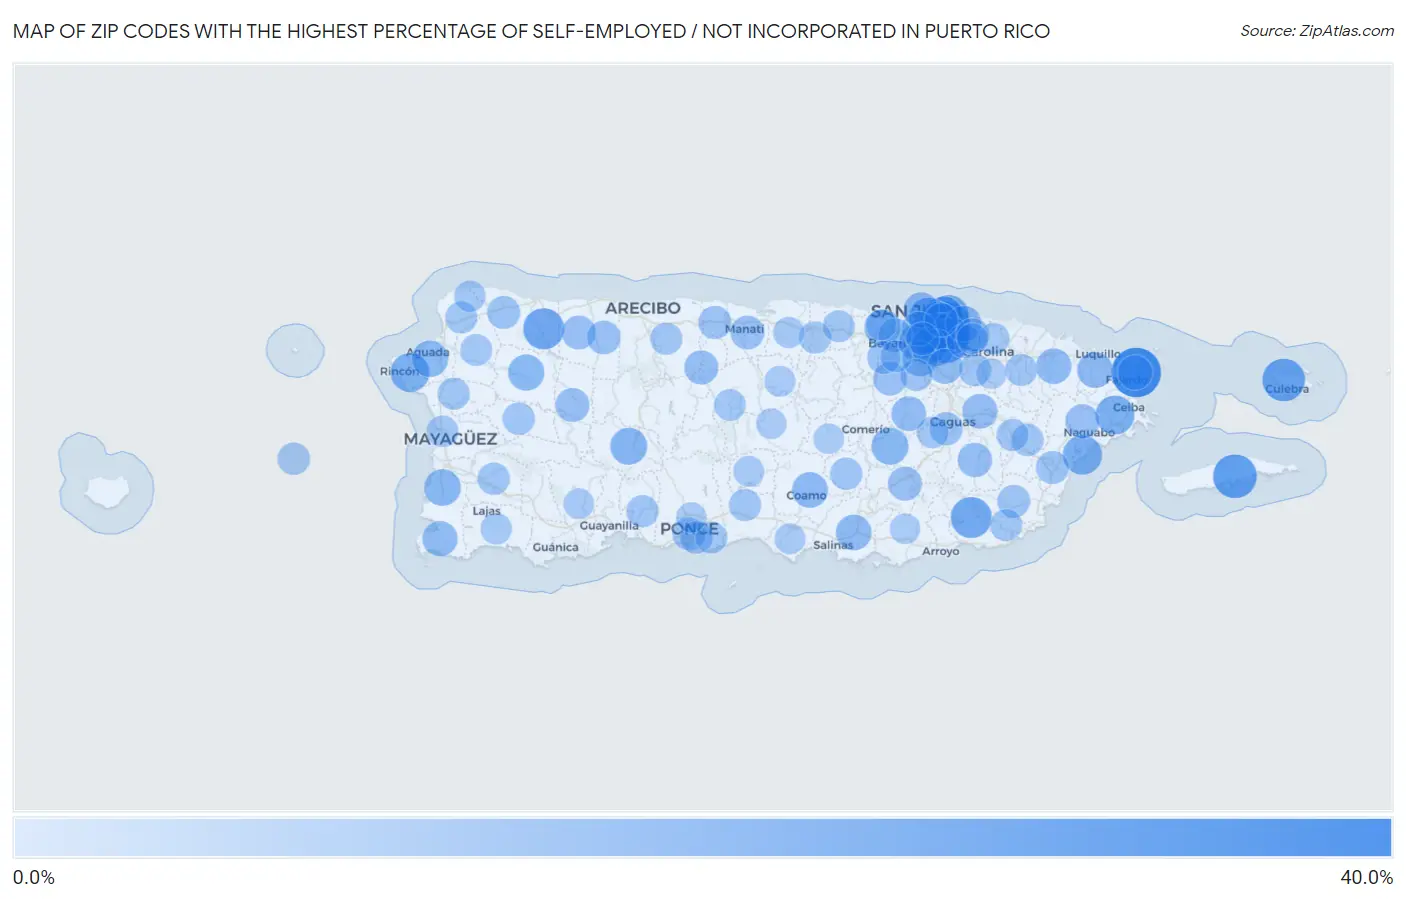
Map of Zip Codes with the Highest Percentage of Self-Employed / Not Incorporated in Puerto Rico
0.0%
40.0%
Zip Codes with the Highest Percentage of Self-Employed / Not Incorporated in Puerto Rico
| Zip Code | % Self-Employed / Not Incorporated | vs State | vs National | |
| 1. | 00740 | 33.6% | 10.9%(+22.6)#1 | 5.8%(+27.8)#594 |
| 2. | 00915 | 26.7% | 10.9%(+15.8)#2 | 5.8%(+20.9)#980 |
| 3. | 00765 | 25.4% | 10.9%(+14.5)#3 | 5.8%(+19.6)#1,111 |
| 4. | 00925 | 25.2% | 10.9%(+14.3)#4 | 5.8%(+19.4)#1,127 |
| 5. | 00775 | 24.0% | 10.9%(+13.1)#5 | 5.8%(+18.2)#1,247 |
| 6. | 00678 | 21.7% | 10.9%(+10.8)#6 | 5.8%(+15.9)#1,526 |
| 7. | 00723 | 21.7% | 10.9%(+10.7)#7 | 5.8%(+15.8)#1,534 |
| 8. | 00913 | 20.1% | 10.9%(+9.17)#8 | 5.8%(+14.3)#1,787 |
| 9. | 00911 | 19.9% | 10.9%(+8.95)#9 | 5.8%(+14.1)#1,850 |
| 10. | 00907 | 19.7% | 10.9%(+8.79)#10 | 5.8%(+13.9)#1,872 |
| 11. | 00741 | 19.3% | 10.9%(+8.35)#11 | 5.8%(+13.5)#1,950 |
| 12. | 00909 | 19.1% | 10.9%(+8.17)#12 | 5.8%(+13.3)#1,999 |
| 13. | 00917 | 19.0% | 10.9%(+8.06)#13 | 5.8%(+13.2)#2,033 |
| 14. | 00677 | 18.7% | 10.9%(+7.71)#14 | 5.8%(+12.8)#2,126 |
| 15. | 00735 | 18.6% | 10.9%(+7.68)#15 | 5.8%(+12.8)#2,137 |
| 16. | 00920 | 17.9% | 10.9%(+6.97)#16 | 5.8%(+12.1)#2,335 |
| 17. | 00923 | 16.6% | 10.9%(+5.62)#17 | 5.8%(+10.7)#2,786 |
| 18. | 00918 | 16.5% | 10.9%(+5.52)#18 | 5.8%(+10.6)#2,820 |
| 19. | 00927 | 16.2% | 10.9%(+5.28)#19 | 5.8%(+10.4)#2,889 |
| 20. | 00601 | 16.1% | 10.9%(+5.11)#20 | 5.8%(+10.2)#2,955 |
| 21. | 00966 | 15.9% | 10.9%(+4.98)#21 | 5.8%(+10.1)#3,008 |
| 22. | 00739 | 15.8% | 10.9%(+4.87)#22 | 5.8%(+10.00)#3,068 |
| 23. | 00623 | 15.6% | 10.9%(+4.61)#23 | 5.8%(+9.74)#3,180 |
| 24. | 00602 | 15.3% | 10.9%(+4.36)#24 | 5.8%(+9.49)#3,276 |
| 25. | 00952 | 15.2% | 10.9%(+4.25)#25 | 5.8%(+9.38)#3,329 |
| 26. | 00685 | 15.0% | 10.9%(+4.09)#26 | 5.8%(+9.22)#3,405 |
| 27. | 00921 | 14.6% | 10.9%(+3.68)#27 | 5.8%(+8.81)#3,599 |
| 28. | 00979 | 14.6% | 10.9%(+3.66)#28 | 5.8%(+8.79)#3,610 |
| 29. | 00769 | 14.3% | 10.9%(+3.40)#29 | 5.8%(+8.53)#3,719 |
| 30. | 00773 | 14.3% | 10.9%(+3.40)#30 | 5.8%(+8.53)#3,720 |
| 31. | 00751 | 14.2% | 10.9%(+3.28)#31 | 5.8%(+8.41)#3,783 |
| 32. | 00745 | 13.9% | 10.9%(+2.91)#32 | 5.8%(+8.04)#3,989 |
| 33. | 00901 | 13.8% | 10.9%(+2.85)#33 | 5.8%(+7.98)#4,020 |
| 34. | 00969 | 13.7% | 10.9%(+2.77)#34 | 5.8%(+7.90)#4,055 |
| 35. | 00622 | 13.6% | 10.9%(+2.68)#35 | 5.8%(+7.81)#4,116 |
| 36. | 00926 | 13.5% | 10.9%(+2.53)#36 | 5.8%(+7.66)#4,206 |
| 37. | 00738 | 13.1% | 10.9%(+2.15)#37 | 5.8%(+7.28)#4,458 |
| 38. | 00778 | 13.0% | 10.9%(+2.10)#38 | 5.8%(+7.23)#4,501 |
| 39. | 00703 | 12.9% | 10.9%(+1.97)#39 | 5.8%(+7.09)#4,575 |
| 40. | 00754 | 12.4% | 10.9%(+1.47)#40 | 5.8%(+6.60)#4,949 |
| 41. | 00965 | 12.2% | 10.9%(+1.23)#41 | 5.8%(+6.36)#5,136 |
| 42. | 00650 | 12.1% | 10.9%(+1.19)#42 | 5.8%(+6.32)#5,176 |
| 43. | 00736 | 12.1% | 10.9%(+1.14)#43 | 5.8%(+6.27)#5,219 |
| 44. | 00718 | 12.0% | 10.9%(+1.09)#44 | 5.8%(+6.22)#5,265 |
| 45. | 00669 | 11.9% | 10.9%(+0.996)#45 | 5.8%(+6.13)#5,323 |
| 46. | 00627 | 11.7% | 10.9%(+0.790)#46 | 5.8%(+5.92)#5,504 |
| 47. | 00924 | 11.7% | 10.9%(+0.772)#47 | 5.8%(+5.90)#5,528 |
| 48. | 00674 | 11.6% | 10.9%(+0.702)#48 | 5.8%(+5.83)#5,579 |
| 49. | 00912 | 11.6% | 10.9%(+0.689)#49 | 5.8%(+5.82)#5,593 |
| 50. | 00659 | 11.6% | 10.9%(+0.639)#50 | 5.8%(+5.77)#5,632 |
| 51. | 00956 | 11.5% | 10.9%(+0.514)#51 | 5.8%(+5.64)#5,749 |
| 52. | 00961 | 11.3% | 10.9%(+0.373)#52 | 5.8%(+5.50)#5,888 |
| 53. | 00983 | 11.2% | 10.9%(+0.240)#53 | 5.8%(+5.37)#6,016 |
| 54. | 00968 | 10.8% | 10.9%(-0.107)#54 | 5.8%(+5.02)#6,366 |
| 55. | 00617 | 10.8% | 10.9%(-0.110)#55 | 5.8%(+5.02)#6,370 |
| 56. | 00791 | 10.7% | 10.9%(-0.261)#56 | 5.8%(+4.87)#6,565 |
| 57. | 00725 | 10.7% | 10.9%(-0.275)#57 | 5.8%(+4.85)#6,580 |
| 58. | 00957 | 10.6% | 10.9%(-0.357)#58 | 5.8%(+4.77)#6,662 |
| 59. | 00662 | 10.6% | 10.9%(-0.372)#59 | 5.8%(+4.76)#6,683 |
| 60. | 00767 | 10.4% | 10.9%(-0.561)#60 | 5.8%(+4.57)#6,906 |
| 61. | 00717 | 10.1% | 10.9%(-0.888)#61 | 5.8%(+4.24)#7,289 |
| 62. | 00680 | 9.9% | 10.9%(-1.03)#62 | 5.8%(+4.10)#7,466 |
| 63. | 00670 | 9.8% | 10.9%(-1.10)#63 | 5.8%(+4.03)#7,560 |
| 64. | 00976 | 9.8% | 10.9%(-1.11)#64 | 5.8%(+4.02)#7,585 |
| 65. | 00683 | 9.8% | 10.9%(-1.15)#65 | 5.8%(+3.98)#7,627 |
| 66. | 00716 | 9.7% | 10.9%(-1.20)#66 | 5.8%(+3.93)#7,697 |
| 67. | 00771 | 9.7% | 10.9%(-1.20)#67 | 5.8%(+3.93)#7,704 |
| 68. | 00624 | 9.7% | 10.9%(-1.26)#68 | 5.8%(+3.87)#7,781 |
| 69. | 00971 | 9.6% | 10.9%(-1.30)#69 | 5.8%(+3.83)#7,839 |
| 70. | 00705 | 9.6% | 10.9%(-1.35)#70 | 5.8%(+3.78)#7,899 |
| 71. | 00795 | 9.6% | 10.9%(-1.39)#71 | 5.8%(+3.74)#7,957 |
| 72. | 00692 | 9.5% | 10.9%(-1.48)#72 | 5.8%(+3.65)#8,058 |
| 73. | 00612 | 9.4% | 10.9%(-1.55)#73 | 5.8%(+3.58)#8,164 |
| 74. | 00729 | 9.3% | 10.9%(-1.63)#74 | 5.8%(+3.50)#8,285 |
| 75. | 00610 | 9.3% | 10.9%(-1.64)#75 | 5.8%(+3.49)#8,297 |
| 76. | 00715 | 9.2% | 10.9%(-1.74)#76 | 5.8%(+3.39)#8,459 |
| 77. | 00777 | 9.2% | 10.9%(-1.75)#77 | 5.8%(+3.38)#8,466 |
| 78. | 00603 | 9.2% | 10.9%(-1.79)#78 | 5.8%(+3.34)#8,528 |
| 79. | 00707 | 9.1% | 10.9%(-1.81)#79 | 5.8%(+3.32)#8,569 |
| 80. | 00646 | 9.1% | 10.9%(-1.81)#80 | 5.8%(+3.32)#8,571 |
| 81. | 00676 | 8.9% | 10.9%(-2.00)#81 | 5.8%(+3.13)#8,876 |
| 82. | 00959 | 8.9% | 10.9%(-2.01)#82 | 5.8%(+3.11)#8,895 |
| 83. | 00638 | 8.9% | 10.9%(-2.08)#83 | 5.8%(+3.04)#9,043 |
| 84. | 00682 | 8.8% | 10.9%(-2.18)#84 | 5.8%(+2.95)#9,213 |
| 85. | 00727 | 8.7% | 10.9%(-2.27)#85 | 5.8%(+2.86)#9,347 |
| 86. | 00985 | 8.6% | 10.9%(-2.36)#86 | 5.8%(+2.77)#9,494 |
| 87. | 00690 | 8.5% | 10.9%(-2.46)#87 | 5.8%(+2.67)#9,671 |
| 88. | 00667 | 8.3% | 10.9%(-2.65)#88 | 5.8%(+2.47)#10,079 |
| 89. | 00982 | 8.1% | 10.9%(-2.85)#89 | 5.8%(+2.28)#10,438 |
| 90. | 00693 | 8.1% | 10.9%(-2.88)#90 | 5.8%(+2.25)#10,504 |
| 91. | 00687 | 7.8% | 10.9%(-3.17)#91 | 5.8%(+1.96)#11,130 |
| 92. | 00766 | 7.7% | 10.9%(-3.27)#92 | 5.8%(+1.86)#11,364 |
| 93. | 00757 | 7.7% | 10.9%(-3.28)#93 | 5.8%(+1.85)#11,381 |
| 94. | 00698 | 7.5% | 10.9%(-3.43)#94 | 5.8%(+1.70)#11,746 |
| 95. | 00794 | 7.4% | 10.9%(-3.58)#95 | 5.8%(+1.55)#12,134 |
| 96. | 00949 | 7.4% | 10.9%(-3.58)#96 | 5.8%(+1.55)#12,144 |
| 97. | 00720 | 7.3% | 10.9%(-3.68)#97 | 5.8%(+1.45)#12,356 |
| 98. | 00987 | 7.1% | 10.9%(-3.81)#98 | 5.8%(+1.32)#12,672 |
| 99. | 00784 | 7.1% | 10.9%(-3.82)#99 | 5.8%(+1.31)#12,691 |
| 100. | 00730 | 7.1% | 10.9%(-3.85)#100 | 5.8%(+1.28)#12,768 |
1
2Common Questions
What are the Top 10 Zip Codes with the Highest Percentage of Self-Employed / Not Incorporated in Puerto Rico?
Top 10 Zip Codes with the Highest Percentage of Self-Employed / Not Incorporated in Puerto Rico are:
What zip code has the Highest Percentage of Self-Employed / Not Incorporated in Puerto Rico?
00740 has the Highest Percentage of Self-Employed / Not Incorporated in Puerto Rico with 33.6%.
What is the Percentage of Self-Employed / Not Incorporated in the State of Puerto Rico?
Percentage of Self-Employed / Not Incorporated in Puerto Rico is 10.9%.
What is the Percentage of Self-Employed / Not Incorporated in the United States?
Percentage of Self-Employed / Not Incorporated in the United States is 5.8%.