Zip Codes with the Highest Percentage of Self-Employed / Not Incorporated in Nevada
RELATED REPORTS & OPTIONS
Self-Employed / Not Incorporated
Nevada
Compare Zip Codes
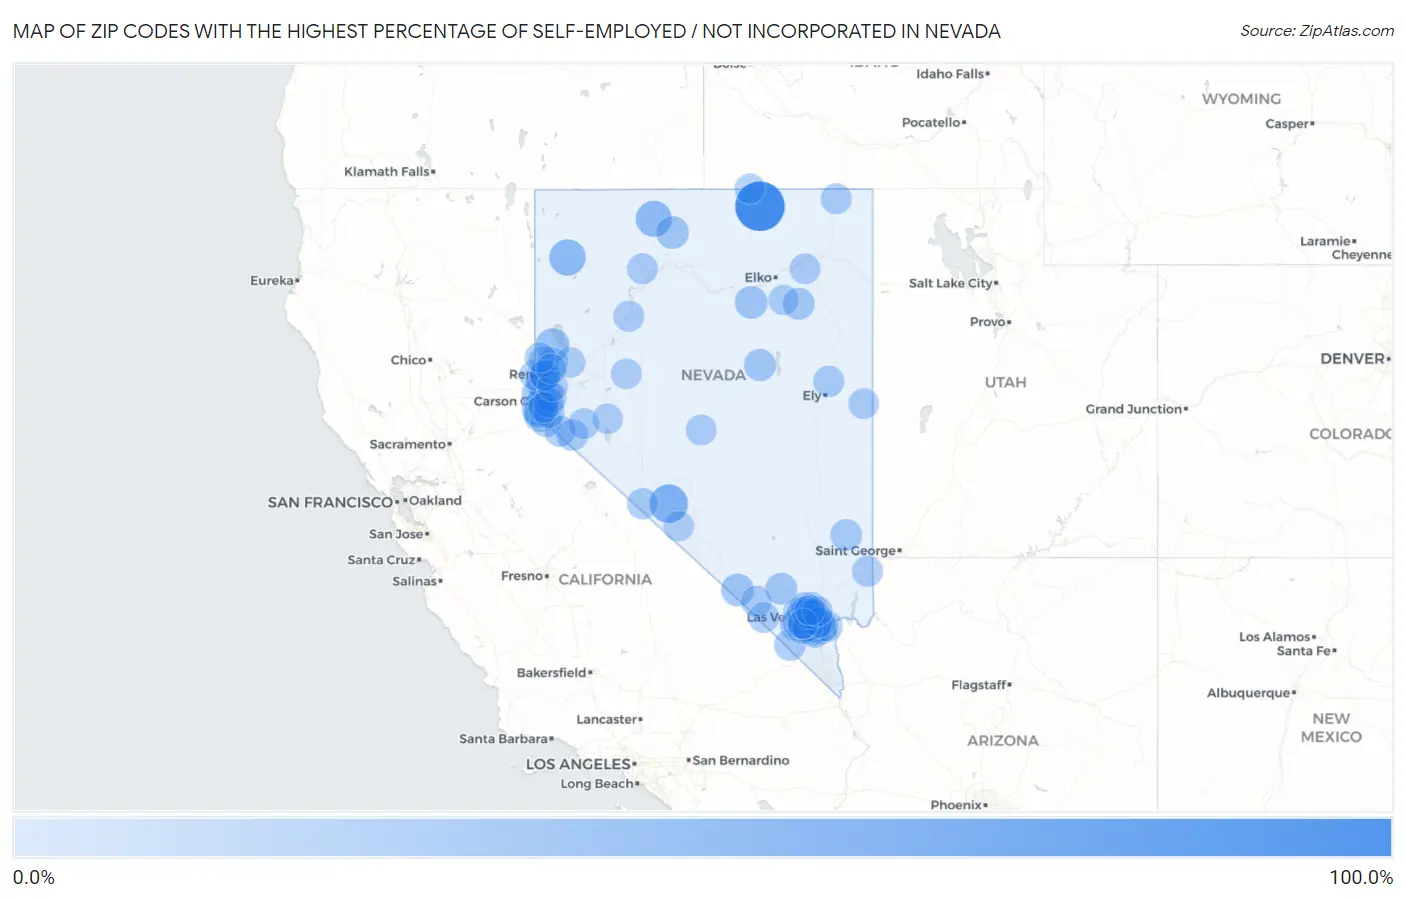
Map of Zip Codes with the Highest Percentage of Self-Employed / Not Incorporated in Nevada
0.0%
100.0%
Zip Codes with the Highest Percentage of Self-Employed / Not Incorporated in Nevada
| Zip Code | % Self-Employed / Not Incorporated | vs State | vs National | |
| 1. | 89831 | 100.0% | 5.3%(+94.7)#1 | 5.8%(+94.2)#34 |
| 2. | 89047 | 43.7% | 5.3%(+38.4)#2 | 5.8%(+37.9)#322 |
| 3. | 89412 | 33.3% | 5.3%(+28.0)#3 | 5.8%(+27.5)#610 |
| 4. | 89425 | 31.7% | 5.3%(+26.4)#4 | 5.8%(+25.9)#686 |
| 5. | 89413 | 20.6% | 5.3%(+15.3)#5 | 5.8%(+14.8)#1,715 |
| 6. | 89510 | 20.3% | 5.3%(+15.0)#6 | 5.8%(+14.5)#1,755 |
| 7. | 89822 | 15.9% | 5.3%(+10.6)#7 | 5.8%(+10.1)#3,036 |
| 8. | 89020 | 15.4% | 5.3%(+10.1)#8 | 5.8%(+9.58)#3,229 |
| 9. | 89426 | 15.4% | 5.3%(+10.1)#9 | 5.8%(+9.57)#3,241 |
| 10. | 89004 | 14.4% | 5.3%(+9.08)#10 | 5.8%(+8.58)#3,705 |
| 11. | 89316 | 12.5% | 5.3%(+7.18)#11 | 5.8%(+6.68)#4,877 |
| 12. | 89519 | 11.5% | 5.3%(+6.14)#12 | 5.8%(+5.64)#5,754 |
| 13. | 89833 | 11.3% | 5.3%(+5.99)#13 | 5.8%(+5.49)#5,899 |
| 14. | 89018 | 11.3% | 5.3%(+5.93)#14 | 5.8%(+5.43)#5,945 |
| 15. | 89451 | 11.1% | 5.3%(+5.74)#15 | 5.8%(+5.24)#6,143 |
| 16. | 89704 | 10.6% | 5.3%(+5.27)#16 | 5.8%(+4.77)#6,663 |
| 17. | 89019 | 10.4% | 5.3%(+5.09)#17 | 5.8%(+4.59)#6,881 |
| 18. | 89008 | 10.2% | 5.3%(+4.86)#18 | 5.8%(+4.36)#7,147 |
| 19. | 89444 | 9.8% | 5.3%(+4.46)#19 | 5.8%(+3.96)#7,666 |
| 20. | 89449 | 9.1% | 5.3%(+3.78)#20 | 5.8%(+3.28)#8,629 |
| 21. | 89158 | 9.0% | 5.3%(+3.64)#21 | 5.8%(+3.15)#8,839 |
| 22. | 89460 | 9.0% | 5.3%(+3.64)#22 | 5.8%(+3.14)#8,844 |
| 23. | 89703 | 8.4% | 5.3%(+3.12)#23 | 5.8%(+2.62)#9,777 |
| 24. | 89106 | 8.4% | 5.3%(+3.11)#24 | 5.8%(+2.61)#9,786 |
| 25. | 89410 | 8.3% | 5.3%(+2.99)#25 | 5.8%(+2.49)#10,062 |
| 26. | 89448 | 8.3% | 5.3%(+2.99)#26 | 5.8%(+2.49)#10,063 |
| 27. | 89423 | 8.2% | 5.3%(+2.84)#27 | 5.8%(+2.34)#10,342 |
| 28. | 89138 | 8.1% | 5.3%(+2.77)#28 | 5.8%(+2.27)#10,470 |
| 29. | 89109 | 7.9% | 5.3%(+2.56)#29 | 5.8%(+2.06)#10,896 |
| 30. | 89107 | 7.9% | 5.3%(+2.56)#30 | 5.8%(+2.06)#10,905 |
| 31. | 89010 | 7.9% | 5.3%(+2.54)#31 | 5.8%(+2.04)#10,945 |
| 32. | 89118 | 7.8% | 5.3%(+2.51)#32 | 5.8%(+2.01)#11,029 |
| 33. | 89301 | 7.8% | 5.3%(+2.50)#33 | 5.8%(+2.00)#11,041 |
| 34. | 89825 | 7.4% | 5.3%(+2.06)#34 | 5.8%(+1.56)#12,115 |
| 35. | 89511 | 7.4% | 5.3%(+2.05)#35 | 5.8%(+1.55)#12,142 |
| 36. | 89146 | 7.3% | 5.3%(+2.02)#36 | 5.8%(+1.52)#12,198 |
| 37. | 89034 | 7.3% | 5.3%(+2.02)#37 | 5.8%(+1.52)#12,200 |
| 38. | 89419 | 7.1% | 5.3%(+1.83)#38 | 5.8%(+1.33)#12,630 |
| 39. | 89074 | 7.1% | 5.3%(+1.74)#39 | 5.8%(+1.24)#12,899 |
| 40. | 89123 | 7.0% | 5.3%(+1.67)#40 | 5.8%(+1.17)#13,105 |
| 41. | 89060 | 6.9% | 5.3%(+1.57)#41 | 5.8%(+1.07)#13,353 |
| 42. | 89117 | 6.8% | 5.3%(+1.44)#42 | 5.8%(+0.941)#13,714 |
| 43. | 89134 | 6.7% | 5.3%(+1.43)#43 | 5.8%(+0.929)#13,734 |
| 44. | 89145 | 6.7% | 5.3%(+1.43)#44 | 5.8%(+0.926)#13,741 |
| 45. | 89706 | 6.6% | 5.3%(+1.30)#45 | 5.8%(+0.799)#14,087 |
| 46. | 89048 | 6.5% | 5.3%(+1.14)#46 | 5.8%(+0.642)#14,600 |
| 47. | 89084 | 6.4% | 5.3%(+1.12)#47 | 5.8%(+0.618)#14,676 |
| 48. | 89445 | 6.4% | 5.3%(+1.09)#48 | 5.8%(+0.587)#14,774 |
| 49. | 89439 | 6.4% | 5.3%(+1.08)#49 | 5.8%(+0.576)#14,814 |
| 50. | 89144 | 6.3% | 5.3%(+1.00)#50 | 5.8%(+0.503)#15,022 |
| 51. | 89002 | 6.3% | 5.3%(+0.986)#51 | 5.8%(+0.486)#15,092 |
| 52. | 89509 | 6.3% | 5.3%(+0.961)#52 | 5.8%(+0.461)#15,165 |
| 53. | 89447 | 6.2% | 5.3%(+0.925)#53 | 5.8%(+0.425)#15,286 |
| 54. | 89104 | 6.2% | 5.3%(+0.840)#54 | 5.8%(+0.341)#15,556 |
| 55. | 89128 | 6.1% | 5.3%(+0.819)#55 | 5.8%(+0.319)#15,631 |
| 56. | 89441 | 6.1% | 5.3%(+0.766)#56 | 5.8%(+0.266)#15,788 |
| 57. | 89311 | 6.0% | 5.3%(+0.708)#57 | 5.8%(+0.209)#15,995 |
| 58. | 89052 | 6.0% | 5.3%(+0.693)#58 | 5.8%(+0.193)#16,050 |
| 59. | 89102 | 6.0% | 5.3%(+0.690)#59 | 5.8%(+0.191)#16,058 |
| 60. | 89701 | 5.9% | 5.3%(+0.607)#60 | 5.8%(+0.108)#16,316 |
| 61. | 89129 | 5.9% | 5.3%(+0.562)#61 | 5.8%(+0.062)#16,459 |
| 62. | 89110 | 5.8% | 5.3%(+0.517)#62 | 5.8%(+0.018)#16,609 |
| 63. | 89045 | 5.8% | 5.3%(+0.488)#63 | 5.8%(-0.011)#16,694 |
| 64. | 89815 | 5.7% | 5.3%(+0.361)#64 | 5.8%(-0.139)#17,122 |
| 65. | 89012 | 5.7% | 5.3%(+0.359)#65 | 5.8%(-0.141)#17,134 |
| 66. | 89823 | 5.6% | 5.3%(+0.309)#66 | 5.8%(-0.191)#17,321 |
| 67. | 89015 | 5.6% | 5.3%(+0.304)#67 | 5.8%(-0.195)#17,342 |
| 68. | 89044 | 5.6% | 5.3%(+0.272)#68 | 5.8%(-0.228)#17,447 |
| 69. | 89147 | 5.5% | 5.3%(+0.229)#69 | 5.8%(-0.270)#17,624 |
| 70. | 89135 | 5.5% | 5.3%(+0.221)#70 | 5.8%(-0.279)#17,652 |
| 71. | 89101 | 5.5% | 5.3%(+0.211)#71 | 5.8%(-0.289)#17,682 |
| 72. | 89169 | 5.5% | 5.3%(+0.159)#72 | 5.8%(-0.341)#17,862 |
| 73. | 89178 | 5.4% | 5.3%(+0.131)#73 | 5.8%(-0.369)#17,961 |
| 74. | 89103 | 5.4% | 5.3%(+0.078)#74 | 5.8%(-0.422)#18,151 |
| 75. | 89005 | 5.3% | 5.3%(+0.016)#75 | 5.8%(-0.484)#18,391 |
| 76. | 89705 | 5.3% | 5.3%(+0.013)#76 | 5.8%(-0.487)#18,410 |
| 77. | 89406 | 5.2% | 5.3%(-0.146)#77 | 5.8%(-0.646)#19,039 |
| 78. | 89131 | 5.1% | 5.3%(-0.176)#78 | 5.8%(-0.676)#19,146 |
| 79. | 89130 | 5.1% | 5.3%(-0.206)#79 | 5.8%(-0.706)#19,254 |
| 80. | 89141 | 5.0% | 5.3%(-0.267)#80 | 5.8%(-0.767)#19,486 |
| 81. | 89122 | 5.0% | 5.3%(-0.299)#81 | 5.8%(-0.799)#19,605 |
| 82. | 89014 | 5.0% | 5.3%(-0.303)#82 | 5.8%(-0.803)#19,621 |
| 83. | 89013 | 5.0% | 5.3%(-0.316)#83 | 5.8%(-0.816)#19,672 |
| 84. | 89506 | 5.0% | 5.3%(-0.325)#84 | 5.8%(-0.824)#19,705 |
| 85. | 89121 | 5.0% | 5.3%(-0.334)#85 | 5.8%(-0.834)#19,739 |
| 86. | 89442 | 5.0% | 5.3%(-0.341)#86 | 5.8%(-0.840)#19,760 |
| 87. | 89139 | 5.0% | 5.3%(-0.352)#87 | 5.8%(-0.852)#19,793 |
| 88. | 89501 | 4.9% | 5.3%(-0.378)#88 | 5.8%(-0.878)#19,904 |
| 89. | 89113 | 4.9% | 5.3%(-0.384)#89 | 5.8%(-0.884)#19,931 |
| 90. | 89108 | 4.9% | 5.3%(-0.407)#90 | 5.8%(-0.907)#20,022 |
| 91. | 89030 | 4.9% | 5.3%(-0.454)#91 | 5.8%(-0.954)#20,179 |
| 92. | 89832 | 4.8% | 5.3%(-0.481)#92 | 5.8%(-0.980)#20,283 |
| 93. | 89011 | 4.8% | 5.3%(-0.496)#93 | 5.8%(-0.996)#20,342 |
| 94. | 89427 | 4.8% | 5.3%(-0.554)#94 | 5.8%(-1.05)#20,561 |
| 95. | 89521 | 4.7% | 5.3%(-0.573)#95 | 5.8%(-1.07)#20,640 |
| 96. | 89508 | 4.7% | 5.3%(-0.596)#96 | 5.8%(-1.10)#20,707 |
| 97. | 89148 | 4.7% | 5.3%(-0.603)#97 | 5.8%(-1.10)#20,734 |
| 98. | 89115 | 4.7% | 5.3%(-0.624)#98 | 5.8%(-1.12)#20,835 |
| 99. | 89436 | 4.6% | 5.3%(-0.762)#99 | 5.8%(-1.26)#21,346 |
| 100. | 89031 | 4.5% | 5.3%(-0.788)#100 | 5.8%(-1.29)#21,471 |
1
2Common Questions
What are the Top 10 Zip Codes with the Highest Percentage of Self-Employed / Not Incorporated in Nevada?
Top 10 Zip Codes with the Highest Percentage of Self-Employed / Not Incorporated in Nevada are:
What zip code has the Highest Percentage of Self-Employed / Not Incorporated in Nevada?
89831 has the Highest Percentage of Self-Employed / Not Incorporated in Nevada with 100.0%.
What is the Percentage of Self-Employed / Not Incorporated in the State of Nevada?
Percentage of Self-Employed / Not Incorporated in Nevada is 5.3%.
What is the Percentage of Self-Employed / Not Incorporated in the United States?
Percentage of Self-Employed / Not Incorporated in the United States is 5.8%.