Zip Codes with the Highest Percentage of Self-Employed / Not Incorporated in Maine
RELATED REPORTS & OPTIONS
Self-Employed / Not Incorporated
Maine
Compare Zip Codes
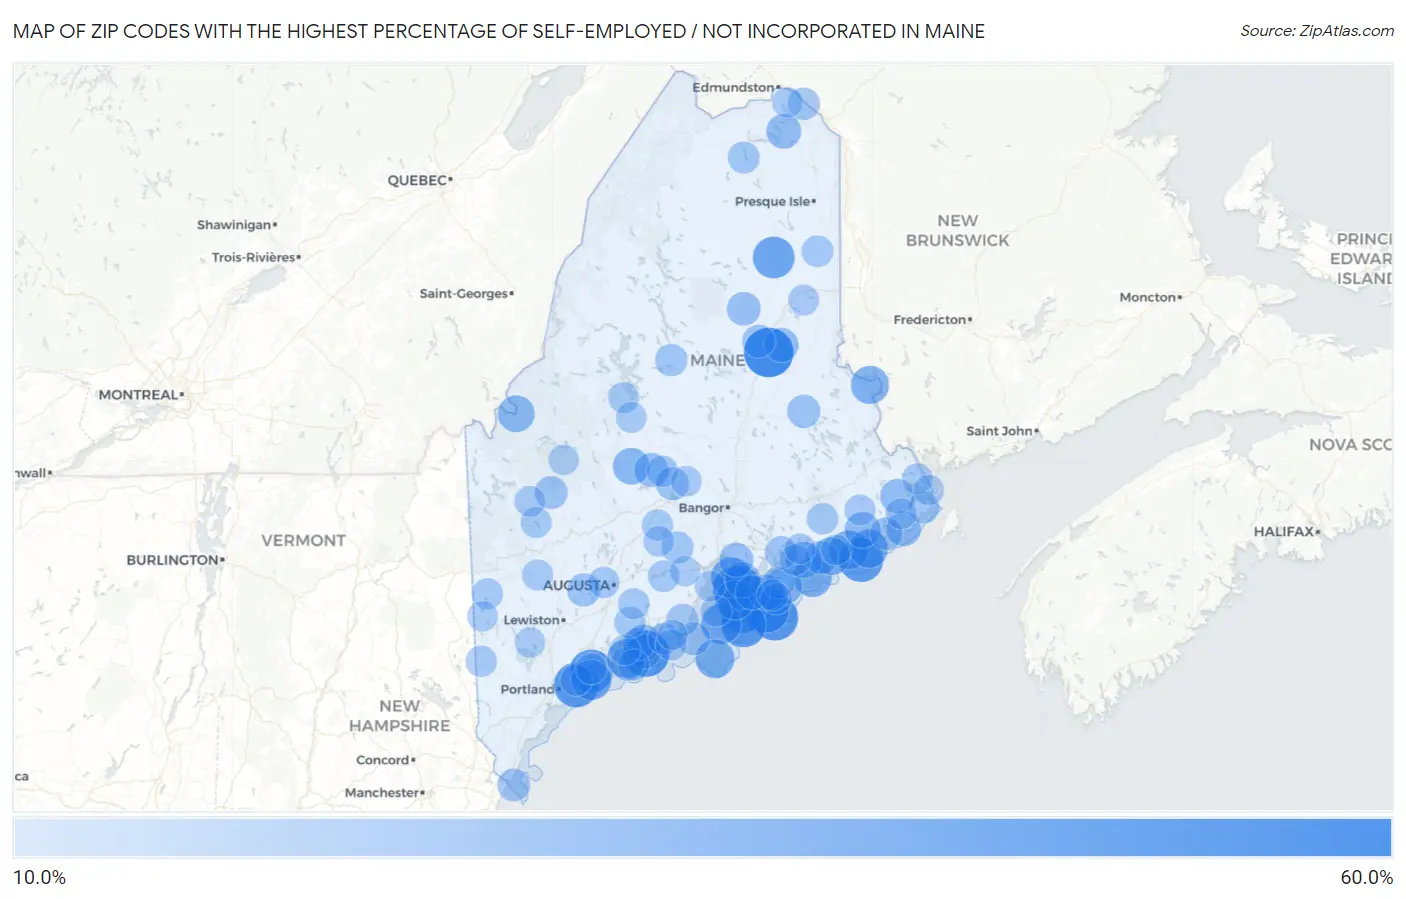
Map of Zip Codes with the Highest Percentage of Self-Employed / Not Incorporated in Maine
10.0%
60.0%
Zip Codes with the Highest Percentage of Self-Employed / Not Incorporated in Maine
| Zip Code | % Self-Employed / Not Incorporated | vs State | vs National | |
| 1. | 04733 | 57.5% | 8.1%(+49.4)#1 | 5.8%(+51.6)#153 |
| 2. | 04541 | 50.0% | 8.1%(+41.9)#2 | 5.8%(+44.2)#222 |
| 3. | 04635 | 50.0% | 8.1%(+41.9)#3 | 5.8%(+44.2)#237 |
| 4. | 04685 | 48.2% | 8.1%(+40.2)#4 | 5.8%(+42.4)#250 |
| 5. | 04681 | 48.2% | 8.1%(+40.1)#5 | 5.8%(+42.4)#251 |
| 6. | 04019 | 46.7% | 8.1%(+38.6)#6 | 5.8%(+40.9)#279 |
| 7. | 04645 | 46.4% | 8.1%(+38.4)#7 | 5.8%(+40.6)#280 |
| 8. | 04650 | 45.5% | 8.1%(+37.5)#8 | 5.8%(+39.7)#292 |
| 9. | 04611 | 45.2% | 8.1%(+37.1)#9 | 5.8%(+39.3)#301 |
| 10. | 04066 | 43.9% | 8.1%(+35.8)#10 | 5.8%(+38.1)#316 |
| 11. | 04673 | 42.5% | 8.1%(+34.4)#11 | 5.8%(+36.7)#353 |
| 12. | 04764 | 40.0% | 8.1%(+31.9)#12 | 5.8%(+34.2)#409 |
| 13. | 04617 | 37.3% | 8.1%(+29.2)#13 | 5.8%(+31.5)#483 |
| 14. | 04863 | 36.7% | 8.1%(+28.7)#14 | 5.8%(+30.9)#496 |
| 15. | 04003 | 36.5% | 8.1%(+28.4)#15 | 5.8%(+30.7)#508 |
| 16. | 04627 | 35.3% | 8.1%(+27.2)#16 | 5.8%(+29.5)#551 |
| 17. | 04606 | 33.5% | 8.1%(+25.4)#17 | 5.8%(+27.7)#596 |
| 18. | 04851 | 33.3% | 8.1%(+25.3)#18 | 5.8%(+27.5)#608 |
| 19. | 04613 | 33.3% | 8.1%(+25.3)#19 | 5.8%(+27.5)#609 |
| 20. | 04575 | 33.0% | 8.1%(+24.9)#20 | 5.8%(+27.2)#631 |
| 21. | 04649 | 32.9% | 8.1%(+24.8)#21 | 5.8%(+27.0)#635 |
| 22. | 04491 | 31.7% | 8.1%(+23.7)#22 | 5.8%(+25.9)#685 |
| 23. | 04658 | 31.5% | 8.1%(+23.5)#23 | 5.8%(+25.7)#696 |
| 24. | 04662 | 29.5% | 8.1%(+21.5)#24 | 5.8%(+23.7)#798 |
| 25. | 04936 | 28.9% | 8.1%(+20.8)#25 | 5.8%(+23.1)#830 |
| 26. | 04942 | 28.7% | 8.1%(+20.6)#26 | 5.8%(+22.8)#843 |
| 27. | 04607 | 27.5% | 8.1%(+19.5)#27 | 5.8%(+21.7)#921 |
| 28. | 04674 | 26.7% | 8.1%(+18.6)#28 | 5.8%(+20.9)#984 |
| 29. | 04648 | 26.7% | 8.1%(+18.6)#29 | 5.8%(+20.9)#986 |
| 30. | 04539 | 26.4% | 8.1%(+18.3)#30 | 5.8%(+20.5)#1,012 |
| 31. | 04676 | 26.0% | 8.1%(+17.9)#31 | 5.8%(+20.2)#1,040 |
| 32. | 04616 | 24.5% | 8.1%(+16.5)#32 | 5.8%(+18.7)#1,206 |
| 33. | 04779 | 24.5% | 8.1%(+16.4)#33 | 5.8%(+18.7)#1,212 |
| 34. | 04626 | 24.4% | 8.1%(+16.3)#34 | 5.8%(+18.6)#1,221 |
| 35. | 04628 | 24.1% | 8.1%(+16.0)#35 | 5.8%(+18.3)#1,242 |
| 36. | 04558 | 24.1% | 8.1%(+16.0)#36 | 5.8%(+18.2)#1,244 |
| 37. | 04776 | 23.8% | 8.1%(+15.7)#37 | 5.8%(+17.9)#1,278 |
| 38. | 04476 | 23.3% | 8.1%(+15.3)#38 | 5.8%(+17.5)#1,322 |
| 39. | 04923 | 23.1% | 8.1%(+15.0)#39 | 5.8%(+17.3)#1,340 |
| 40. | 04765 | 22.3% | 8.1%(+14.2)#40 | 5.8%(+16.4)#1,437 |
| 41. | 04576 | 21.9% | 8.1%(+13.8)#41 | 5.8%(+16.1)#1,491 |
| 42. | 04680 | 21.7% | 8.1%(+13.7)#42 | 5.8%(+15.9)#1,516 |
| 43. | 04265 | 21.2% | 8.1%(+13.1)#43 | 5.8%(+15.3)#1,614 |
| 44. | 04487 | 21.0% | 8.1%(+12.9)#44 | 5.8%(+15.1)#1,645 |
| 45. | 04854 | 20.9% | 8.1%(+12.9)#45 | 5.8%(+15.1)#1,647 |
| 46. | 04777 | 20.7% | 8.1%(+12.6)#46 | 5.8%(+14.9)#1,694 |
| 47. | 04928 | 20.7% | 8.1%(+12.6)#47 | 5.8%(+14.9)#1,698 |
| 48. | 04983 | 20.4% | 8.1%(+12.3)#48 | 5.8%(+14.6)#1,741 |
| 49. | 03905 | 20.1% | 8.1%(+12.0)#49 | 5.8%(+14.3)#1,793 |
| 50. | 04640 | 20.0% | 8.1%(+11.9)#50 | 5.8%(+14.2)#1,798 |
| 51. | 04655 | 19.9% | 8.1%(+11.8)#51 | 5.8%(+14.1)#1,845 |
| 52. | 04861 | 19.4% | 8.1%(+11.3)#52 | 5.8%(+13.6)#1,938 |
| 53. | 04746 | 19.2% | 8.1%(+11.2)#53 | 5.8%(+13.4)#1,963 |
| 54. | 04573 | 19.1% | 8.1%(+11.0)#54 | 5.8%(+13.3)#1,996 |
| 55. | 04441 | 19.0% | 8.1%(+10.9)#55 | 5.8%(+13.1)#2,049 |
| 56. | 04986 | 18.6% | 8.1%(+10.5)#56 | 5.8%(+12.7)#2,154 |
| 57. | 04660 | 18.3% | 8.1%(+10.2)#57 | 5.8%(+12.5)#2,245 |
| 58. | 04739 | 18.2% | 8.1%(+10.1)#58 | 5.8%(+12.4)#2,258 |
| 59. | 04017 | 17.9% | 8.1%(+9.86)#59 | 5.8%(+12.1)#2,329 |
| 60. | 04735 | 17.8% | 8.1%(+9.69)#60 | 5.8%(+11.9)#2,386 |
| 61. | 04949 | 17.7% | 8.1%(+9.66)#61 | 5.8%(+11.9)#2,390 |
| 62. | 04653 | 17.6% | 8.1%(+9.55)#62 | 5.8%(+11.8)#2,425 |
| 63. | 04547 | 17.6% | 8.1%(+9.50)#63 | 5.8%(+11.7)#2,448 |
| 64. | 04652 | 17.3% | 8.1%(+9.28)#64 | 5.8%(+11.5)#2,520 |
| 65. | 04622 | 17.3% | 8.1%(+9.22)#65 | 5.8%(+11.5)#2,535 |
| 66. | 04677 | 17.2% | 8.1%(+9.11)#66 | 5.8%(+11.4)#2,581 |
| 67. | 04535 | 17.2% | 8.1%(+9.10)#67 | 5.8%(+11.4)#2,583 |
| 68. | 04930 | 17.1% | 8.1%(+8.98)#68 | 5.8%(+11.2)#2,617 |
| 69. | 04351 | 17.0% | 8.1%(+8.97)#69 | 5.8%(+11.2)#2,618 |
| 70. | 04544 | 17.0% | 8.1%(+8.89)#70 | 5.8%(+11.1)#2,645 |
| 71. | 04612 | 16.9% | 8.1%(+8.84)#71 | 5.8%(+11.1)#2,655 |
| 72. | 04922 | 16.8% | 8.1%(+8.74)#72 | 5.8%(+11.0)#2,688 |
| 73. | 04068 | 16.8% | 8.1%(+8.72)#73 | 5.8%(+11.0)#2,694 |
| 74. | 04353 | 16.7% | 8.1%(+8.63)#74 | 5.8%(+10.9)#2,725 |
| 75. | 04853 | 16.5% | 8.1%(+8.38)#75 | 5.8%(+10.6)#2,824 |
| 76. | 04231 | 16.3% | 8.1%(+8.28)#76 | 5.8%(+10.5)#2,856 |
| 77. | 04442 | 16.3% | 8.1%(+8.26)#77 | 5.8%(+10.5)#2,861 |
| 78. | 04285 | 16.3% | 8.1%(+8.19)#78 | 5.8%(+10.4)#2,880 |
| 79. | 04079 | 16.3% | 8.1%(+8.19)#79 | 5.8%(+10.4)#2,881 |
| 80. | 04292 | 16.2% | 8.1%(+8.13)#80 | 5.8%(+10.4)#2,902 |
| 81. | 04966 | 16.2% | 8.1%(+8.12)#81 | 5.8%(+10.4)#2,909 |
| 82. | 04691 | 16.2% | 8.1%(+8.10)#82 | 5.8%(+10.4)#2,915 |
| 83. | 04763 | 16.2% | 8.1%(+8.10)#83 | 5.8%(+10.3)#2,918 |
| 84. | 04654 | 16.0% | 8.1%(+7.95)#84 | 5.8%(+10.2)#2,968 |
| 85. | 04860 | 16.0% | 8.1%(+7.89)#85 | 5.8%(+10.1)#2,987 |
| 86. | 04485 | 16.0% | 8.1%(+7.89)#86 | 5.8%(+10.1)#2,991 |
| 87. | 04667 | 15.9% | 8.1%(+7.80)#87 | 5.8%(+10.0)#3,040 |
| 88. | 04988 | 15.7% | 8.1%(+7.64)#88 | 5.8%(+9.89)#3,117 |
| 89. | 04435 | 15.6% | 8.1%(+7.53)#89 | 5.8%(+9.78)#3,160 |
| 90. | 04848 | 15.6% | 8.1%(+7.49)#90 | 5.8%(+9.74)#3,183 |
| 91. | 04664 | 15.5% | 8.1%(+7.43)#91 | 5.8%(+9.68)#3,198 |
| 92. | 04037 | 15.4% | 8.1%(+7.29)#92 | 5.8%(+9.54)#3,256 |
| 93. | 04631 | 15.3% | 8.1%(+7.22)#93 | 5.8%(+9.47)#3,291 |
| 94. | 04571 | 15.3% | 8.1%(+7.19)#94 | 5.8%(+9.44)#3,301 |
| 95. | 04961 | 15.2% | 8.1%(+7.13)#95 | 5.8%(+9.38)#3,327 |
| 96. | 04015 | 15.2% | 8.1%(+7.12)#96 | 5.8%(+9.37)#3,336 |
| 97. | 04563 | 15.1% | 8.1%(+7.05)#97 | 5.8%(+9.30)#3,361 |
| 98. | 04952 | 15.1% | 8.1%(+7.03)#98 | 5.8%(+9.28)#3,370 |
| 99. | 04643 | 15.1% | 8.1%(+7.01)#99 | 5.8%(+9.26)#3,383 |
| 100. | 04773 | 14.9% | 8.1%(+6.84)#100 | 5.8%(+9.09)#3,463 |
Common Questions
What are the Top 10 Zip Codes with the Highest Percentage of Self-Employed / Not Incorporated in Maine?
Top 10 Zip Codes with the Highest Percentage of Self-Employed / Not Incorporated in Maine are:
What zip code has the Highest Percentage of Self-Employed / Not Incorporated in Maine?
04733 has the Highest Percentage of Self-Employed / Not Incorporated in Maine with 57.5%.
What is the Percentage of Self-Employed / Not Incorporated in the State of Maine?
Percentage of Self-Employed / Not Incorporated in Maine is 8.1%.
What is the Percentage of Self-Employed / Not Incorporated in the United States?
Percentage of Self-Employed / Not Incorporated in the United States is 5.8%.