Zip Codes with the Highest Percentage of Self-Employed / Not Incorporated in Tennessee
RELATED REPORTS & OPTIONS
Self-Employed / Not Incorporated
Tennessee
Compare Zip Codes
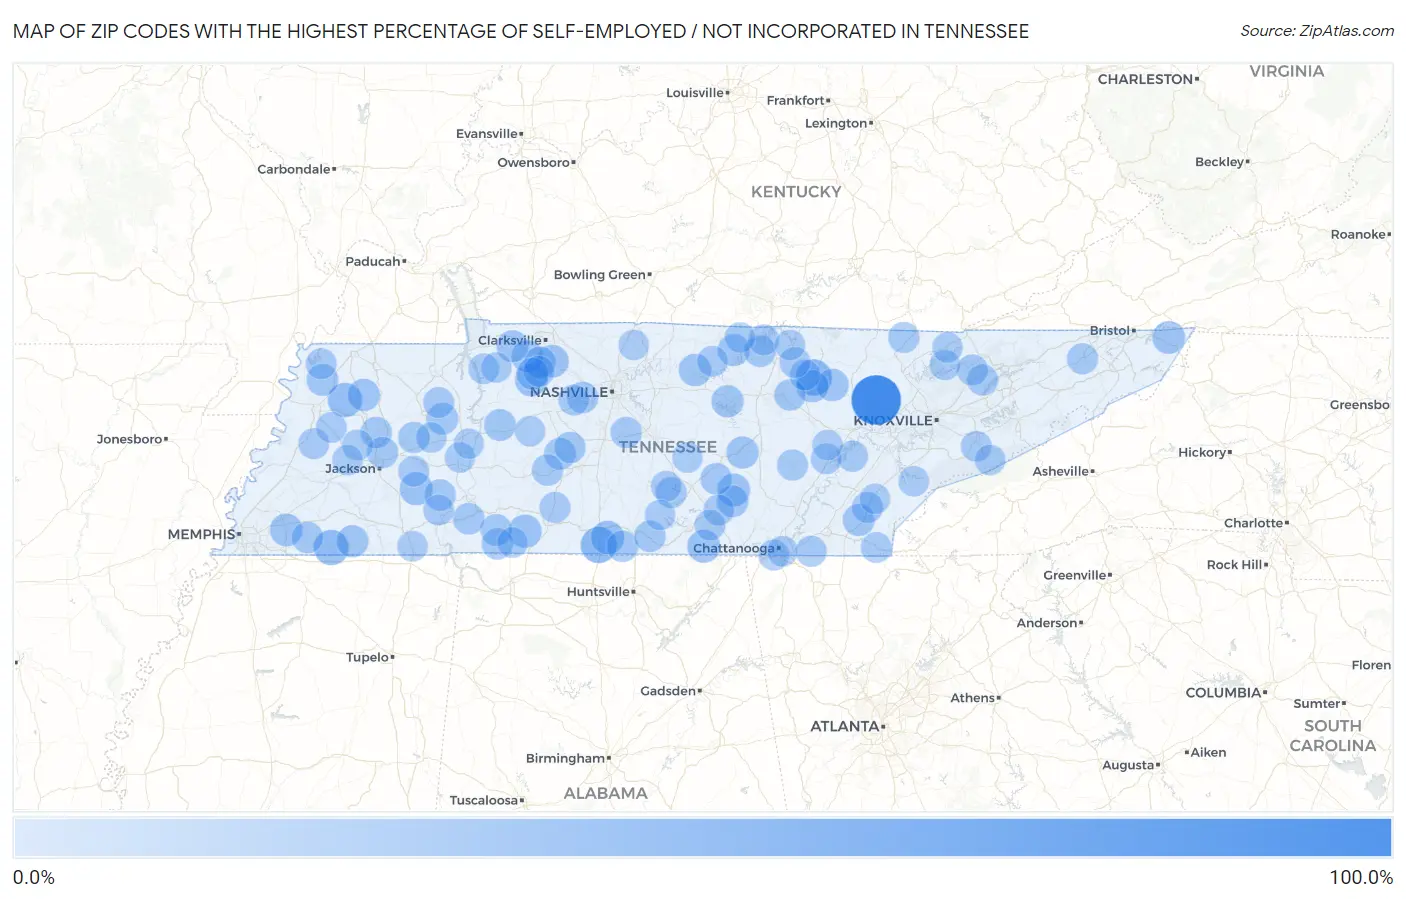
Map of Zip Codes with the Highest Percentage of Self-Employed / Not Incorporated in Tennessee
0.0%
100.0%
Zip Codes with the Highest Percentage of Self-Employed / Not Incorporated in Tennessee
| Zip Code | % Self-Employed / Not Incorporated | vs State | vs National | |
| 1. | 37845 | 100.0% | 6.7%(+93.3)#1 | 5.8%(+94.2)#2 |
| 2. | 38565 | 38.8% | 6.7%(+32.1)#2 | 5.8%(+33.0)#437 |
| 3. | 38455 | 37.5% | 6.7%(+30.8)#3 | 5.8%(+31.7)#474 |
| 4. | 38046 | 33.3% | 6.7%(+26.6)#4 | 5.8%(+27.5)#620 |
| 5. | 38389 | 29.4% | 6.7%(+22.7)#5 | 5.8%(+23.6)#806 |
| 6. | 38453 | 25.3% | 6.7%(+18.6)#6 | 5.8%(+19.5)#1,119 |
| 7. | 38486 | 24.3% | 6.7%(+17.6)#7 | 5.8%(+18.5)#1,233 |
| 8. | 38347 | 23.5% | 6.7%(+16.8)#8 | 5.8%(+17.7)#1,310 |
| 9. | 37376 | 23.1% | 6.7%(+16.4)#9 | 5.8%(+17.3)#1,337 |
| 10. | 37305 | 22.7% | 6.7%(+16.0)#10 | 5.8%(+16.9)#1,391 |
| 11. | 38028 | 22.1% | 6.7%(+15.4)#11 | 5.8%(+16.3)#1,466 |
| 12. | 37171 | 21.9% | 6.7%(+15.1)#12 | 5.8%(+16.0)#1,500 |
| 13. | 37688 | 21.6% | 6.7%(+14.9)#13 | 5.8%(+15.8)#1,545 |
| 14. | 37181 | 21.4% | 6.7%(+14.7)#14 | 5.8%(+15.6)#1,582 |
| 15. | 37726 | 20.9% | 6.7%(+14.1)#15 | 5.8%(+15.0)#1,665 |
| 16. | 37151 | 20.7% | 6.7%(+14.0)#16 | 5.8%(+14.8)#1,699 |
| 17. | 38369 | 20.4% | 6.7%(+13.7)#17 | 5.8%(+14.6)#1,746 |
| 18. | 38553 | 20.0% | 6.7%(+13.3)#18 | 5.8%(+14.2)#1,797 |
| 19. | 38588 | 19.8% | 6.7%(+13.1)#19 | 5.8%(+14.0)#1,861 |
| 20. | 38581 | 19.8% | 6.7%(+13.1)#20 | 5.8%(+14.0)#1,867 |
| 21. | 38582 | 19.4% | 6.7%(+12.7)#21 | 5.8%(+13.6)#1,936 |
| 22. | 37142 | 19.3% | 6.7%(+12.6)#22 | 5.8%(+13.5)#1,943 |
| 23. | 38067 | 19.1% | 6.7%(+12.4)#23 | 5.8%(+13.3)#1,993 |
| 24. | 37325 | 18.9% | 6.7%(+12.2)#24 | 5.8%(+13.1)#2,063 |
| 25. | 37052 | 18.7% | 6.7%(+11.9)#25 | 5.8%(+12.8)#2,125 |
| 26. | 37079 | 18.3% | 6.7%(+11.6)#26 | 5.8%(+12.5)#2,220 |
| 27. | 37078 | 18.2% | 6.7%(+11.5)#27 | 5.8%(+12.4)#2,260 |
| 28. | 37165 | 18.2% | 6.7%(+11.5)#28 | 5.8%(+12.4)#2,272 |
| 29. | 38240 | 17.8% | 6.7%(+11.1)#29 | 5.8%(+12.0)#2,381 |
| 30. | 37313 | 17.7% | 6.7%(+11.0)#30 | 5.8%(+11.9)#2,406 |
| 31. | 38450 | 17.4% | 6.7%(+10.7)#31 | 5.8%(+11.6)#2,500 |
| 32. | 37394 | 17.4% | 6.7%(+10.7)#32 | 5.8%(+11.6)#2,505 |
| 33. | 38475 | 17.3% | 6.7%(+10.6)#33 | 5.8%(+11.5)#2,534 |
| 34. | 38487 | 17.3% | 6.7%(+10.5)#34 | 5.8%(+11.4)#2,547 |
| 35. | 38318 | 17.2% | 6.7%(+10.5)#35 | 5.8%(+11.4)#2,554 |
| 36. | 38568 | 17.0% | 6.7%(+10.3)#36 | 5.8%(+11.2)#2,626 |
| 37. | 38488 | 16.6% | 6.7%(+9.92)#37 | 5.8%(+10.8)#2,766 |
| 38. | 38452 | 16.6% | 6.7%(+9.92)#38 | 5.8%(+10.8)#2,767 |
| 39. | 37348 | 16.6% | 6.7%(+9.87)#39 | 5.8%(+10.8)#2,778 |
| 40. | 38076 | 16.4% | 6.7%(+9.72)#40 | 5.8%(+10.6)#2,834 |
| 41. | 38371 | 16.4% | 6.7%(+9.66)#41 | 5.8%(+10.6)#2,847 |
| 42. | 38338 | 16.1% | 6.7%(+9.42)#42 | 5.8%(+10.3)#2,927 |
| 43. | 38482 | 16.0% | 6.7%(+9.24)#43 | 5.8%(+10.1)#2,992 |
| 44. | 38362 | 15.9% | 6.7%(+9.23)#44 | 5.8%(+10.1)#3,002 |
| 45. | 37143 | 15.9% | 6.7%(+9.20)#45 | 5.8%(+10.1)#3,014 |
| 46. | 38574 | 15.9% | 6.7%(+9.18)#46 | 5.8%(+10.1)#3,025 |
| 47. | 38461 | 15.8% | 6.7%(+9.13)#47 | 5.8%(+10.0)#3,052 |
| 48. | 37014 | 15.6% | 6.7%(+8.88)#48 | 5.8%(+9.77)#3,164 |
| 49. | 38321 | 15.6% | 6.7%(+8.88)#49 | 5.8%(+9.77)#3,166 |
| 50. | 37331 | 15.3% | 6.7%(+8.57)#50 | 5.8%(+9.46)#3,294 |
| 51. | 37861 | 14.9% | 6.7%(+8.22)#51 | 5.8%(+9.12)#3,453 |
| 52. | 37367 | 14.7% | 6.7%(+8.00)#52 | 5.8%(+8.90)#3,557 |
| 53. | 37819 | 14.7% | 6.7%(+8.00)#53 | 5.8%(+8.89)#3,563 |
| 54. | 37888 | 14.7% | 6.7%(+7.96)#54 | 5.8%(+8.85)#3,581 |
| 55. | 37302 | 14.6% | 6.7%(+7.84)#55 | 5.8%(+8.74)#3,627 |
| 56. | 37656 | 14.5% | 6.7%(+7.80)#56 | 5.8%(+8.70)#3,648 |
| 57. | 37360 | 14.4% | 6.7%(+7.68)#57 | 5.8%(+8.57)#3,706 |
| 58. | 37051 | 14.2% | 6.7%(+7.49)#58 | 5.8%(+8.38)#3,803 |
| 59. | 38342 | 14.2% | 6.7%(+7.46)#59 | 5.8%(+8.36)#3,817 |
| 60. | 37880 | 14.1% | 6.7%(+7.41)#60 | 5.8%(+8.30)#3,846 |
| 61. | 38456 | 14.0% | 6.7%(+7.33)#61 | 5.8%(+8.22)#3,879 |
| 62. | 37350 | 14.0% | 6.7%(+7.28)#62 | 5.8%(+8.18)#3,907 |
| 63. | 38037 | 13.9% | 6.7%(+7.15)#63 | 5.8%(+8.05)#3,982 |
| 64. | 38337 | 13.8% | 6.7%(+7.08)#64 | 5.8%(+7.98)#4,010 |
| 65. | 38551 | 13.8% | 6.7%(+7.05)#65 | 5.8%(+7.94)#4,035 |
| 66. | 38589 | 13.7% | 6.7%(+6.99)#66 | 5.8%(+7.88)#4,070 |
| 67. | 37082 | 13.7% | 6.7%(+6.94)#67 | 5.8%(+7.84)#4,096 |
| 68. | 37366 | 13.6% | 6.7%(+6.89)#68 | 5.8%(+7.78)#4,131 |
| 69. | 38345 | 13.6% | 6.7%(+6.87)#69 | 5.8%(+7.76)#4,140 |
| 70. | 37381 | 13.6% | 6.7%(+6.84)#70 | 5.8%(+7.74)#4,154 |
| 71. | 37383 | 13.5% | 6.7%(+6.75)#71 | 5.8%(+7.65)#4,211 |
| 72. | 37145 | 13.2% | 6.7%(+6.54)#72 | 5.8%(+7.43)#4,348 |
| 73. | 38543 | 13.2% | 6.7%(+6.53)#73 | 5.8%(+7.43)#4,355 |
| 74. | 38232 | 13.2% | 6.7%(+6.51)#74 | 5.8%(+7.41)#4,370 |
| 75. | 38361 | 13.2% | 6.7%(+6.45)#75 | 5.8%(+7.34)#4,419 |
| 76. | 38034 | 13.1% | 6.7%(+6.36)#76 | 5.8%(+7.26)#4,471 |
| 77. | 37175 | 12.9% | 6.7%(+6.15)#77 | 5.8%(+7.05)#4,611 |
| 78. | 37317 | 12.7% | 6.7%(+5.99)#78 | 5.8%(+6.88)#4,731 |
| 79. | 37863 | 12.7% | 6.7%(+5.95)#79 | 5.8%(+6.84)#4,759 |
| 80. | 37738 | 12.6% | 6.7%(+5.85)#80 | 5.8%(+6.74)#4,844 |
| 81. | 37183 | 12.5% | 6.7%(+5.83)#81 | 5.8%(+6.72)#4,856 |
| 82. | 37337 | 12.3% | 6.7%(+5.60)#82 | 5.8%(+6.50)#5,029 |
| 83. | 37866 | 12.2% | 6.7%(+5.53)#83 | 5.8%(+6.42)#5,082 |
| 84. | 37870 | 12.2% | 6.7%(+5.51)#84 | 5.8%(+6.40)#5,103 |
| 85. | 38573 | 12.2% | 6.7%(+5.48)#85 | 5.8%(+6.37)#5,132 |
| 86. | 38390 | 12.2% | 6.7%(+5.47)#86 | 5.8%(+6.37)#5,133 |
| 87. | 37885 | 12.1% | 6.7%(+5.42)#87 | 5.8%(+6.32)#5,183 |
| 88. | 38463 | 12.1% | 6.7%(+5.40)#88 | 5.8%(+6.29)#5,194 |
| 89. | 37404 | 12.1% | 6.7%(+5.37)#89 | 5.8%(+6.26)#5,225 |
| 90. | 38339 | 12.0% | 6.7%(+5.29)#90 | 5.8%(+6.18)#5,293 |
| 91. | 37026 | 11.9% | 6.7%(+5.18)#91 | 5.8%(+6.07)#5,363 |
| 92. | 37329 | 11.8% | 6.7%(+5.13)#92 | 5.8%(+6.02)#5,410 |
| 93. | 38006 | 11.8% | 6.7%(+5.08)#93 | 5.8%(+5.97)#5,467 |
| 94. | 37048 | 11.8% | 6.7%(+5.05)#94 | 5.8%(+5.95)#5,488 |
| 95. | 38363 | 11.7% | 6.7%(+5.01)#95 | 5.8%(+5.90)#5,522 |
| 96. | 37352 | 11.6% | 6.7%(+4.94)#96 | 5.8%(+5.83)#5,576 |
| 97. | 37178 | 11.6% | 6.7%(+4.88)#97 | 5.8%(+5.77)#5,628 |
| 98. | 37137 | 11.6% | 6.7%(+4.86)#98 | 5.8%(+5.76)#5,641 |
| 99. | 38575 | 11.5% | 6.7%(+4.78)#99 | 5.8%(+5.68)#5,715 |
| 100. | 38380 | 11.5% | 6.7%(+4.74)#100 | 5.8%(+5.63)#5,765 |
Common Questions
What are the Top 10 Zip Codes with the Highest Percentage of Self-Employed / Not Incorporated in Tennessee?
Top 10 Zip Codes with the Highest Percentage of Self-Employed / Not Incorporated in Tennessee are:
What zip code has the Highest Percentage of Self-Employed / Not Incorporated in Tennessee?
37845 has the Highest Percentage of Self-Employed / Not Incorporated in Tennessee with 100.0%.
What is the Percentage of Self-Employed / Not Incorporated in the State of Tennessee?
Percentage of Self-Employed / Not Incorporated in Tennessee is 6.7%.
What is the Percentage of Self-Employed / Not Incorporated in the United States?
Percentage of Self-Employed / Not Incorporated in the United States is 5.8%.