Zip Codes with the Highest Percentage of Self-Employed / Not Incorporated in Texas
RELATED REPORTS & OPTIONS
Self-Employed / Not Incorporated
Texas
Compare Zip Codes
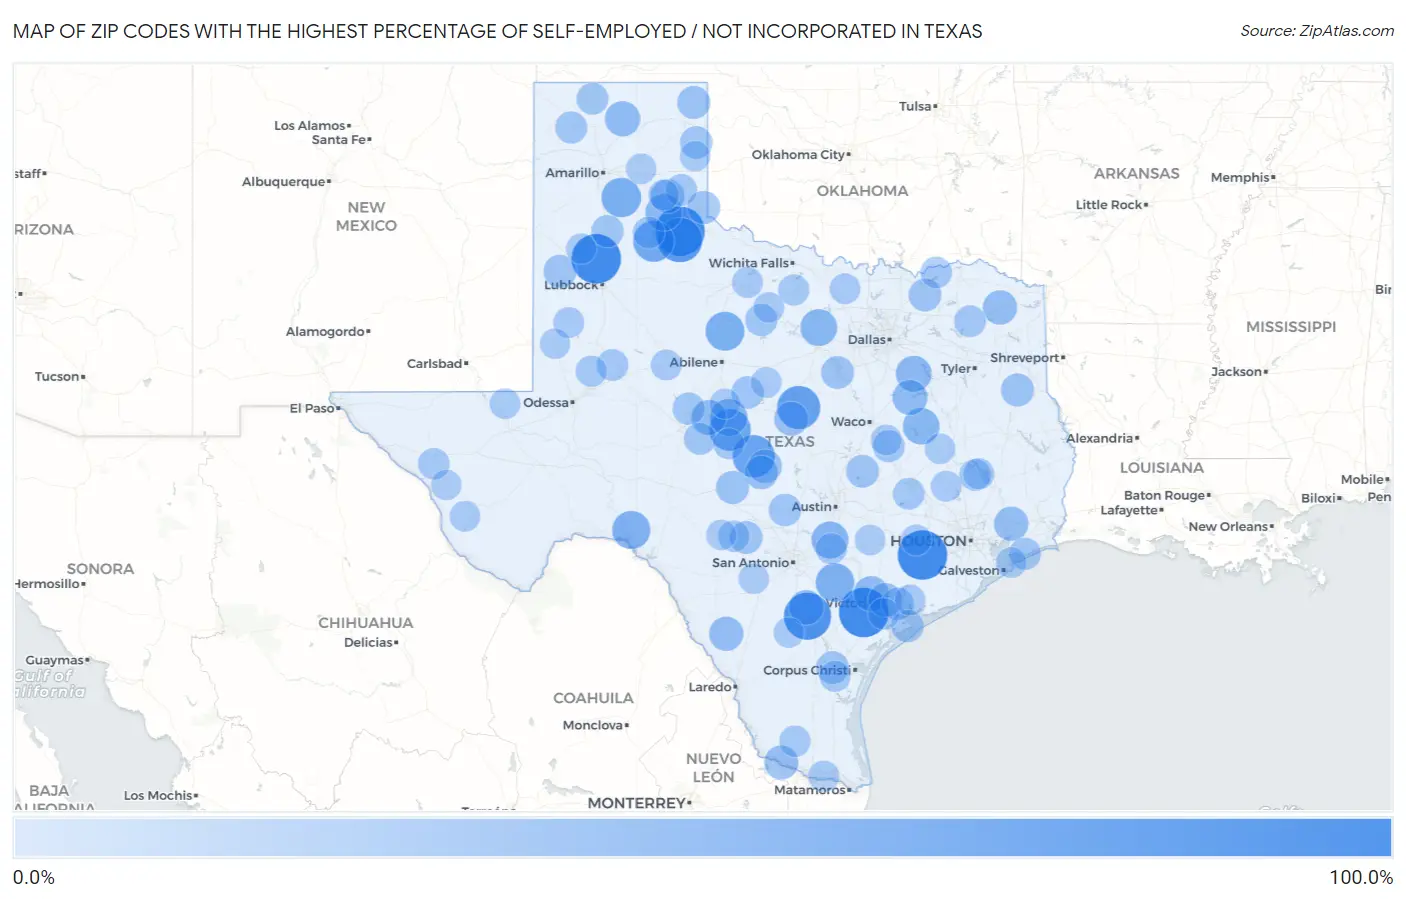
Map of Zip Codes with the Highest Percentage of Self-Employed / Not Incorporated in Texas
0.0%
100.0%
Zip Codes with the Highest Percentage of Self-Employed / Not Incorporated in Texas
| Zip Code | % Self-Employed / Not Incorporated | vs State | vs National | |
| 1. | 77454 | 100.0% | 6.7%(+93.3)#1 | 5.8%(+94.2)#9 |
| 2. | 79259 | 100.0% | 6.7%(+93.3)#2 | 5.8%(+94.2)#28 |
| 3. | 77960 | 100.0% | 6.7%(+93.3)#3 | 5.8%(+94.2)#29 |
| 4. | 79073 | 100.0% | 6.7%(+93.3)#4 | 5.8%(+94.2)#39 |
| 5. | 78075 | 90.2% | 6.7%(+83.5)#5 | 5.8%(+84.4)#57 |
| 6. | 79223 | 79.2% | 6.7%(+72.5)#6 | 5.8%(+73.4)#76 |
| 7. | 76452 | 72.7% | 6.7%(+66.0)#7 | 5.8%(+66.9)#92 |
| 8. | 76887 | 69.2% | 6.7%(+62.5)#8 | 5.8%(+63.4)#101 |
| 9. | 76836 | 66.7% | 6.7%(+59.9)#9 | 5.8%(+60.9)#114 |
| 10. | 79234 | 63.9% | 6.7%(+57.2)#10 | 5.8%(+58.1)#123 |
| 11. | 79094 | 57.1% | 6.7%(+50.4)#11 | 5.8%(+51.3)#158 |
| 12. | 79503 | 54.5% | 6.7%(+47.8)#12 | 5.8%(+48.7)#172 |
| 13. | 78116 | 53.6% | 6.7%(+46.8)#13 | 5.8%(+47.8)#180 |
| 14. | 78837 | 51.6% | 6.7%(+44.9)#14 | 5.8%(+45.8)#202 |
| 15. | 76888 | 47.9% | 6.7%(+41.2)#15 | 5.8%(+42.1)#255 |
| 16. | 78670 | 46.9% | 6.7%(+40.2)#16 | 5.8%(+41.1)#271 |
| 17. | 79239 | 46.3% | 6.7%(+39.6)#17 | 5.8%(+40.5)#281 |
| 18. | 76490 | 46.2% | 6.7%(+39.4)#18 | 5.8%(+40.3)#284 |
| 19. | 75838 | 45.3% | 6.7%(+38.6)#19 | 5.8%(+39.5)#298 |
| 20. | 75105 | 42.1% | 6.7%(+35.4)#20 | 5.8%(+36.3)#359 |
| 21. | 79062 | 39.4% | 6.7%(+32.7)#21 | 5.8%(+33.6)#423 |
| 22. | 77976 | 39.3% | 6.7%(+32.6)#22 | 5.8%(+33.5)#426 |
| 23. | 76875 | 39.1% | 6.7%(+32.4)#23 | 5.8%(+33.3)#427 |
| 24. | 76681 | 39.0% | 6.7%(+32.2)#24 | 5.8%(+33.2)#433 |
| 25. | 78008 | 37.3% | 6.7%(+30.6)#25 | 5.8%(+31.5)#481 |
| 26. | 75558 | 36.2% | 6.7%(+29.5)#26 | 5.8%(+30.4)#522 |
| 27. | 78836 | 36.0% | 6.7%(+29.3)#27 | 5.8%(+30.2)#530 |
| 28. | 77582 | 35.8% | 6.7%(+29.1)#28 | 5.8%(+30.0)#536 |
| 29. | 76870 | 35.1% | 6.7%(+28.4)#29 | 5.8%(+29.3)#554 |
| 30. | 78547 | 34.8% | 6.7%(+28.1)#30 | 5.8%(+29.0)#561 |
| 31. | 77988 | 34.3% | 6.7%(+27.5)#31 | 5.8%(+28.5)#574 |
| 32. | 79237 | 33.5% | 6.7%(+26.7)#32 | 5.8%(+27.6)#598 |
| 33. | 76869 | 33.3% | 6.7%(+26.6)#33 | 5.8%(+27.5)#604 |
| 34. | 76820 | 32.8% | 6.7%(+26.1)#34 | 5.8%(+27.0)#639 |
| 35. | 76854 | 30.9% | 6.7%(+24.1)#35 | 5.8%(+25.1)#722 |
| 36. | 79056 | 30.8% | 6.7%(+24.0)#36 | 5.8%(+25.0)#731 |
| 37. | 75669 | 30.6% | 6.7%(+23.9)#37 | 5.8%(+24.8)#739 |
| 38. | 79230 | 30.0% | 6.7%(+23.3)#38 | 5.8%(+24.2)#772 |
| 39. | 79353 | 30.0% | 6.7%(+23.3)#39 | 5.8%(+24.2)#774 |
| 40. | 75413 | 29.9% | 6.7%(+23.1)#40 | 5.8%(+24.1)#777 |
| 41. | 76077 | 29.7% | 6.7%(+23.0)#41 | 5.8%(+23.9)#785 |
| 42. | 78055 | 29.7% | 6.7%(+23.0)#42 | 5.8%(+23.9)#788 |
| 43. | 76523 | 29.6% | 6.7%(+22.8)#43 | 5.8%(+23.8)#795 |
| 44. | 78339 | 28.9% | 6.7%(+22.2)#44 | 5.8%(+23.1)#829 |
| 45. | 76828 | 28.6% | 6.7%(+21.8)#45 | 5.8%(+22.8)#854 |
| 46. | 79011 | 28.4% | 6.7%(+21.7)#46 | 5.8%(+22.6)#866 |
| 47. | 77969 | 28.4% | 6.7%(+21.6)#47 | 5.8%(+22.5)#870 |
| 48. | 78671 | 28.1% | 6.7%(+21.4)#48 | 5.8%(+22.3)#888 |
| 49. | 79052 | 28.0% | 6.7%(+21.2)#49 | 5.8%(+22.2)#897 |
| 50. | 77982 | 27.9% | 6.7%(+21.2)#50 | 5.8%(+22.1)#899 |
| 51. | 76953 | 27.5% | 6.7%(+20.8)#51 | 5.8%(+21.7)#925 |
| 52. | 76491 | 27.3% | 6.7%(+20.6)#52 | 5.8%(+21.5)#938 |
| 53. | 76955 | 26.9% | 6.7%(+20.1)#53 | 5.8%(+21.1)#967 |
| 54. | 79044 | 26.7% | 6.7%(+20.0)#54 | 5.8%(+20.9)#987 |
| 55. | 77623 | 26.2% | 6.7%(+19.5)#55 | 5.8%(+20.4)#1,025 |
| 56. | 76680 | 25.9% | 6.7%(+19.1)#56 | 5.8%(+20.1)#1,055 |
| 57. | 79084 | 25.6% | 6.7%(+18.9)#57 | 5.8%(+19.8)#1,088 |
| 58. | 79255 | 25.5% | 6.7%(+18.8)#58 | 5.8%(+19.7)#1,101 |
| 59. | 75471 | 25.5% | 6.7%(+18.7)#59 | 5.8%(+19.7)#1,107 |
| 60. | 77878 | 25.4% | 6.7%(+18.7)#60 | 5.8%(+19.6)#1,110 |
| 61. | 79748 | 25.2% | 6.7%(+18.5)#61 | 5.8%(+19.4)#1,124 |
| 62. | 79251 | 25.0% | 6.7%(+18.3)#62 | 5.8%(+19.2)#1,155 |
| 63. | 77359 | 24.6% | 6.7%(+17.8)#63 | 5.8%(+18.8)#1,198 |
| 64. | 75488 | 24.4% | 6.7%(+17.7)#64 | 5.8%(+18.6)#1,222 |
| 65. | 79855 | 23.8% | 6.7%(+17.1)#65 | 5.8%(+18.0)#1,272 |
| 66. | 78885 | 23.8% | 6.7%(+17.1)#66 | 5.8%(+18.0)#1,273 |
| 67. | 78536 | 23.7% | 6.7%(+17.0)#67 | 5.8%(+17.9)#1,280 |
| 68. | 77951 | 23.6% | 6.7%(+16.9)#68 | 5.8%(+17.8)#1,295 |
| 69. | 79783 | 23.1% | 6.7%(+16.3)#69 | 5.8%(+17.3)#1,345 |
| 70. | 78638 | 22.9% | 6.7%(+16.2)#70 | 5.8%(+17.1)#1,367 |
| 71. | 76389 | 22.6% | 6.7%(+15.8)#71 | 5.8%(+16.7)#1,407 |
| 72. | 77364 | 22.6% | 6.7%(+15.8)#72 | 5.8%(+16.7)#1,409 |
| 73. | 78351 | 22.5% | 6.7%(+15.8)#73 | 5.8%(+16.7)#1,414 |
| 74. | 76858 | 22.3% | 6.7%(+15.6)#74 | 5.8%(+16.5)#1,433 |
| 75. | 78579 | 22.2% | 6.7%(+15.5)#75 | 5.8%(+16.4)#1,451 |
| 76. | 76471 | 21.7% | 6.7%(+15.0)#76 | 5.8%(+15.9)#1,527 |
| 77. | 76380 | 21.6% | 6.7%(+14.9)#77 | 5.8%(+15.8)#1,535 |
| 78. | 79378 | 21.6% | 6.7%(+14.9)#78 | 5.8%(+15.8)#1,542 |
| 79. | 77970 | 21.6% | 6.7%(+14.8)#79 | 5.8%(+15.8)#1,550 |
| 80. | 79532 | 21.5% | 6.7%(+14.7)#80 | 5.8%(+15.6)#1,566 |
| 81. | 77873 | 21.3% | 6.7%(+14.6)#81 | 5.8%(+15.5)#1,589 |
| 82. | 79240 | 21.2% | 6.7%(+14.4)#82 | 5.8%(+15.4)#1,612 |
| 83. | 76661 | 21.0% | 6.7%(+14.3)#83 | 5.8%(+15.2)#1,630 |
| 84. | 76372 | 21.0% | 6.7%(+14.2)#84 | 5.8%(+15.2)#1,640 |
| 85. | 76239 | 21.0% | 6.7%(+14.2)#85 | 5.8%(+15.1)#1,643 |
| 86. | 78933 | 21.0% | 6.7%(+14.2)#86 | 5.8%(+15.1)#1,646 |
| 87. | 79843 | 20.9% | 6.7%(+14.1)#87 | 5.8%(+15.0)#1,663 |
| 88. | 79754 | 20.5% | 6.7%(+13.8)#88 | 5.8%(+14.7)#1,724 |
| 89. | 75850 | 20.4% | 6.7%(+13.7)#89 | 5.8%(+14.6)#1,734 |
| 90. | 79039 | 20.4% | 6.7%(+13.7)#90 | 5.8%(+14.6)#1,742 |
| 91. | 78941 | 20.3% | 6.7%(+13.6)#91 | 5.8%(+14.5)#1,750 |
| 92. | 78886 | 20.2% | 6.7%(+13.5)#92 | 5.8%(+14.4)#1,767 |
| 93. | 77650 | 20.2% | 6.7%(+13.5)#93 | 5.8%(+14.4)#1,769 |
| 94. | 79360 | 20.0% | 6.7%(+13.3)#94 | 5.8%(+14.2)#1,799 |
| 95. | 78072 | 20.0% | 6.7%(+13.3)#95 | 5.8%(+14.2)#1,810 |
| 96. | 76882 | 20.0% | 6.7%(+13.3)#96 | 5.8%(+14.2)#1,814 |
| 97. | 79854 | 20.0% | 6.7%(+13.3)#97 | 5.8%(+14.2)#1,820 |
| 98. | 79326 | 20.0% | 6.7%(+13.3)#98 | 5.8%(+14.2)#1,824 |
| 99. | 78873 | 19.9% | 6.7%(+13.2)#99 | 5.8%(+14.1)#1,838 |
| 100. | 79096 | 19.9% | 6.7%(+13.2)#100 | 5.8%(+14.1)#1,839 |
Common Questions
What are the Top 10 Zip Codes with the Highest Percentage of Self-Employed / Not Incorporated in Texas?
Top 10 Zip Codes with the Highest Percentage of Self-Employed / Not Incorporated in Texas are:
What zip code has the Highest Percentage of Self-Employed / Not Incorporated in Texas?
77454 has the Highest Percentage of Self-Employed / Not Incorporated in Texas with 100.0%.
What is the Percentage of Self-Employed / Not Incorporated in the State of Texas?
Percentage of Self-Employed / Not Incorporated in Texas is 6.7%.
What is the Percentage of Self-Employed / Not Incorporated in the United States?
Percentage of Self-Employed / Not Incorporated in the United States is 5.8%.