Zip Codes with the Highest Percentage of Self-Employed / Not Incorporated in Nebraska
RELATED REPORTS & OPTIONS
Self-Employed / Not Incorporated
Nebraska
Compare Zip Codes
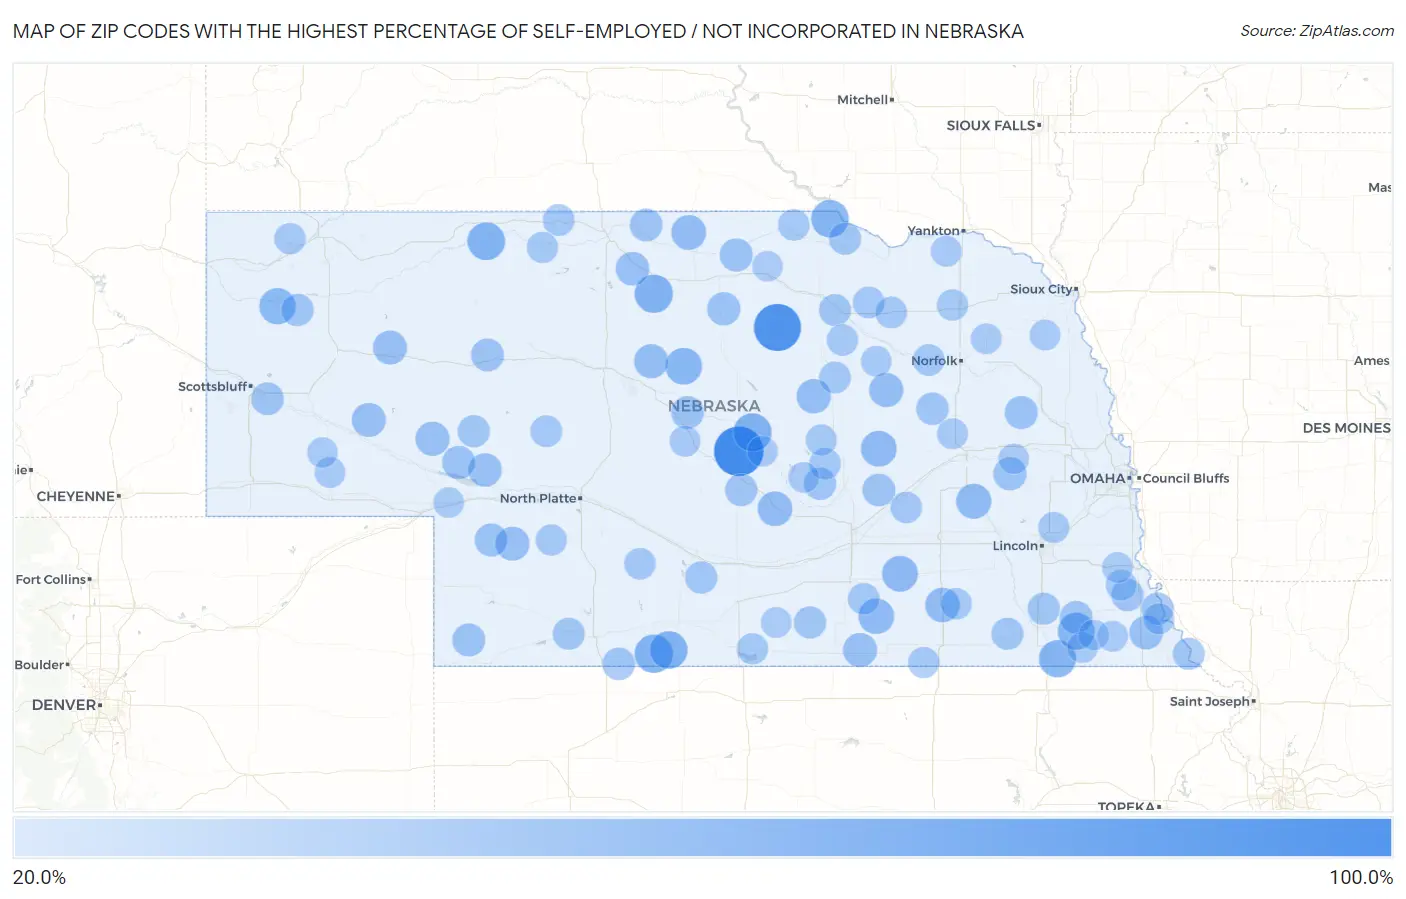
Map of Zip Codes with the Highest Percentage of Self-Employed / Not Incorporated in Nebraska
20.0%
100.0%
Zip Codes with the Highest Percentage of Self-Employed / Not Incorporated in Nebraska
| Zip Code | % Self-Employed / Not Incorporated | vs State | vs National | |
| 1. | 68881 | 100.0% | 6.3%(+93.7)#1 | 5.8%(+94.2)#15 |
| 2. | 68711 | 90.0% | 6.3%(+83.7)#2 | 5.8%(+84.2)#58 |
| 3. | 69046 | 52.2% | 6.3%(+45.9)#3 | 5.8%(+46.4)#193 |
| 4. | 68828 | 52.1% | 6.3%(+45.8)#4 | 5.8%(+46.3)#196 |
| 5. | 69214 | 52.1% | 6.3%(+45.8)#5 | 5.8%(+46.3)#197 |
| 6. | 69218 | 50.0% | 6.3%(+43.7)#6 | 5.8%(+44.2)#214 |
| 7. | 68946 | 50.0% | 6.3%(+43.7)#7 | 5.8%(+44.2)#230 |
| 8. | 68719 | 49.0% | 6.3%(+42.7)#8 | 5.8%(+43.2)#242 |
| 9. | 68309 | 48.0% | 6.3%(+41.7)#9 | 5.8%(+42.2)#253 |
| 10. | 68380 | 47.1% | 6.3%(+40.7)#10 | 5.8%(+41.2)#267 |
| 11. | 68821 | 45.8% | 6.3%(+39.5)#11 | 5.8%(+40.0)#289 |
| 12. | 69354 | 44.3% | 6.3%(+37.9)#12 | 5.8%(+38.4)#313 |
| 13. | 68975 | 42.6% | 6.3%(+36.3)#13 | 5.8%(+36.8)#348 |
| 14. | 68623 | 41.8% | 6.3%(+35.5)#14 | 5.8%(+36.0)#367 |
| 15. | 68934 | 41.3% | 6.3%(+35.0)#15 | 5.8%(+35.5)#376 |
| 16. | 68667 | 39.4% | 6.3%(+33.1)#16 | 5.8%(+33.6)#425 |
| 17. | 68778 | 38.0% | 6.3%(+31.7)#17 | 5.8%(+32.2)#459 |
| 18. | 68844 | 37.8% | 6.3%(+31.5)#18 | 5.8%(+32.0)#463 |
| 19. | 68444 | 37.5% | 6.3%(+31.2)#19 | 5.8%(+31.7)#475 |
| 20. | 68637 | 36.5% | 6.3%(+30.1)#20 | 5.8%(+30.6)#510 |
| 21. | 69157 | 35.6% | 6.3%(+29.3)#21 | 5.8%(+29.8)#541 |
| 22. | 68652 | 35.5% | 6.3%(+29.2)#22 | 5.8%(+29.7)#544 |
| 23. | 69147 | 35.3% | 6.3%(+29.0)#23 | 5.8%(+29.5)#550 |
| 24. | 68942 | 35.1% | 6.3%(+28.8)#24 | 5.8%(+29.3)#555 |
| 25. | 69148 | 35.0% | 6.3%(+28.7)#25 | 5.8%(+29.2)#557 |
| 26. | 69351 | 35.0% | 6.3%(+28.6)#26 | 5.8%(+29.1)#558 |
| 27. | 69134 | 34.6% | 6.3%(+28.3)#27 | 5.8%(+28.8)#563 |
| 28. | 68442 | 33.8% | 6.3%(+27.4)#28 | 5.8%(+28.0)#584 |
| 29. | 69221 | 33.3% | 6.3%(+27.0)#29 | 5.8%(+27.5)#611 |
| 30. | 69144 | 33.0% | 6.3%(+26.7)#30 | 5.8%(+27.2)#628 |
| 31. | 69146 | 31.9% | 6.3%(+25.6)#31 | 5.8%(+26.1)#676 |
| 32. | 68714 | 31.9% | 6.3%(+25.6)#32 | 5.8%(+26.1)#677 |
| 33. | 68014 | 31.6% | 6.3%(+25.3)#33 | 5.8%(+25.8)#688 |
| 34. | 69041 | 31.0% | 6.3%(+24.7)#34 | 5.8%(+25.2)#718 |
| 35. | 69150 | 31.0% | 6.3%(+24.7)#35 | 5.8%(+25.2)#719 |
| 36. | 68759 | 31.0% | 6.3%(+24.7)#36 | 5.8%(+25.2)#720 |
| 37. | 68633 | 30.9% | 6.3%(+24.6)#37 | 5.8%(+25.1)#723 |
| 38. | 69366 | 30.5% | 6.3%(+24.2)#38 | 5.8%(+24.7)#746 |
| 39. | 68332 | 30.4% | 6.3%(+24.1)#39 | 5.8%(+24.6)#747 |
| 40. | 68813 | 29.8% | 6.3%(+23.5)#40 | 5.8%(+24.0)#783 |
| 41. | 69355 | 29.5% | 6.3%(+23.2)#41 | 5.8%(+23.7)#797 |
| 42. | 69220 | 29.4% | 6.3%(+23.1)#42 | 5.8%(+23.6)#807 |
| 43. | 68816 | 29.3% | 6.3%(+23.0)#43 | 5.8%(+23.5)#812 |
| 44. | 69026 | 29.0% | 6.3%(+22.7)#44 | 5.8%(+23.2)#823 |
| 45. | 68644 | 28.9% | 6.3%(+22.6)#45 | 5.8%(+23.1)#827 |
| 46. | 68320 | 28.6% | 6.3%(+22.3)#46 | 5.8%(+22.8)#852 |
| 47. | 68321 | 28.5% | 6.3%(+22.2)#47 | 5.8%(+22.7)#862 |
| 48. | 68838 | 28.5% | 6.3%(+22.2)#48 | 5.8%(+22.7)#863 |
| 49. | 69348 | 28.4% | 6.3%(+22.1)#49 | 5.8%(+22.6)#867 |
| 50. | 68976 | 27.8% | 6.3%(+21.5)#50 | 5.8%(+22.0)#907 |
| 51. | 68855 | 27.7% | 6.3%(+21.4)#51 | 5.8%(+21.9)#909 |
| 52. | 68932 | 27.4% | 6.3%(+21.1)#52 | 5.8%(+21.6)#933 |
| 53. | 68422 | 27.4% | 6.3%(+21.0)#53 | 5.8%(+21.5)#936 |
| 54. | 69121 | 27.3% | 6.3%(+21.0)#54 | 5.8%(+21.5)#937 |
| 55. | 68746 | 26.8% | 6.3%(+20.4)#55 | 5.8%(+20.9)#975 |
| 56. | 68377 | 26.7% | 6.3%(+20.4)#56 | 5.8%(+20.9)#979 |
| 57. | 68742 | 26.5% | 6.3%(+20.1)#57 | 5.8%(+20.6)#1,003 |
| 58. | 69024 | 26.5% | 6.3%(+20.1)#58 | 5.8%(+20.6)#1,004 |
| 59. | 68431 | 26.4% | 6.3%(+20.1)#59 | 5.8%(+20.6)#1,008 |
| 60. | 68764 | 25.8% | 6.3%(+19.5)#60 | 5.8%(+20.0)#1,069 |
| 61. | 69216 | 25.7% | 6.3%(+19.4)#61 | 5.8%(+19.9)#1,078 |
| 62. | 68622 | 25.7% | 6.3%(+19.4)#62 | 5.8%(+19.9)#1,079 |
| 63. | 69167 | 25.5% | 6.3%(+19.2)#63 | 5.8%(+19.7)#1,103 |
| 64. | 68720 | 25.4% | 6.3%(+19.1)#64 | 5.8%(+19.6)#1,112 |
| 65. | 68752 | 25.3% | 6.3%(+18.9)#65 | 5.8%(+19.5)#1,122 |
| 66. | 68941 | 25.2% | 6.3%(+18.9)#66 | 5.8%(+19.4)#1,125 |
| 67. | 68835 | 25.2% | 6.3%(+18.8)#67 | 5.8%(+19.3)#1,132 |
| 68. | 69029 | 25.0% | 6.3%(+18.7)#68 | 5.8%(+19.2)#1,144 |
| 69. | 68846 | 24.6% | 6.3%(+18.3)#69 | 5.8%(+18.8)#1,201 |
| 70. | 68735 | 24.2% | 6.3%(+17.9)#70 | 5.8%(+18.4)#1,234 |
| 71. | 68722 | 24.1% | 6.3%(+17.8)#71 | 5.8%(+18.3)#1,239 |
| 72. | 69367 | 23.9% | 6.3%(+17.5)#72 | 5.8%(+18.0)#1,269 |
| 73. | 68747 | 23.7% | 6.3%(+17.4)#73 | 5.8%(+17.9)#1,284 |
| 74. | 68416 | 23.6% | 6.3%(+17.3)#74 | 5.8%(+17.8)#1,294 |
| 75. | 69219 | 23.5% | 6.3%(+17.2)#75 | 5.8%(+17.7)#1,307 |
| 76. | 69132 | 23.2% | 6.3%(+16.9)#76 | 5.8%(+17.4)#1,331 |
| 77. | 68325 | 23.1% | 6.3%(+16.8)#77 | 5.8%(+17.3)#1,344 |
| 78. | 68971 | 22.9% | 6.3%(+16.6)#78 | 5.8%(+17.1)#1,359 |
| 79. | 68875 | 22.9% | 6.3%(+16.6)#79 | 5.8%(+17.1)#1,361 |
| 80. | 68517 | 22.8% | 6.3%(+16.5)#80 | 5.8%(+17.0)#1,379 |
| 81. | 68448 | 22.6% | 6.3%(+16.2)#81 | 5.8%(+16.7)#1,408 |
| 82. | 68414 | 22.2% | 6.3%(+15.9)#82 | 5.8%(+16.4)#1,444 |
| 83. | 68856 | 22.2% | 6.3%(+15.8)#83 | 5.8%(+16.3)#1,457 |
| 84. | 68447 | 22.0% | 6.3%(+15.7)#84 | 5.8%(+16.2)#1,477 |
| 85. | 68730 | 21.9% | 6.3%(+15.6)#85 | 5.8%(+16.1)#1,482 |
| 86. | 68653 | 21.8% | 6.3%(+15.5)#86 | 5.8%(+16.0)#1,510 |
| 87. | 69141 | 21.8% | 6.3%(+15.4)#87 | 5.8%(+15.9)#1,515 |
| 88. | 68790 | 21.7% | 6.3%(+15.4)#88 | 5.8%(+15.9)#1,523 |
| 89. | 68636 | 21.6% | 6.3%(+15.3)#89 | 5.8%(+15.8)#1,546 |
| 90. | 68062 | 21.5% | 6.3%(+15.2)#90 | 5.8%(+15.7)#1,553 |
| 91. | 68817 | 21.3% | 6.3%(+15.0)#91 | 5.8%(+15.5)#1,590 |
| 92. | 68323 | 21.2% | 6.3%(+14.9)#92 | 5.8%(+15.4)#1,610 |
| 93. | 68947 | 21.1% | 6.3%(+14.8)#93 | 5.8%(+15.3)#1,624 |
| 94. | 68346 | 21.1% | 6.3%(+14.8)#94 | 5.8%(+15.3)#1,626 |
| 95. | 68780 | 21.0% | 6.3%(+14.7)#95 | 5.8%(+15.2)#1,631 |
| 96. | 69127 | 21.0% | 6.3%(+14.7)#96 | 5.8%(+15.2)#1,634 |
| 97. | 68815 | 20.9% | 6.3%(+14.6)#97 | 5.8%(+15.1)#1,649 |
| 98. | 69131 | 20.8% | 6.3%(+14.5)#98 | 5.8%(+15.0)#1,677 |
| 99. | 68441 | 20.5% | 6.3%(+14.1)#99 | 5.8%(+14.6)#1,730 |
| 100. | 68036 | 20.3% | 6.3%(+14.0)#100 | 5.8%(+14.5)#1,756 |
Common Questions
What are the Top 10 Zip Codes with the Highest Percentage of Self-Employed / Not Incorporated in Nebraska?
Top 10 Zip Codes with the Highest Percentage of Self-Employed / Not Incorporated in Nebraska are:
What zip code has the Highest Percentage of Self-Employed / Not Incorporated in Nebraska?
68881 has the Highest Percentage of Self-Employed / Not Incorporated in Nebraska with 100.0%.
What is the Percentage of Self-Employed / Not Incorporated in the State of Nebraska?
Percentage of Self-Employed / Not Incorporated in Nebraska is 6.3%.
What is the Percentage of Self-Employed / Not Incorporated in the United States?
Percentage of Self-Employed / Not Incorporated in the United States is 5.8%.