Zip Codes with the Highest Percentage of Self-Employed / Not Incorporated in Lexington, KY
RELATED REPORTS & OPTIONS
Self-Employed / Not Incorporated
Lexington
Compare Zip Codes
Map of Zip Codes with the Highest Percentage of Self-Employed / Not Incorporated in Lexington
0.43%
8.0%
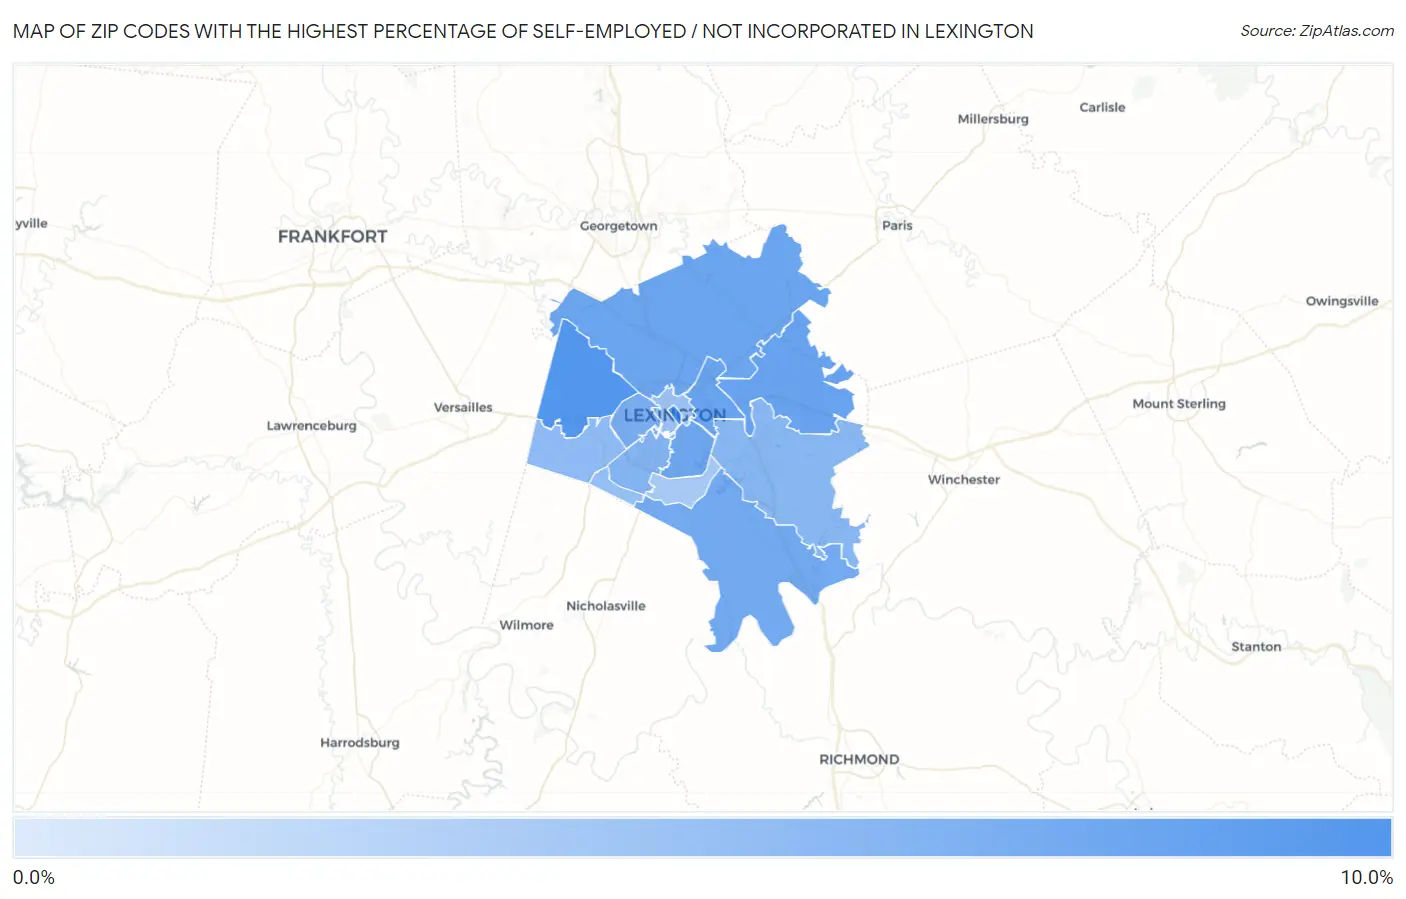
Zip Codes with the Highest Percentage of Self-Employed / Not Incorporated in Lexington, KY
| Zip Code | % Self-Employed / Not Incorporated | vs State | vs National | |
| 1. | 40507 | 8.0% | 5.1%(+2.87)#191 | 5.8%(+2.19)#10,612 |
| 2. | 40510 | 7.4% | 5.1%(+2.28)#219 | 5.8%(+1.60)#11,992 |
| 3. | 40516 | 6.4% | 5.1%(+1.23)#252 | 5.8%(+0.552)#14,878 |
| 4. | 40505 | 6.2% | 5.1%(+1.03)#260 | 5.8%(+0.355)#15,513 |
| 5. | 40511 | 6.1% | 5.1%(+0.921)#265 | 5.8%(+0.245)#15,851 |
| 6. | 40502 | 6.0% | 5.1%(+0.888)#268 | 5.8%(+0.212)#15,978 |
| 7. | 40515 | 5.7% | 5.1%(+0.608)#281 | 5.8%(-0.068)#16,867 |
| 8. | 40504 | 5.4% | 5.1%(+0.229)#317 | 5.8%(-0.447)#18,254 |
| 9. | 40503 | 4.9% | 5.1%(-0.227)#347 | 5.8%(-0.903)#20,006 |
| 10. | 40509 | 4.6% | 5.1%(-0.521)#366 | 5.8%(-1.20)#21,099 |
| 11. | 40513 | 4.3% | 5.1%(-0.854)#389 | 5.8%(-1.53)#22,381 |
| 12. | 40514 | 4.0% | 5.1%(-1.11)#406 | 5.8%(-1.79)#23,292 |
| 13. | 40508 | 3.6% | 5.1%(-1.52)#444 | 5.8%(-2.20)#24,653 |
| 14. | 40517 | 3.1% | 5.1%(-2.05)#477 | 5.8%(-2.72)#26,136 |
| 15. | 40526 | 0.43% | 5.1%(-4.71)#563 | 5.8%(-5.39)#29,423 |
1
Common Questions
What are the Top 10 Zip Codes with the Highest Percentage of Self-Employed / Not Incorporated in Lexington, KY?
Top 10 Zip Codes with the Highest Percentage of Self-Employed / Not Incorporated in Lexington, KY are:
What zip code has the Highest Percentage of Self-Employed / Not Incorporated in Lexington, KY?
40507 has the Highest Percentage of Self-Employed / Not Incorporated in Lexington, KY with 8.0%.
What is the Percentage of Self-Employed / Not Incorporated in Lexington, KY?
Percentage of Self-Employed / Not Incorporated in Lexington is 5.0%.
What is the Percentage of Self-Employed / Not Incorporated in Kentucky?
Percentage of Self-Employed / Not Incorporated in Kentucky is 5.1%.
What is the Percentage of Self-Employed / Not Incorporated in the United States?
Percentage of Self-Employed / Not Incorporated in the United States is 5.8%.