Zip Codes with the Highest Percentage of Self-Employed / Not Incorporated in Arkansas
RELATED REPORTS & OPTIONS
Self-Employed / Not Incorporated
Arkansas
Compare Zip Codes
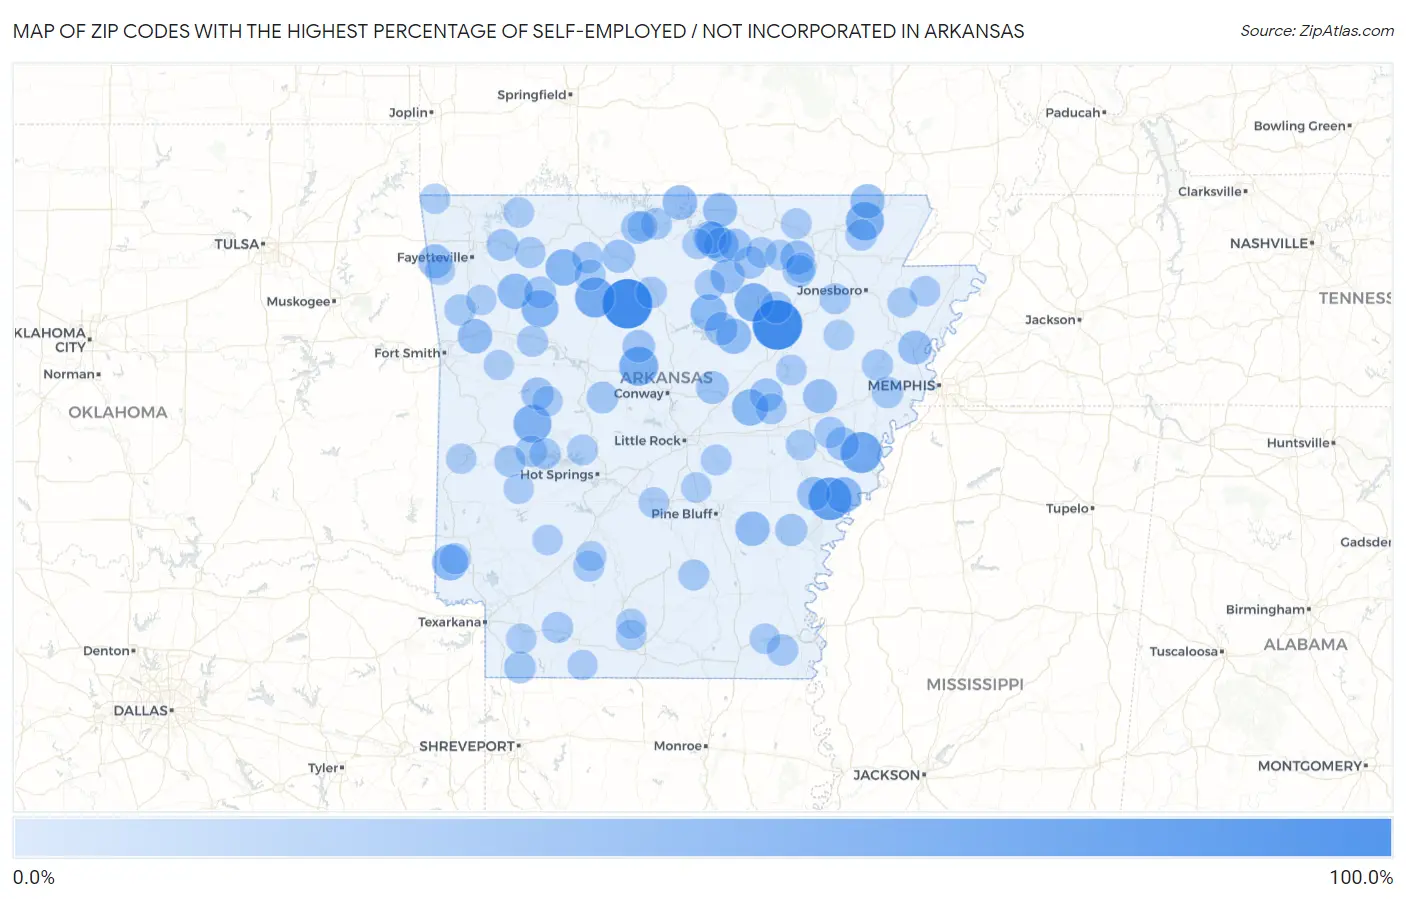
Map of Zip Codes with the Highest Percentage of Self-Employed / Not Incorporated in Arkansas
0.0%
100.0%
Zip Codes with the Highest Percentage of Self-Employed / Not Incorporated in Arkansas
| Zip Code | % Self-Employed / Not Incorporated | vs State | vs National | |
| 1. | 72165 | 100.0% | 6.3%(+93.7)#1 | 5.8%(+94.2)#12 |
| 2. | 72679 | 100.0% | 6.3%(+93.7)#2 | 5.8%(+94.2)#22 |
| 3. | 72353 | 68.2% | 6.3%(+61.9)#3 | 5.8%(+62.4)#104 |
| 4. | 72352 | 60.0% | 6.3%(+53.7)#4 | 5.8%(+54.2)#145 |
| 5. | 72856 | 55.3% | 6.3%(+49.0)#5 | 5.8%(+49.5)#166 |
| 6. | 72156 | 51.2% | 6.3%(+45.0)#6 | 5.8%(+45.4)#208 |
| 7. | 72527 | 49.0% | 6.3%(+42.8)#7 | 5.8%(+43.2)#241 |
| 8. | 72453 | 47.5% | 6.3%(+41.2)#8 | 5.8%(+41.7)#261 |
| 9. | 72827 | 46.7% | 6.3%(+40.4)#9 | 5.8%(+40.9)#278 |
| 10. | 72852 | 41.3% | 6.3%(+35.0)#10 | 5.8%(+35.5)#381 |
| 11. | 72670 | 39.8% | 6.3%(+33.6)#11 | 5.8%(+34.0)#410 |
| 12. | 72130 | 39.1% | 6.3%(+32.8)#12 | 5.8%(+33.2)#429 |
| 13. | 72066 | 38.7% | 6.3%(+32.4)#13 | 5.8%(+32.9)#444 |
| 14. | 71866 | 37.5% | 6.3%(+31.2)#14 | 5.8%(+31.7)#471 |
| 15. | 72585 | 36.4% | 6.3%(+30.1)#15 | 5.8%(+30.5)#513 |
| 16. | 72389 | 36.1% | 6.3%(+29.8)#16 | 5.8%(+30.3)#525 |
| 17. | 72721 | 33.8% | 6.3%(+27.5)#17 | 5.8%(+28.0)#583 |
| 18. | 72179 | 33.6% | 6.3%(+27.3)#18 | 5.8%(+27.8)#590 |
| 19. | 72517 | 32.8% | 6.3%(+26.5)#19 | 5.8%(+27.0)#638 |
| 20. | 72623 | 31.3% | 6.3%(+25.1)#20 | 5.8%(+25.5)#706 |
| 21. | 72935 | 31.1% | 6.3%(+24.8)#21 | 5.8%(+25.2)#716 |
| 22. | 71644 | 30.8% | 6.3%(+24.5)#22 | 5.8%(+25.0)#725 |
| 23. | 72470 | 30.1% | 6.3%(+23.8)#23 | 5.8%(+24.3)#762 |
| 24. | 72540 | 30.0% | 6.3%(+23.7)#24 | 5.8%(+24.2)#770 |
| 25. | 72583 | 29.3% | 6.3%(+23.1)#25 | 5.8%(+23.5)#810 |
| 26. | 72466 | 28.8% | 6.3%(+22.5)#26 | 5.8%(+23.0)#832 |
| 27. | 72074 | 28.7% | 6.3%(+22.5)#27 | 5.8%(+22.9)#838 |
| 28. | 72769 | 28.6% | 6.3%(+22.3)#28 | 5.8%(+22.8)#850 |
| 29. | 72339 | 27.7% | 6.3%(+21.4)#29 | 5.8%(+21.8)#913 |
| 30. | 72140 | 25.8% | 6.3%(+19.5)#30 | 5.8%(+20.0)#1,065 |
| 31. | 72566 | 25.1% | 6.3%(+18.9)#31 | 5.8%(+19.3)#1,134 |
| 32. | 72581 | 25.1% | 6.3%(+18.9)#32 | 5.8%(+19.3)#1,135 |
| 33. | 72311 | 25.0% | 6.3%(+18.7)#33 | 5.8%(+19.2)#1,154 |
| 34. | 72060 | 24.9% | 6.3%(+18.6)#34 | 5.8%(+19.1)#1,167 |
| 35. | 72669 | 24.5% | 6.3%(+18.2)#35 | 5.8%(+18.7)#1,207 |
| 36. | 72045 | 23.7% | 6.3%(+17.4)#36 | 5.8%(+17.8)#1,291 |
| 37. | 72677 | 23.0% | 6.3%(+16.7)#37 | 5.8%(+17.2)#1,355 |
| 38. | 72584 | 22.6% | 6.3%(+16.3)#38 | 5.8%(+16.8)#1,401 |
| 39. | 72030 | 22.4% | 6.3%(+16.2)#39 | 5.8%(+16.6)#1,421 |
| 40. | 72842 | 21.9% | 6.3%(+15.6)#40 | 5.8%(+16.1)#1,496 |
| 41. | 72577 | 21.4% | 6.3%(+15.1)#41 | 5.8%(+15.6)#1,577 |
| 42. | 72469 | 20.5% | 6.3%(+14.3)#42 | 5.8%(+14.7)#1,721 |
| 43. | 72055 | 20.0% | 6.3%(+13.7)#43 | 5.8%(+14.2)#1,807 |
| 44. | 72738 | 19.7% | 6.3%(+13.4)#44 | 5.8%(+13.9)#1,876 |
| 45. | 72752 | 19.4% | 6.3%(+13.2)#45 | 5.8%(+13.6)#1,927 |
| 46. | 72553 | 19.2% | 6.3%(+12.9)#46 | 5.8%(+13.4)#1,970 |
| 47. | 71826 | 18.8% | 6.3%(+12.6)#47 | 5.8%(+13.0)#2,079 |
| 48. | 72025 | 18.6% | 6.3%(+12.3)#48 | 5.8%(+12.7)#2,155 |
| 49. | 72346 | 17.5% | 6.3%(+11.3)#49 | 5.8%(+11.7)#2,454 |
| 50. | 71969 | 17.4% | 6.3%(+11.2)#50 | 5.8%(+11.6)#2,485 |
| 51. | 72645 | 17.4% | 6.3%(+11.1)#51 | 5.8%(+11.6)#2,509 |
| 52. | 71961 | 17.1% | 6.3%(+10.8)#52 | 5.8%(+11.3)#2,598 |
| 53. | 72626 | 17.0% | 6.3%(+10.8)#53 | 5.8%(+11.2)#2,623 |
| 54. | 71663 | 16.9% | 6.3%(+10.6)#54 | 5.8%(+11.0)#2,674 |
| 55. | 72425 | 16.8% | 6.3%(+10.6)#55 | 5.8%(+11.0)#2,679 |
| 56. | 72368 | 16.8% | 6.3%(+10.5)#56 | 5.8%(+10.9)#2,704 |
| 57. | 72648 | 16.6% | 6.3%(+10.3)#57 | 5.8%(+10.8)#2,780 |
| 58. | 71970 | 16.3% | 6.3%(+10.0)#58 | 5.8%(+10.5)#2,860 |
| 59. | 72373 | 16.2% | 6.3%(+9.95)#59 | 5.8%(+10.4)#2,888 |
| 60. | 72934 | 16.1% | 6.3%(+9.78)#60 | 5.8%(+10.3)#2,944 |
| 61. | 71827 | 15.8% | 6.3%(+9.54)#61 | 5.8%(+10.0)#3,060 |
| 62. | 71842 | 15.8% | 6.3%(+9.50)#62 | 5.8%(+9.96)#3,086 |
| 63. | 72840 | 15.8% | 6.3%(+9.47)#63 | 5.8%(+9.94)#3,094 |
| 64. | 72683 | 15.7% | 6.3%(+9.43)#64 | 5.8%(+9.90)#3,111 |
| 65. | 71772 | 15.4% | 6.3%(+9.10)#65 | 5.8%(+9.57)#3,248 |
| 66. | 72040 | 15.2% | 6.3%(+8.96)#66 | 5.8%(+9.42)#3,313 |
| 67. | 71660 | 15.0% | 6.3%(+8.75)#67 | 5.8%(+9.21)#3,413 |
| 68. | 72740 | 15.0% | 6.3%(+8.69)#68 | 5.8%(+9.16)#3,433 |
| 69. | 72421 | 15.0% | 6.3%(+8.69)#69 | 5.8%(+9.15)#3,434 |
| 70. | 72029 | 14.7% | 6.3%(+8.45)#70 | 5.8%(+8.92)#3,551 |
| 71. | 71949 | 14.4% | 6.3%(+8.12)#71 | 5.8%(+8.58)#3,701 |
| 72. | 72083 | 14.3% | 6.3%(+8.00)#72 | 5.8%(+8.47)#3,746 |
| 73. | 72459 | 14.3% | 6.3%(+7.97)#73 | 5.8%(+8.44)#3,771 |
| 74. | 72532 | 14.2% | 6.3%(+7.91)#74 | 5.8%(+8.37)#3,808 |
| 75. | 71762 | 14.0% | 6.3%(+7.68)#75 | 5.8%(+8.14)#3,917 |
| 76. | 72006 | 13.7% | 6.3%(+7.39)#76 | 5.8%(+7.86)#4,082 |
| 77. | 71658 | 13.5% | 6.3%(+7.19)#77 | 5.8%(+7.66)#4,204 |
| 78. | 72129 | 13.4% | 6.3%(+7.16)#78 | 5.8%(+7.63)#4,221 |
| 79. | 72560 | 13.3% | 6.3%(+7.04)#79 | 5.8%(+7.51)#4,297 |
| 80. | 72833 | 13.3% | 6.3%(+7.03)#80 | 5.8%(+7.49)#4,306 |
| 81. | 72442 | 13.3% | 6.3%(+6.98)#81 | 5.8%(+7.44)#4,341 |
| 82. | 72519 | 13.2% | 6.3%(+6.91)#82 | 5.8%(+7.38)#4,398 |
| 83. | 72429 | 13.1% | 6.3%(+6.85)#83 | 5.8%(+7.32)#4,438 |
| 84. | 72569 | 12.9% | 6.3%(+6.63)#84 | 5.8%(+7.10)#4,572 |
| 85. | 72632 | 12.8% | 6.3%(+6.57)#85 | 5.8%(+7.03)#4,629 |
| 86. | 72744 | 12.8% | 6.3%(+6.49)#86 | 5.8%(+6.95)#4,675 |
| 87. | 72132 | 12.8% | 6.3%(+6.47)#87 | 5.8%(+6.94)#4,688 |
| 88. | 71940 | 12.7% | 6.3%(+6.43)#88 | 5.8%(+6.90)#4,721 |
| 89. | 71953 | 12.7% | 6.3%(+6.39)#89 | 5.8%(+6.85)#4,749 |
| 90. | 71839 | 12.6% | 6.3%(+6.33)#90 | 5.8%(+6.80)#4,795 |
| 91. | 71743 | 12.6% | 6.3%(+6.28)#91 | 5.8%(+6.75)#4,838 |
| 92. | 72959 | 12.5% | 6.3%(+6.23)#92 | 5.8%(+6.70)#4,869 |
| 93. | 72440 | 12.5% | 6.3%(+6.22)#93 | 5.8%(+6.68)#4,892 |
| 94. | 72687 | 12.4% | 6.3%(+6.10)#94 | 5.8%(+6.56)#4,988 |
| 95. | 71935 | 12.3% | 6.3%(+6.04)#95 | 5.8%(+6.51)#5,023 |
| 96. | 71751 | 12.2% | 6.3%(+5.94)#96 | 5.8%(+6.40)#5,106 |
| 97. | 72928 | 12.2% | 6.3%(+5.89)#97 | 5.8%(+6.36)#5,140 |
| 98. | 71740 | 12.1% | 6.3%(+5.82)#98 | 5.8%(+6.29)#5,204 |
| 99. | 72768 | 12.1% | 6.3%(+5.82)#99 | 5.8%(+6.29)#5,205 |
| 100. | 72419 | 12.1% | 6.3%(+5.81)#100 | 5.8%(+6.27)#5,215 |
Common Questions
What are the Top 10 Zip Codes with the Highest Percentage of Self-Employed / Not Incorporated in Arkansas?
Top 10 Zip Codes with the Highest Percentage of Self-Employed / Not Incorporated in Arkansas are:
What zip code has the Highest Percentage of Self-Employed / Not Incorporated in Arkansas?
72165 has the Highest Percentage of Self-Employed / Not Incorporated in Arkansas with 100.0%.
What is the Percentage of Self-Employed / Not Incorporated in the State of Arkansas?
Percentage of Self-Employed / Not Incorporated in Arkansas is 6.3%.
What is the Percentage of Self-Employed / Not Incorporated in the United States?
Percentage of Self-Employed / Not Incorporated in the United States is 5.8%.