Zip Codes with the Highest Percentage of Self-Employed / Not Incorporated in Montana
RELATED REPORTS & OPTIONS
Self-Employed / Not Incorporated
Montana
Compare Zip Codes
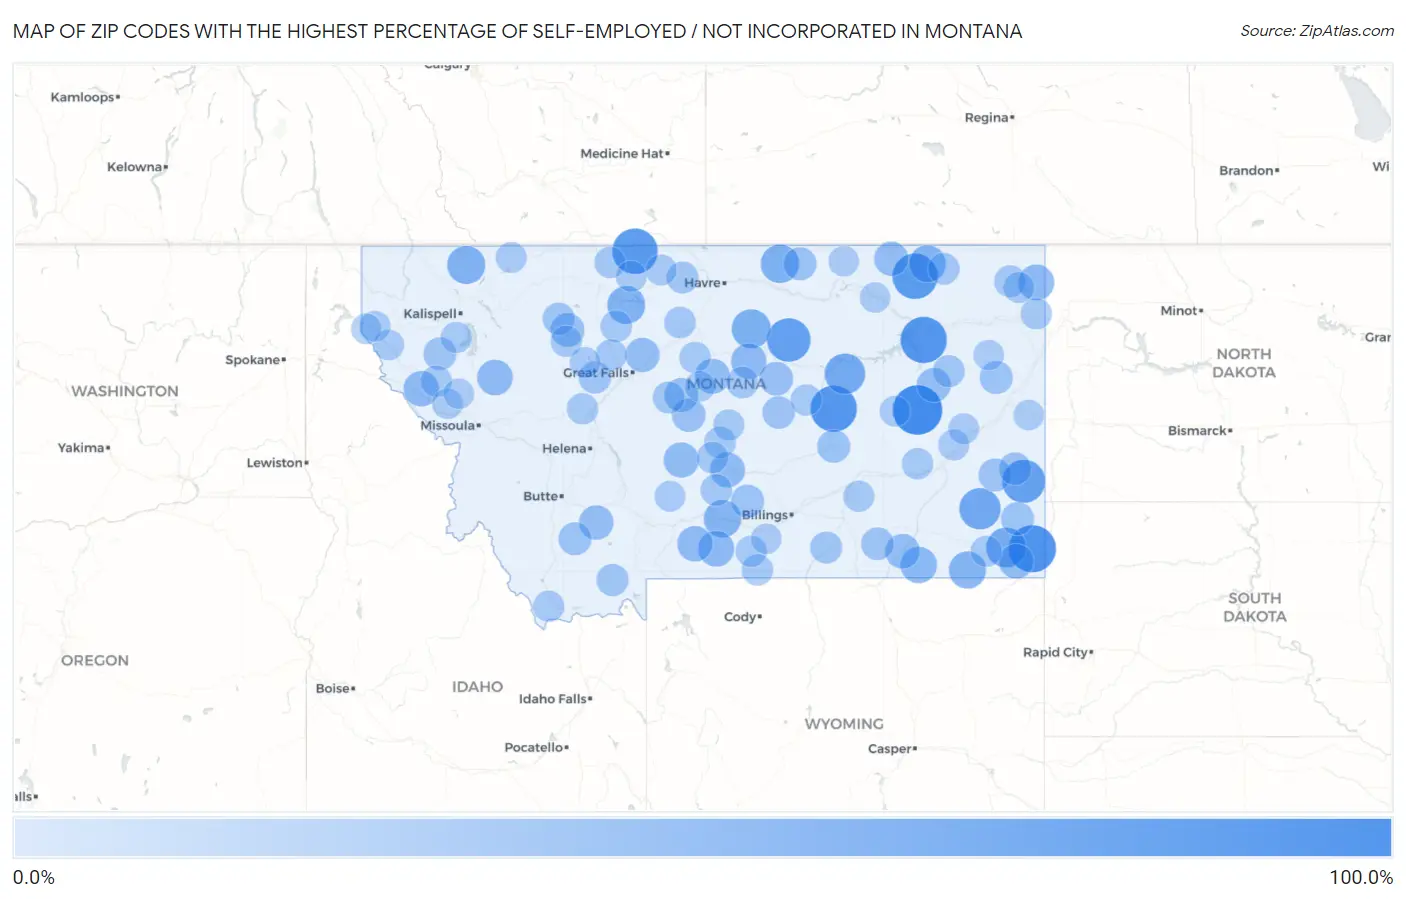
Map of Zip Codes with the Highest Percentage of Self-Employed / Not Incorporated in Montana
0.0%
100.0%
Zip Codes with the Highest Percentage of Self-Employed / Not Incorporated in Montana
| Zip Code | % Self-Employed / Not Incorporated | vs State | vs National | |
| 1. | 59312 | 100.0% | 8.8%(+91.2)#1 | 5.8%(+94.2)#44 |
| 2. | 59319 | 89.5% | 8.8%(+80.7)#2 | 5.8%(+83.7)#59 |
| 3. | 59223 | 85.7% | 8.8%(+76.9)#3 | 5.8%(+79.9)#63 |
| 4. | 59058 | 85.7% | 8.8%(+76.9)#4 | 5.8%(+79.9)#65 |
| 5. | 59244 | 81.5% | 8.8%(+72.7)#5 | 5.8%(+75.7)#72 |
| 6. | 59545 | 81.4% | 8.8%(+72.6)#6 | 5.8%(+75.6)#73 |
| 7. | 59546 | 73.9% | 8.8%(+65.1)#7 | 5.8%(+68.1)#90 |
| 8. | 59354 | 71.7% | 8.8%(+62.9)#8 | 5.8%(+65.9)#95 |
| 9. | 59345 | 64.3% | 8.8%(+55.5)#9 | 5.8%(+58.5)#120 |
| 10. | 59318 | 60.3% | 8.8%(+51.5)#10 | 5.8%(+54.5)#140 |
| 11. | 59332 | 58.2% | 8.8%(+49.4)#11 | 5.8%(+52.4)#149 |
| 12. | 59535 | 54.5% | 8.8%(+45.8)#12 | 5.8%(+48.7)#174 |
| 13. | 59529 | 52.0% | 8.8%(+43.2)#13 | 5.8%(+46.2)#198 |
| 14. | 59928 | 50.0% | 8.8%(+41.2)#14 | 5.8%(+44.2)#215 |
| 15. | 59456 | 49.4% | 8.8%(+40.6)#15 | 5.8%(+43.6)#239 |
| 16. | 59033 | 47.1% | 8.8%(+38.3)#16 | 5.8%(+41.2)#266 |
| 17. | 59314 | 46.3% | 8.8%(+37.6)#17 | 5.8%(+40.5)#282 |
| 18. | 59260 | 45.1% | 8.8%(+36.3)#18 | 5.8%(+39.3)#302 |
| 19. | 59062 | 42.9% | 8.8%(+34.1)#19 | 5.8%(+37.0)#341 |
| 20. | 59219 | 40.9% | 8.8%(+32.1)#20 | 5.8%(+35.1)#390 |
| 21. | 59061 | 40.6% | 8.8%(+31.8)#21 | 5.8%(+34.8)#396 |
| 22. | 59826 | 39.5% | 8.8%(+30.8)#22 | 5.8%(+33.7)#418 |
| 23. | 59489 | 38.8% | 8.8%(+30.1)#23 | 5.8%(+33.0)#436 |
| 24. | 59052 | 38.8% | 8.8%(+30.0)#24 | 5.8%(+33.0)#440 |
| 25. | 59866 | 38.4% | 8.8%(+29.7)#25 | 5.8%(+32.6)#450 |
| 26. | 59053 | 38.0% | 8.8%(+29.2)#26 | 5.8%(+32.1)#460 |
| 27. | 59430 | 37.1% | 8.8%(+28.3)#27 | 5.8%(+31.3)#487 |
| 28. | 59078 | 36.7% | 8.8%(+27.9)#28 | 5.8%(+30.9)#500 |
| 29. | 59311 | 35.9% | 8.8%(+27.1)#29 | 5.8%(+30.1)#534 |
| 30. | 59012 | 35.7% | 8.8%(+26.9)#30 | 5.8%(+29.9)#538 |
| 31. | 59747 | 34.4% | 8.8%(+25.6)#31 | 5.8%(+28.6)#569 |
| 32. | 59250 | 33.7% | 8.8%(+24.9)#32 | 5.8%(+27.9)#587 |
| 33. | 59440 | 33.6% | 8.8%(+24.8)#33 | 5.8%(+27.8)#595 |
| 34. | 59214 | 33.3% | 8.8%(+24.6)#34 | 5.8%(+27.5)#613 |
| 35. | 59447 | 32.2% | 8.8%(+23.5)#35 | 5.8%(+26.4)#663 |
| 36. | 59419 | 31.8% | 8.8%(+23.0)#36 | 5.8%(+26.0)#680 |
| 37. | 59471 | 31.5% | 8.8%(+22.8)#37 | 5.8%(+25.7)#694 |
| 38. | 59479 | 31.4% | 8.8%(+22.6)#38 | 5.8%(+25.6)#705 |
| 39. | 59067 | 29.2% | 8.8%(+20.4)#39 | 5.8%(+23.4)#816 |
| 40. | 59324 | 28.6% | 8.8%(+19.8)#40 | 5.8%(+22.8)#846 |
| 41. | 59542 | 28.6% | 8.8%(+19.8)#41 | 5.8%(+22.8)#853 |
| 42. | 59315 | 28.6% | 8.8%(+19.8)#42 | 5.8%(+22.8)#856 |
| 43. | 59754 | 28.2% | 8.8%(+19.4)#43 | 5.8%(+22.4)#880 |
| 44. | 59054 | 28.2% | 8.8%(+19.4)#44 | 5.8%(+22.3)#884 |
| 45. | 59848 | 28.0% | 8.8%(+19.2)#45 | 5.8%(+22.2)#895 |
| 46. | 59336 | 27.8% | 8.8%(+19.0)#46 | 5.8%(+22.0)#908 |
| 47. | 59016 | 26.9% | 8.8%(+18.1)#47 | 5.8%(+21.1)#964 |
| 48. | 59344 | 26.8% | 8.8%(+18.0)#48 | 5.8%(+21.0)#974 |
| 49. | 59032 | 26.6% | 8.8%(+17.8)#49 | 5.8%(+20.8)#996 |
| 50. | 59477 | 25.6% | 8.8%(+16.8)#50 | 5.8%(+19.8)#1,092 |
| 51. | 59432 | 25.0% | 8.8%(+16.2)#51 | 5.8%(+19.2)#1,148 |
| 52. | 59720 | 24.7% | 8.8%(+15.9)#52 | 5.8%(+18.9)#1,186 |
| 53. | 59215 | 24.2% | 8.8%(+15.4)#53 | 5.8%(+18.4)#1,236 |
| 54. | 59075 | 24.0% | 8.8%(+15.2)#54 | 5.8%(+18.2)#1,253 |
| 55. | 59528 | 23.5% | 8.8%(+14.7)#55 | 5.8%(+17.7)#1,304 |
| 56. | 59469 | 23.3% | 8.8%(+14.5)#56 | 5.8%(+17.5)#1,324 |
| 57. | 59258 | 23.1% | 8.8%(+14.3)#57 | 5.8%(+17.3)#1,343 |
| 58. | 59453 | 23.0% | 8.8%(+14.2)#58 | 5.8%(+17.2)#1,354 |
| 59. | 59451 | 22.8% | 8.8%(+14.0)#59 | 5.8%(+17.0)#1,374 |
| 60. | 59253 | 22.8% | 8.8%(+14.0)#60 | 5.8%(+17.0)#1,377 |
| 61. | 59460 | 22.4% | 8.8%(+13.7)#61 | 5.8%(+16.6)#1,419 |
| 62. | 59055 | 22.4% | 8.8%(+13.6)#62 | 5.8%(+16.6)#1,426 |
| 63. | 59416 | 21.9% | 8.8%(+13.1)#63 | 5.8%(+16.1)#1,488 |
| 64. | 59468 | 21.8% | 8.8%(+13.0)#64 | 5.8%(+16.0)#1,509 |
| 65. | 59347 | 21.5% | 8.8%(+12.7)#65 | 5.8%(+15.7)#1,558 |
| 66. | 59446 | 21.5% | 8.8%(+12.7)#66 | 5.8%(+15.6)#1,563 |
| 67. | 59008 | 21.3% | 8.8%(+12.5)#67 | 5.8%(+15.5)#1,593 |
| 68. | 59036 | 21.2% | 8.8%(+12.4)#68 | 5.8%(+15.4)#1,607 |
| 69. | 59648 | 21.1% | 8.8%(+12.3)#69 | 5.8%(+15.3)#1,621 |
| 70. | 59070 | 21.1% | 8.8%(+12.3)#70 | 5.8%(+15.3)#1,622 |
| 71. | 59466 | 20.9% | 8.8%(+12.1)#71 | 5.8%(+15.1)#1,661 |
| 72. | 59422 | 20.8% | 8.8%(+12.1)#72 | 5.8%(+15.0)#1,666 |
| 73. | 59856 | 20.8% | 8.8%(+12.1)#73 | 5.8%(+15.0)#1,669 |
| 74. | 59087 | 20.8% | 8.8%(+12.0)#74 | 5.8%(+15.0)#1,675 |
| 75. | 59464 | 20.7% | 8.8%(+11.9)#75 | 5.8%(+14.9)#1,697 |
| 76. | 59724 | 20.6% | 8.8%(+11.8)#76 | 5.8%(+14.8)#1,712 |
| 77. | 59212 | 20.4% | 8.8%(+11.6)#77 | 5.8%(+14.5)#1,749 |
| 78. | 59010 | 20.1% | 8.8%(+11.4)#78 | 5.8%(+14.3)#1,782 |
| 79. | 59929 | 20.0% | 8.8%(+11.2)#79 | 5.8%(+14.2)#1,813 |
| 80. | 59316 | 20.0% | 8.8%(+11.2)#80 | 5.8%(+14.2)#1,830 |
| 81. | 59247 | 19.9% | 8.8%(+11.1)#81 | 5.8%(+14.1)#1,852 |
| 82. | 59444 | 19.8% | 8.8%(+11.0)#82 | 5.8%(+13.9)#1,870 |
| 83. | 59531 | 19.7% | 8.8%(+11.0)#83 | 5.8%(+13.9)#1,871 |
| 84. | 59338 | 19.5% | 8.8%(+10.7)#84 | 5.8%(+13.7)#1,922 |
| 85. | 59411 | 19.5% | 8.8%(+10.7)#85 | 5.8%(+13.6)#1,924 |
| 86. | 59349 | 19.3% | 8.8%(+10.5)#86 | 5.8%(+13.5)#1,946 |
| 87. | 59086 | 18.9% | 8.8%(+10.1)#87 | 5.8%(+13.1)#2,068 |
| 88. | 59874 | 18.8% | 8.8%(+10.0)#88 | 5.8%(+13.0)#2,091 |
| 89. | 59322 | 18.6% | 8.8%(+9.82)#89 | 5.8%(+12.8)#2,143 |
| 90. | 59436 | 18.5% | 8.8%(+9.69)#90 | 5.8%(+12.7)#2,180 |
| 91. | 59853 | 18.4% | 8.8%(+9.66)#91 | 5.8%(+12.6)#2,188 |
| 92. | 59846 | 18.1% | 8.8%(+9.31)#92 | 5.8%(+12.3)#2,288 |
| 93. | 59831 | 17.8% | 8.8%(+9.03)#93 | 5.8%(+12.0)#2,371 |
| 94. | 59544 | 17.7% | 8.8%(+8.93)#94 | 5.8%(+11.9)#2,397 |
| 95. | 59241 | 17.7% | 8.8%(+8.89)#95 | 5.8%(+11.9)#2,405 |
| 96. | 59041 | 17.5% | 8.8%(+8.75)#96 | 5.8%(+11.7)#2,456 |
| 97. | 59353 | 17.5% | 8.8%(+8.75)#97 | 5.8%(+11.7)#2,457 |
| 98. | 59259 | 17.4% | 8.8%(+8.61)#98 | 5.8%(+11.6)#2,501 |
| 99. | 59424 | 17.4% | 8.8%(+8.61)#99 | 5.8%(+11.6)#2,506 |
| 100. | 59844 | 17.4% | 8.8%(+8.59)#100 | 5.8%(+11.6)#2,510 |
Common Questions
What are the Top 10 Zip Codes with the Highest Percentage of Self-Employed / Not Incorporated in Montana?
Top 10 Zip Codes with the Highest Percentage of Self-Employed / Not Incorporated in Montana are:
What zip code has the Highest Percentage of Self-Employed / Not Incorporated in Montana?
59312 has the Highest Percentage of Self-Employed / Not Incorporated in Montana with 100.0%.
What is the Percentage of Self-Employed / Not Incorporated in the State of Montana?
Percentage of Self-Employed / Not Incorporated in Montana is 8.8%.
What is the Percentage of Self-Employed / Not Incorporated in the United States?
Percentage of Self-Employed / Not Incorporated in the United States is 5.8%.