Zip Codes with the Highest Percentage of Self-Employed / Not Incorporated in Alabama
RELATED REPORTS & OPTIONS
Self-Employed / Not Incorporated
Alabama
Compare Zip Codes
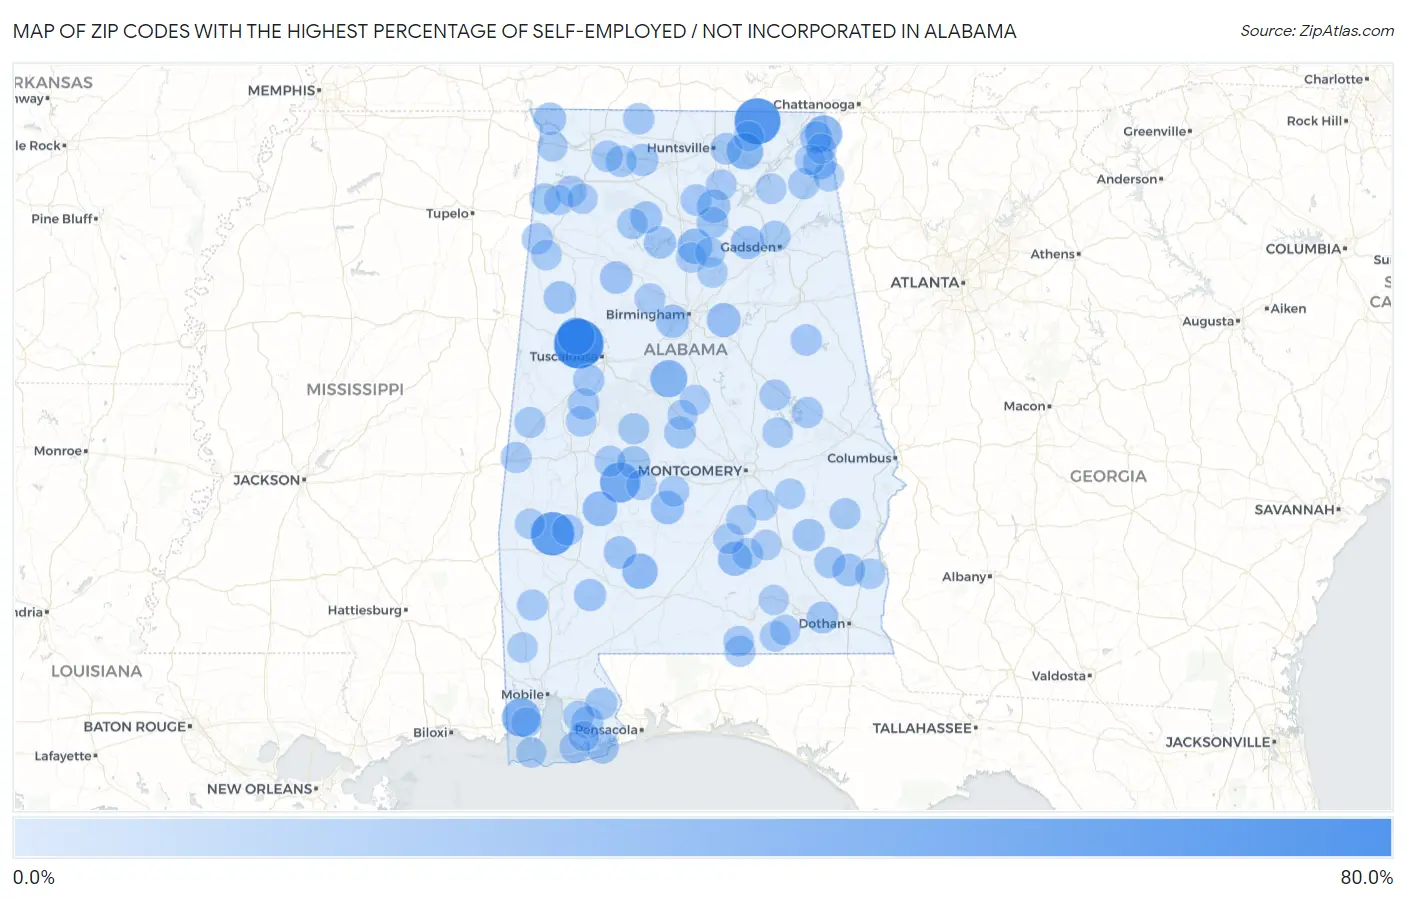
Map of Zip Codes with the Highest Percentage of Self-Employed / Not Incorporated in Alabama
0.0%
80.0%
Zip Codes with the Highest Percentage of Self-Employed / Not Incorporated in Alabama
| Zip Code | % Self-Employed / Not Incorporated | vs State | vs National | |
| 1. | 35457 | 74.5% | 5.3%(+69.2)#1 | 5.8%(+68.7)#87 |
| 2. | 35745 | 61.9% | 5.3%(+56.6)#2 | 5.8%(+56.1)#131 |
| 3. | 36727 | 53.2% | 5.3%(+47.9)#3 | 5.8%(+47.4)#185 |
| 4. | 36773 | 41.6% | 5.3%(+36.3)#4 | 5.8%(+35.8)#369 |
| 5. | 36568 | 36.4% | 5.3%(+31.0)#5 | 5.8%(+30.5)#515 |
| 6. | 35458 | 32.7% | 5.3%(+27.3)#6 | 5.8%(+26.8)#646 |
| 7. | 35035 | 31.4% | 5.3%(+26.1)#7 | 5.8%(+25.6)#704 |
| 8. | 35979 | 30.7% | 5.3%(+25.3)#8 | 5.8%(+24.8)#737 |
| 9. | 35764 | 29.7% | 5.3%(+24.3)#9 | 5.8%(+23.8)#792 |
| 10. | 36471 | 25.9% | 5.3%(+20.5)#10 | 5.8%(+20.1)#1,054 |
| 11. | 35070 | 25.0% | 5.3%(+19.7)#11 | 5.8%(+19.2)#1,151 |
| 12. | 36722 | 23.7% | 5.3%(+18.3)#12 | 5.8%(+17.9)#1,290 |
| 13. | 36071 | 21.6% | 5.3%(+16.2)#13 | 5.8%(+15.8)#1,548 |
| 14. | 35176 | 20.9% | 5.3%(+15.6)#14 | 5.8%(+15.1)#1,652 |
| 15. | 35989 | 20.6% | 5.3%(+15.2)#15 | 5.8%(+14.7)#1,717 |
| 16. | 36761 | 19.1% | 5.3%(+13.8)#16 | 5.8%(+13.3)#2,001 |
| 17. | 35952 | 18.7% | 5.3%(+13.4)#17 | 5.8%(+12.9)#2,106 |
| 18. | 35061 | 18.5% | 5.3%(+13.2)#18 | 5.8%(+12.7)#2,157 |
| 19. | 35087 | 18.2% | 5.3%(+12.9)#19 | 5.8%(+12.4)#2,254 |
| 20. | 36759 | 16.7% | 5.3%(+11.4)#20 | 5.8%(+10.9)#2,718 |
| 21. | 36481 | 16.7% | 5.3%(+11.3)#21 | 5.8%(+10.9)#2,745 |
| 22. | 35545 | 16.7% | 5.3%(+11.3)#22 | 5.8%(+10.9)#2,753 |
| 23. | 35587 | 16.6% | 5.3%(+11.3)#23 | 5.8%(+10.8)#2,775 |
| 24. | 36317 | 16.4% | 5.3%(+11.1)#24 | 5.8%(+10.6)#2,839 |
| 25. | 35966 | 16.3% | 5.3%(+10.9)#25 | 5.8%(+10.5)#2,875 |
| 26. | 35677 | 15.8% | 5.3%(+10.5)#26 | 5.8%(+9.97)#3,074 |
| 27. | 36561 | 15.7% | 5.3%(+10.4)#27 | 5.8%(+9.91)#3,108 |
| 28. | 35053 | 15.6% | 5.3%(+10.3)#28 | 5.8%(+9.81)#3,151 |
| 29. | 36005 | 15.5% | 5.3%(+10.2)#29 | 5.8%(+9.71)#3,189 |
| 30. | 35540 | 14.8% | 5.3%(+9.45)#30 | 5.8%(+8.97)#3,522 |
| 31. | 36580 | 14.7% | 5.3%(+9.38)#31 | 5.8%(+8.90)#3,558 |
| 32. | 36540 | 14.7% | 5.3%(+9.37)#32 | 5.8%(+8.89)#3,562 |
| 33. | 36758 | 14.3% | 5.3%(+8.95)#33 | 5.8%(+8.47)#3,731 |
| 34. | 36567 | 14.2% | 5.3%(+8.89)#34 | 5.8%(+8.41)#3,782 |
| 35. | 35643 | 14.2% | 5.3%(+8.87)#35 | 5.8%(+8.39)#3,797 |
| 36. | 36352 | 13.5% | 5.3%(+8.19)#36 | 5.8%(+7.72)#4,169 |
| 37. | 35083 | 13.4% | 5.3%(+8.08)#37 | 5.8%(+7.60)#4,240 |
| 38. | 35741 | 13.3% | 5.3%(+7.99)#38 | 5.8%(+7.51)#4,295 |
| 39. | 35672 | 12.9% | 5.3%(+7.55)#39 | 5.8%(+7.07)#4,594 |
| 40. | 35463 | 12.6% | 5.3%(+7.31)#40 | 5.8%(+6.83)#4,765 |
| 41. | 35621 | 12.6% | 5.3%(+7.27)#41 | 5.8%(+6.79)#4,798 |
| 42. | 35646 | 12.4% | 5.3%(+7.08)#42 | 5.8%(+6.60)#4,950 |
| 43. | 35610 | 12.4% | 5.3%(+7.05)#43 | 5.8%(+6.57)#4,983 |
| 44. | 35552 | 12.4% | 5.3%(+7.04)#44 | 5.8%(+6.56)#4,990 |
| 45. | 35441 | 12.3% | 5.3%(+6.96)#45 | 5.8%(+6.48)#5,042 |
| 46. | 36266 | 12.3% | 5.3%(+6.91)#46 | 5.8%(+6.44)#5,071 |
| 47. | 36784 | 12.1% | 5.3%(+6.80)#47 | 5.8%(+6.32)#5,175 |
| 48. | 36017 | 12.0% | 5.3%(+6.65)#48 | 5.8%(+6.17)#5,304 |
| 49. | 35968 | 11.7% | 5.3%(+6.38)#49 | 5.8%(+5.90)#5,529 |
| 50. | 36053 | 11.5% | 5.3%(+6.17)#50 | 5.8%(+5.69)#5,691 |
| 51. | 36049 | 11.5% | 5.3%(+6.12)#51 | 5.8%(+5.64)#5,760 |
| 52. | 36756 | 11.4% | 5.3%(+6.11)#52 | 5.8%(+5.63)#5,770 |
| 53. | 35585 | 11.4% | 5.3%(+6.10)#53 | 5.8%(+5.62)#5,775 |
| 54. | 36069 | 11.3% | 5.3%(+6.01)#54 | 5.8%(+5.53)#5,858 |
| 55. | 36907 | 11.3% | 5.3%(+6.00)#55 | 5.8%(+5.52)#5,869 |
| 56. | 36542 | 11.3% | 5.3%(+5.99)#56 | 5.8%(+5.52)#5,871 |
| 57. | 36455 | 11.2% | 5.3%(+5.89)#57 | 5.8%(+5.41)#5,979 |
| 58. | 35089 | 11.2% | 5.3%(+5.85)#58 | 5.8%(+5.37)#6,018 |
| 59. | 35593 | 11.2% | 5.3%(+5.85)#59 | 5.8%(+5.37)#6,019 |
| 60. | 36583 | 11.2% | 5.3%(+5.83)#60 | 5.8%(+5.35)#6,032 |
| 61. | 35954 | 11.2% | 5.3%(+5.82)#61 | 5.8%(+5.34)#6,043 |
| 62. | 36786 | 10.9% | 5.3%(+5.60)#62 | 5.8%(+5.12)#6,268 |
| 63. | 36853 | 10.9% | 5.3%(+5.59)#63 | 5.8%(+5.11)#6,281 |
| 64. | 36576 | 10.9% | 5.3%(+5.52)#64 | 5.8%(+5.04)#6,347 |
| 65. | 35460 | 10.7% | 5.3%(+5.40)#65 | 5.8%(+4.92)#6,498 |
| 66. | 36775 | 10.7% | 5.3%(+5.40)#66 | 5.8%(+4.92)#6,500 |
| 67. | 35572 | 10.7% | 5.3%(+5.37)#67 | 5.8%(+4.89)#6,530 |
| 68. | 35130 | 10.7% | 5.3%(+5.36)#68 | 5.8%(+4.88)#6,544 |
| 69. | 36042 | 10.5% | 5.3%(+5.18)#69 | 5.8%(+4.70)#6,758 |
| 70. | 35175 | 10.4% | 5.3%(+5.04)#70 | 5.8%(+4.56)#6,909 |
| 71. | 36477 | 10.2% | 5.3%(+4.82)#71 | 5.8%(+4.34)#7,161 |
| 72. | 36776 | 10.1% | 5.3%(+4.78)#72 | 5.8%(+4.30)#7,214 |
| 73. | 36318 | 9.9% | 5.3%(+4.59)#73 | 5.8%(+4.11)#7,461 |
| 74. | 36442 | 9.8% | 5.3%(+4.51)#74 | 5.8%(+4.03)#7,555 |
| 75. | 36535 | 9.7% | 5.3%(+4.38)#75 | 5.8%(+3.90)#7,741 |
| 76. | 35544 | 9.4% | 5.3%(+4.09)#76 | 5.8%(+3.61)#8,113 |
| 77. | 35984 | 9.4% | 5.3%(+4.08)#77 | 5.8%(+3.60)#8,132 |
| 78. | 35079 | 9.4% | 5.3%(+4.05)#78 | 5.8%(+3.57)#8,180 |
| 79. | 36310 | 9.4% | 5.3%(+4.02)#79 | 5.8%(+3.54)#8,224 |
| 80. | 36046 | 9.3% | 5.3%(+3.98)#80 | 5.8%(+3.50)#8,279 |
| 81. | 35975 | 9.3% | 5.3%(+3.95)#81 | 5.8%(+3.47)#8,319 |
| 82. | 36522 | 9.3% | 5.3%(+3.93)#82 | 5.8%(+3.45)#8,350 |
| 83. | 36544 | 9.3% | 5.3%(+3.93)#83 | 5.8%(+3.45)#8,355 |
| 84. | 35978 | 9.2% | 5.3%(+3.88)#84 | 5.8%(+3.40)#8,429 |
| 85. | 36029 | 9.1% | 5.3%(+3.80)#85 | 5.8%(+3.32)#8,565 |
| 86. | 36528 | 9.1% | 5.3%(+3.77)#86 | 5.8%(+3.29)#8,617 |
| 87. | 36767 | 9.1% | 5.3%(+3.75)#87 | 5.8%(+3.28)#8,634 |
| 88. | 35133 | 9.1% | 5.3%(+3.72)#88 | 5.8%(+3.24)#8,685 |
| 89. | 36024 | 9.0% | 5.3%(+3.69)#89 | 5.8%(+3.21)#8,739 |
| 90. | 35171 | 9.0% | 5.3%(+3.67)#90 | 5.8%(+3.19)#8,760 |
| 91. | 36035 | 9.0% | 5.3%(+3.67)#91 | 5.8%(+3.19)#8,767 |
| 92. | 35571 | 9.0% | 5.3%(+3.62)#92 | 5.8%(+3.14)#8,845 |
| 93. | 35981 | 8.9% | 5.3%(+3.58)#93 | 5.8%(+3.10)#8,929 |
| 94. | 36921 | 8.9% | 5.3%(+3.56)#94 | 5.8%(+3.08)#8,966 |
| 95. | 36750 | 8.9% | 5.3%(+3.56)#95 | 5.8%(+3.08)#8,969 |
| 96. | 35751 | 8.9% | 5.3%(+3.55)#96 | 5.8%(+3.07)#8,984 |
| 97. | 35616 | 8.9% | 5.3%(+3.55)#97 | 5.8%(+3.07)#8,992 |
| 98. | 35581 | 8.9% | 5.3%(+3.54)#98 | 5.8%(+3.06)#9,014 |
| 99. | 35049 | 8.8% | 5.3%(+3.49)#99 | 5.8%(+3.02)#9,095 |
| 100. | 36323 | 8.7% | 5.3%(+3.39)#100 | 5.8%(+2.92)#9,274 |
Common Questions
What are the Top 10 Zip Codes with the Highest Percentage of Self-Employed / Not Incorporated in Alabama?
Top 10 Zip Codes with the Highest Percentage of Self-Employed / Not Incorporated in Alabama are:
What zip code has the Highest Percentage of Self-Employed / Not Incorporated in Alabama?
35457 has the Highest Percentage of Self-Employed / Not Incorporated in Alabama with 74.5%.
What is the Percentage of Self-Employed / Not Incorporated in the State of Alabama?
Percentage of Self-Employed / Not Incorporated in Alabama is 5.3%.
What is the Percentage of Self-Employed / Not Incorporated in the United States?
Percentage of Self-Employed / Not Incorporated in the United States is 5.8%.