Zip Codes with the Highest Percentage of Population Employed in Food Preparation & Serving in Cedar Rapids, IA
RELATED REPORTS & OPTIONS
Food Preparation & Serving
Cedar Rapids
Compare Zip Codes
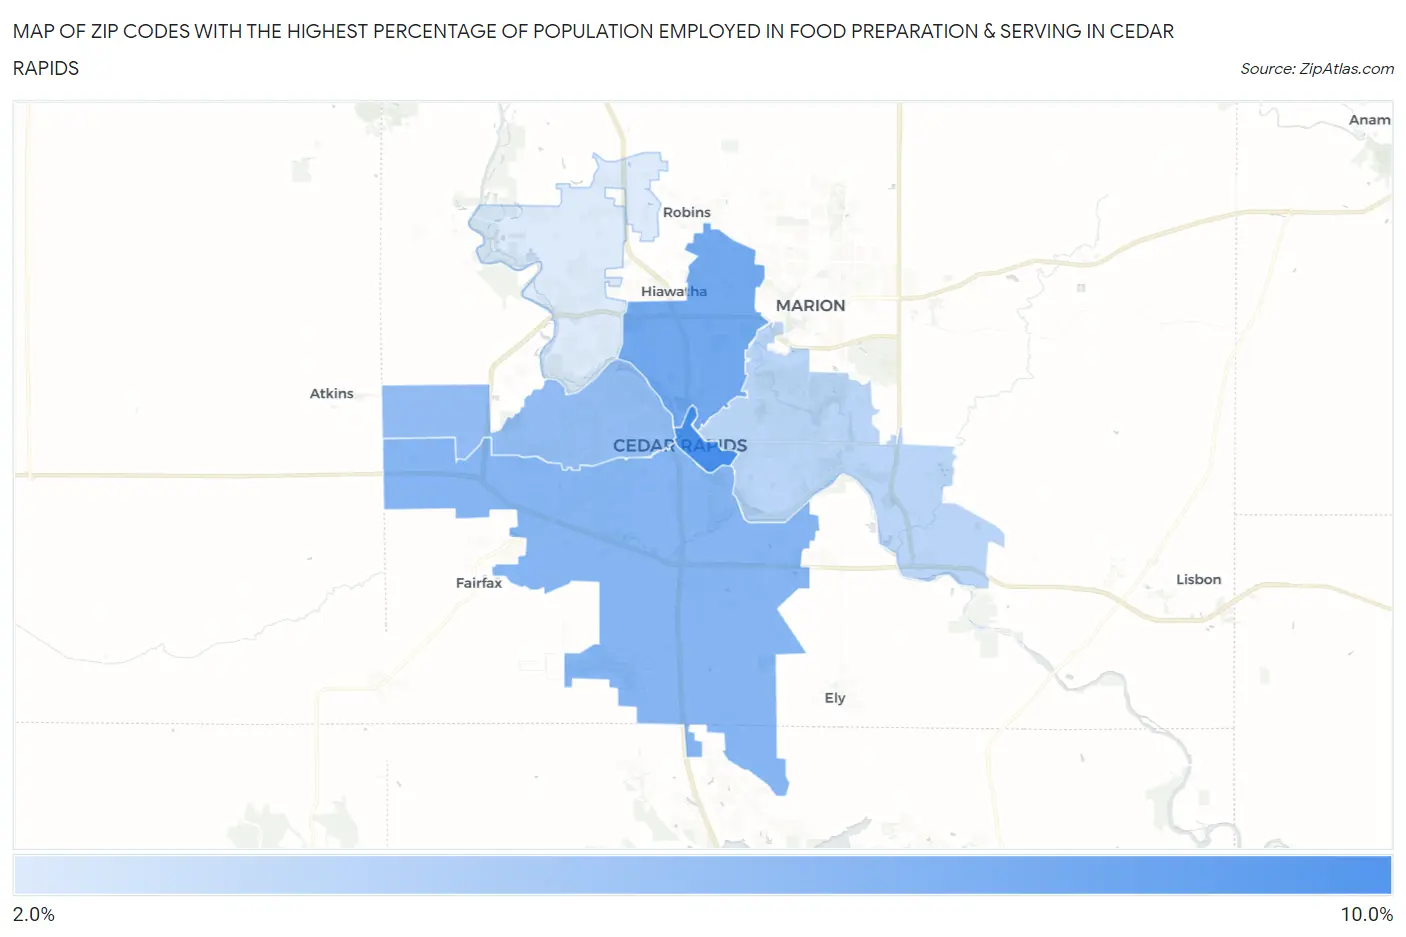
Map of Zip Codes with the Highest Percentage of Population Employed in Food Preparation & Serving in Cedar Rapids
2.3%
8.5%
Zip Codes with the Highest Percentage of Population Employed in Food Preparation & Serving in Cedar Rapids, IA
| Zip Code | % Employed | vs State | vs National | |
| 1. | 52401 | 8.5% | 5.1%(+3.41)#80 | 5.3%(+3.24)#4,042 |
| 2. | 52402 | 6.6% | 5.1%(+1.53)#155 | 5.3%(+1.36)#7,485 |
| 3. | 52404 | 5.9% | 5.1%(+0.759)#209 | 5.3%(+0.587)#9,776 |
| 4. | 52405 | 5.4% | 5.1%(+0.308)#253 | 5.3%(+0.136)#11,333 |
| 5. | 52403 | 3.7% | 5.1%(-1.39)#440 | 5.3%(-1.56)#18,242 |
| 6. | 52411 | 2.3% | 5.1%(-2.79)#647 | 5.3%(-2.96)#23,692 |
1
Common Questions
What are the Top 5 Zip Codes with the Highest Percentage of Population Employed in Food Preparation & Serving in Cedar Rapids, IA?
Top 5 Zip Codes with the Highest Percentage of Population Employed in Food Preparation & Serving in Cedar Rapids, IA are:
What zip code has the Highest Percentage of Population Employed in Food Preparation & Serving in Cedar Rapids, IA?
52401 has the Highest Percentage of Population Employed in Food Preparation & Serving in Cedar Rapids, IA with 8.5%.
What is the Percentage of Population Employed in Food Preparation & Serving in Cedar Rapids, IA?
Percentage of Population Employed in Food Preparation & Serving in Cedar Rapids is 5.7%.
What is the Percentage of Population Employed in Food Preparation & Serving in Iowa?
Percentage of Population Employed in Food Preparation & Serving in Iowa is 5.1%.
What is the Percentage of Population Employed in Food Preparation & Serving in the United States?
Percentage of Population Employed in Food Preparation & Serving in the United States is 5.3%.