Zip Codes with the Highest Percentage of Population Employed in Food Preparation & Serving in Dubuque, IA
RELATED REPORTS & OPTIONS
Food Preparation & Serving
Dubuque
Compare Zip Codes
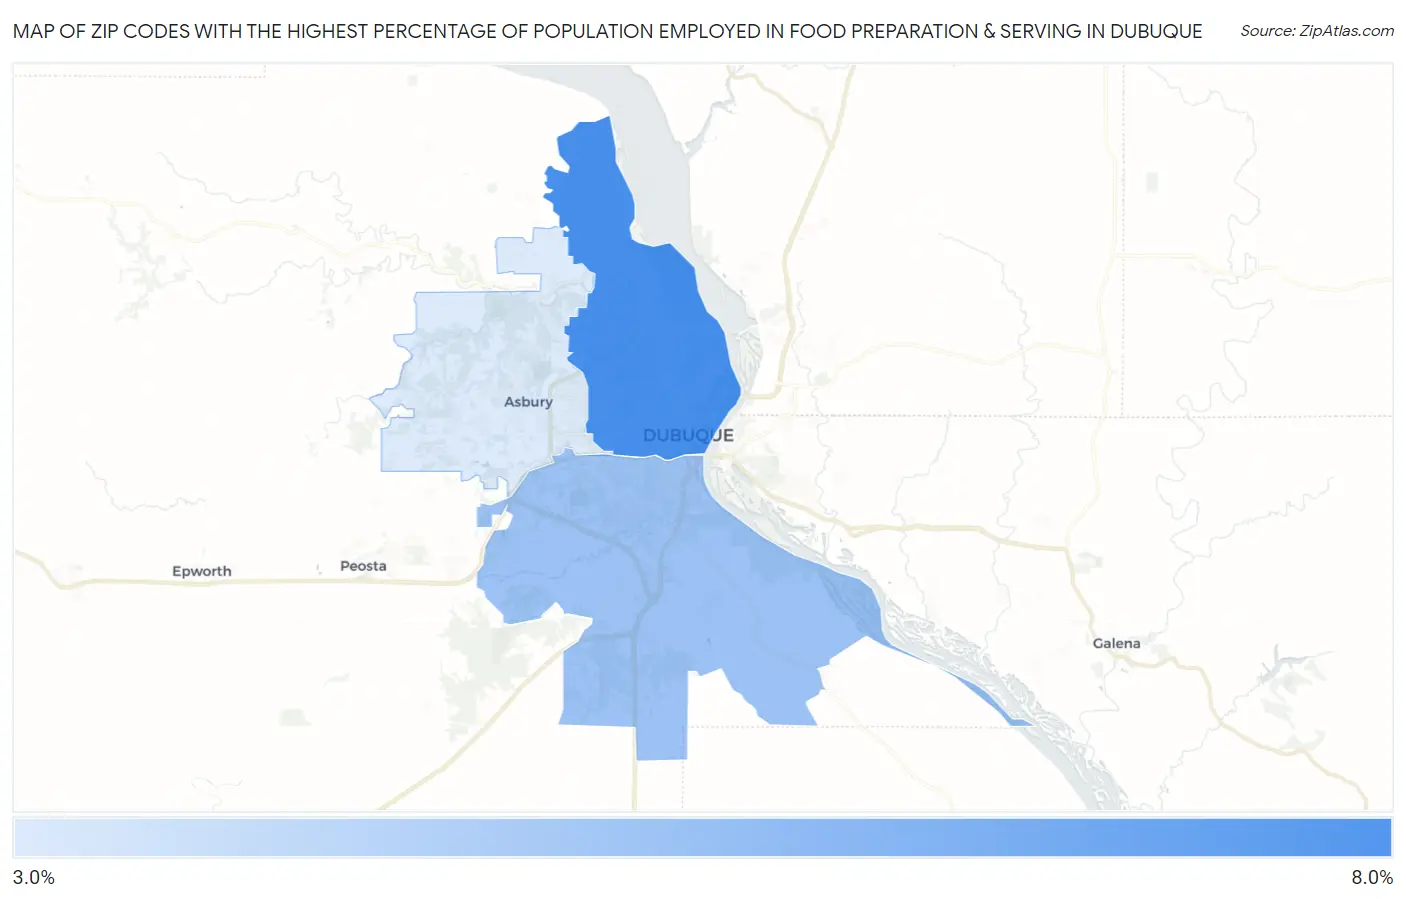
Map of Zip Codes with the Highest Percentage of Population Employed in Food Preparation & Serving in Dubuque
3.3%
6.8%
Zip Codes with the Highest Percentage of Population Employed in Food Preparation & Serving in Dubuque, IA
| Zip Code | % Employed | vs State | vs National | |
| 1. | 52001 | 6.8% | 5.1%(+1.71)#141 | 5.3%(+1.54)#7,005 |
| 2. | 52003 | 4.8% | 5.1%(-0.276)#309 | 5.3%(-0.449)#13,622 |
| 3. | 52002 | 3.3% | 5.1%(-1.78)#500 | 5.3%(-1.95)#19,928 |
1
Common Questions
What are the Top Zip Codes with the Highest Percentage of Population Employed in Food Preparation & Serving in Dubuque, IA?
Top Zip Codes with the Highest Percentage of Population Employed in Food Preparation & Serving in Dubuque, IA are:
What zip code has the Highest Percentage of Population Employed in Food Preparation & Serving in Dubuque, IA?
52001 has the Highest Percentage of Population Employed in Food Preparation & Serving in Dubuque, IA with 6.8%.
What is the Percentage of Population Employed in Food Preparation & Serving in Dubuque, IA?
Percentage of Population Employed in Food Preparation & Serving in Dubuque is 5.9%.
What is the Percentage of Population Employed in Food Preparation & Serving in Iowa?
Percentage of Population Employed in Food Preparation & Serving in Iowa is 5.1%.
What is the Percentage of Population Employed in Food Preparation & Serving in the United States?
Percentage of Population Employed in Food Preparation & Serving in the United States is 5.3%.