Zip Codes with the Highest Percentage of Population Employed in Food Preparation & Serving in Fairfield, IA
RELATED REPORTS & OPTIONS
Food Preparation & Serving
Fairfield
Compare Zip Codes
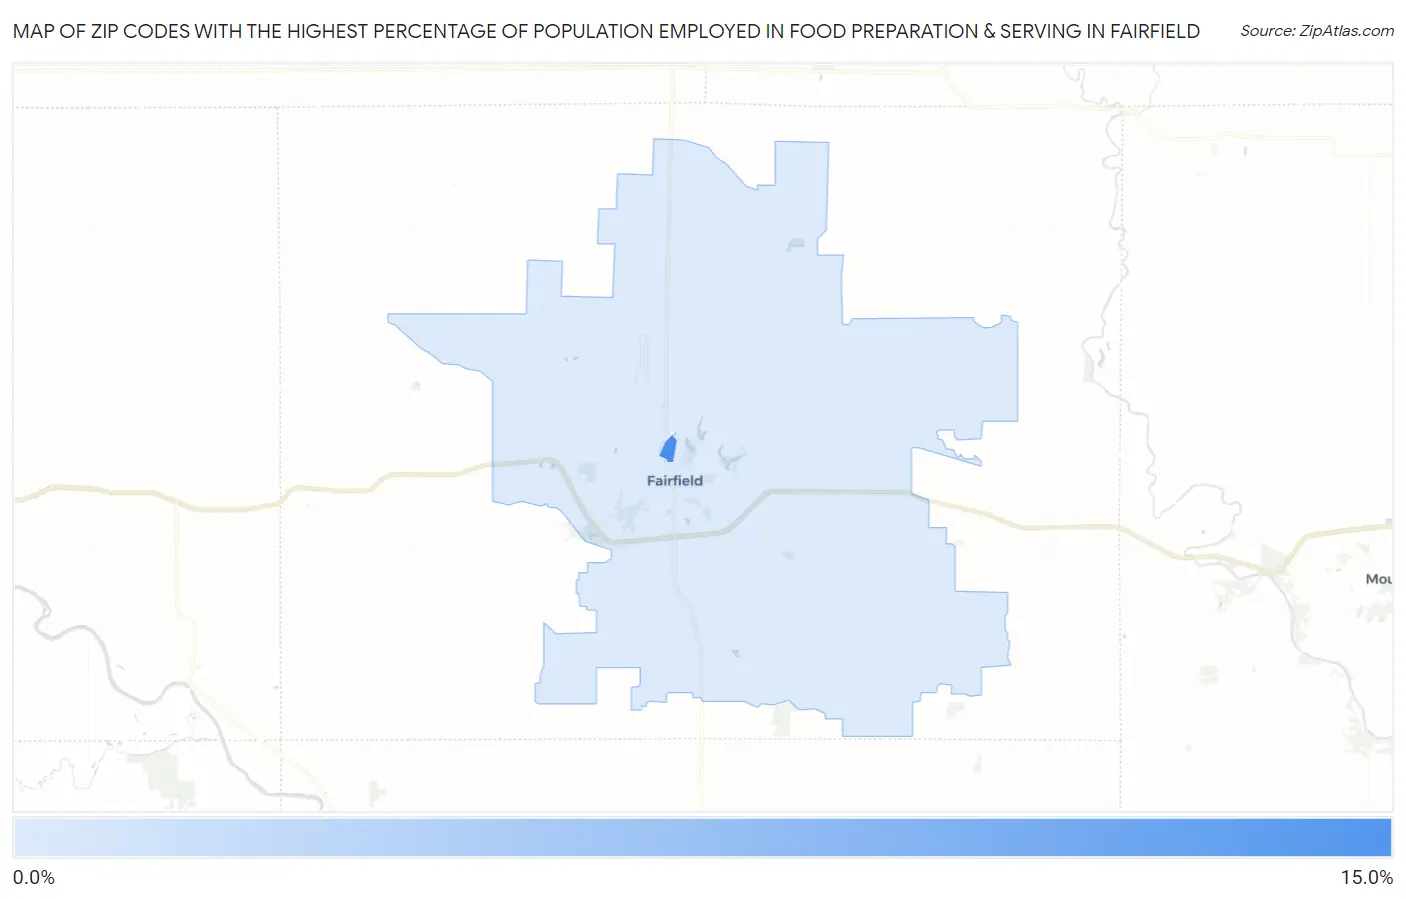
Map of Zip Codes with the Highest Percentage of Population Employed in Food Preparation & Serving in Fairfield
4.5%
14.0%
Zip Codes with the Highest Percentage of Population Employed in Food Preparation & Serving in Fairfield, IA
| Zip Code | % Employed | vs State | vs National | |
| 1. | 52557 | 14.0% | 5.1%(+8.90)#24 | 5.3%(+8.73)#1,156 |
| 2. | 52556 | 4.5% | 5.1%(-0.618)#346 | 5.3%(-0.790)#15,048 |
1
Common Questions
What are the Top Zip Codes with the Highest Percentage of Population Employed in Food Preparation & Serving in Fairfield, IA?
Top Zip Codes with the Highest Percentage of Population Employed in Food Preparation & Serving in Fairfield, IA are:
What zip code has the Highest Percentage of Population Employed in Food Preparation & Serving in Fairfield, IA?
52557 has the Highest Percentage of Population Employed in Food Preparation & Serving in Fairfield, IA with 14.0%.
What is the Percentage of Population Employed in Food Preparation & Serving in Fairfield, IA?
Percentage of Population Employed in Food Preparation & Serving in Fairfield is 5.8%.
What is the Percentage of Population Employed in Food Preparation & Serving in Iowa?
Percentage of Population Employed in Food Preparation & Serving in Iowa is 5.1%.
What is the Percentage of Population Employed in Food Preparation & Serving in the United States?
Percentage of Population Employed in Food Preparation & Serving in the United States is 5.3%.