Zip Codes with the Highest Percentage of Population Employed in Food Preparation & Serving in Ames, IA
RELATED REPORTS & OPTIONS
Food Preparation & Serving
Ames
Compare Zip Codes
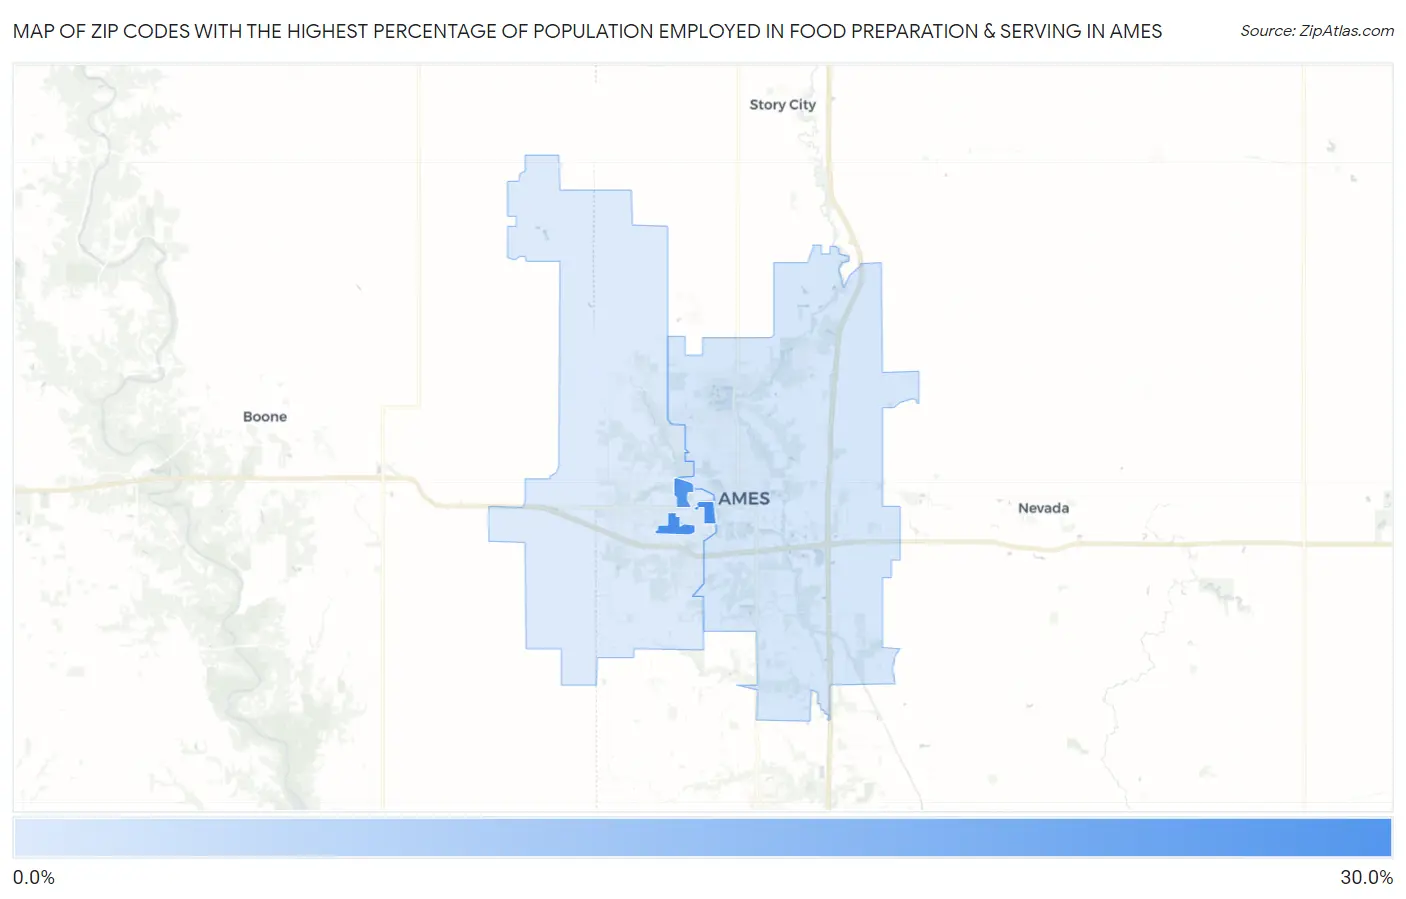
Map of Zip Codes with the Highest Percentage of Population Employed in Food Preparation & Serving in Ames
7.0%
27.0%
Zip Codes with the Highest Percentage of Population Employed in Food Preparation & Serving in Ames, IA
| Zip Code | % Employed | vs State | vs National | |
| 1. | 50013 | 27.0% | 5.1%(+21.9)#4 | 5.3%(+21.7)#263 |
| 2. | 50012 | 25.2% | 5.1%(+20.1)#5 | 5.3%(+19.9)#309 |
| 3. | 50010 | 7.8% | 5.1%(+2.72)#98 | 5.3%(+2.55)#4,983 |
| 4. | 50014 | 7.0% | 5.1%(+1.86)#132 | 5.3%(+1.69)#6,628 |
1
Common Questions
What are the Top 3 Zip Codes with the Highest Percentage of Population Employed in Food Preparation & Serving in Ames, IA?
Top 3 Zip Codes with the Highest Percentage of Population Employed in Food Preparation & Serving in Ames, IA are:
What zip code has the Highest Percentage of Population Employed in Food Preparation & Serving in Ames, IA?
50013 has the Highest Percentage of Population Employed in Food Preparation & Serving in Ames, IA with 27.0%.
What is the Percentage of Population Employed in Food Preparation & Serving in Ames, IA?
Percentage of Population Employed in Food Preparation & Serving in Ames is 9.0%.
What is the Percentage of Population Employed in Food Preparation & Serving in Iowa?
Percentage of Population Employed in Food Preparation & Serving in Iowa is 5.1%.
What is the Percentage of Population Employed in Food Preparation & Serving in the United States?
Percentage of Population Employed in Food Preparation & Serving in the United States is 5.3%.