Zip Codes with the Highest Percentage of Population Employed in Food Preparation & Serving in Sioux City, IA
RELATED REPORTS & OPTIONS
Food Preparation & Serving
Sioux City
Compare Zip Codes
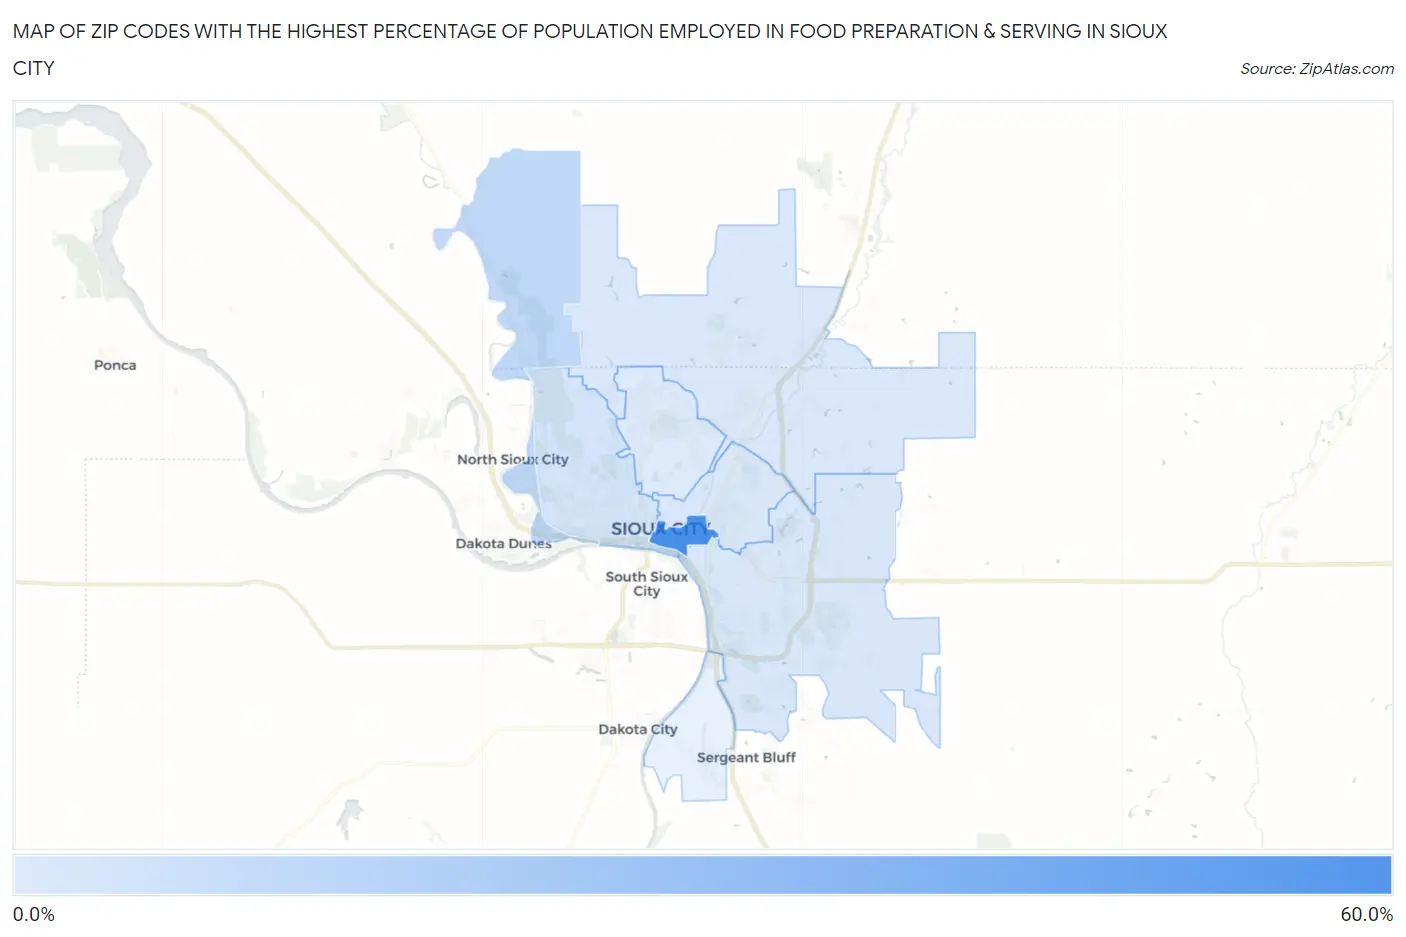
Map of Zip Codes with the Highest Percentage of Population Employed in Food Preparation & Serving in Sioux City
5.2%
52.4%
Zip Codes with the Highest Percentage of Population Employed in Food Preparation & Serving in Sioux City, IA
| Zip Code | % Employed | vs State | vs National | |
| 1. | 51101 | 52.4% | 5.1%(+47.3)#1 | 5.3%(+47.1)#48 |
| 2. | 51109 | 13.1% | 5.1%(+7.96)#29 | 5.3%(+7.78)#1,375 |
| 3. | 51103 | 7.9% | 5.1%(+2.83)#93 | 5.3%(+2.65)#4,828 |
| 4. | 51106 | 6.4% | 5.1%(+1.26)#171 | 5.3%(+1.08)#8,226 |
| 5. | 51105 | 6.2% | 5.1%(+1.12)#179 | 5.3%(+0.952)#8,622 |
| 6. | 51108 | 6.1% | 5.1%(+1.02)#186 | 5.3%(+0.852)#8,906 |
| 7. | 51104 | 5.2% | 5.1%(+0.129)#273 | 5.3%(-0.043)#11,978 |
1
Common Questions
What are the Top 5 Zip Codes with the Highest Percentage of Population Employed in Food Preparation & Serving in Sioux City, IA?
Top 5 Zip Codes with the Highest Percentage of Population Employed in Food Preparation & Serving in Sioux City, IA are:
What zip code has the Highest Percentage of Population Employed in Food Preparation & Serving in Sioux City, IA?
51101 has the Highest Percentage of Population Employed in Food Preparation & Serving in Sioux City, IA with 52.4%.
What is the Percentage of Population Employed in Food Preparation & Serving in Sioux City, IA?
Percentage of Population Employed in Food Preparation & Serving in Sioux City is 7.0%.
What is the Percentage of Population Employed in Food Preparation & Serving in Iowa?
Percentage of Population Employed in Food Preparation & Serving in Iowa is 5.1%.
What is the Percentage of Population Employed in Food Preparation & Serving in the United States?
Percentage of Population Employed in Food Preparation & Serving in the United States is 5.3%.