Zip Codes with the Highest Percentage of Population Employed in Food Preparation & Serving in Ankeny, IA
RELATED REPORTS & OPTIONS
Food Preparation & Serving
Ankeny
Compare Zip Codes
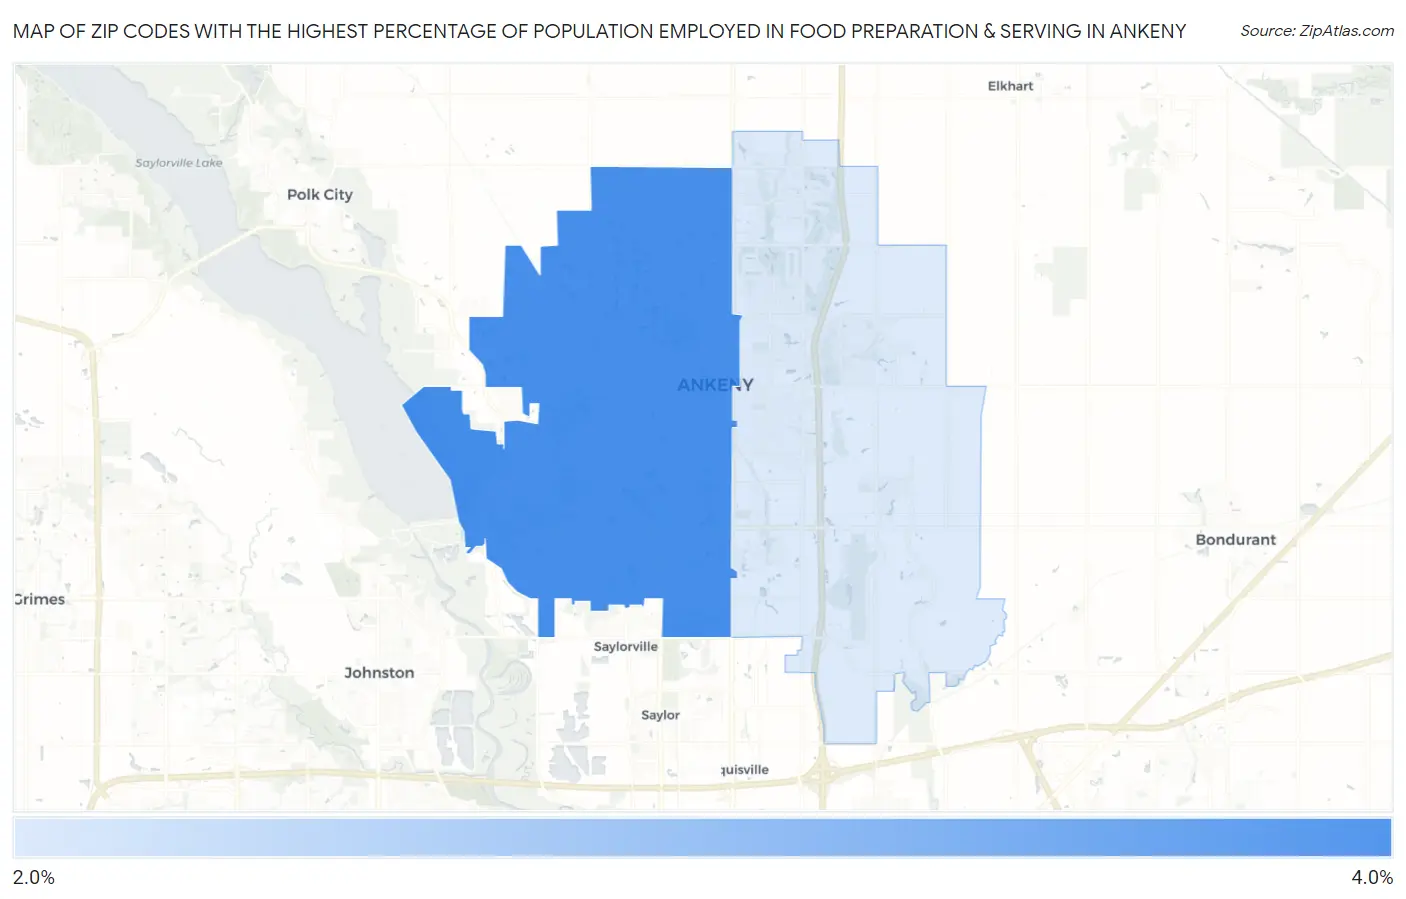
Map of Zip Codes with the Highest Percentage of Population Employed in Food Preparation & Serving in Ankeny
2.9%
3.7%
Zip Codes with the Highest Percentage of Population Employed in Food Preparation & Serving in Ankeny, IA
| Zip Code | % Employed | vs State | vs National | |
| 1. | 50023 | 3.7% | 5.1%(-1.45)#452 | 5.3%(-1.63)#18,527 |
| 2. | 50021 | 2.9% | 5.1%(-2.25)#567 | 5.3%(-2.42)#21,803 |
1
Common Questions
What are the Top Zip Codes with the Highest Percentage of Population Employed in Food Preparation & Serving in Ankeny, IA?
Top Zip Codes with the Highest Percentage of Population Employed in Food Preparation & Serving in Ankeny, IA are:
What zip code has the Highest Percentage of Population Employed in Food Preparation & Serving in Ankeny, IA?
50023 has the Highest Percentage of Population Employed in Food Preparation & Serving in Ankeny, IA with 3.7%.
What is the Percentage of Population Employed in Food Preparation & Serving in Ankeny, IA?
Percentage of Population Employed in Food Preparation & Serving in Ankeny is 3.4%.
What is the Percentage of Population Employed in Food Preparation & Serving in Iowa?
Percentage of Population Employed in Food Preparation & Serving in Iowa is 5.1%.
What is the Percentage of Population Employed in Food Preparation & Serving in the United States?
Percentage of Population Employed in Food Preparation & Serving in the United States is 5.3%.