Zip Codes with the Highest Percentage of Population Employed in Food Preparation & Serving in Melcher Dallas, IA
RELATED REPORTS & OPTIONS
Food Preparation & Serving
Melcher Dallas
Compare Zip Codes
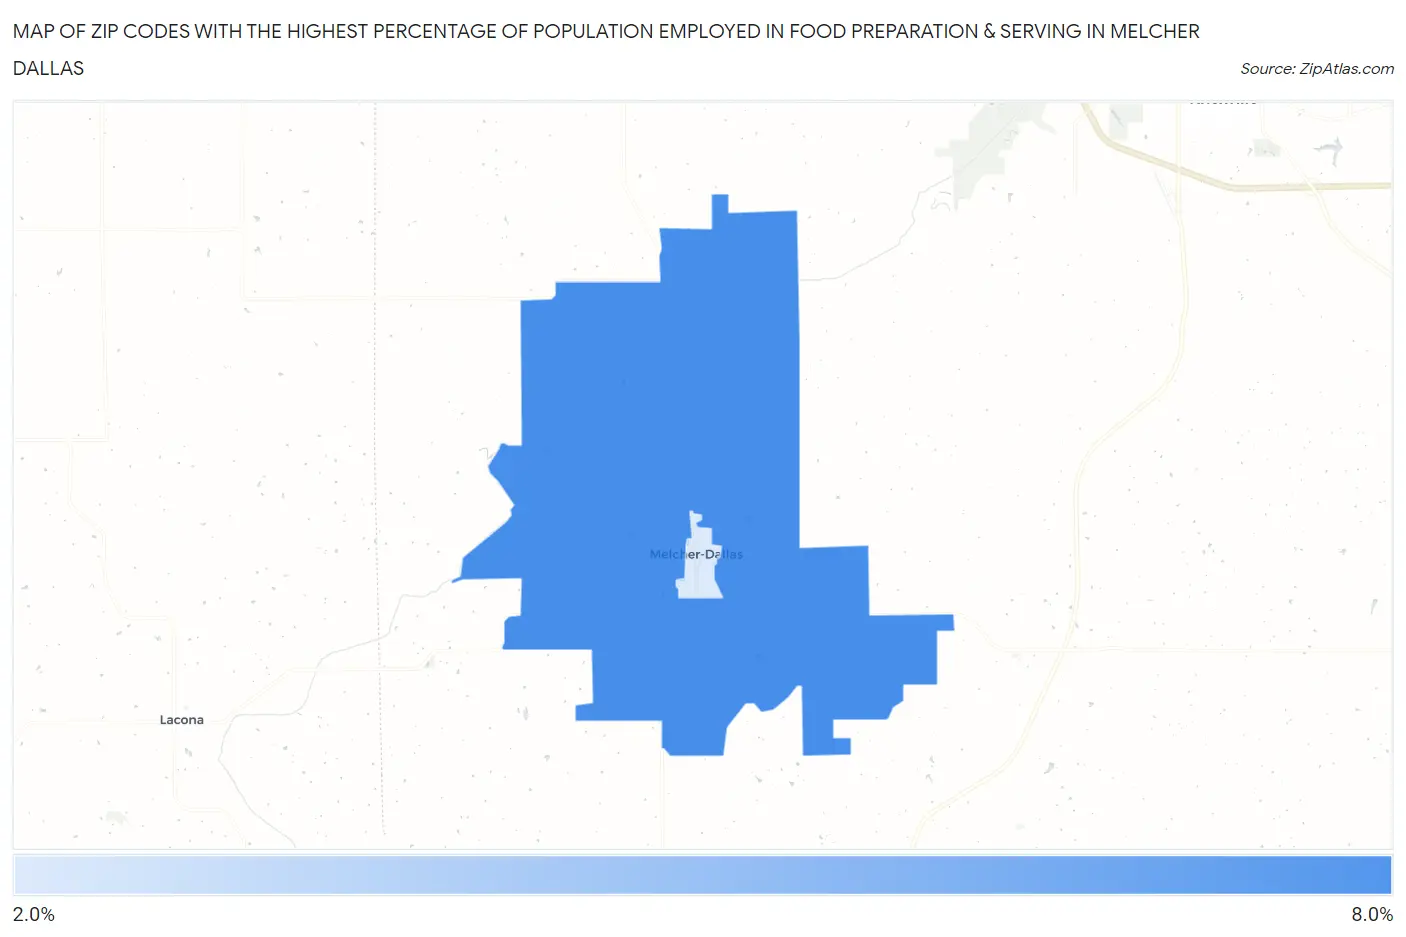
Map of Zip Codes with the Highest Percentage of Population Employed in Food Preparation & Serving in Melcher Dallas
2.8%
6.9%
Zip Codes with the Highest Percentage of Population Employed in Food Preparation & Serving in Melcher Dallas, IA
| Zip Code | % Employed | vs State | vs National | |
| 1. | 50062 | 6.9% | 5.1%(+1.78)#136 | 5.3%(+1.61)#6,830 |
| 2. | 50163 | 2.8% | 5.1%(-2.31)#581 | 5.3%(-2.48)#22,056 |
1
Common Questions
What are the Top Zip Codes with the Highest Percentage of Population Employed in Food Preparation & Serving in Melcher Dallas, IA?
Top Zip Codes with the Highest Percentage of Population Employed in Food Preparation & Serving in Melcher Dallas, IA are:
What zip code has the Highest Percentage of Population Employed in Food Preparation & Serving in Melcher Dallas, IA?
50062 has the Highest Percentage of Population Employed in Food Preparation & Serving in Melcher Dallas, IA with 6.9%.
What is the Percentage of Population Employed in Food Preparation & Serving in Melcher Dallas, IA?
Percentage of Population Employed in Food Preparation & Serving in Melcher Dallas is 6.0%.
What is the Percentage of Population Employed in Food Preparation & Serving in Iowa?
Percentage of Population Employed in Food Preparation & Serving in Iowa is 5.1%.
What is the Percentage of Population Employed in Food Preparation & Serving in the United States?
Percentage of Population Employed in Food Preparation & Serving in the United States is 5.3%.