Zip Codes with the Highest Percentage of Population Employed in Food Preparation & Serving in Davenport, IA
RELATED REPORTS & OPTIONS
Food Preparation & Serving
Davenport
Compare Zip Codes
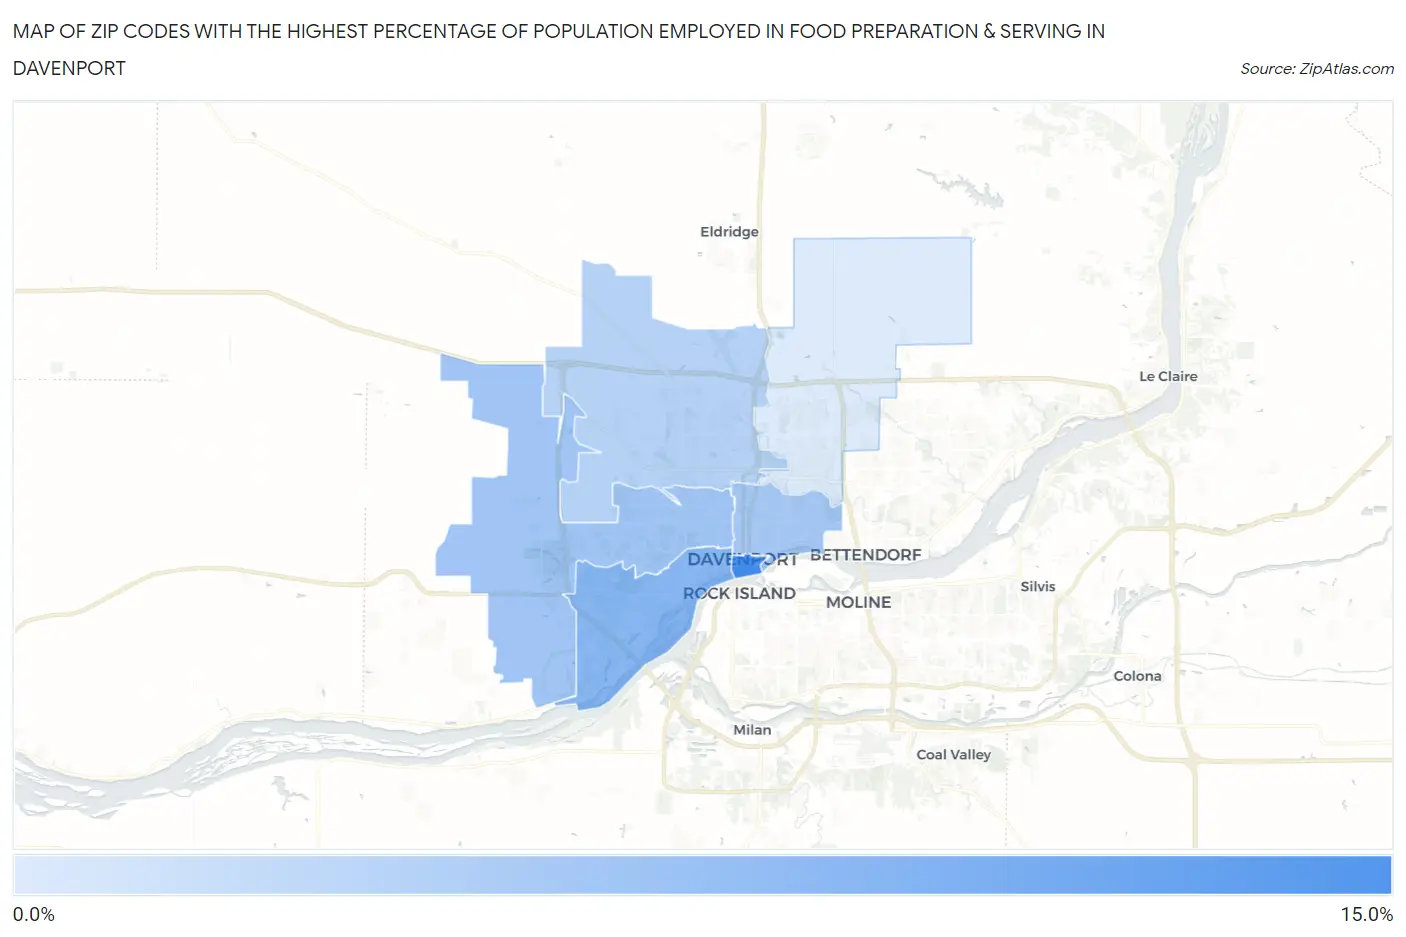
Map of Zip Codes with the Highest Percentage of Population Employed in Food Preparation & Serving in Davenport
4.7%
10.6%
Zip Codes with the Highest Percentage of Population Employed in Food Preparation & Serving in Davenport, IA
| Zip Code | % Employed | vs State | vs National | |
| 1. | 52801 | 10.6% | 5.1%(+5.47)#51 | 5.3%(+5.30)#2,269 |
| 2. | 52802 | 8.0% | 5.1%(+2.90)#90 | 5.3%(+2.73)#4,706 |
| 3. | 52804 | 7.0% | 5.1%(+1.88)#130 | 5.3%(+1.71)#6,574 |
| 4. | 52803 | 6.9% | 5.1%(+1.77)#138 | 5.3%(+1.60)#6,856 |
| 5. | 52806 | 6.2% | 5.1%(+1.09)#183 | 5.3%(+0.914)#8,725 |
| 6. | 52807 | 4.7% | 5.1%(-0.404)#322 | 5.3%(-0.576)#14,121 |
1
Common Questions
What are the Top 5 Zip Codes with the Highest Percentage of Population Employed in Food Preparation & Serving in Davenport, IA?
Top 5 Zip Codes with the Highest Percentage of Population Employed in Food Preparation & Serving in Davenport, IA are:
What zip code has the Highest Percentage of Population Employed in Food Preparation & Serving in Davenport, IA?
52801 has the Highest Percentage of Population Employed in Food Preparation & Serving in Davenport, IA with 10.6%.
What is the Percentage of Population Employed in Food Preparation & Serving in Davenport, IA?
Percentage of Population Employed in Food Preparation & Serving in Davenport is 6.5%.
What is the Percentage of Population Employed in Food Preparation & Serving in Iowa?
Percentage of Population Employed in Food Preparation & Serving in Iowa is 5.1%.
What is the Percentage of Population Employed in Food Preparation & Serving in the United States?
Percentage of Population Employed in Food Preparation & Serving in the United States is 5.3%.