Immigrants from Vietnam vs Welsh Self-Care Disability
COMPARE
Immigrants from Vietnam
Welsh
Self-Care Disability
Self-Care Disability Comparison
Immigrants from Vietnam
Welsh
2.5%
SELF-CARE DISABILITY
59.3/ 100
METRIC RATING
164th/ 347
METRIC RANK
2.5%
SELF-CARE DISABILITY
50.0/ 100
METRIC RATING
174th/ 347
METRIC RANK
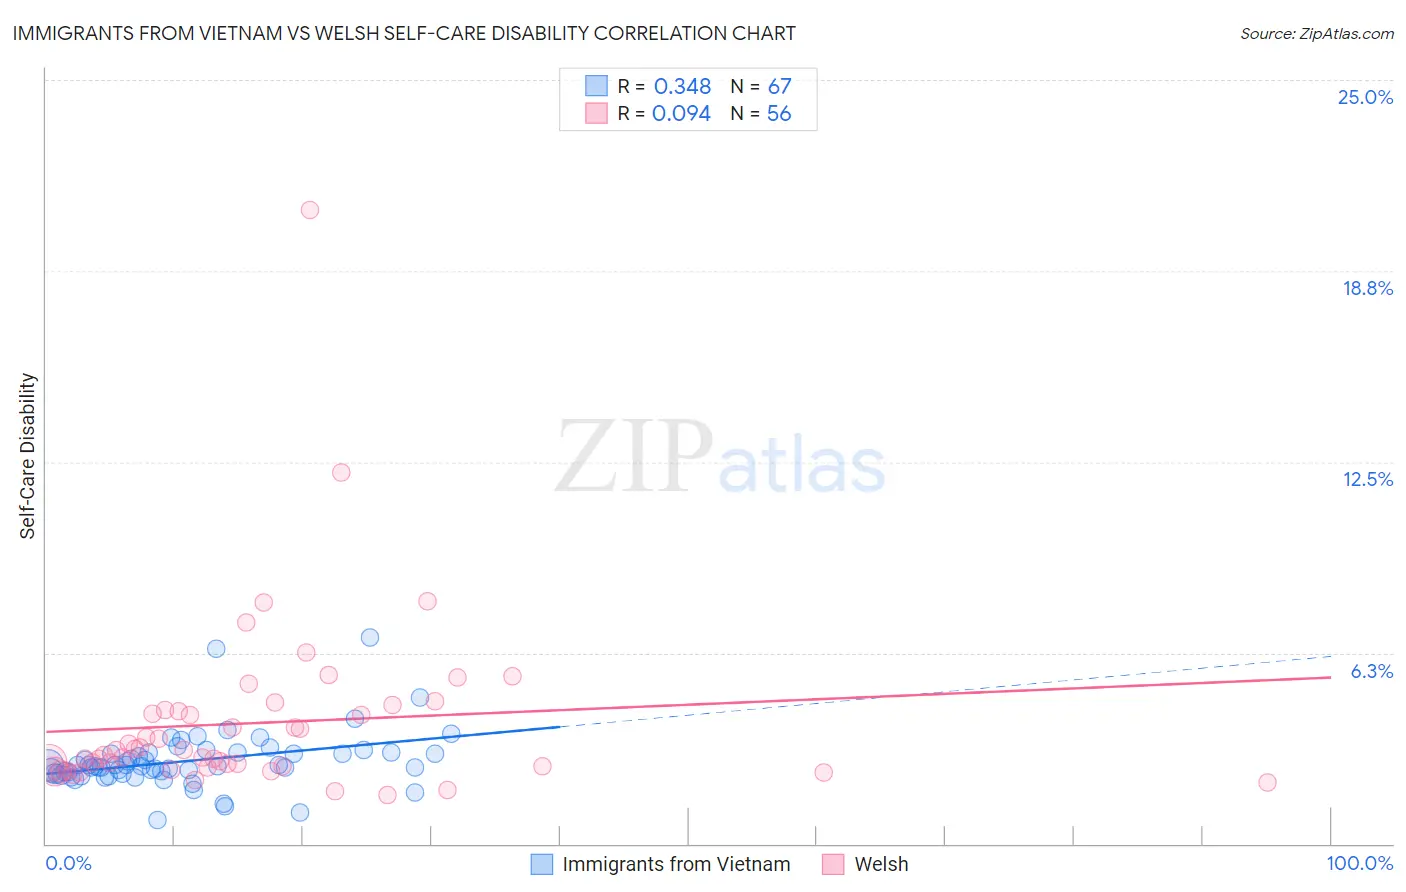
Immigrants from Vietnam vs Welsh Self-Care Disability Correlation Chart
The statistical analysis conducted on geographies consisting of 404,358,280 people shows a mild positive correlation between the proportion of Immigrants from Vietnam and percentage of population with self-care disability in the United States with a correlation coefficient (R) of 0.348 and weighted average of 2.5%. Similarly, the statistical analysis conducted on geographies consisting of 527,151,887 people shows a slight positive correlation between the proportion of Welsh and percentage of population with self-care disability in the United States with a correlation coefficient (R) of 0.094 and weighted average of 2.5%, a difference of 0.45%.
Self-Care Disability Correlation Summary
| Measurement | Immigrants from Vietnam | Welsh |
| Minimum | 0.78% | 1.6% |
| Maximum | 6.7% | 20.7% |
| Range | 5.9% | 19.1% |
| Mean | 2.7% | 4.0% |
| Median | 2.5% | 3.0% |
| Interquartile 25% (IQ1) | 2.3% | 2.5% |
| Interquartile 75% (IQ3) | 3.0% | 4.4% |
| Interquartile Range (IQR) | 0.66% | 1.8% |
| Standard Deviation (Sample) | 0.94% | 2.9% |
| Standard Deviation (Population) | 0.93% | 2.9% |
Demographics Similar to Immigrants from Vietnam and Welsh by Self-Care Disability
In terms of self-care disability, the demographic groups most similar to Immigrants from Vietnam are Syrian (2.5%, a difference of 0.020%), Canadian (2.5%, a difference of 0.030%), Immigrants from Greece (2.5%, a difference of 0.10%), Ute (2.5%, a difference of 0.11%), and German Russian (2.5%, a difference of 0.17%). Similarly, the demographic groups most similar to Welsh are Immigrants from Bosnia and Herzegovina (2.5%, a difference of 0.020%), Immigrants from Afghanistan (2.5%, a difference of 0.11%), Immigrants from Burma/Myanmar (2.5%, a difference of 0.13%), Immigrants from Kazakhstan (2.5%, a difference of 0.16%), and Pennsylvania German (2.5%, a difference of 0.17%).
| Demographics | Rating | Rank | Self-Care Disability |
| Immigrants | Italy | 68.5 /100 | #159 | Good 2.4% |
| Finns | 67.0 /100 | #160 | Good 2.4% |
| Lebanese | 66.5 /100 | #161 | Good 2.4% |
| Somalis | 63.7 /100 | #162 | Good 2.5% |
| German Russians | 62.7 /100 | #163 | Good 2.5% |
| Immigrants | Vietnam | 59.3 /100 | #164 | Average 2.5% |
| Syrians | 59.0 /100 | #165 | Average 2.5% |
| Canadians | 58.8 /100 | #166 | Average 2.5% |
| Immigrants | Greece | 57.3 /100 | #167 | Average 2.5% |
| Ute | 57.1 /100 | #168 | Average 2.5% |
| Immigrants | Somalia | 55.9 /100 | #169 | Average 2.5% |
| Scottish | 54.3 /100 | #170 | Average 2.5% |
| Pennsylvania Germans | 53.5 /100 | #171 | Average 2.5% |
| Czechoslovakians | 53.5 /100 | #172 | Average 2.5% |
| Immigrants | Burma/Myanmar | 52.8 /100 | #173 | Average 2.5% |
| Welsh | 50.0 /100 | #174 | Average 2.5% |
| Immigrants | Bosnia and Herzegovina | 49.6 /100 | #175 | Average 2.5% |
| Immigrants | Afghanistan | 47.6 /100 | #176 | Average 2.5% |
| Immigrants | Kazakhstan | 46.7 /100 | #177 | Average 2.5% |
| English | 46.2 /100 | #178 | Average 2.5% |
| Hungarians | 45.5 /100 | #179 | Average 2.5% |