Immigrants from Vietnam vs Immigrants from North Macedonia Self-Care Disability
COMPARE
Immigrants from Vietnam
Immigrants from North Macedonia
Self-Care Disability
Self-Care Disability Comparison
Immigrants from Vietnam
Immigrants from North Macedonia
2.5%
SELF-CARE DISABILITY
59.3/ 100
METRIC RATING
164th/ 347
METRIC RANK
2.4%
SELF-CARE DISABILITY
93.1/ 100
METRIC RATING
114th/ 347
METRIC RANK
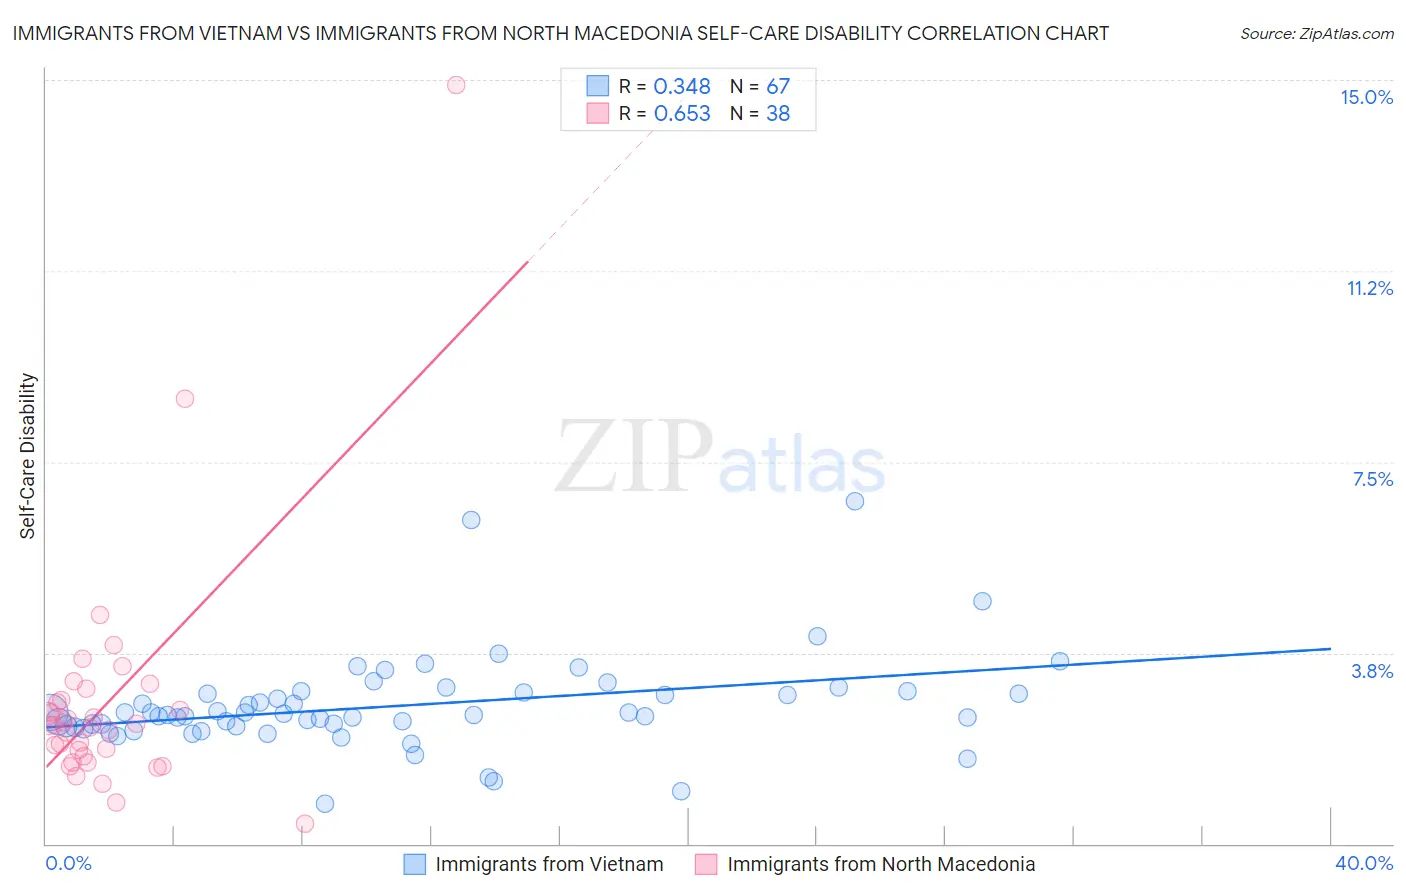
Immigrants from Vietnam vs Immigrants from North Macedonia Self-Care Disability Correlation Chart
The statistical analysis conducted on geographies consisting of 404,358,280 people shows a mild positive correlation between the proportion of Immigrants from Vietnam and percentage of population with self-care disability in the United States with a correlation coefficient (R) of 0.348 and weighted average of 2.5%. Similarly, the statistical analysis conducted on geographies consisting of 74,312,524 people shows a significant positive correlation between the proportion of Immigrants from North Macedonia and percentage of population with self-care disability in the United States with a correlation coefficient (R) of 0.653 and weighted average of 2.4%, a difference of 2.7%.
Self-Care Disability Correlation Summary
| Measurement | Immigrants from Vietnam | Immigrants from North Macedonia |
| Minimum | 0.78% | 0.40% |
| Maximum | 6.7% | 14.9% |
| Range | 5.9% | 14.5% |
| Mean | 2.7% | 2.8% |
| Median | 2.5% | 2.3% |
| Interquartile 25% (IQ1) | 2.3% | 1.7% |
| Interquartile 75% (IQ3) | 3.0% | 2.8% |
| Interquartile Range (IQR) | 0.66% | 1.1% |
| Standard Deviation (Sample) | 0.94% | 2.4% |
| Standard Deviation (Population) | 0.93% | 2.4% |
Similar Demographics by Self-Care Disability
Demographics Similar to Immigrants from Vietnam by Self-Care Disability
In terms of self-care disability, the demographic groups most similar to Immigrants from Vietnam are Syrian (2.5%, a difference of 0.020%), Canadian (2.5%, a difference of 0.030%), Immigrants from Greece (2.5%, a difference of 0.10%), Ute (2.5%, a difference of 0.11%), and German Russian (2.5%, a difference of 0.17%).
| Demographics | Rating | Rank | Self-Care Disability |
| Immigrants | Europe | 69.6 /100 | #157 | Good 2.4% |
| Immigrants | Western Europe | 68.6 /100 | #158 | Good 2.4% |
| Immigrants | Italy | 68.5 /100 | #159 | Good 2.4% |
| Finns | 67.0 /100 | #160 | Good 2.4% |
| Lebanese | 66.5 /100 | #161 | Good 2.4% |
| Somalis | 63.7 /100 | #162 | Good 2.5% |
| German Russians | 62.7 /100 | #163 | Good 2.5% |
| Immigrants | Vietnam | 59.3 /100 | #164 | Average 2.5% |
| Syrians | 59.0 /100 | #165 | Average 2.5% |
| Canadians | 58.8 /100 | #166 | Average 2.5% |
| Immigrants | Greece | 57.3 /100 | #167 | Average 2.5% |
| Ute | 57.1 /100 | #168 | Average 2.5% |
| Immigrants | Somalia | 55.9 /100 | #169 | Average 2.5% |
| Scottish | 54.3 /100 | #170 | Average 2.5% |
| Pennsylvania Germans | 53.5 /100 | #171 | Average 2.5% |
Demographics Similar to Immigrants from North Macedonia by Self-Care Disability
In terms of self-care disability, the demographic groups most similar to Immigrants from North Macedonia are South American (2.4%, a difference of 0.0%), Immigrants from Hong Kong (2.4%, a difference of 0.0%), Northern European (2.4%, a difference of 0.050%), Scandinavian (2.4%, a difference of 0.070%), and Serbian (2.4%, a difference of 0.090%).
| Demographics | Rating | Rank | Self-Care Disability |
| British | 94.3 /100 | #107 | Exceptional 2.4% |
| Greeks | 94.1 /100 | #108 | Exceptional 2.4% |
| Slovenes | 94.1 /100 | #109 | Exceptional 2.4% |
| Immigrants | Africa | 93.7 /100 | #110 | Exceptional 2.4% |
| Serbians | 93.6 /100 | #111 | Exceptional 2.4% |
| Scandinavians | 93.5 /100 | #112 | Exceptional 2.4% |
| South Americans | 93.2 /100 | #113 | Exceptional 2.4% |
| Immigrants | North Macedonia | 93.1 /100 | #114 | Exceptional 2.4% |
| Immigrants | Hong Kong | 93.1 /100 | #115 | Exceptional 2.4% |
| Northern Europeans | 92.9 /100 | #116 | Exceptional 2.4% |
| Taiwanese | 92.5 /100 | #117 | Exceptional 2.4% |
| Immigrants | Canada | 92.0 /100 | #118 | Exceptional 2.4% |
| Immigrants | Sierra Leone | 91.8 /100 | #119 | Exceptional 2.4% |
| Uruguayans | 91.5 /100 | #120 | Exceptional 2.4% |
| Peruvians | 91.3 /100 | #121 | Exceptional 2.4% |