Immigrants from Poland vs Jamaican Self-Care Disability
COMPARE
Immigrants from Poland
Jamaican
Self-Care Disability
Self-Care Disability Comparison
Immigrants from Poland
Jamaicans
2.4%
SELF-CARE DISABILITY
96.4/ 100
METRIC RATING
98th/ 347
METRIC RANK
2.7%
SELF-CARE DISABILITY
0.0/ 100
METRIC RATING
285th/ 347
METRIC RANK
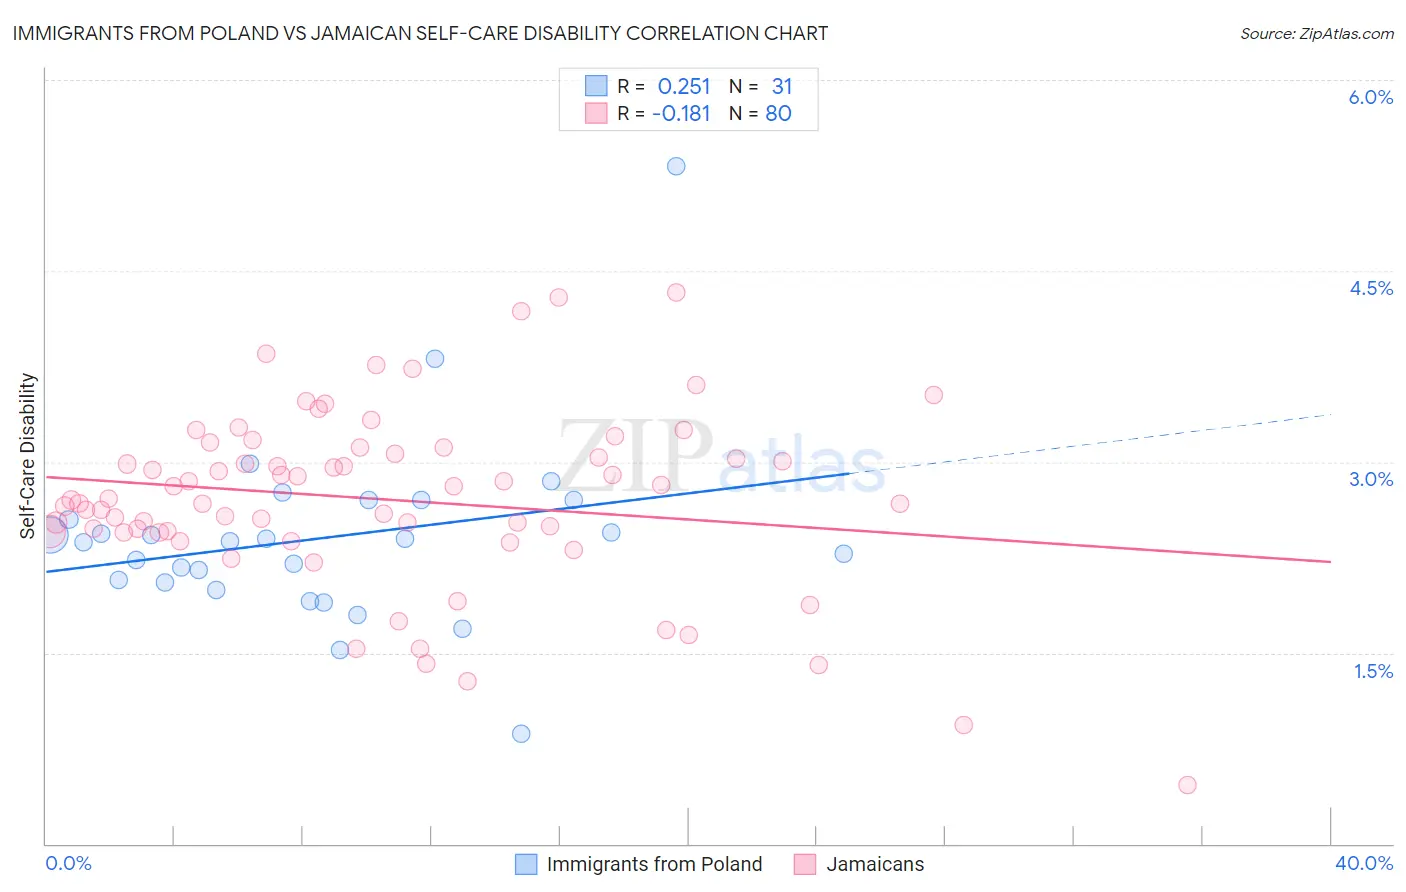
Immigrants from Poland vs Jamaican Self-Care Disability Correlation Chart
The statistical analysis conducted on geographies consisting of 304,690,166 people shows a weak positive correlation between the proportion of Immigrants from Poland and percentage of population with self-care disability in the United States with a correlation coefficient (R) of 0.251 and weighted average of 2.4%. Similarly, the statistical analysis conducted on geographies consisting of 367,399,867 people shows a poor negative correlation between the proportion of Jamaicans and percentage of population with self-care disability in the United States with a correlation coefficient (R) of -0.181 and weighted average of 2.7%, a difference of 13.8%.
Self-Care Disability Correlation Summary
| Measurement | Immigrants from Poland | Jamaican |
| Minimum | 0.86% | 0.47% |
| Maximum | 5.3% | 4.3% |
| Range | 4.5% | 3.9% |
| Mean | 2.4% | 2.7% |
| Median | 2.4% | 2.7% |
| Interquartile 25% (IQ1) | 2.1% | 2.5% |
| Interquartile 75% (IQ3) | 2.7% | 3.1% |
| Interquartile Range (IQR) | 0.65% | 0.64% |
| Standard Deviation (Sample) | 0.74% | 0.71% |
| Standard Deviation (Population) | 0.73% | 0.70% |
Similar Demographics by Self-Care Disability
Demographics Similar to Immigrants from Poland by Self-Care Disability
In terms of self-care disability, the demographic groups most similar to Immigrants from Poland are Immigrants from Israel (2.4%, a difference of 0.080%), Swiss (2.4%, a difference of 0.090%), Immigrants from Chile (2.4%, a difference of 0.14%), European (2.4%, a difference of 0.18%), and Immigrants from Asia (2.4%, a difference of 0.19%).
| Demographics | Rating | Rank | Self-Care Disability |
| Immigrants | Jordan | 97.7 /100 | #91 | Exceptional 2.4% |
| Icelanders | 97.4 /100 | #92 | Exceptional 2.4% |
| Immigrants | Latvia | 97.0 /100 | #93 | Exceptional 2.4% |
| Macedonians | 96.9 /100 | #94 | Exceptional 2.4% |
| Immigrants | Asia | 96.9 /100 | #95 | Exceptional 2.4% |
| Immigrants | Chile | 96.7 /100 | #96 | Exceptional 2.4% |
| Swiss | 96.6 /100 | #97 | Exceptional 2.4% |
| Immigrants | Poland | 96.4 /100 | #98 | Exceptional 2.4% |
| Immigrants | Israel | 96.1 /100 | #99 | Exceptional 2.4% |
| Europeans | 95.8 /100 | #100 | Exceptional 2.4% |
| Immigrants | Scotland | 95.7 /100 | #101 | Exceptional 2.4% |
| Croatians | 95.0 /100 | #102 | Exceptional 2.4% |
| Alsatians | 94.9 /100 | #103 | Exceptional 2.4% |
| Bhutanese | 94.5 /100 | #104 | Exceptional 2.4% |
| Carpatho Rusyns | 94.4 /100 | #105 | Exceptional 2.4% |
Demographics Similar to Jamaicans by Self-Care Disability
In terms of self-care disability, the demographic groups most similar to Jamaicans are Fijian (2.7%, a difference of 0.040%), Delaware (2.7%, a difference of 0.080%), Apache (2.7%, a difference of 0.16%), Immigrants from Iraq (2.7%, a difference of 0.17%), and Hispanic or Latino (2.7%, a difference of 0.33%).
| Demographics | Rating | Rank | Self-Care Disability |
| Ottawa | 0.1 /100 | #278 | Tragic 2.7% |
| Iroquois | 0.1 /100 | #279 | Tragic 2.7% |
| Hispanics or Latinos | 0.1 /100 | #280 | Tragic 2.7% |
| Immigrants | Iraq | 0.0 /100 | #281 | Tragic 2.7% |
| Apache | 0.0 /100 | #282 | Tragic 2.7% |
| Delaware | 0.0 /100 | #283 | Tragic 2.7% |
| Fijians | 0.0 /100 | #284 | Tragic 2.7% |
| Jamaicans | 0.0 /100 | #285 | Tragic 2.7% |
| French American Indians | 0.0 /100 | #286 | Tragic 2.7% |
| Immigrants | Jamaica | 0.0 /100 | #287 | Tragic 2.7% |
| Immigrants | Barbados | 0.0 /100 | #288 | Tragic 2.7% |
| Africans | 0.0 /100 | #289 | Tragic 2.7% |
| Cubans | 0.0 /100 | #290 | Tragic 2.7% |
| Guyanese | 0.0 /100 | #291 | Tragic 2.7% |
| Central American Indians | 0.0 /100 | #292 | Tragic 2.7% |