Immigrants from Poland vs Immigrants from Trinidad and Tobago Self-Care Disability
COMPARE
Immigrants from Poland
Immigrants from Trinidad and Tobago
Self-Care Disability
Self-Care Disability Comparison
Immigrants from Poland
Immigrants from Trinidad and Tobago
2.4%
SELF-CARE DISABILITY
96.4/ 100
METRIC RATING
98th/ 347
METRIC RANK
2.7%
SELF-CARE DISABILITY
0.1/ 100
METRIC RATING
275th/ 347
METRIC RANK
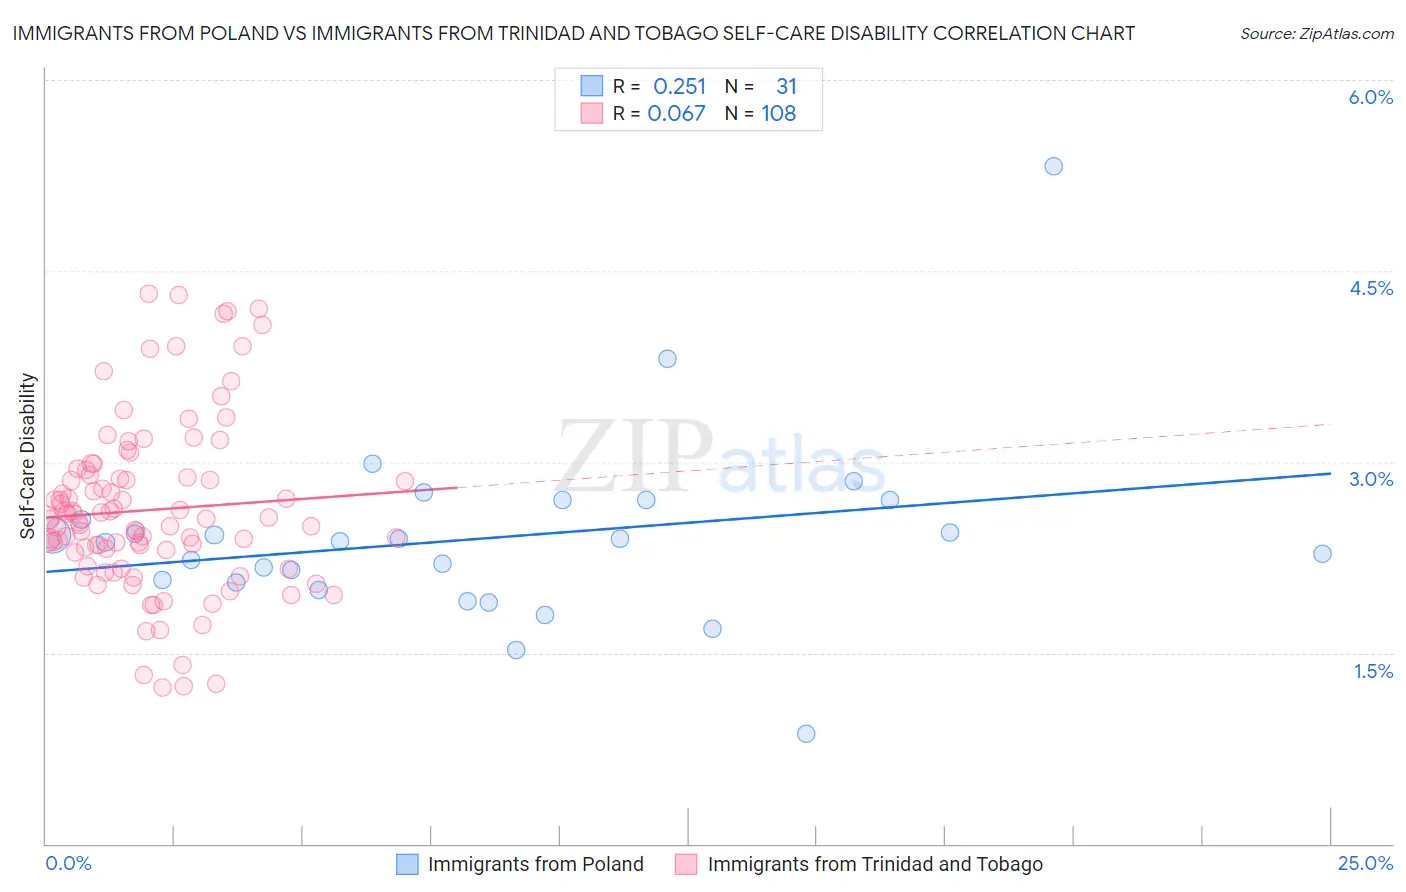
Immigrants from Poland vs Immigrants from Trinidad and Tobago Self-Care Disability Correlation Chart
The statistical analysis conducted on geographies consisting of 304,690,166 people shows a weak positive correlation between the proportion of Immigrants from Poland and percentage of population with self-care disability in the United States with a correlation coefficient (R) of 0.251 and weighted average of 2.4%. Similarly, the statistical analysis conducted on geographies consisting of 223,419,964 people shows a slight positive correlation between the proportion of Immigrants from Trinidad and Tobago and percentage of population with self-care disability in the United States with a correlation coefficient (R) of 0.067 and weighted average of 2.7%, a difference of 13.0%.
Self-Care Disability Correlation Summary
| Measurement | Immigrants from Poland | Immigrants from Trinidad and Tobago |
| Minimum | 0.86% | 1.2% |
| Maximum | 5.3% | 4.3% |
| Range | 4.5% | 3.1% |
| Mean | 2.4% | 2.6% |
| Median | 2.4% | 2.6% |
| Interquartile 25% (IQ1) | 2.1% | 2.3% |
| Interquartile 75% (IQ3) | 2.7% | 2.9% |
| Interquartile Range (IQR) | 0.65% | 0.59% |
| Standard Deviation (Sample) | 0.74% | 0.66% |
| Standard Deviation (Population) | 0.73% | 0.66% |
Similar Demographics by Self-Care Disability
Demographics Similar to Immigrants from Poland by Self-Care Disability
In terms of self-care disability, the demographic groups most similar to Immigrants from Poland are Immigrants from Israel (2.4%, a difference of 0.080%), Swiss (2.4%, a difference of 0.090%), Immigrants from Chile (2.4%, a difference of 0.14%), European (2.4%, a difference of 0.18%), and Immigrants from Asia (2.4%, a difference of 0.19%).
| Demographics | Rating | Rank | Self-Care Disability |
| Immigrants | Jordan | 97.7 /100 | #91 | Exceptional 2.4% |
| Icelanders | 97.4 /100 | #92 | Exceptional 2.4% |
| Immigrants | Latvia | 97.0 /100 | #93 | Exceptional 2.4% |
| Macedonians | 96.9 /100 | #94 | Exceptional 2.4% |
| Immigrants | Asia | 96.9 /100 | #95 | Exceptional 2.4% |
| Immigrants | Chile | 96.7 /100 | #96 | Exceptional 2.4% |
| Swiss | 96.6 /100 | #97 | Exceptional 2.4% |
| Immigrants | Poland | 96.4 /100 | #98 | Exceptional 2.4% |
| Immigrants | Israel | 96.1 /100 | #99 | Exceptional 2.4% |
| Europeans | 95.8 /100 | #100 | Exceptional 2.4% |
| Immigrants | Scotland | 95.7 /100 | #101 | Exceptional 2.4% |
| Croatians | 95.0 /100 | #102 | Exceptional 2.4% |
| Alsatians | 94.9 /100 | #103 | Exceptional 2.4% |
| Bhutanese | 94.5 /100 | #104 | Exceptional 2.4% |
| Carpatho Rusyns | 94.4 /100 | #105 | Exceptional 2.4% |
Demographics Similar to Immigrants from Trinidad and Tobago by Self-Care Disability
In terms of self-care disability, the demographic groups most similar to Immigrants from Trinidad and Tobago are Yakama (2.7%, a difference of 0.0%), Mexican (2.7%, a difference of 0.060%), Japanese (2.7%, a difference of 0.13%), Immigrants from Ukraine (2.7%, a difference of 0.19%), and Immigrants from Laos (2.7%, a difference of 0.20%).
| Demographics | Rating | Rank | Self-Care Disability |
| Immigrants | Mexico | 0.1 /100 | #268 | Tragic 2.7% |
| U.S. Virgin Islanders | 0.1 /100 | #269 | Tragic 2.7% |
| Immigrants | Micronesia | 0.1 /100 | #270 | Tragic 2.7% |
| Trinidadians and Tobagonians | 0.1 /100 | #271 | Tragic 2.7% |
| Immigrants | Laos | 0.1 /100 | #272 | Tragic 2.7% |
| Mexicans | 0.1 /100 | #273 | Tragic 2.7% |
| Yakama | 0.1 /100 | #274 | Tragic 2.7% |
| Immigrants | Trinidad and Tobago | 0.1 /100 | #275 | Tragic 2.7% |
| Japanese | 0.1 /100 | #276 | Tragic 2.7% |
| Immigrants | Ukraine | 0.1 /100 | #277 | Tragic 2.7% |
| Ottawa | 0.1 /100 | #278 | Tragic 2.7% |
| Iroquois | 0.1 /100 | #279 | Tragic 2.7% |
| Hispanics or Latinos | 0.1 /100 | #280 | Tragic 2.7% |
| Immigrants | Iraq | 0.0 /100 | #281 | Tragic 2.7% |
| Apache | 0.0 /100 | #282 | Tragic 2.7% |