Hungarian vs Tsimshian Self-Care Disability
COMPARE
Hungarian
Tsimshian
Self-Care Disability
Self-Care Disability Comparison
Hungarians
Tsimshian
2.5%
SELF-CARE DISABILITY
45.5/ 100
METRIC RATING
179th/ 347
METRIC RANK
2.6%
SELF-CARE DISABILITY
0.3/ 100
METRIC RATING
255th/ 347
METRIC RANK
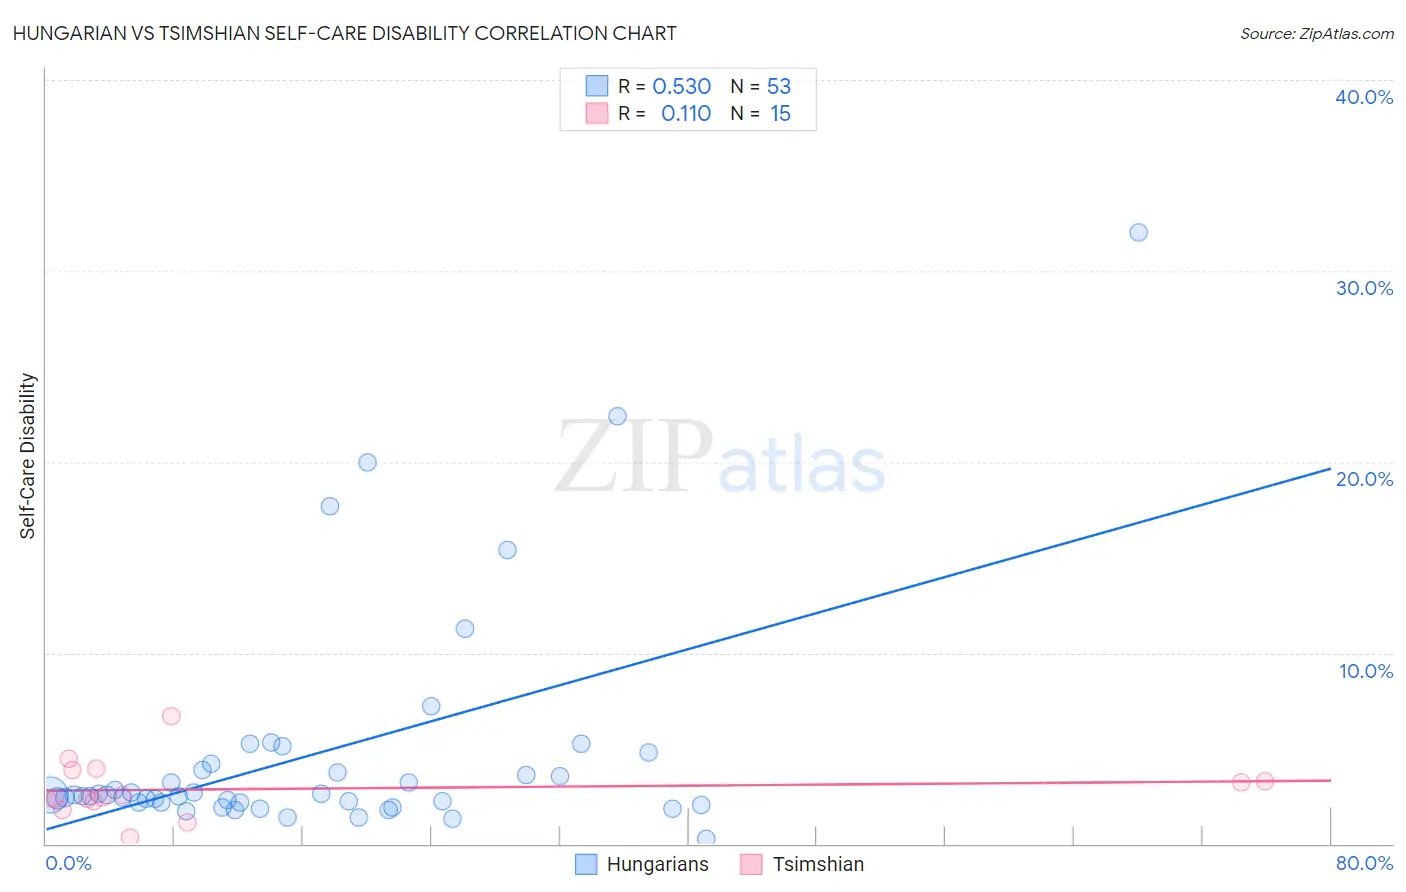
Hungarian vs Tsimshian Self-Care Disability Correlation Chart
The statistical analysis conducted on geographies consisting of 485,258,327 people shows a substantial positive correlation between the proportion of Hungarians and percentage of population with self-care disability in the United States with a correlation coefficient (R) of 0.530 and weighted average of 2.5%. Similarly, the statistical analysis conducted on geographies consisting of 15,618,387 people shows a poor positive correlation between the proportion of Tsimshian and percentage of population with self-care disability in the United States with a correlation coefficient (R) of 0.110 and weighted average of 2.6%, a difference of 6.6%.
Self-Care Disability Correlation Summary
| Measurement | Hungarian | Tsimshian |
| Minimum | 0.28% | 0.32% |
| Maximum | 32.0% | 6.7% |
| Range | 31.7% | 6.4% |
| Mean | 4.7% | 2.9% |
| Median | 2.5% | 2.4% |
| Interquartile 25% (IQ1) | 2.2% | 2.2% |
| Interquartile 75% (IQ3) | 4.0% | 3.9% |
| Interquartile Range (IQR) | 1.8% | 1.6% |
| Standard Deviation (Sample) | 6.0% | 1.5% |
| Standard Deviation (Population) | 5.9% | 1.5% |
Similar Demographics by Self-Care Disability
Demographics Similar to Hungarians by Self-Care Disability
In terms of self-care disability, the demographic groups most similar to Hungarians are English (2.5%, a difference of 0.030%), Immigrants from Kazakhstan (2.5%, a difference of 0.060%), Immigrants from Afghanistan (2.5%, a difference of 0.10%), Immigrants from Bosnia and Herzegovina (2.5%, a difference of 0.20%), and Indonesian (2.5%, a difference of 0.21%).
| Demographics | Rating | Rank | Self-Care Disability |
| Czechoslovakians | 53.5 /100 | #172 | Average 2.5% |
| Immigrants | Burma/Myanmar | 52.8 /100 | #173 | Average 2.5% |
| Welsh | 50.0 /100 | #174 | Average 2.5% |
| Immigrants | Bosnia and Herzegovina | 49.6 /100 | #175 | Average 2.5% |
| Immigrants | Afghanistan | 47.6 /100 | #176 | Average 2.5% |
| Immigrants | Kazakhstan | 46.7 /100 | #177 | Average 2.5% |
| English | 46.2 /100 | #178 | Average 2.5% |
| Hungarians | 45.5 /100 | #179 | Average 2.5% |
| Indonesians | 41.2 /100 | #180 | Average 2.5% |
| Ghanaians | 40.4 /100 | #181 | Average 2.5% |
| Maltese | 37.5 /100 | #182 | Fair 2.5% |
| Salvadorans | 36.4 /100 | #183 | Fair 2.5% |
| Yugoslavians | 36.1 /100 | #184 | Fair 2.5% |
| Slavs | 34.3 /100 | #185 | Fair 2.5% |
| Immigrants | El Salvador | 33.0 /100 | #186 | Fair 2.5% |
Demographics Similar to Tsimshian by Self-Care Disability
In terms of self-care disability, the demographic groups most similar to Tsimshian are Immigrants from Central America (2.6%, a difference of 0.020%), Haitian (2.6%, a difference of 0.040%), Immigrants from Haiti (2.6%, a difference of 0.060%), Immigrants from Bangladesh (2.6%, a difference of 0.14%), and Immigrants from Liberia (2.6%, a difference of 0.21%).
| Demographics | Rating | Rank | Self-Care Disability |
| Nicaraguans | 0.6 /100 | #248 | Tragic 2.6% |
| Mexican American Indians | 0.5 /100 | #249 | Tragic 2.6% |
| Portuguese | 0.4 /100 | #250 | Tragic 2.6% |
| Immigrants | Liberia | 0.4 /100 | #251 | Tragic 2.6% |
| Immigrants | Bangladesh | 0.4 /100 | #252 | Tragic 2.6% |
| Immigrants | Haiti | 0.3 /100 | #253 | Tragic 2.6% |
| Haitians | 0.3 /100 | #254 | Tragic 2.6% |
| Tsimshian | 0.3 /100 | #255 | Tragic 2.6% |
| Immigrants | Central America | 0.3 /100 | #256 | Tragic 2.6% |
| Potawatomi | 0.3 /100 | #257 | Tragic 2.6% |
| Immigrants | Nonimmigrants | 0.3 /100 | #258 | Tragic 2.6% |
| Immigrants | Belarus | 0.2 /100 | #259 | Tragic 2.6% |
| Chippewa | 0.2 /100 | #260 | Tragic 2.6% |
| Arapaho | 0.2 /100 | #261 | Tragic 2.6% |
| Shoshone | 0.2 /100 | #262 | Tragic 2.7% |