Hungarian College, 1 year or more
COMPARE
Hungarian
Select to Compare
College, 1 year or more
Hungarian College, 1 year or more
59.5%
COLLEGE, 1 YEAR OR MORE
52.9/ 100
METRIC RATING
168th/ 347
METRIC RANK
Hungarian College, 1 year or more Correlation Chart
The statistical analysis conducted on geographies consisting of 486,237,030 people shows a slight positive correlation between the proportion of Hungarians and percentage of population with at least college, 1 year or more education in the United States with a correlation coefficient (R) of 0.091 and weighted average of 59.5%. On average, for every 1% (one percent) increase in Hungarians within a typical geography, there is an increase of 0.071% in percentage of population with at least college, 1 year or more education.
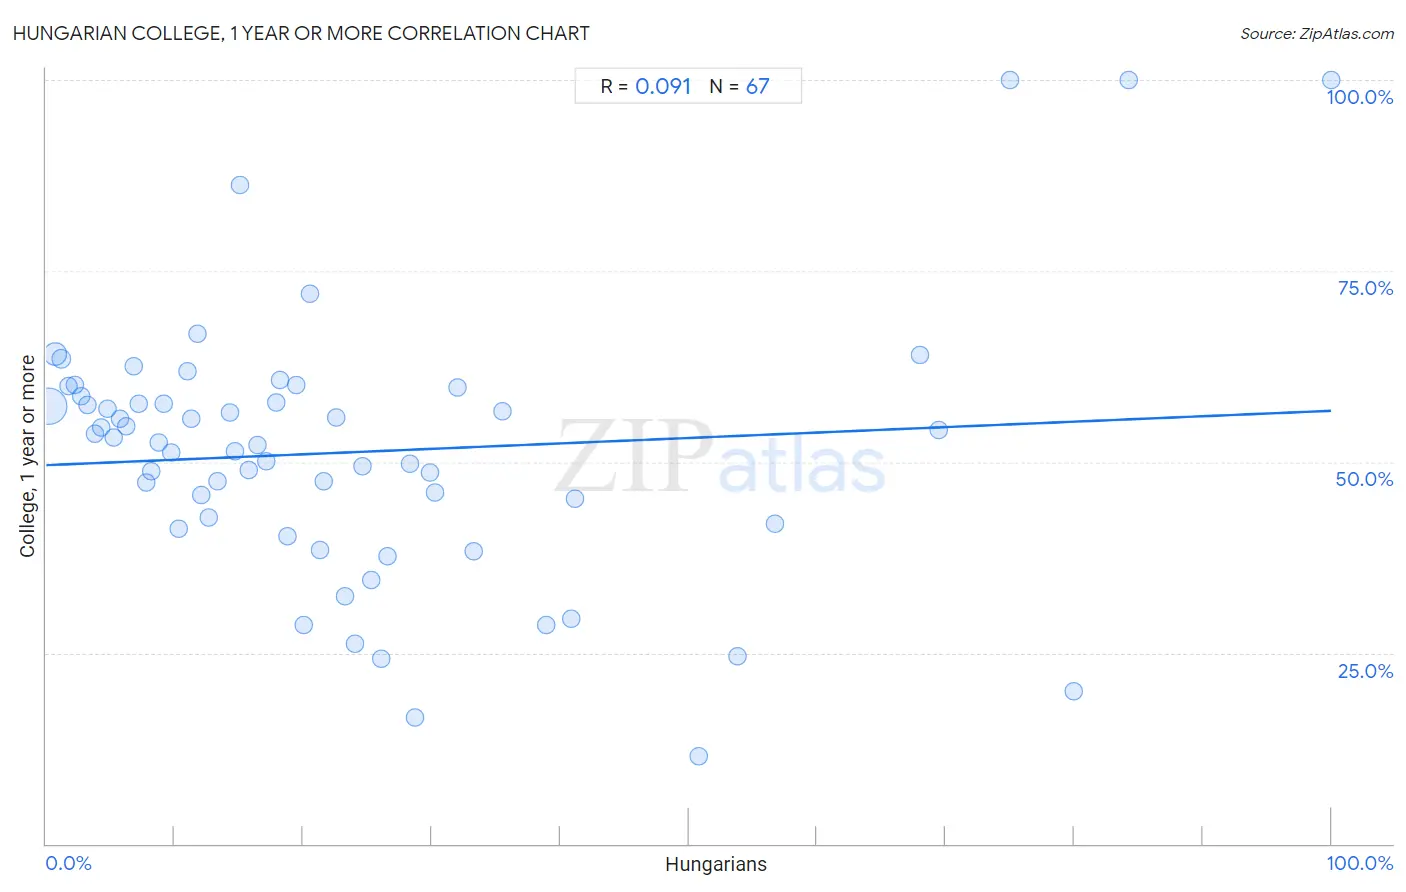
It is essential to understand that the correlation between the percentage of Hungarians and percentage of population with at least college, 1 year or more education does not imply a direct cause-and-effect relationship. It remains uncertain whether the presence of Hungarians influences an upward or downward trend in the level of percentage of population with at least college, 1 year or more education within an area, or if Hungarians simply ended up residing in those areas with higher or lower levels of percentage of population with at least college, 1 year or more education due to other factors.
Demographics Similar to Hungarians by College, 1 year or more
In terms of college, 1 year or more, the demographic groups most similar to Hungarians are Immigrants from North Macedonia (59.5%, a difference of 0.010%), Immigrants from Southern Europe (59.5%, a difference of 0.010%), Welsh (59.5%, a difference of 0.030%), Immigrants from Albania (59.5%, a difference of 0.030%), and Immigrants from Sierra Leone (59.5%, a difference of 0.040%).
| Demographics | Rating | Rank | College, 1 year or more |
| Somalis | 64.5 /100 | #161 | Good 59.9% |
| Koreans | 58.5 /100 | #162 | Average 59.7% |
| Immigrants from Somalia | 58.3 /100 | #163 | Average 59.7% |
| Belgians | 58.1 /100 | #164 | Average 59.7% |
| Irish | 56.1 /100 | #165 | Average 59.6% |
| Immigrants from Africa | 56.1 /100 | #166 | Average 59.6% |
| Immigrants from North Macedonia | 53.1 /100 | #167 | Average 59.5% |
| Hungarians | 52.9 /100 | #168 | Average 59.5% |
| Immigrants from Southern Europe | 52.7 /100 | #169 | Average 59.5% |
| Welsh | 52.4 /100 | #170 | Average 59.5% |
| Immigrants from Albania | 52.3 /100 | #171 | Average 59.5% |
| Immigrants from Sierra Leone | 52.2 /100 | #172 | Average 59.5% |
| Immigrants from Oceania | 51.2 /100 | #173 | Average 59.4% |
| Celtics | 50.0 /100 | #174 | Average 59.4% |
| Sri Lankans | 49.0 /100 | #175 | Average 59.4% |
Hungarian College, 1 year or more Correlation Summary
| Measurement | Hungarian Data | College, 1 year or more Data |
| Minimum | 0.21% | 11.5% |
| Maximum | 100.0% | 100.0% |
| Range | 99.8% | 88.5% |
| Mean | 23.6% | 51.3% |
| Median | 17.9% | 52.6% |
| Interquartile 25% (IQ1) | 8.2% | 41.8% |
| Interquartile 75% (IQ3) | 29.8% | 58.5% |
| Interquartile Range (IQR) | 21.6% | 16.7% |
| Standard Deviation (Sample) | 22.0% | 17.2% |
| Standard Deviation (Population) | 21.9% | 17.1% |
Correlation Details
| Hungarian Percentile | Sample Size | College, 1 year or more |
[ 0.0% - 0.5% ] 0.21% | 357,320,716 | 57.3% |
[ 0.5% - 1.0% ] 0.68% | 85,834,732 | 64.1% |
[ 1.0% - 1.5% ] 1.20% | 21,880,679 | 63.4% |
[ 1.5% - 2.0% ] 1.73% | 8,714,985 | 60.0% |
[ 2.0% - 2.5% ] 2.23% | 4,103,837 | 60.1% |
[ 2.5% - 3.0% ] 2.75% | 2,282,117 | 58.5% |
[ 3.0% - 3.5% ] 3.24% | 1,852,211 | 57.4% |
[ 3.5% - 4.0% ] 3.77% | 1,316,681 | 53.7% |
[ 4.0% - 4.5% ] 4.26% | 909,197 | 54.4% |
[ 4.5% - 5.0% ] 4.74% | 463,093 | 56.9% |
[ 5.0% - 5.5% ] 5.28% | 445,106 | 53.2% |
[ 5.5% - 6.0% ] 5.78% | 156,812 | 55.6% |
[ 6.0% - 6.5% ] 6.22% | 150,307 | 54.7% |
[ 6.5% - 7.0% ] 6.77% | 120,507 | 62.5% |
[ 7.0% - 7.5% ] 7.18% | 84,345 | 57.7% |
[ 7.5% - 8.0% ] 7.75% | 70,914 | 47.3% |
[ 8.0% - 8.5% ] 8.21% | 48,575 | 48.8% |
[ 8.5% - 9.0% ] 8.71% | 28,723 | 52.6% |
[ 9.0% - 9.5% ] 9.16% | 20,816 | 57.6% |
[ 9.5% - 10.0% ] 9.72% | 13,611 | 51.3% |
[ 10.0% - 10.5% ] 10.32% | 6,745 | 41.2% |
[ 10.5% - 11.0% ] 10.94% | 55,636 | 61.9% |
[ 11.0% - 11.5% ] 11.30% | 26,068 | 55.6% |
[ 11.5% - 12.0% ] 11.76% | 18,859 | 66.7% |
[ 12.0% - 12.5% ] 12.06% | 77,181 | 45.6% |
[ 12.5% - 13.0% ] 12.68% | 2,823 | 42.7% |
[ 13.0% - 13.5% ] 13.32% | 2,717 | 47.4% |
[ 14.0% - 14.5% ] 14.26% | 589 | 56.5% |
[ 14.5% - 15.0% ] 14.72% | 795 | 51.4% |
[ 15.0% - 15.5% ] 15.05% | 7,256 | 86.2% |
[ 15.5% - 16.0% ] 15.79% | 266 | 49.0% |
[ 16.0% - 16.5% ] 16.42% | 134 | 52.3% |
[ 17.0% - 17.5% ] 17.14% | 49,953 | 50.1% |
[ 17.5% - 18.0% ] 17.94% | 853 | 57.8% |
[ 18.0% - 18.5% ] 18.23% | 1,871 | 60.7% |
[ 18.5% - 19.0% ] 18.80% | 947 | 40.2% |
[ 19.0% - 19.5% ] 19.42% | 1,921 | 60.1% |
[ 20.0% - 20.5% ] 20.00% | 35 | 28.6% |
[ 20.0% - 20.5% ] 20.49% | 610 | 72.0% |
[ 21.0% - 21.5% ] 21.34% | 28,607 | 38.4% |
[ 21.5% - 22.0% ] 21.57% | 2,035 | 47.5% |
[ 22.5% - 23.0% ] 22.53% | 7,385 | 55.8% |
[ 23.0% - 23.5% ] 23.21% | 224 | 32.4% |
[ 24.0% - 24.5% ] 24.00% | 125 | 26.1% |
[ 24.5% - 25.0% ] 24.63% | 64,313 | 49.4% |
[ 25.0% - 25.5% ] 25.29% | 6,460 | 34.5% |
[ 26.0% - 26.5% ] 26.04% | 864 | 24.2% |
[ 26.5% - 27.0% ] 26.60% | 188 | 37.6% |
[ 28.0% - 28.5% ] 28.34% | 307 | 49.7% |
[ 28.5% - 29.0% ] 28.68% | 638 | 16.5% |
[ 29.5% - 30.0% ] 29.83% | 1,056 | 48.7% |
[ 30.0% - 30.5% ] 30.23% | 258 | 46.0% |
[ 31.5% - 32.0% ] 31.96% | 3,858 | 59.7% |
[ 33.0% - 33.5% ] 33.30% | 871 | 38.3% |
[ 35.5% - 36.0% ] 35.53% | 76 | 56.6% |
[ 38.5% - 39.0% ] 38.95% | 9,614 | 28.7% |
[ 40.5% - 41.0% ] 40.81% | 34,544 | 29.5% |
[ 41.0% - 41.5% ] 41.12% | 1,481 | 45.2% |
[ 50.5% - 51.0% ] 50.79% | 315 | 11.5% |
[ 53.5% - 54.0% ] 53.76% | 173 | 24.6% |
[ 56.5% - 57.0% ] 56.67% | 60 | 41.8% |
[ 68.0% - 68.5% ] 68.00% | 25 | 64.0% |
[ 69.0% - 69.5% ] 69.48% | 154 | 54.2% |
[ 75.0% - 75.5% ] 75.00% | 20 | 100.0% |
[ 80.0% - 80.5% ] 80.00% | 10 | 20.0% |
[ 84.0% - 84.5% ] 84.25% | 127 | 100.0% |
[ 99.5% - 100.0% ] 100.00% | 19 | 100.0% |