Hungarian Female Disability
COMPARE
Hungarian
Select to Compare
Female Disability
Hungarian Female Disability
12.5%
DISABILITY | FEMALES
7.2/ 100
METRIC RATING
229th/ 347
METRIC RANK
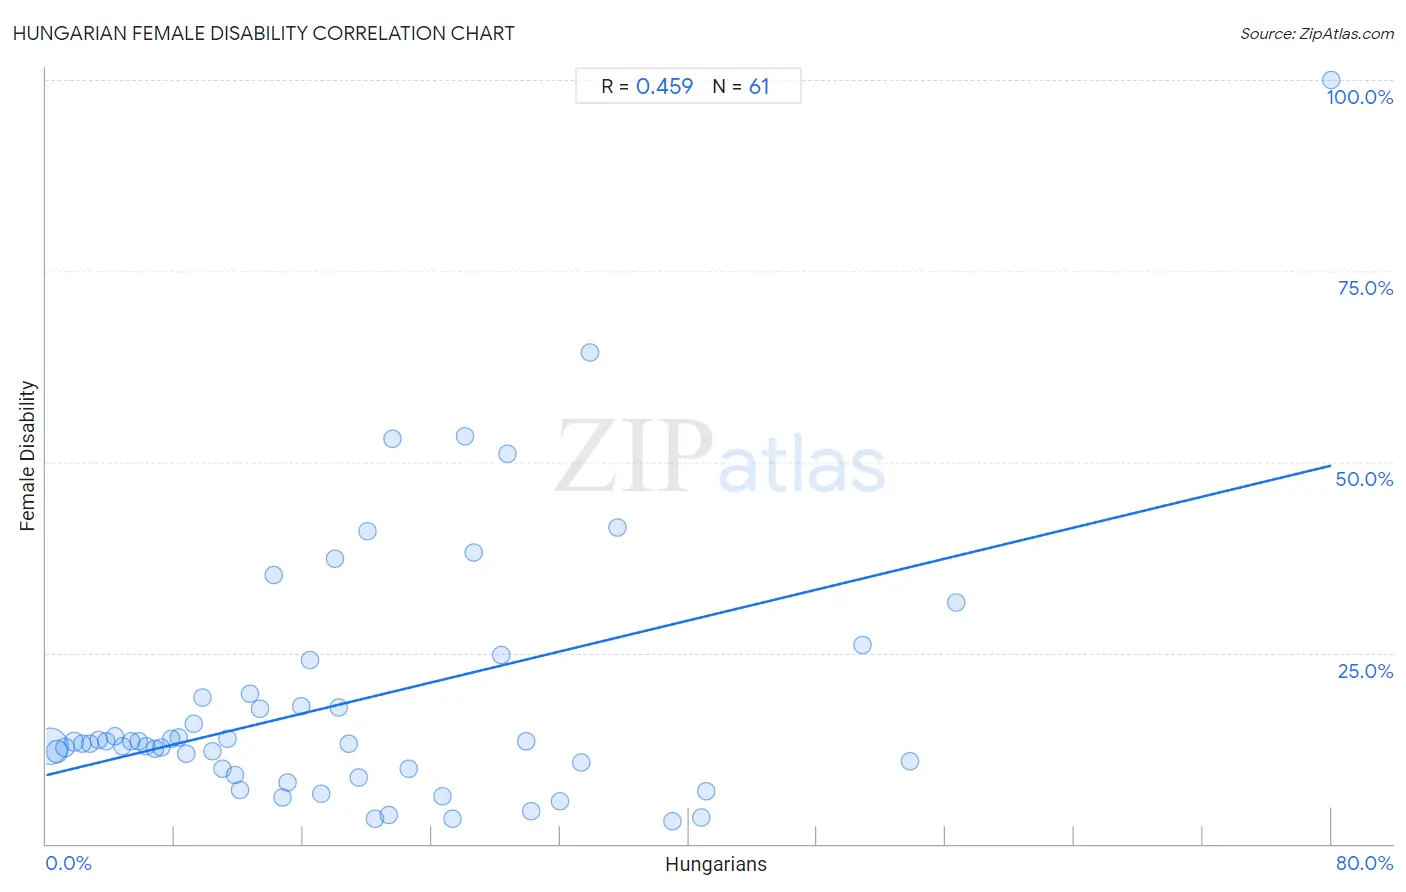
Hungarian Female Disability Correlation Chart
The statistical analysis conducted on geographies consisting of 486,134,772 people shows a moderate positive correlation between the proportion of Hungarians and percentage of females with a disability in the United States with a correlation coefficient (R) of 0.459 and weighted average of 12.5%. On average, for every 1% (one percent) increase in Hungarians within a typical geography, there is an increase of 0.51% in percentage of females with a disability.
It is essential to understand that the correlation between the percentage of Hungarians and percentage of females with a disability does not imply a direct cause-and-effect relationship. It remains uncertain whether the presence of Hungarians influences an upward or downward trend in the level of percentage of females with a disability within an area, or if Hungarians simply ended up residing in those areas with higher or lower levels of percentage of females with a disability due to other factors.
Demographics Similar to Hungarians by Female Disability
In terms of female disability, the demographic groups most similar to Hungarians are Immigrants from Belize (12.5%, a difference of 0.030%), Immigrants from Cambodia (12.5%, a difference of 0.070%), Assyrian/Chaldean/Syriac (12.5%, a difference of 0.10%), Hispanic or Latino (12.5%, a difference of 0.11%), and Belgian (12.5%, a difference of 0.11%).
| Demographics | Rating | Rank | Female Disability |
| Italians | 10.7 /100 | #222 | Poor 12.4% |
| Guamanians/Chamorros | 9.5 /100 | #223 | Tragic 12.5% |
| Belizeans | 9.3 /100 | #224 | Tragic 12.5% |
| Poles | 8.4 /100 | #225 | Tragic 12.5% |
| Hispanics or Latinos | 8.0 /100 | #226 | Tragic 12.5% |
| Assyrians/Chaldeans/Syriacs | 8.0 /100 | #227 | Tragic 12.5% |
| Immigrants from Cambodia | 7.8 /100 | #228 | Tragic 12.5% |
| Hungarians | 7.2 /100 | #229 | Tragic 12.5% |
| Immigrants from Belize | 7.0 /100 | #230 | Tragic 12.5% |
| Belgians | 6.5 /100 | #231 | Tragic 12.5% |
| Immigrants from Somalia | 5.9 /100 | #232 | Tragic 12.5% |
| Immigrants from Iraq | 5.3 /100 | #233 | Tragic 12.5% |
| Scandinavians | 5.3 /100 | #234 | Tragic 12.5% |
| Malaysians | 5.0 /100 | #235 | Tragic 12.5% |
| Immigrants from West Indies | 4.4 /100 | #236 | Tragic 12.6% |
Hungarian Female Disability Correlation Summary
| Measurement | Hungarian Data | Female Disability Data |
| Minimum | 0.21% | 2.9% |
| Maximum | 80.0% | 100.0% |
| Range | 79.8% | 97.1% |
| Mean | 19.2% | 18.7% |
| Median | 15.9% | 13.1% |
| Interquartile 25% (IQ1) | 7.5% | 9.4% |
| Interquartile 75% (IQ3) | 27.5% | 19.4% |
| Interquartile Range (IQR) | 20.0% | 10.0% |
| Standard Deviation (Sample) | 15.7% | 17.3% |
| Standard Deviation (Population) | 15.6% | 17.2% |
Correlation Details
| Hungarian Percentile | Sample Size | Female Disability |
[ 0.0% - 0.5% ] 0.21% | 357,277,384 | 12.7% |
[ 0.5% - 1.0% ] 0.68% | 85,809,710 | 12.1% |
[ 1.0% - 1.5% ] 1.20% | 21,878,458 | 12.5% |
[ 1.5% - 2.0% ] 1.73% | 8,709,859 | 13.4% |
[ 2.0% - 2.5% ] 2.23% | 4,102,279 | 13.1% |
[ 2.5% - 3.0% ] 2.75% | 2,276,456 | 13.1% |
[ 3.0% - 3.5% ] 3.25% | 1,849,524 | 13.6% |
[ 3.5% - 4.0% ] 3.77% | 1,316,458 | 13.4% |
[ 4.0% - 4.5% ] 4.26% | 909,015 | 14.0% |
[ 4.5% - 5.0% ] 4.74% | 462,592 | 12.8% |
[ 5.0% - 5.5% ] 5.28% | 443,024 | 13.5% |
[ 5.5% - 6.0% ] 5.78% | 156,761 | 13.5% |
[ 6.0% - 6.5% ] 6.22% | 148,608 | 12.8% |
[ 6.5% - 7.0% ] 6.77% | 119,667 | 12.4% |
[ 7.0% - 7.5% ] 7.17% | 80,490 | 12.6% |
[ 7.5% - 8.0% ] 7.75% | 70,721 | 13.7% |
[ 8.0% - 8.5% ] 8.21% | 48,243 | 13.9% |
[ 8.5% - 9.0% ] 8.70% | 26,092 | 11.9% |
[ 9.0% - 9.5% ] 9.16% | 20,175 | 15.7% |
[ 9.5% - 10.0% ] 9.72% | 13,528 | 19.2% |
[ 10.0% - 10.5% ] 10.32% | 6,375 | 12.1% |
[ 10.5% - 11.0% ] 10.95% | 54,799 | 9.9% |
[ 11.0% - 11.5% ] 11.30% | 26,068 | 13.7% |
[ 11.5% - 12.0% ] 11.76% | 18,633 | 9.0% |
[ 12.0% - 12.5% ] 12.06% | 77,181 | 7.0% |
[ 12.5% - 13.0% ] 12.68% | 2,823 | 19.6% |
[ 13.0% - 13.5% ] 13.33% | 2,595 | 17.6% |
[ 14.0% - 14.5% ] 14.20% | 331 | 35.2% |
[ 14.5% - 15.0% ] 14.72% | 795 | 6.1% |
[ 15.0% - 15.5% ] 15.05% | 7,256 | 8.0% |
[ 15.5% - 16.0% ] 15.85% | 164 | 17.9% |
[ 16.0% - 16.5% ] 16.42% | 67 | 24.0% |
[ 17.0% - 17.5% ] 17.14% | 49,855 | 6.6% |
[ 17.5% - 18.0% ] 17.96% | 802 | 37.3% |
[ 18.0% - 18.5% ] 18.23% | 1,871 | 17.9% |
[ 18.5% - 19.0% ] 18.84% | 807 | 13.1% |
[ 19.0% - 19.5% ] 19.42% | 1,792 | 8.7% |
[ 20.0% - 20.5% ] 20.00% | 30 | 40.9% |
[ 20.0% - 20.5% ] 20.49% | 610 | 3.2% |
[ 21.0% - 21.5% ] 21.34% | 28,607 | 3.8% |
[ 21.5% - 22.0% ] 21.57% | 2,035 | 53.0% |
[ 22.5% - 23.0% ] 22.53% | 7,385 | 9.8% |
[ 24.5% - 25.0% ] 24.63% | 64,313 | 6.1% |
[ 25.0% - 25.5% ] 25.29% | 6,460 | 3.2% |
[ 26.0% - 26.5% ] 26.04% | 864 | 53.3% |
[ 26.5% - 27.0% ] 26.60% | 188 | 38.2% |
[ 28.0% - 28.5% ] 28.34% | 307 | 24.7% |
[ 28.5% - 29.0% ] 28.69% | 610 | 51.0% |
[ 29.5% - 30.0% ] 29.88% | 897 | 13.4% |
[ 30.0% - 30.5% ] 30.23% | 258 | 4.3% |
[ 31.5% - 32.0% ] 31.96% | 3,858 | 5.5% |
[ 33.0% - 33.5% ] 33.30% | 871 | 10.6% |
[ 33.5% - 34.0% ] 33.83% | 133 | 64.3% |
[ 35.5% - 36.0% ] 35.53% | 76 | 41.5% |
[ 38.5% - 39.0% ] 38.95% | 9,578 | 2.9% |
[ 40.5% - 41.0% ] 40.81% | 34,395 | 3.5% |
[ 41.0% - 41.5% ] 41.12% | 1,481 | 6.8% |
[ 50.5% - 51.0% ] 50.79% | 315 | 26.1% |
[ 53.5% - 54.0% ] 53.76% | 173 | 10.8% |
[ 56.5% - 57.0% ] 56.67% | 60 | 31.6% |
[ 80.0% - 80.5% ] 80.00% | 10 | 100.0% |