Hungarian Disability Age Under 5
COMPARE
Hungarian
Select to Compare
Disability Age Under 5
Hungarian Disability Age Under 5
1.5%
DISABILITY | AGE UNDER 5
0.0/ 100
METRIC RATING
289th/ 347
METRIC RANK
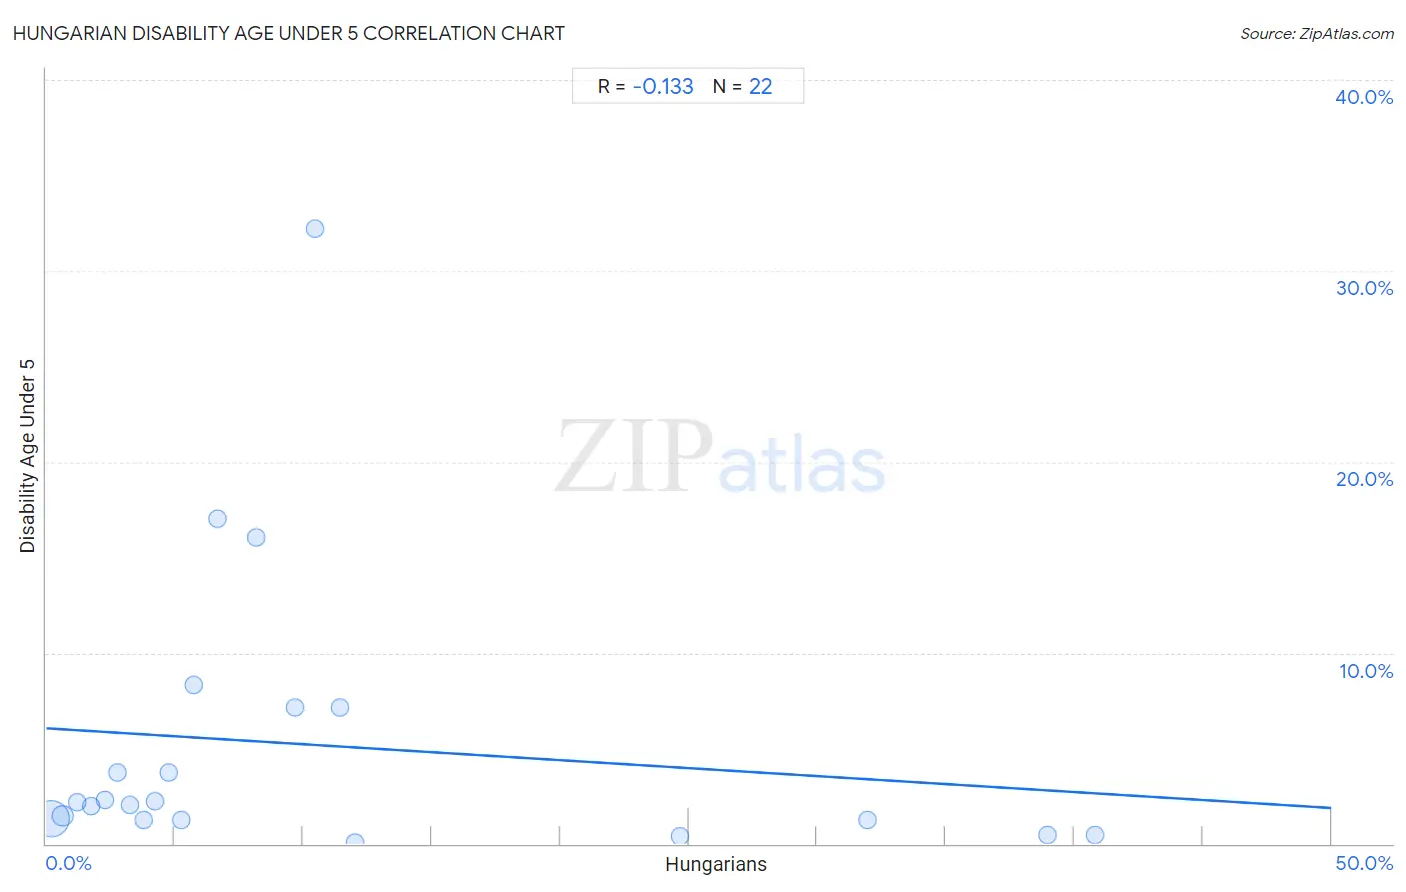
Hungarian Disability Age Under 5 Correlation Chart
The statistical analysis conducted on geographies consisting of 239,705,292 people shows a poor negative correlation between the proportion of Hungarians and percentage of population with a disability under the age of 5 in the United States with a correlation coefficient (R) of -0.133 and weighted average of 1.5%. On average, for every 1% (one percent) increase in Hungarians within a typical geography, there is a decrease of 0.083% in percentage of population with a disability under the age of 5.
It is essential to understand that the correlation between the percentage of Hungarians and percentage of population with a disability under the age of 5 does not imply a direct cause-and-effect relationship. It remains uncertain whether the presence of Hungarians influences an upward or downward trend in the level of percentage of population with a disability under the age of 5 within an area, or if Hungarians simply ended up residing in those areas with higher or lower levels of percentage of population with a disability under the age of 5 due to other factors.
Demographics Similar to Hungarians by Disability Age Under 5
In terms of disability age under 5, the demographic groups most similar to Hungarians are Czech (1.5%, a difference of 0.13%), Estonian (1.5%, a difference of 0.14%), Northern European (1.6%, a difference of 0.22%), Scandinavian (1.5%, a difference of 0.32%), and Tlingit-Haida (1.5%, a difference of 0.37%).
| Demographics | Rating | Rank | Disability Age Under 5 |
| Cheyenne | 0.0 /100 | #282 | Tragic 1.5% |
| Delaware | 0.0 /100 | #283 | Tragic 1.5% |
| Europeans | 0.0 /100 | #284 | Tragic 1.5% |
| Croatians | 0.0 /100 | #285 | Tragic 1.5% |
| Tlingit-Haida | 0.0 /100 | #286 | Tragic 1.5% |
| Scandinavians | 0.0 /100 | #287 | Tragic 1.5% |
| Estonians | 0.0 /100 | #288 | Tragic 1.5% |
| Hungarians | 0.0 /100 | #289 | Tragic 1.5% |
| Czechs | 0.0 /100 | #290 | Tragic 1.5% |
| Northern Europeans | 0.0 /100 | #291 | Tragic 1.6% |
| Italians | 0.0 /100 | #292 | Tragic 1.6% |
| Lithuanians | 0.0 /100 | #293 | Tragic 1.6% |
| Swedes | 0.0 /100 | #294 | Tragic 1.6% |
| Finns | 0.0 /100 | #295 | Tragic 1.6% |
| Poles | 0.0 /100 | #296 | Tragic 1.6% |
Hungarian Disability Age Under 5 Correlation Summary
| Measurement | Hungarian Data | Disability Age Under 5 Data |
| Minimum | 0.21% | 0.082% |
| Maximum | 40.8% | 32.2% |
| Range | 40.6% | 32.1% |
| Mean | 10.5% | 5.2% |
| Median | 5.5% | 2.1% |
| Interquartile 25% (IQ1) | 2.8% | 1.2% |
| Interquartile 75% (IQ3) | 11.4% | 7.1% |
| Interquartile Range (IQR) | 8.7% | 5.9% |
| Standard Deviation (Sample) | 12.2% | 7.6% |
| Standard Deviation (Population) | 11.9% | 7.5% |
Correlation Details
| Hungarian Percentile | Sample Size | Disability Age Under 5 |
[ 0.0% - 0.5% ] 0.21% | 193,648,485 | 1.3% |
[ 0.5% - 1.0% ] 0.65% | 34,438,736 | 1.5% |
[ 1.0% - 1.5% ] 1.20% | 5,823,467 | 2.2% |
[ 1.5% - 2.0% ] 1.74% | 2,204,285 | 2.0% |
[ 2.0% - 2.5% ] 2.27% | 975,108 | 2.3% |
[ 2.5% - 3.0% ] 2.77% | 572,328 | 3.7% |
[ 3.0% - 3.5% ] 3.26% | 741,299 | 2.0% |
[ 3.5% - 4.0% ] 3.80% | 412,895 | 1.3% |
[ 4.0% - 4.5% ] 4.22% | 421,050 | 2.2% |
[ 4.5% - 5.0% ] 4.76% | 58,814 | 3.7% |
[ 5.0% - 5.5% ] 5.26% | 184,901 | 1.2% |
[ 5.5% - 6.0% ] 5.73% | 8,553 | 8.3% |
[ 6.5% - 7.0% ] 6.65% | 2,555 | 17.0% |
[ 8.0% - 8.5% ] 8.17% | 24,493 | 16.1% |
[ 9.5% - 10.0% ] 9.69% | 3,910 | 7.1% |
[ 10.0% - 10.5% ] 10.44% | 2,597 | 32.2% |
[ 11.0% - 11.5% ] 11.43% | 446 | 7.1% |
[ 12.0% - 12.5% ] 12.03% | 70,555 | 0.082% |
[ 24.5% - 25.0% ] 24.64% | 63,011 | 0.39% |
[ 31.5% - 32.0% ] 31.96% | 3,858 | 1.2% |
[ 38.5% - 39.0% ] 38.95% | 9,578 | 0.46% |
[ 40.5% - 41.0% ] 40.81% | 34,368 | 0.44% |