Hungarian vs Japanese Self-Care Disability
COMPARE
Hungarian
Japanese
Self-Care Disability
Self-Care Disability Comparison
Hungarians
Japanese
2.5%
SELF-CARE DISABILITY
45.5/ 100
METRIC RATING
179th/ 347
METRIC RANK
2.7%
SELF-CARE DISABILITY
0.1/ 100
METRIC RATING
276th/ 347
METRIC RANK
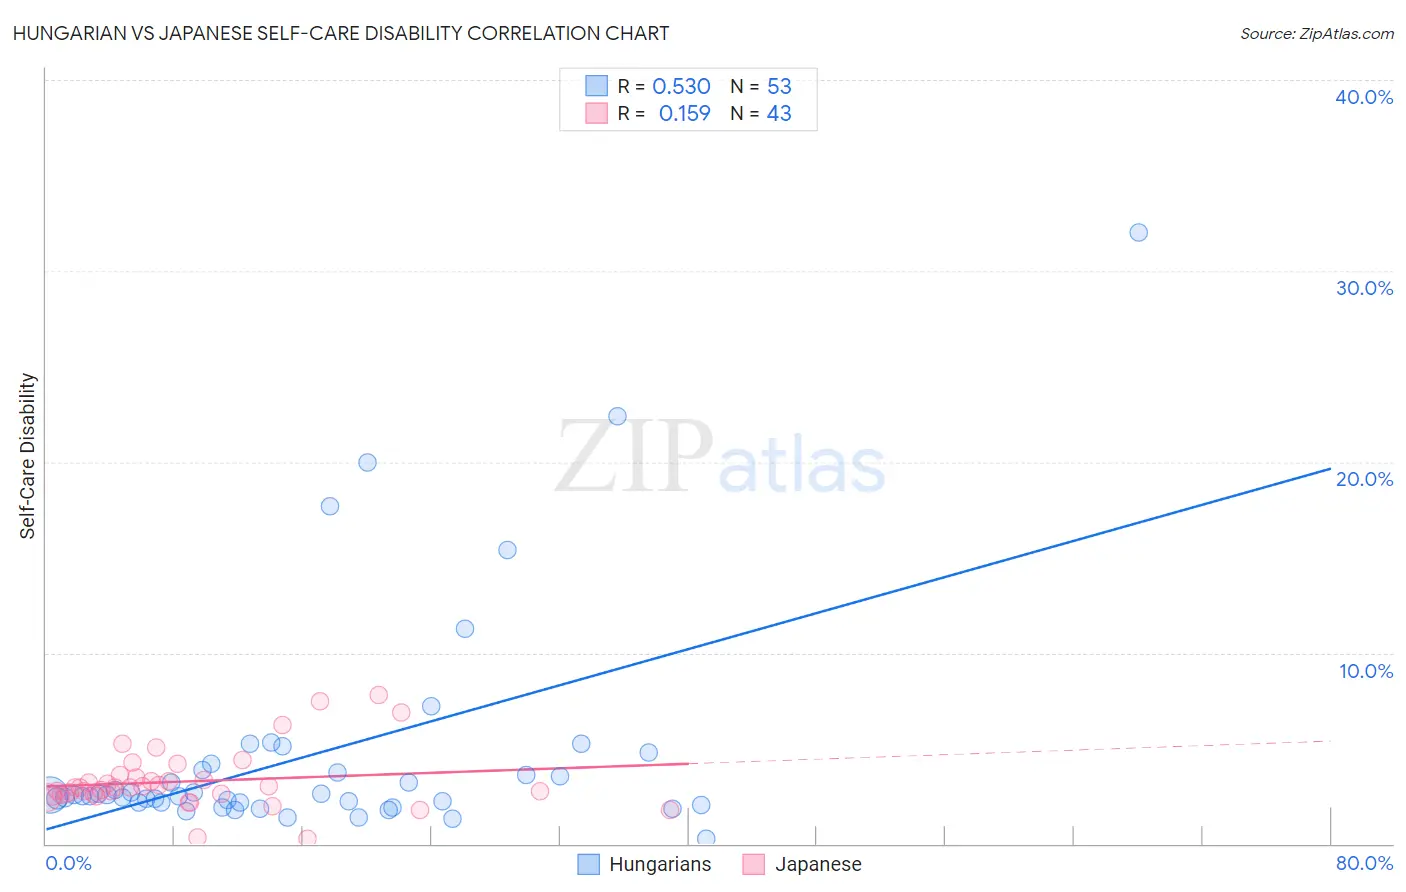
Hungarian vs Japanese Self-Care Disability Correlation Chart
The statistical analysis conducted on geographies consisting of 485,258,327 people shows a substantial positive correlation between the proportion of Hungarians and percentage of population with self-care disability in the United States with a correlation coefficient (R) of 0.530 and weighted average of 2.5%. Similarly, the statistical analysis conducted on geographies consisting of 249,013,660 people shows a poor positive correlation between the proportion of Japanese and percentage of population with self-care disability in the United States with a correlation coefficient (R) of 0.159 and weighted average of 2.7%, a difference of 8.5%.
Self-Care Disability Correlation Summary
| Measurement | Hungarian | Japanese |
| Minimum | 0.28% | 0.26% |
| Maximum | 32.0% | 7.8% |
| Range | 31.7% | 7.6% |
| Mean | 4.7% | 3.3% |
| Median | 2.5% | 2.9% |
| Interquartile 25% (IQ1) | 2.2% | 2.6% |
| Interquartile 75% (IQ3) | 4.0% | 3.5% |
| Interquartile Range (IQR) | 1.8% | 0.91% |
| Standard Deviation (Sample) | 6.0% | 1.6% |
| Standard Deviation (Population) | 5.9% | 1.5% |
Similar Demographics by Self-Care Disability
Demographics Similar to Hungarians by Self-Care Disability
In terms of self-care disability, the demographic groups most similar to Hungarians are English (2.5%, a difference of 0.030%), Immigrants from Kazakhstan (2.5%, a difference of 0.060%), Immigrants from Afghanistan (2.5%, a difference of 0.10%), Immigrants from Bosnia and Herzegovina (2.5%, a difference of 0.20%), and Indonesian (2.5%, a difference of 0.21%).
| Demographics | Rating | Rank | Self-Care Disability |
| Czechoslovakians | 53.5 /100 | #172 | Average 2.5% |
| Immigrants | Burma/Myanmar | 52.8 /100 | #173 | Average 2.5% |
| Welsh | 50.0 /100 | #174 | Average 2.5% |
| Immigrants | Bosnia and Herzegovina | 49.6 /100 | #175 | Average 2.5% |
| Immigrants | Afghanistan | 47.6 /100 | #176 | Average 2.5% |
| Immigrants | Kazakhstan | 46.7 /100 | #177 | Average 2.5% |
| English | 46.2 /100 | #178 | Average 2.5% |
| Hungarians | 45.5 /100 | #179 | Average 2.5% |
| Indonesians | 41.2 /100 | #180 | Average 2.5% |
| Ghanaians | 40.4 /100 | #181 | Average 2.5% |
| Maltese | 37.5 /100 | #182 | Fair 2.5% |
| Salvadorans | 36.4 /100 | #183 | Fair 2.5% |
| Yugoslavians | 36.1 /100 | #184 | Fair 2.5% |
| Slavs | 34.3 /100 | #185 | Fair 2.5% |
| Immigrants | El Salvador | 33.0 /100 | #186 | Fair 2.5% |
Demographics Similar to Japanese by Self-Care Disability
In terms of self-care disability, the demographic groups most similar to Japanese are Immigrants from Ukraine (2.7%, a difference of 0.060%), Yakama (2.7%, a difference of 0.13%), Immigrants from Trinidad and Tobago (2.7%, a difference of 0.13%), Ottawa (2.7%, a difference of 0.14%), and Mexican (2.7%, a difference of 0.19%).
| Demographics | Rating | Rank | Self-Care Disability |
| U.S. Virgin Islanders | 0.1 /100 | #269 | Tragic 2.7% |
| Immigrants | Micronesia | 0.1 /100 | #270 | Tragic 2.7% |
| Trinidadians and Tobagonians | 0.1 /100 | #271 | Tragic 2.7% |
| Immigrants | Laos | 0.1 /100 | #272 | Tragic 2.7% |
| Mexicans | 0.1 /100 | #273 | Tragic 2.7% |
| Yakama | 0.1 /100 | #274 | Tragic 2.7% |
| Immigrants | Trinidad and Tobago | 0.1 /100 | #275 | Tragic 2.7% |
| Japanese | 0.1 /100 | #276 | Tragic 2.7% |
| Immigrants | Ukraine | 0.1 /100 | #277 | Tragic 2.7% |
| Ottawa | 0.1 /100 | #278 | Tragic 2.7% |
| Iroquois | 0.1 /100 | #279 | Tragic 2.7% |
| Hispanics or Latinos | 0.1 /100 | #280 | Tragic 2.7% |
| Immigrants | Iraq | 0.0 /100 | #281 | Tragic 2.7% |
| Apache | 0.0 /100 | #282 | Tragic 2.7% |
| Delaware | 0.0 /100 | #283 | Tragic 2.7% |