Costa Rican vs Immigrants from Latvia Self-Care Disability
COMPARE
Costa Rican
Immigrants from Latvia
Self-Care Disability
Self-Care Disability Comparison
Costa Ricans
Immigrants from Latvia
2.4%
SELF-CARE DISABILITY
80.8/ 100
METRIC RATING
144th/ 347
METRIC RANK
2.4%
SELF-CARE DISABILITY
97.0/ 100
METRIC RATING
93rd/ 347
METRIC RANK
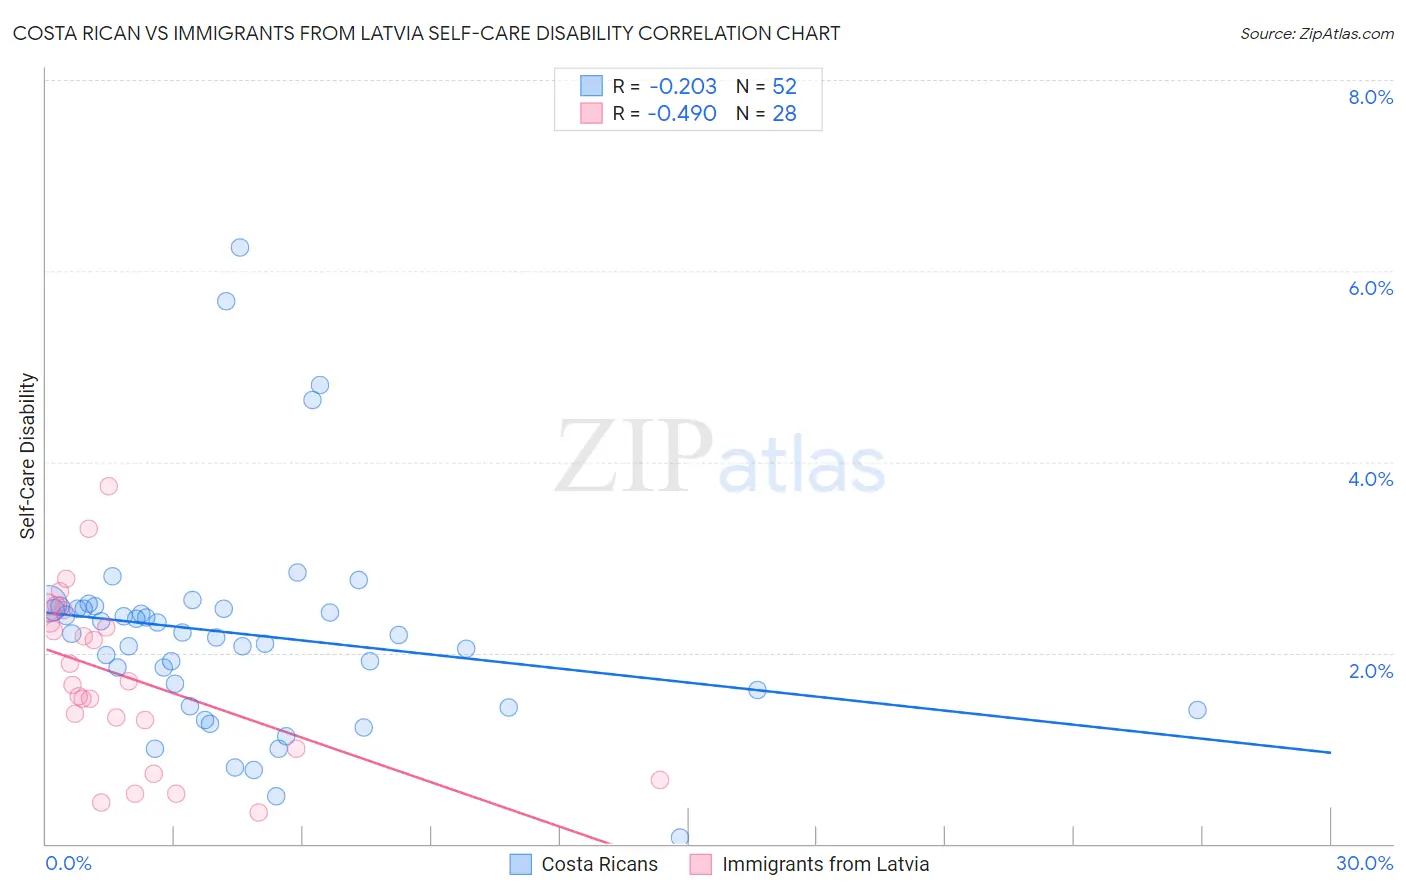
Costa Rican vs Immigrants from Latvia Self-Care Disability Correlation Chart
The statistical analysis conducted on geographies consisting of 253,379,189 people shows a weak negative correlation between the proportion of Costa Ricans and percentage of population with self-care disability in the United States with a correlation coefficient (R) of -0.203 and weighted average of 2.4%. Similarly, the statistical analysis conducted on geographies consisting of 113,697,152 people shows a moderate negative correlation between the proportion of Immigrants from Latvia and percentage of population with self-care disability in the United States with a correlation coefficient (R) of -0.490 and weighted average of 2.4%, a difference of 2.5%.
Self-Care Disability Correlation Summary
| Measurement | Costa Rican | Immigrants from Latvia |
| Minimum | 0.069% | 0.33% |
| Maximum | 6.2% | 3.7% |
| Range | 6.2% | 3.4% |
| Mean | 2.2% | 1.8% |
| Median | 2.2% | 1.7% |
| Interquartile 25% (IQ1) | 1.5% | 1.1% |
| Interquartile 75% (IQ3) | 2.5% | 2.4% |
| Interquartile Range (IQR) | 0.94% | 1.2% |
| Standard Deviation (Sample) | 1.1% | 0.89% |
| Standard Deviation (Population) | 1.1% | 0.87% |
Similar Demographics by Self-Care Disability
Demographics Similar to Costa Ricans by Self-Care Disability
In terms of self-care disability, the demographic groups most similar to Costa Ricans are German (2.4%, a difference of 0.050%), Israeli (2.4%, a difference of 0.060%), Afghan (2.4%, a difference of 0.12%), Immigrants from Peru (2.4%, a difference of 0.20%), and Dutch (2.4%, a difference of 0.25%).
| Demographics | Rating | Rank | Self-Care Disability |
| Austrians | 87.0 /100 | #137 | Excellent 2.4% |
| Immigrants | Croatia | 86.6 /100 | #138 | Excellent 2.4% |
| Sri Lankans | 86.6 /100 | #139 | Excellent 2.4% |
| Immigrants | Uruguay | 85.4 /100 | #140 | Excellent 2.4% |
| Alaska Natives | 84.5 /100 | #141 | Excellent 2.4% |
| Immigrants | Peru | 83.2 /100 | #142 | Excellent 2.4% |
| Afghans | 82.3 /100 | #143 | Excellent 2.4% |
| Costa Ricans | 80.8 /100 | #144 | Excellent 2.4% |
| Germans | 80.1 /100 | #145 | Excellent 2.4% |
| Israelis | 80.0 /100 | #146 | Good 2.4% |
| Dutch | 77.5 /100 | #147 | Good 2.4% |
| Romanians | 75.8 /100 | #148 | Good 2.4% |
| Arabs | 75.7 /100 | #149 | Good 2.4% |
| Immigrants | Costa Rica | 75.1 /100 | #150 | Good 2.4% |
| Basques | 74.0 /100 | #151 | Good 2.4% |
Demographics Similar to Immigrants from Latvia by Self-Care Disability
In terms of self-care disability, the demographic groups most similar to Immigrants from Latvia are Macedonian (2.4%, a difference of 0.040%), Immigrants from Asia (2.4%, a difference of 0.050%), Immigrants from Chile (2.4%, a difference of 0.11%), Swiss (2.4%, a difference of 0.16%), and Icelander (2.4%, a difference of 0.19%).
| Demographics | Rating | Rank | Self-Care Disability |
| Immigrants | Northern Africa | 98.2 /100 | #86 | Exceptional 2.3% |
| Sierra Leoneans | 98.0 /100 | #87 | Exceptional 2.4% |
| Lithuanians | 98.0 /100 | #88 | Exceptional 2.4% |
| Immigrants | Congo | 98.0 /100 | #89 | Exceptional 2.4% |
| Immigrants | Czechoslovakia | 97.7 /100 | #90 | Exceptional 2.4% |
| Immigrants | Jordan | 97.7 /100 | #91 | Exceptional 2.4% |
| Icelanders | 97.4 /100 | #92 | Exceptional 2.4% |
| Immigrants | Latvia | 97.0 /100 | #93 | Exceptional 2.4% |
| Macedonians | 96.9 /100 | #94 | Exceptional 2.4% |
| Immigrants | Asia | 96.9 /100 | #95 | Exceptional 2.4% |
| Immigrants | Chile | 96.7 /100 | #96 | Exceptional 2.4% |
| Swiss | 96.6 /100 | #97 | Exceptional 2.4% |
| Immigrants | Poland | 96.4 /100 | #98 | Exceptional 2.4% |
| Immigrants | Israel | 96.1 /100 | #99 | Exceptional 2.4% |
| Europeans | 95.8 /100 | #100 | Exceptional 2.4% |