Zip Codes with the Highest Percentage of Self-Employed / Not Incorporated in Denver, CO

RELATED REPORTS & OPTIONS

Self-Employed / Not Incorporated
Population
Families and Households
Female Fertility
Female Fertility (Unmarried)
Race (Community Size)
Race (Percentage)
Ancestry (Community Size)
AfghanAfricanAlaska NativeAlbanianAlsatianAmericanApacheArabArapahoArgentineanArmenianAssyrian / Chaldean / SyriacAustralianAustrianBahamianBangladeshiBarbadianBasqueBelgianBhutaneseBlackfeetBolivianBrazilianBritishBritish West IndianBulgarianBurmeseCajunCambodianCanadianCape VerdeanCelticCentral AmericanCentral American IndianCherokeeCheyenneChickasawChileanChippewaChoctawColombianComancheCosta RicanCreeCreekCroatianCrowCubanCzechCzechoslovakianDanishDelawareDominicanDutchEastern EuropeanEcuadorianEgyptianEnglishEstonianEthiopianEuropeanFijianFilipinoFinnishFrenchFrench American IndianFrench CanadianGermanGerman RussianGhanaianGreekGuamanian / ChamorroGuatemalanGuyaneseHaitianHonduranHopiHungarianIcelanderIndian (Asian)IndonesianInupiatIranianIraqiIrishIroquoisIsraeliItalianJamaicanJapaneseJordanianKenyanKiowaKoreanLaotianLatvianLebaneseLiberianLithuanianLuxembourgerMacedonianMalaysianMalteseMarshalleseMenomineeMexicanMexican American IndianMongolianMoroccanNative HawaiianNavajoNew ZealanderNicaraguanNigerianNorthern EuropeanNorwegianOkinawanOsagePakistaniPalestinianPanamanianParaguayanPennsylvania GermanPeruvianPimaPolishPortuguesePotawatomiPuebloPuerto RicanRomanianRussianSalvadoranSamoanScandinavianScotch-IrishScottishSeminoleSenegaleseSerbianShoshoneSierra LeoneanSiouxSlavicSlovakSloveneSomaliSouth AfricanSouth AmericanSouth American IndianSpaniardSpanishSpanish AmericanSpanish American IndianSri LankanSubsaharan AfricanSudaneseSwedishSwissSyrianThaiTrinidadian and TobagonianTurkishU.S. Virgin IslanderUgandanUkrainianUruguayanUteVenezuelanVietnameseWelshWest IndianYaquiYugoslavian
Ancestry (Percentage)
AfghanAfricanAlaska NativeAlbanianAlsatianAmericanApacheArabArapahoArgentineanArmenianAssyrian / Chaldean / SyriacAustralianAustrianBahamianBangladeshiBarbadianBasqueBelgianBhutaneseBlackfeetBolivianBrazilianBritishBritish West IndianBulgarianBurmeseCajunCambodianCanadianCape VerdeanCelticCentral AmericanCentral American IndianCherokeeCheyenneChickasawChileanChippewaChoctawColombianComancheCosta RicanCreeCreekCroatianCrowCubanCzechCzechoslovakianDanishDelawareDominicanDutchEastern EuropeanEcuadorianEgyptianEnglishEstonianEthiopianEuropeanFijianFilipinoFinnishFrenchFrench American IndianFrench CanadianGermanGerman RussianGhanaianGreekGuamanian / ChamorroGuatemalanGuyaneseHaitianHonduranHopiHungarianIcelanderIndian (Asian)IndonesianInupiatIranianIraqiIrishIroquoisIsraeliItalianJamaicanJapaneseJordanianKenyanKiowaKoreanLaotianLatvianLebaneseLiberianLithuanianLuxembourgerMacedonianMalaysianMalteseMarshalleseMenomineeMexicanMexican American IndianMongolianMoroccanNative HawaiianNavajoNew ZealanderNicaraguanNigerianNorthern EuropeanNorwegianOkinawanOsagePakistaniPalestinianPanamanianParaguayanPennsylvania GermanPeruvianPimaPolishPortuguesePotawatomiPuebloPuerto RicanRomanianRussianSalvadoranSamoanScandinavianScotch-IrishScottishSeminoleSenegaleseSerbianShoshoneSierra LeoneanSiouxSlavicSlovakSloveneSomaliSouth AfricanSouth AmericanSouth American IndianSpaniardSpanishSpanish AmericanSpanish American IndianSri LankanSubsaharan AfricanSudaneseSwedishSwissSyrianThaiTrinidadian and TobagonianTurkishU.S. Virgin IslanderUgandanUkrainianUruguayanUteVenezuelanVietnameseWelshWest IndianYaquiYugoslavian
Immigrant Origin (Total)
AfghanistanAfricaAlbaniaArgentinaArmeniaAsiaAustraliaAustriaBangladeshBarbadosBelarusBelgiumBoliviaBosnia and HerzegovinaBrazilBulgariaBurma / MyanmarCambodiaCameroonCanadaCaribbeanCentral AmericaChileChinaColombiaCongoCosta RicaCroatiaCubaCzechoslovakiaDenmarkDominican RepublicEastern AfricaEastern AsiaEastern EuropeEcuadorEgyptEl SalvadorEnglandEritreaEthiopiaEuropeFranceGermanyGhanaGreeceGuatemalaHaitiHondurasHong KongHungaryIndiaIndonesiaIranIraqIrelandIsraelItalyJamaicaJapanJordanKazakhstanKenyaKoreaLaosLatin AmericaLatviaLebanonLiberiaLithuaniaMalaysiaMexicoMicronesiaMiddle AfricaMoldovaMoroccoNepalNetherlandsNicaraguaNigeriaNorthern AfricaNorthern EuropeNorwayOceaniaPakistanPanamaPeruPhilippinesPolandPortugalRomaniaRussiaSaudi ArabiaScotlandSenegalSerbiaSingaporeSomaliaSouth AfricaSouth AmericaSouth Central AsiaSouth Eastern AsiaSouthern EuropeSpainSudanSwedenSwitzerlandSyriaTaiwanThailandTrinidad and TobagoTurkeyUgandaUkraineUzbekistanVenezuelaVietnamWestern AfricaWestern AsiaWestern EuropeZaire
Immigrant Origin (Percentage)
AfghanistanAfricaAlbaniaArgentinaArmeniaAsiaAustraliaAustriaBangladeshBarbadosBelarusBelgiumBoliviaBosnia and HerzegovinaBrazilBulgariaBurma / MyanmarCambodiaCameroonCanadaCaribbeanCentral AmericaChileChinaColombiaCongoCosta RicaCroatiaCubaCzechoslovakiaDenmarkDominican RepublicEastern AfricaEastern AsiaEastern EuropeEcuadorEgyptEl SalvadorEnglandEritreaEthiopiaEuropeFranceGermanyGhanaGreeceGuatemalaHaitiHondurasHong KongHungaryIndiaIndonesiaIranIraqIrelandIsraelItalyJamaicaJapanJordanKazakhstanKenyaKoreaLaosLatin AmericaLatviaLebanonLiberiaLithuaniaMalaysiaMexicoMicronesiaMiddle AfricaMoldovaMoroccoNepalNetherlandsNicaraguaNigeriaNorthern AfricaNorthern EuropeNorwayOceaniaPakistanPanamaPeruPhilippinesPolandPortugalRomaniaRussiaSaudi ArabiaScotlandSenegalSerbiaSingaporeSomaliaSouth AfricaSouth AmericaSouth Central AsiaSouth Eastern AsiaSouthern EuropeSpainSudanSwedenSwitzerlandSyriaTaiwanThailandTrinidad and TobagoTurkeyUgandaUkraineUzbekistanVenezuelaVietnamWestern AfricaWestern AsiaWestern EuropeZaire
Income
Income (Families)
Income (Households)
Poverty
Poverty (Families)
Unemployment
Employment Occupations
Employment Industries
Employer Class
Commute Time
Commute Means
School Enrollment
Education by Degree Field
Occupancy
Finances
Physical Characteristics
Denver
Compare Zip Codes
Comparison Subject

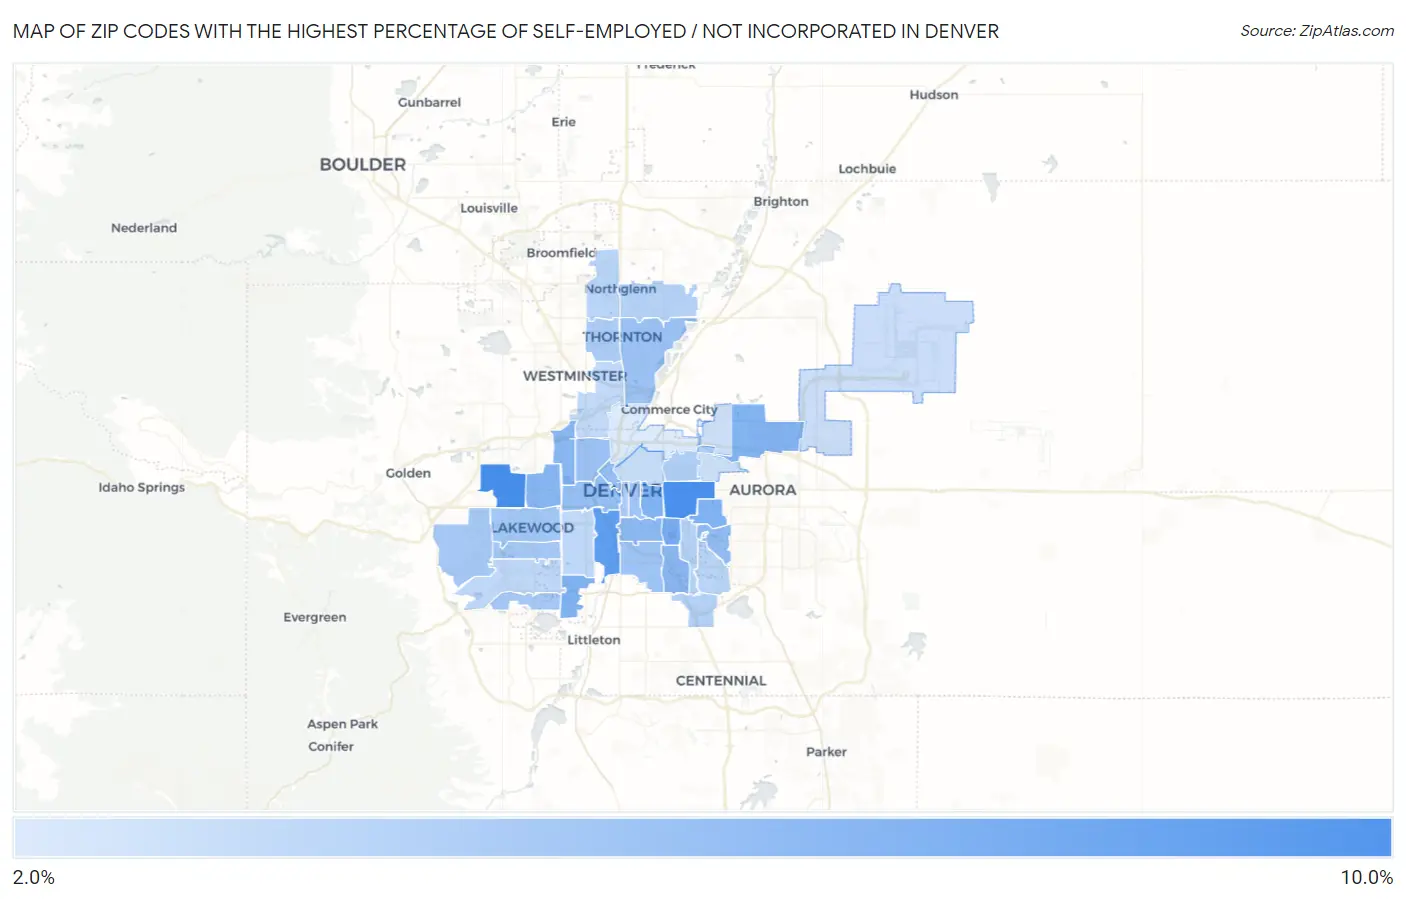
Map of Zip Codes with the Highest Percentage of Self-Employed / Not Incorporated in Denver

0.0%
10.0%
Zip Codes with the Highest Percentage of Self-Employed / Not Incorporated in Denver Map

Zip Codes with the Highest Percentage of Self-Employed / Not Incorporated in Denver, CO

Zip Code % Self-Employed / Not Incorporated vs State vs National
1.802158.8%6.1%(+2.68)#1875.8%(+2.96)#9,179
2.802208.7%6.1%(+2.57)#1935.8%(+2.85)#9,358
3.802237.7%6.1%(+1.62)#2185.8%(+1.90)#11,264
4.802466.6%6.1%(+0.533)#2645.8%(+0.815)#14,038
5.802306.4%6.1%(+0.296)#2685.8%(+0.578)#14,807
6.802066.4%6.1%(+0.262)#2705.8%(+0.544)#14,897
7.802366.3%6.1%(+0.236)#2745.8%(+0.519)#14,974
8.802396.2%6.1%(+0.144)#2755.8%(+0.426)#15,282
9.802146.1%6.1%(-0.032)#2845.8%(+0.251)#15,843
10.802226.0%6.1%(-0.144)#2945.8%(+0.138)#16,215
11.802125.9%6.1%(-0.161)#2955.8%(+0.121)#16,271
12.802095.8%6.1%(-0.316)#3045.8%(-0.034)#16,765
13.802475.6%6.1%(-0.538)#3195.8%(-0.256)#17,560
14.802045.5%6.1%(-0.588)#3235.8%(-0.306)#17,741
15.802025.5%6.1%(-0.617)#3255.8%(-0.335)#17,837
16.802295.2%6.1%(-0.879)#3395.8%(-0.597)#18,848
17.802115.2%6.1%(-0.897)#3425.8%(-0.615)#18,917
18.802105.1%6.1%(-1.03)#3515.8%(-0.744)#19,385
19.802185.1%6.1%(-1.05)#3535.8%(-0.763)#19,467
20.802264.9%6.1%(-1.18)#3665.8%(-0.898)#19,994
21.802284.9%6.1%(-1.24)#3715.8%(-0.962)#20,213
22.802354.8%6.1%(-1.29)#3765.8%(-1.01)#20,385
23.802324.8%6.1%(-1.31)#3785.8%(-1.02)#20,452
24.802604.5%6.1%(-1.59)#3955.8%(-1.31)#21,547
25.802034.4%6.1%(-1.65)#4005.8%(-1.37)#21,807
26.802074.3%6.1%(-1.78)#4085.8%(-1.49)#22,240
27.802374.3%6.1%(-1.82)#4125.8%(-1.54)#22,414
28.802244.2%6.1%(-1.89)#4145.8%(-1.61)#22,649
29.802334.2%6.1%(-1.89)#4155.8%(-1.61)#22,658
30.802314.0%6.1%(-2.14)#4195.8%(-1.85)#23,527
31.802344.0%6.1%(-2.14)#4205.8%(-1.86)#23,542
32.802193.8%6.1%(-2.29)#4245.8%(-2.01)#24,055
33.802273.8%6.1%(-2.34)#4275.8%(-2.06)#24,213
34.802213.7%6.1%(-2.44)#4305.8%(-2.15)#24,523
35.802053.6%6.1%(-2.54)#4345.8%(-2.26)#24,819
36.802493.3%6.1%(-2.76)#4405.8%(-2.48)#25,495
37.802383.3%6.1%(-2.82)#4415.8%(-2.54)#25,663
38.802162.6%6.1%(-3.51)#4525.8%(-3.23)#27,267

Common Questions

What are the Top 10 Zip Codes with the Highest Percentage of Self-Employed / Not Incorporated in Denver, CO?
Top 10 Zip Codes with the Highest Percentage of Self-Employed / Not Incorporated in Denver, CO are:
#1
8.8%
#2
8.7%
#3
7.7%
#4
6.6%
#5
6.4%
#6
6.4%
#7
6.3%
#8
6.2%
#9
6.1%
#10
6.0%
What zip code has the Highest Percentage of Self-Employed / Not Incorporated in Denver, CO?
80215 has the Highest Percentage of Self-Employed / Not Incorporated in Denver, CO with 8.8%.
What is the Percentage of Self-Employed / Not Incorporated in Denver, CO?
Percentage of Self-Employed / Not Incorporated in Denver is 5.1%.
What is the Percentage of Self-Employed / Not Incorporated in Colorado?
Percentage of Self-Employed / Not Incorporated in Colorado is 6.1%.
What is the Percentage of Self-Employed / Not Incorporated in the United States?
Percentage of Self-Employed / Not Incorporated in the United States is 5.8%.