Funny River, AK Map & Demographics
Funny River Map
Funny River Overview
$39,100
PER CAPITA INCOME
$63,550
AVG FAMILY INCOME
$61,162
AVG HOUSEHOLD INCOME
23.6%
WAGE / INCOME GAP [ % ]
76.4¢/ $1
WAGE / INCOME GAP [ $ ]
0.48
INEQUALITY / GINI INDEX
1,072
TOTAL POPULATION
513
MALE POPULATION
559
FEMALE POPULATION
91.77
MALES / 100 FEMALES
108.97
FEMALES / 100 MALES
57.9
MEDIAN AGE
2.6
AVG FAMILY SIZE
1.8
AVG HOUSEHOLD SIZE
454
LABOR FORCE [ PEOPLE ]
45.4%
PERCENT IN LABOR FORCE
5.1%
UNEMPLOYMENT RATE
Income in Funny River
Income Overview in Funny River
Per Capita Income in Funny River is $39,100, while median incomes of families and households are $63,550 and $61,162 respectively.
| Characteristic | Number | Measure |
| Per Capita Income | 1,072 | $39,100 |
| Median Family Income | 253 | $63,550 |
| Mean Family Income | 253 | $89,206 |
| Median Household Income | 589 | $61,162 |
| Mean Household Income | 589 | $68,383 |
| Income Deficit | 253 | $0 |
| Wage / Income Gap (%) | 1,072 | 23.64% |
| Wage / Income Gap ($) | 1,072 | 76.36¢ per $1 |
| Gini / Inequality Index | 1,072 | 0.48 |
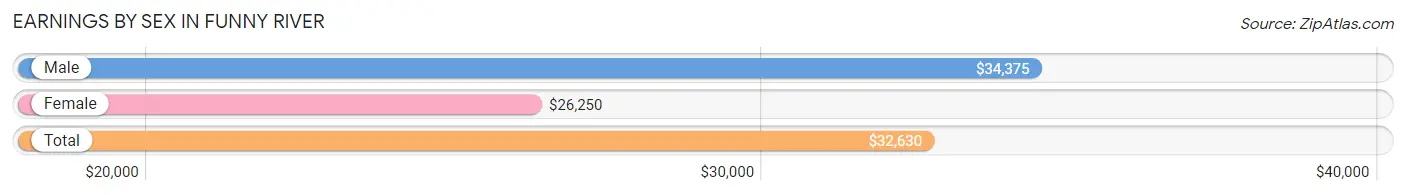
Earnings by Sex in Funny River
Average Earnings in Funny River are $32,630, $34,375 for men and $26,250 for women, a difference of 23.6%.
| Sex | Number | Average Earnings |
| Male | 262 (53.1%) | $34,375 |
| Female | 231 (46.9%) | $26,250 |
| Total | 493 (100.0%) | $32,630 |
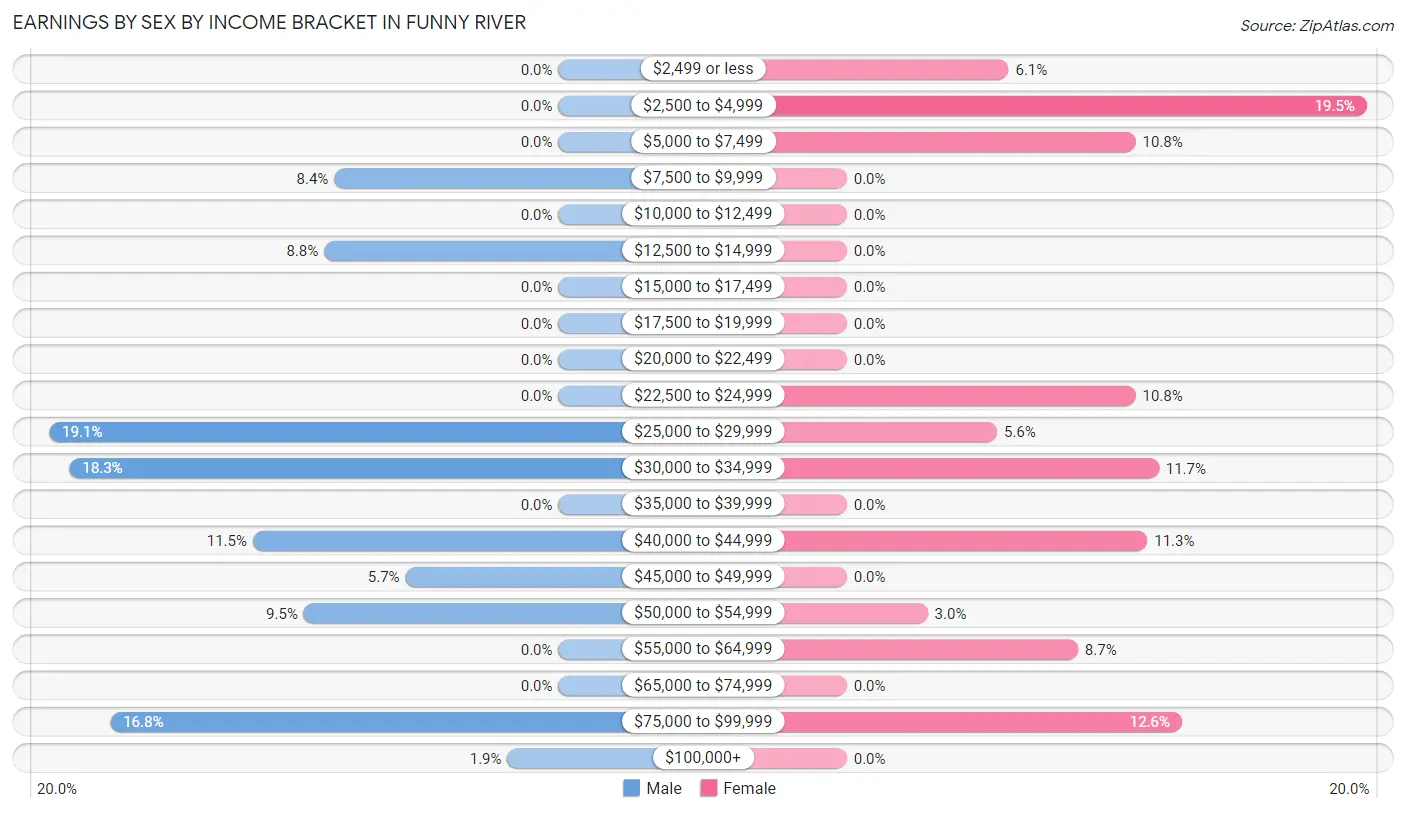
Earnings by Sex by Income Bracket in Funny River
The most common earnings brackets in Funny River are $25,000 to $29,999 for men (50 | 19.1%) and $2,500 to $4,999 for women (45 | 19.5%).
| Income | Male | Female |
| $2,499 or less | 0 (0.0%) | 14 (6.1%) |
| $2,500 to $4,999 | 0 (0.0%) | 45 (19.5%) |
| $5,000 to $7,499 | 0 (0.0%) | 25 (10.8%) |
| $7,500 to $9,999 | 22 (8.4%) | 0 (0.0%) |
| $10,000 to $12,499 | 0 (0.0%) | 0 (0.0%) |
| $12,500 to $14,999 | 23 (8.8%) | 0 (0.0%) |
| $15,000 to $17,499 | 0 (0.0%) | 0 (0.0%) |
| $17,500 to $19,999 | 0 (0.0%) | 0 (0.0%) |
| $20,000 to $22,499 | 0 (0.0%) | 0 (0.0%) |
| $22,500 to $24,999 | 0 (0.0%) | 25 (10.8%) |
| $25,000 to $29,999 | 50 (19.1%) | 13 (5.6%) |
| $30,000 to $34,999 | 48 (18.3%) | 27 (11.7%) |
| $35,000 to $39,999 | 0 (0.0%) | 0 (0.0%) |
| $40,000 to $44,999 | 30 (11.5%) | 26 (11.3%) |
| $45,000 to $49,999 | 15 (5.7%) | 0 (0.0%) |
| $50,000 to $54,999 | 25 (9.5%) | 7 (3.0%) |
| $55,000 to $64,999 | 0 (0.0%) | 20 (8.7%) |
| $65,000 to $74,999 | 0 (0.0%) | 0 (0.0%) |
| $75,000 to $99,999 | 44 (16.8%) | 29 (12.6%) |
| $100,000+ | 5 (1.9%) | 0 (0.0%) |
| Total | 262 (100.0%) | 231 (100.0%) |
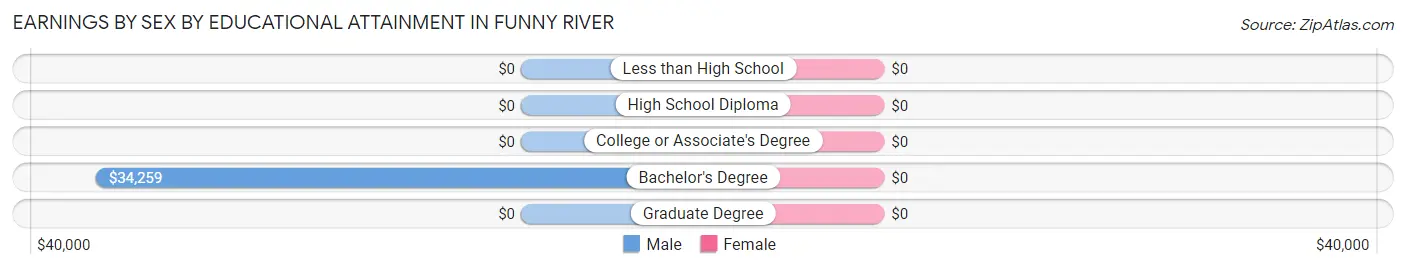
Earnings by Sex by Educational Attainment in Funny River
| Educational Attainment | Male Income | Female Income |
| Less than High School | - | - |
| High School Diploma | - | - |
| College or Associate's Degree | - | - |
| Bachelor's Degree | $34,259 | $0 |
| Graduate Degree | - | - |
| Total | $34,375 | $31,528 |
Family Income in Funny River
Family Income Brackets in Funny River
According to the Funny River family income data, there are 89 families falling into the $50,000 to $74,999 income range, which is the most common income bracket and makes up 35.2% of all families.
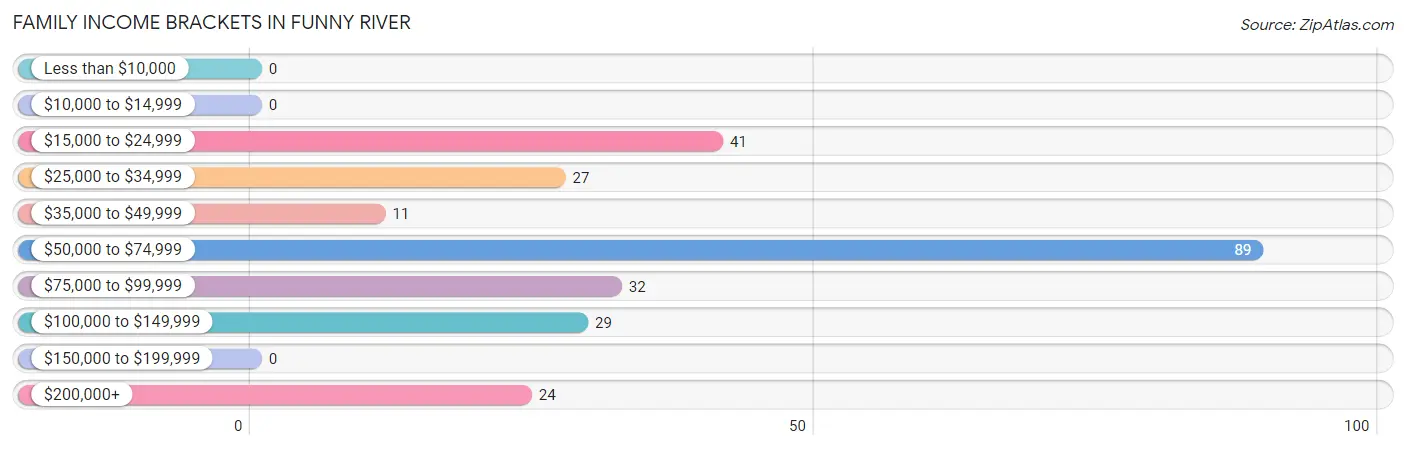
| Income Bracket | # Families | % Families |
| Less than $10,000 | 0 | 0.0% |
| $10,000 to $14,999 | 0 | 0.0% |
| $15,000 to $24,999 | 41 | 16.2% |
| $25,000 to $34,999 | 27 | 10.7% |
| $35,000 to $49,999 | 11 | 4.3% |
| $50,000 to $74,999 | 89 | 35.2% |
| $75,000 to $99,999 | 32 | 12.6% |
| $100,000 to $149,999 | 29 | 11.5% |
| $150,000 to $199,999 | 0 | 0.0% |
| $200,000+ | 24 | 9.5% |
Family Income by Famaliy Size in Funny River
2-person families (201 | 79.4%) account for the highest median family income in Funny River with $68,315 per family, while 2-person families (201 | 79.4%) have the highest median income of $34,158 per family member.
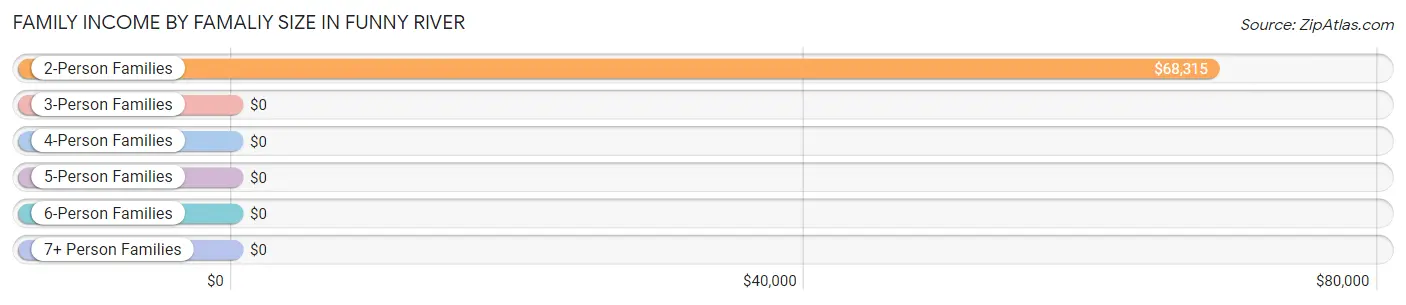
| Income Bracket | # Families | Median Income |
| 2-Person Families | 201 (79.4%) | $68,315 |
| 3-Person Families | 27 (10.7%) | $0 |
| 4-Person Families | 0 (0.0%) | $0 |
| 5-Person Families | 0 (0.0%) | $0 |
| 6-Person Families | 25 (9.9%) | $0 |
| 7+ Person Families | 0 (0.0%) | $0 |
| Total | 253 (100.0%) | $63,550 |
Family Income by Number of Earners in Funny River
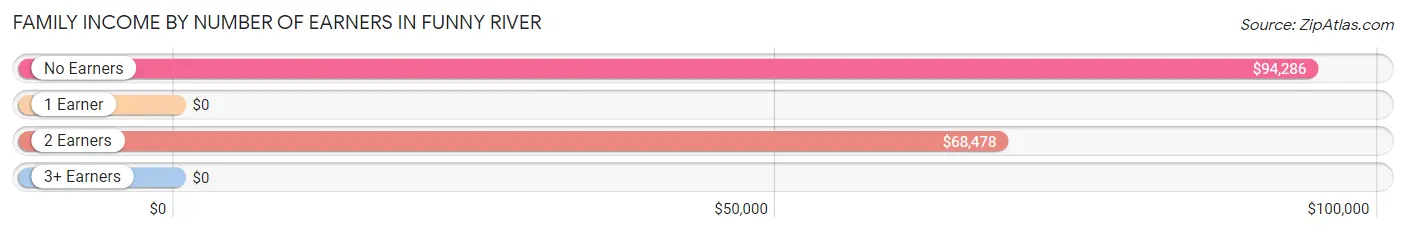
| Number of Earners | # Families | Median Income |
| No Earners | 100 (39.5%) | $94,286 |
| 1 Earner | 64 (25.3%) | $0 |
| 2 Earners | 64 (25.3%) | $68,478 |
| 3+ Earners | 25 (9.9%) | $0 |
| Total | 253 (100.0%) | $63,550 |
Household Income in Funny River
Household Income Brackets in Funny River
With 147 households falling in the category, the $50,000 to $74,999 income range is the most frequent in Funny River, accounting for 25.0% of all households. In contrast, only 17 households (2.9%) fall into the $10,000 to $14,999 income bracket, making it the least populous group.
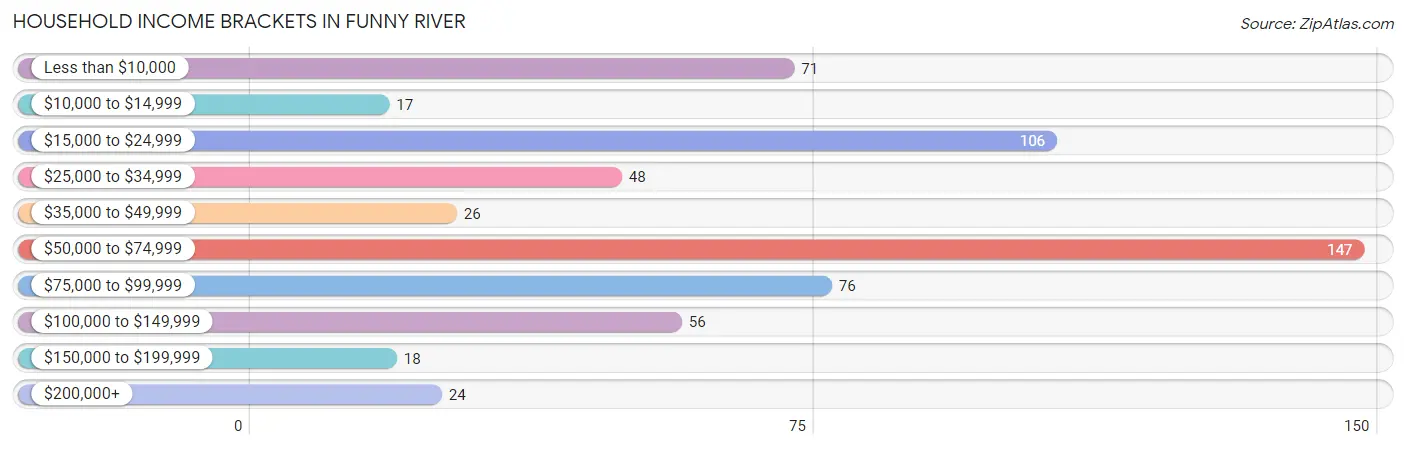
| Income Bracket | # Households | % Households |
| Less than $10,000 | 71 | 12.1% |
| $10,000 to $14,999 | 17 | 2.9% |
| $15,000 to $24,999 | 106 | 18.0% |
| $25,000 to $34,999 | 48 | 8.1% |
| $35,000 to $49,999 | 26 | 4.4% |
| $50,000 to $74,999 | 147 | 25.0% |
| $75,000 to $99,999 | 76 | 12.9% |
| $100,000 to $149,999 | 56 | 9.5% |
| $150,000 to $199,999 | 18 | 3.1% |
| $200,000+ | 24 | 4.1% |
Household Income by Householder Age in Funny River
The median household income in Funny River is $61,162, with the highest median household income of $63,523 found in the 65+ years age bracket for the primary householder. A total of 219 households (37.2%) fall into this category.
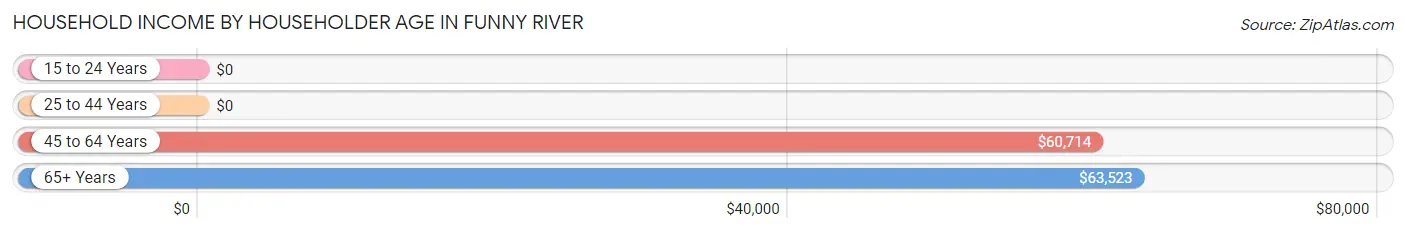
| Income Bracket | # Households | Median Income |
| 15 to 24 Years | 0 (0.0%) | $0 |
| 25 to 44 Years | 20 (3.4%) | $0 |
| 45 to 64 Years | 350 (59.4%) | $60,714 |
| 65+ Years | 219 (37.2%) | $63,523 |
| Total | 589 (100.0%) | $61,162 |
Poverty in Funny River
Income Below Poverty by Sex and Age in Funny River
With 19.5% poverty level for males and 2.5% for females among the residents of Funny River, 35 to 44 year old males and 45 to 54 year old females are the most vulnerable to poverty, with 20 males (76.9%) and 14 females (13.5%) in their respective age groups living below the poverty level.
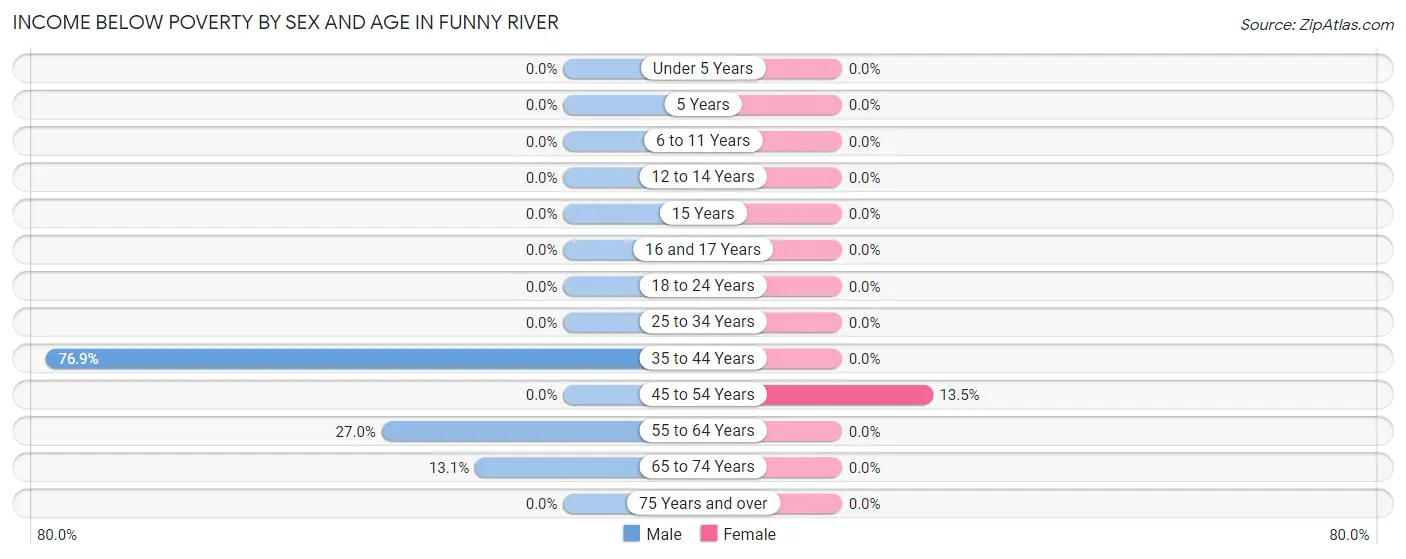
| Age Bracket | Male | Female |
| Under 5 Years | 0 (0.0%) | 0 (0.0%) |
| 5 Years | 0 (0.0%) | 0 (0.0%) |
| 6 to 11 Years | 0 (0.0%) | 0 (0.0%) |
| 12 to 14 Years | 0 (0.0%) | 0 (0.0%) |
| 15 Years | 0 (0.0%) | 0 (0.0%) |
| 16 and 17 Years | 0 (0.0%) | 0 (0.0%) |
| 18 to 24 Years | 0 (0.0%) | 0 (0.0%) |
| 25 to 34 Years | 0 (0.0%) | 0 (0.0%) |
| 35 to 44 Years | 20 (76.9%) | 0 (0.0%) |
| 45 to 54 Years | 0 (0.0%) | 14 (13.5%) |
| 55 to 64 Years | 51 (27.0%) | 0 (0.0%) |
| 65 to 74 Years | 29 (13.1%) | 0 (0.0%) |
| 75 Years and over | 0 (0.0%) | 0 (0.0%) |
| Total | 100 (19.5%) | 14 (2.5%) |
Income Above Poverty by Sex and Age in Funny River
According to the poverty statistics in Funny River, males aged 25 to 34 years and females aged under 5 years are the age groups that are most secure financially, with 100.0% of males and 100.0% of females in these age groups living above the poverty line.
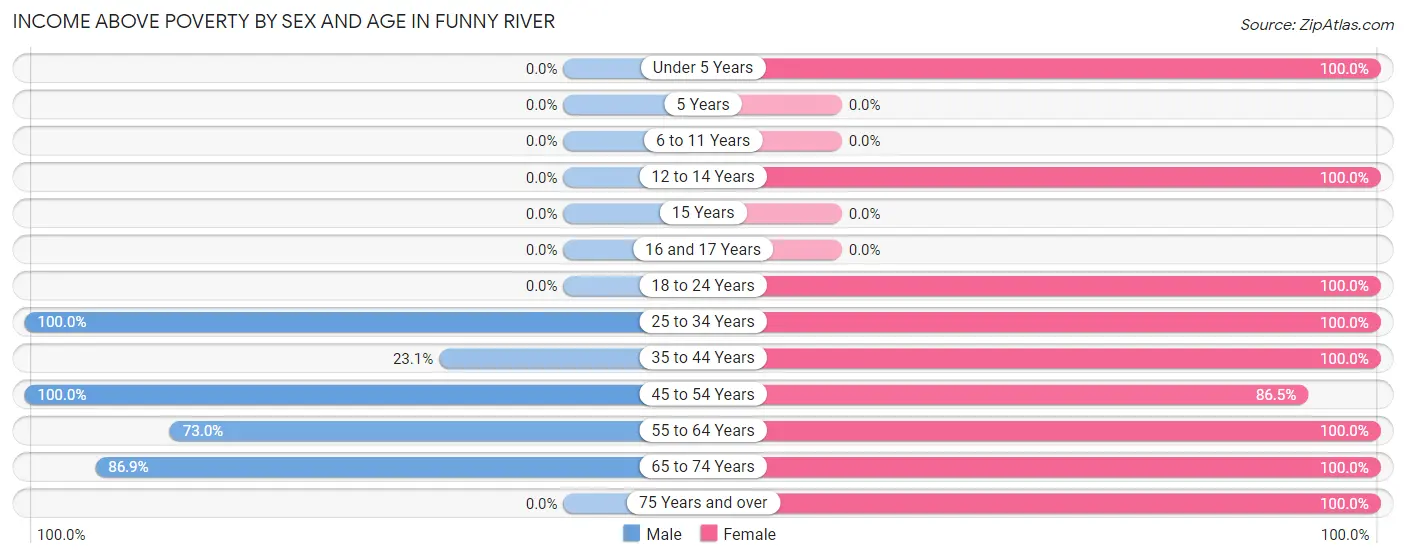
| Age Bracket | Male | Female |
| Under 5 Years | 0 (0.0%) | 41 (100.0%) |
| 5 Years | 0 (0.0%) | 0 (0.0%) |
| 6 to 11 Years | 0 (0.0%) | 0 (0.0%) |
| 12 to 14 Years | 0 (0.0%) | 30 (100.0%) |
| 15 Years | 0 (0.0%) | 0 (0.0%) |
| 16 and 17 Years | 0 (0.0%) | 0 (0.0%) |
| 18 to 24 Years | 0 (0.0%) | 46 (100.0%) |
| 25 to 34 Years | 23 (100.0%) | 29 (100.0%) |
| 35 to 44 Years | 6 (23.1%) | 29 (100.0%) |
| 45 to 54 Years | 54 (100.0%) | 90 (86.5%) |
| 55 to 64 Years | 138 (73.0%) | 132 (100.0%) |
| 65 to 74 Years | 192 (86.9%) | 122 (100.0%) |
| 75 Years and over | 0 (0.0%) | 26 (100.0%) |
| Total | 413 (80.5%) | 545 (97.5%) |
Income Below Poverty Among Married-Couple Families in Funny River
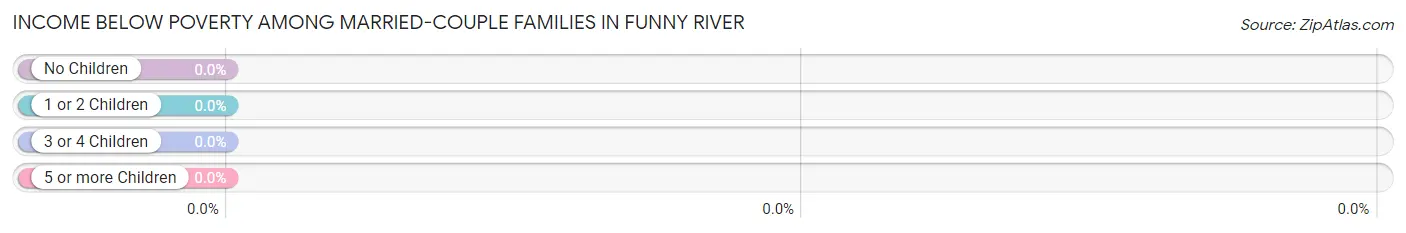
| Children | Above Poverty | Below Poverty |
| No Children | 183 (100.0%) | 0 (0.0%) |
| 1 or 2 Children | 25 (100.0%) | 0 (0.0%) |
| 3 or 4 Children | 0 (0.0%) | 0 (0.0%) |
| 5 or more Children | 0 (0.0%) | 0 (0.0%) |
| Total | 208 (100.0%) | 0 (0.0%) |
Income Below Poverty Among Single-Parent Households in Funny River
| Children | Single Father | Single Mother |
| No Children | 0 (0.0%) | 0 (0.0%) |
| 1 or 2 Children | 0 (0.0%) | 0 (0.0%) |
| 3 or 4 Children | 0 (0.0%) | 0 (0.0%) |
| 5 or more Children | 0 (0.0%) | 0 (0.0%) |
| Total | 0 (0.0%) | 0 (0.0%) |
Income Below Poverty Among Married-Couple vs Single-Parent Households in Funny River
| Children | Married-Couple Families | Single-Parent Households |
| No Children | 0 (0.0%) | 0 (0.0%) |
| 1 or 2 Children | 0 (0.0%) | 0 (0.0%) |
| 3 or 4 Children | 0 (0.0%) | 0 (0.0%) |
| 5 or more Children | 0 (0.0%) | 0 (0.0%) |
| Total | 0 (0.0%) | 0 (0.0%) |
Race in Funny River
The most populous races in Funny River are White / Caucasian (820 | 76.5%), Two or more Races (104 | 9.7%), and Black / African American (85 | 7.9%).
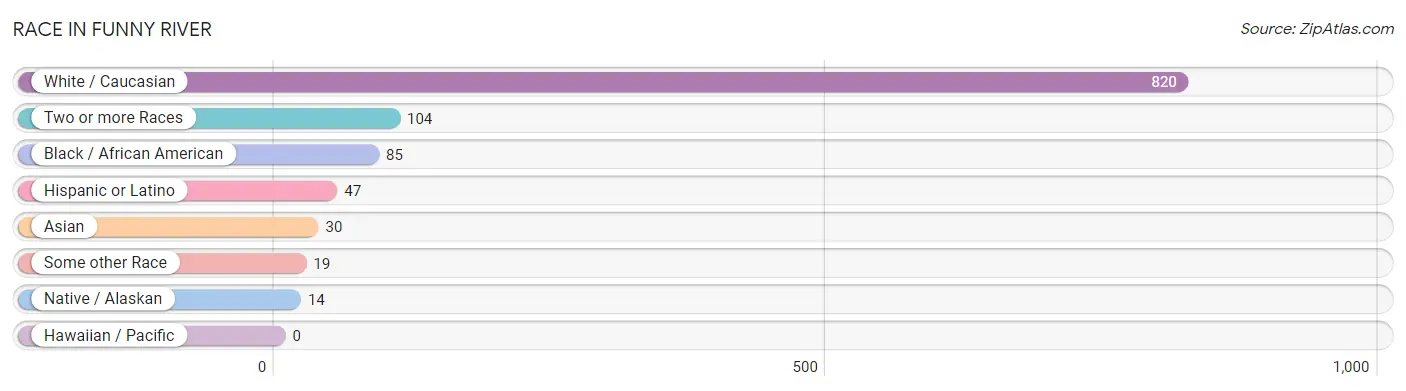
| Race | # Population | % Population |
| Asian | 30 | 2.8% |
| Black / African American | 85 | 7.9% |
| Hawaiian / Pacific | 0 | 0.0% |
| Hispanic or Latino | 47 | 4.4% |
| Native / Alaskan | 14 | 1.3% |
| White / Caucasian | 820 | 76.5% |
| Two or more Races | 104 | 9.7% |
| Some other Race | 19 | 1.8% |
| Total | 1,072 | 100.0% |
Ancestry in Funny River
The most populous ancestries reported in Funny River are German (143 | 13.3%), Irish (140 | 13.1%), English (123 | 11.5%), Italian (91 | 8.5%), and European (86 | 8.0%), together accounting for 54.4% of all Funny River residents.
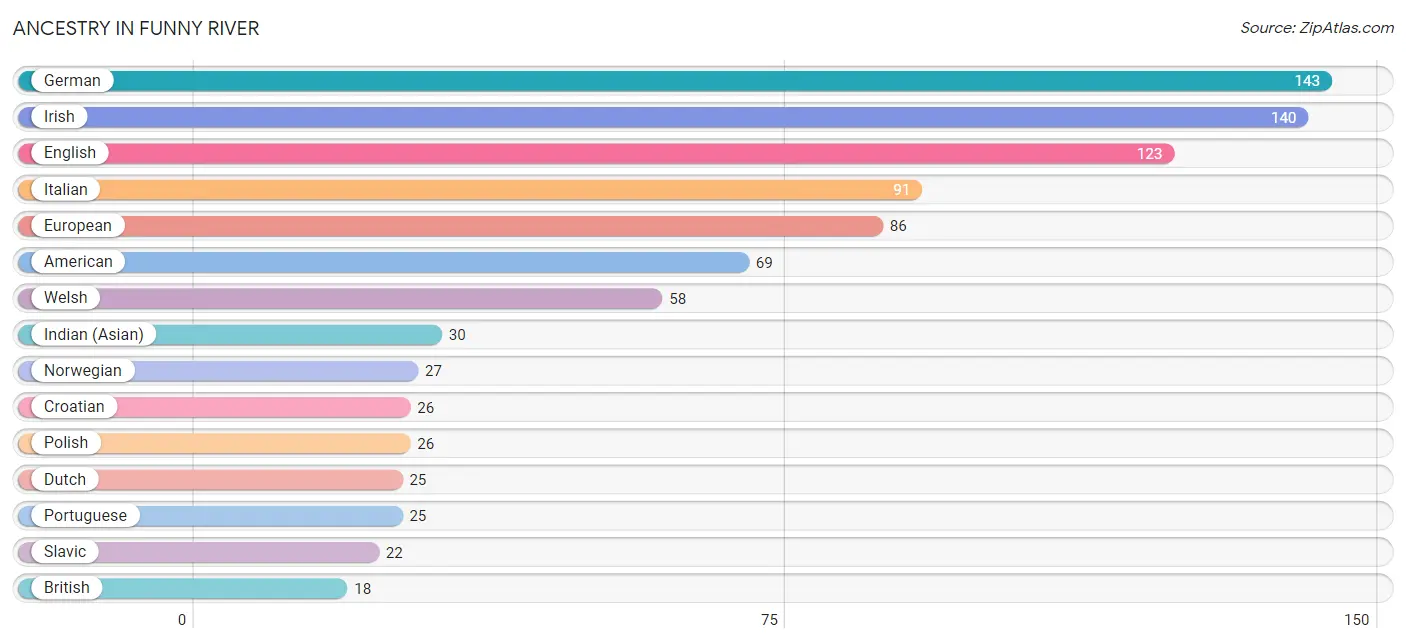
| Ancestry | # Population | % Population |
| Alaska Native | 14 | 1.3% |
| American | 69 | 6.4% |
| British | 18 | 1.7% |
| Cherokee | 18 | 1.7% |
| Croatian | 26 | 2.4% |
| Czech | 18 | 1.7% |
| Dutch | 25 | 2.3% |
| English | 123 | 11.5% |
| European | 86 | 8.0% |
| French | 17 | 1.6% |
| German | 143 | 13.3% |
| Indian (Asian) | 30 | 2.8% |
| Irish | 140 | 13.1% |
| Italian | 91 | 8.5% |
| Mexican | 13 | 1.2% |
| Norwegian | 27 | 2.5% |
| Polish | 26 | 2.4% |
| Portuguese | 25 | 2.3% |
| Scottish | 12 | 1.1% |
| Slavic | 22 | 2.1% |
| Spaniard | 15 | 1.4% |
| Welsh | 58 | 5.4% | View All 22 Rows |
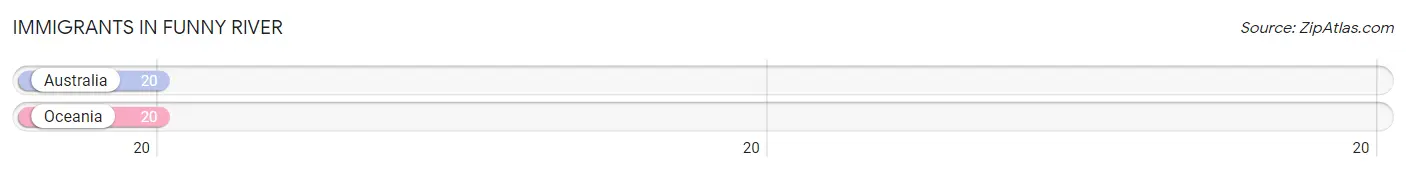
Immigrants in Funny River
The most numerous immigrant groups reported in Funny River came from Australia (20 | 1.9%), and Oceania (20 | 1.9%), together accounting for 3.7% of all Funny River residents.
| Immigration Origin | # Population | % Population |
| Australia | 20 | 1.9% |
| Oceania | 20 | 1.9% | View All 2 Rows |
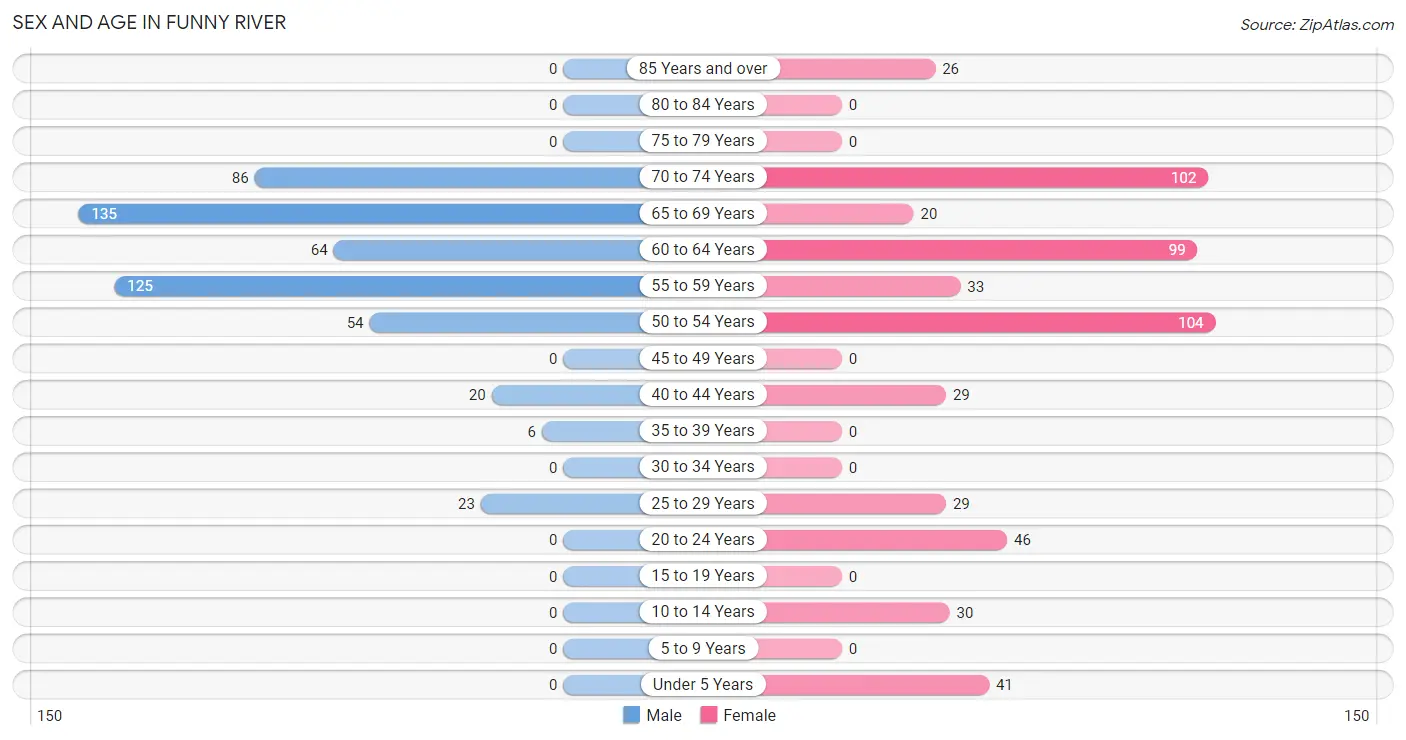
Sex and Age in Funny River
Sex and Age in Funny River
The most populous age groups in Funny River are 65 to 69 Years (135 | 26.3%) for men and 50 to 54 Years (104 | 18.6%) for women.
| Age Bracket | Male | Female |
| Under 5 Years | 0 (0.0%) | 41 (7.3%) |
| 5 to 9 Years | 0 (0.0%) | 0 (0.0%) |
| 10 to 14 Years | 0 (0.0%) | 30 (5.4%) |
| 15 to 19 Years | 0 (0.0%) | 0 (0.0%) |
| 20 to 24 Years | 0 (0.0%) | 46 (8.2%) |
| 25 to 29 Years | 23 (4.5%) | 29 (5.2%) |
| 30 to 34 Years | 0 (0.0%) | 0 (0.0%) |
| 35 to 39 Years | 6 (1.2%) | 0 (0.0%) |
| 40 to 44 Years | 20 (3.9%) | 29 (5.2%) |
| 45 to 49 Years | 0 (0.0%) | 0 (0.0%) |
| 50 to 54 Years | 54 (10.5%) | 104 (18.6%) |
| 55 to 59 Years | 125 (24.4%) | 33 (5.9%) |
| 60 to 64 Years | 64 (12.5%) | 99 (17.7%) |
| 65 to 69 Years | 135 (26.3%) | 20 (3.6%) |
| 70 to 74 Years | 86 (16.8%) | 102 (18.2%) |
| 75 to 79 Years | 0 (0.0%) | 0 (0.0%) |
| 80 to 84 Years | 0 (0.0%) | 0 (0.0%) |
| 85 Years and over | 0 (0.0%) | 26 (4.6%) |
| Total | 513 (100.0%) | 559 (100.0%) |
Families and Households in Funny River
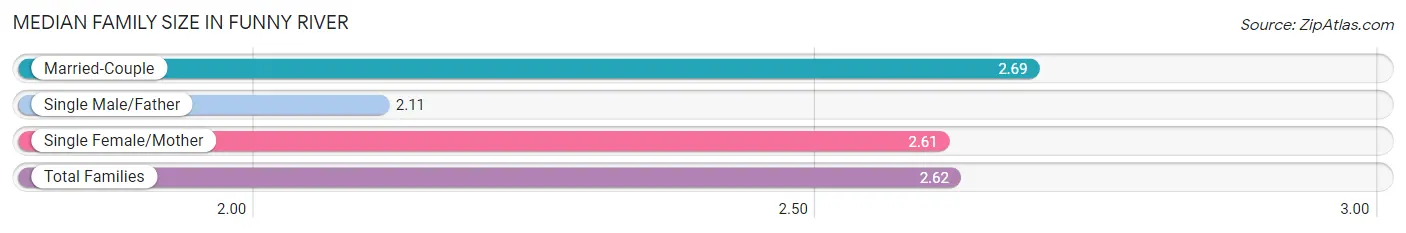
Median Family Size in Funny River
The median family size in Funny River is 2.62 persons per family, with married-couple families (208 | 82.2%) accounting for the largest median family size of 2.69 persons per family. On the other hand, single male/father families (27 | 10.7%) represent the smallest median family size with 2.11 persons per family.
| Family Type | # Families | Family Size |
| Married-Couple | 208 (82.2%) | 2.69 |
| Single Male/Father | 27 (10.7%) | 2.11 |
| Single Female/Mother | 18 (7.1%) | 2.61 |
| Total Families | 253 (100.0%) | 2.62 |
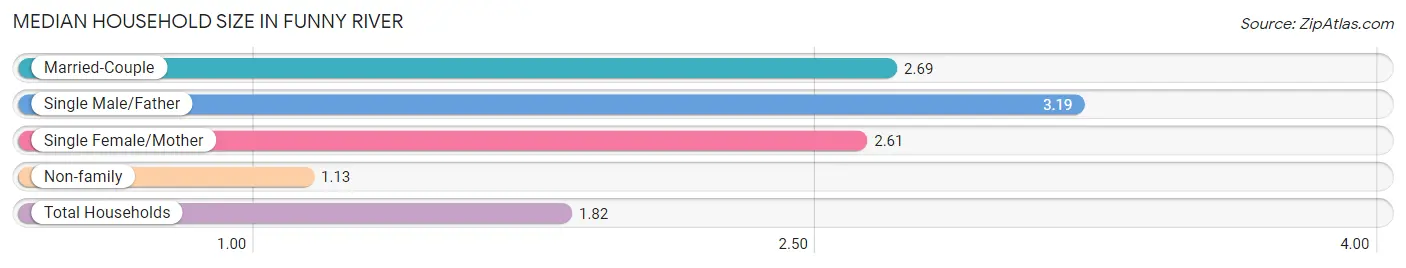
Median Household Size in Funny River
The median household size in Funny River is 1.82 persons per household, with single male/father households (27 | 4.6%) accounting for the largest median household size of 3.19 persons per household. non-family households (336 | 57.1%) represent the smallest median household size with 1.13 persons per household.
| Household Type | # Households | Household Size |
| Married-Couple | 208 (35.3%) | 2.69 |
| Single Male/Father | 27 (4.6%) | 3.19 |
| Single Female/Mother | 18 (3.1%) | 2.61 |
| Non-family | 336 (57.1%) | 1.13 |
| Total Households | 589 (100.0%) | 1.82 |
Household Size by Marriage Status in Funny River
Out of a total of 589 households in Funny River, 253 (42.9%) are family households, while 336 (57.1%) are nonfamily households. The most numerous type of family households are 2-person households, comprising 174, and the most common type of nonfamily households are 1-person households, comprising 289.
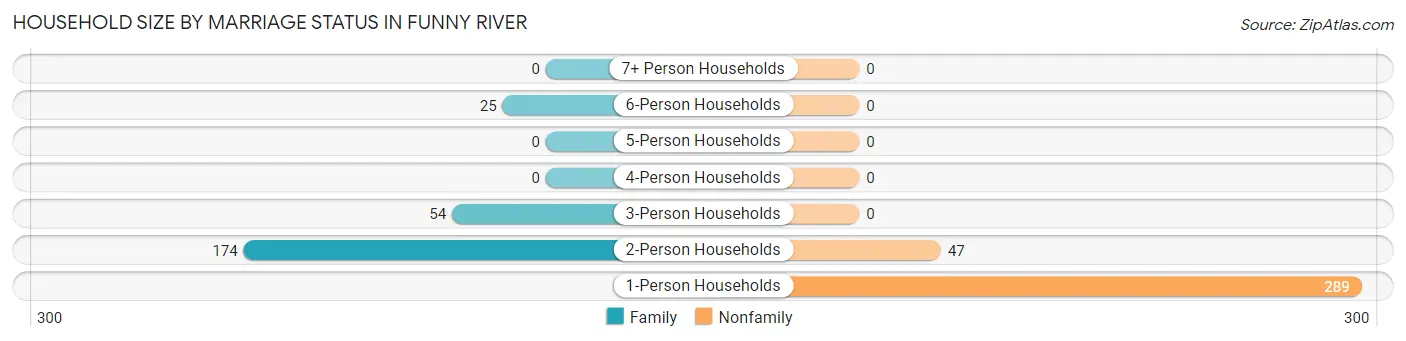
| Household Size | Family Households | Nonfamily Households |
| 1-Person Households | - | 289 (49.1%) |
| 2-Person Households | 174 (29.5%) | 47 (8.0%) |
| 3-Person Households | 54 (9.2%) | 0 (0.0%) |
| 4-Person Households | 0 (0.0%) | 0 (0.0%) |
| 5-Person Households | 0 (0.0%) | 0 (0.0%) |
| 6-Person Households | 25 (4.2%) | 0 (0.0%) |
| 7+ Person Households | 0 (0.0%) | 0 (0.0%) |
| Total | 253 (42.9%) | 336 (57.1%) |
Female Fertility in Funny River
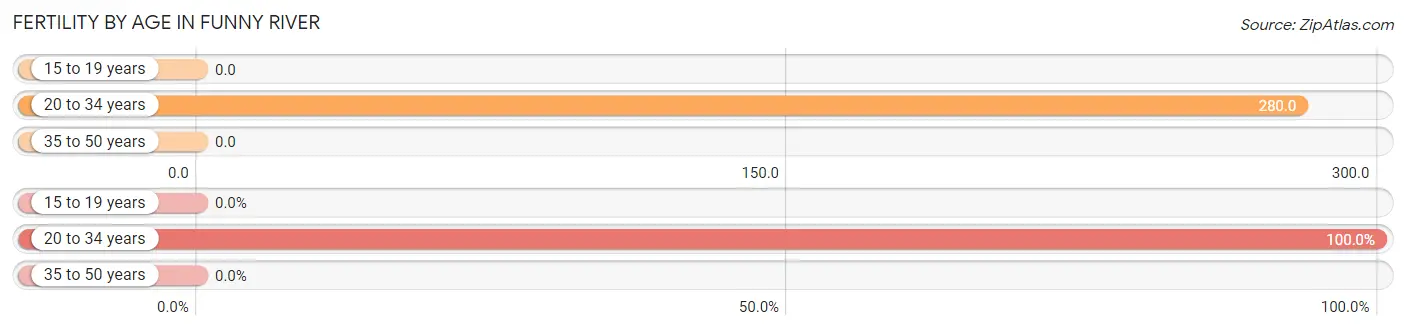
Fertility by Age in Funny River
Average fertility rate in Funny River is 163.0 births per 1,000 women. Women in the age bracket of 20 to 34 years have the highest fertility rate with 280.0 births per 1,000 women. Women in the age bracket of 20 to 34 years acount for 100.0% of all women with births.
| Age Bracket | Women with Births | Births / 1,000 Women |
| 15 to 19 years | 0 (0.0%) | 0.0 |
| 20 to 34 years | 21 (100.0%) | 280.0 |
| 35 to 50 years | 0 (0.0%) | 0.0 |
| Total | 21 (100.0%) | 163.0 |
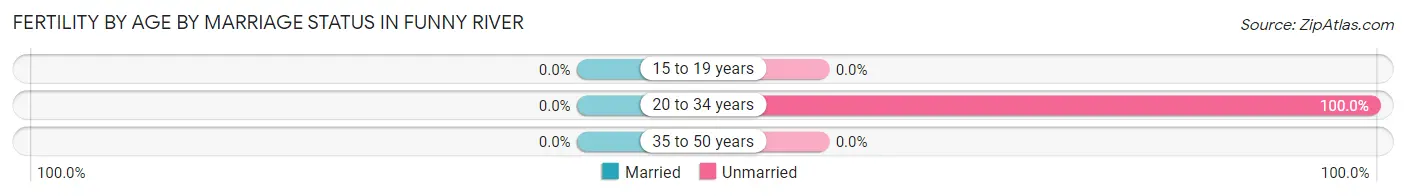
Fertility by Age by Marriage Status in Funny River
| Age Bracket | Married | Unmarried |
| 15 to 19 years | 0 (0.0%) | 0 (0.0%) |
| 20 to 34 years | 0 (0.0%) | 21 (100.0%) |
| 35 to 50 years | 0 (0.0%) | 0 (0.0%) |
| Total | 0 (0.0%) | 21 (100.0%) |
Fertility by Education in Funny River
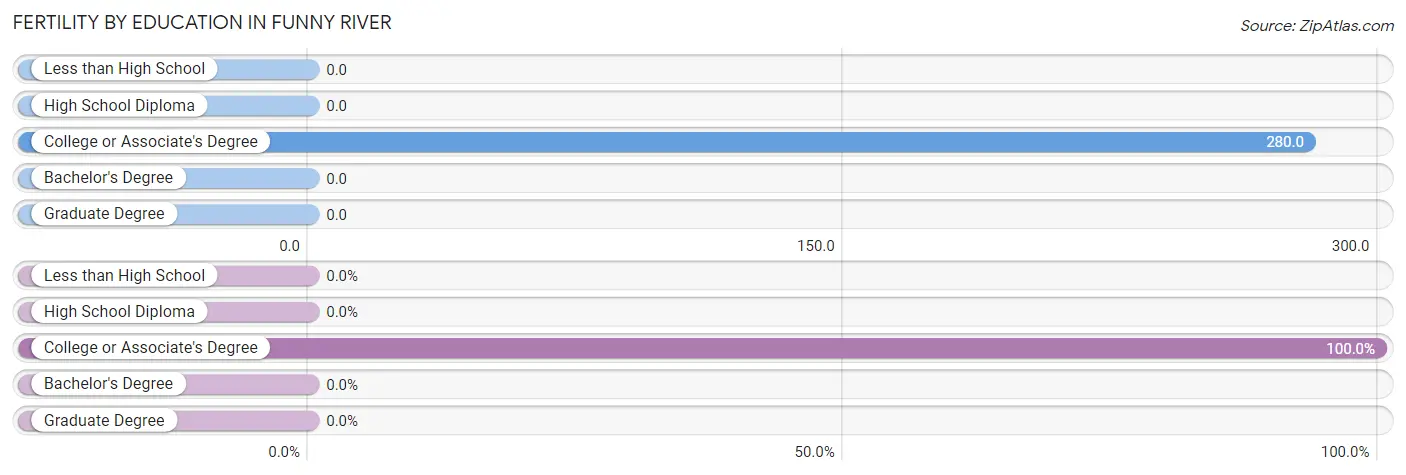
| Educational Attainment | Women with Births | Births / 1,000 Women |
| Less than High School | 0 (0.0%) | 0.0 |
| High School Diploma | 0 (0.0%) | 0.0 |
| College or Associate's Degree | 21 (100.0%) | 280.0 |
| Bachelor's Degree | 0 (0.0%) | 0.0 |
| Graduate Degree | 0 (0.0%) | 0.0 |
| Total | 21 (100.0%) | 163.0 |
Fertility by Education by Marriage Status in Funny River
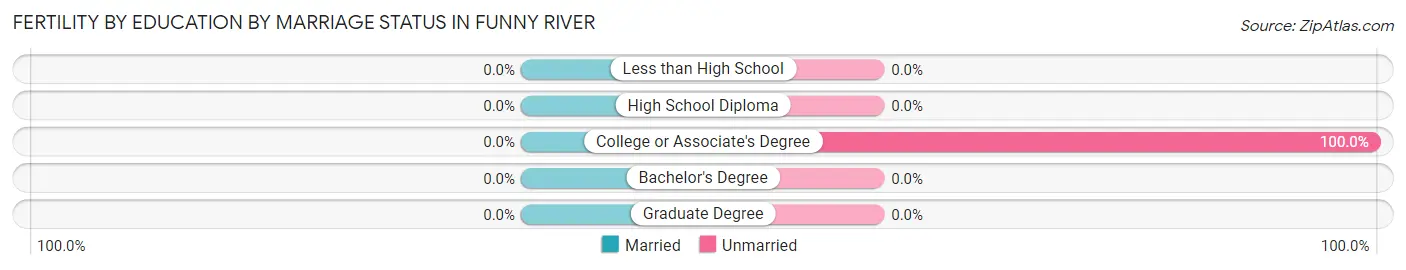
| Educational Attainment | Married | Unmarried |
| Less than High School | 0 (0.0%) | 0 (0.0%) |
| High School Diploma | 0 (0.0%) | 0 (0.0%) |
| College or Associate's Degree | 0 (0.0%) | 21 (100.0%) |
| Bachelor's Degree | 0 (0.0%) | 0 (0.0%) |
| Graduate Degree | 0 (0.0%) | 0 (0.0%) |
| Total | 0 (0.0%) | 21 (100.0%) |
Employment Characteristics in Funny River
Employment by Class of Employer in Funny River
Among the 408 employed individuals in Funny River, private company employees (173 | 42.4%), not-for-profit organizations (79 | 19.4%), and local government employees (55 | 13.5%) make up the most common classes of employment.
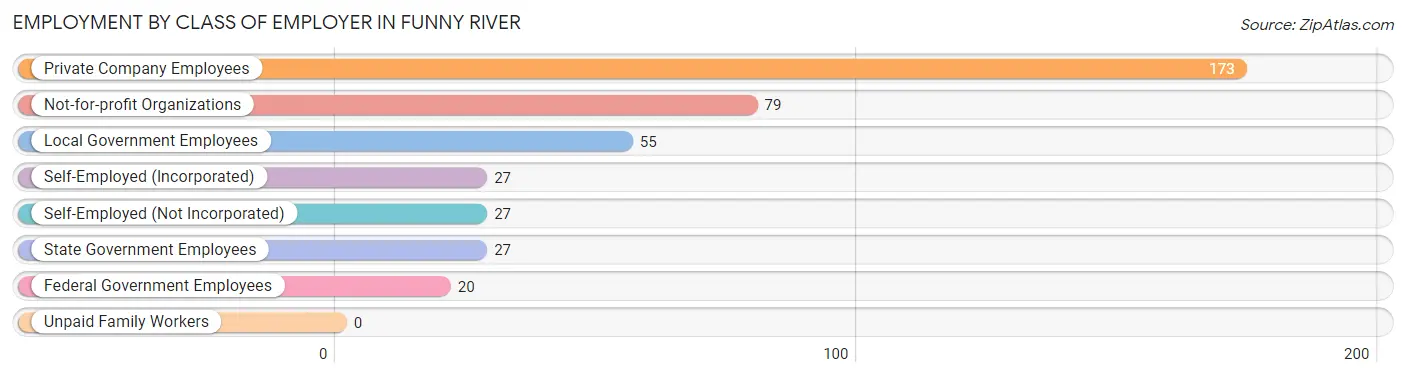
| Employer Class | # Employees | % Employees |
| Private Company Employees | 173 | 42.4% |
| Self-Employed (Incorporated) | 27 | 6.6% |
| Self-Employed (Not Incorporated) | 27 | 6.6% |
| Not-for-profit Organizations | 79 | 19.4% |
| Local Government Employees | 55 | 13.5% |
| State Government Employees | 27 | 6.6% |
| Federal Government Employees | 20 | 4.9% |
| Unpaid Family Workers | 0 | 0.0% |
| Total | 408 | 100.0% |
Employment Status by Age in Funny River
According to the labor force statistics for Funny River, out of the total population over 16 years of age (1,001), 45.4% or 454 individuals are in the labor force, with 5.1% or 23 of them unemployed. The age group with the highest labor force participation rate is 45 to 54 years, with 74.1% or 117 individuals in the labor force. Within the labor force, the 25 to 29 years age range has the highest percentage of unemployed individuals, with 100.0% or 23 of them being unemployed.
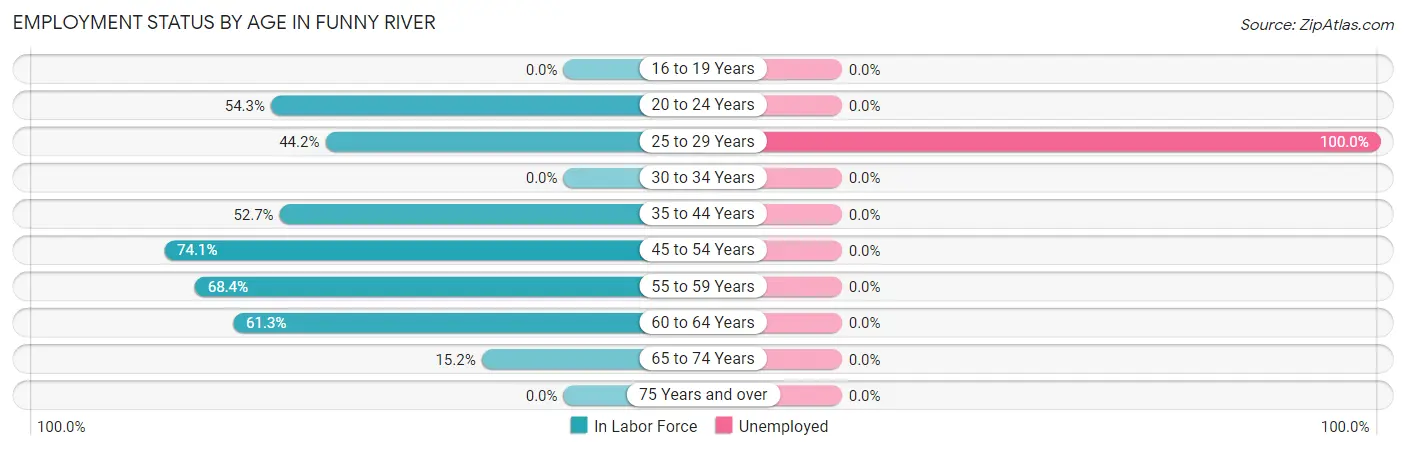
| Age Bracket | In Labor Force | Unemployed |
| 16 to 19 Years | 0 (0.0%) | 0 (0.0%) |
| 20 to 24 Years | 25 (54.3%) | 0 (0.0%) |
| 25 to 29 Years | 23 (44.2%) | 23 (100.0%) |
| 30 to 34 Years | 0 (0.0%) | 0 (0.0%) |
| 35 to 44 Years | 29 (52.7%) | 0 (0.0%) |
| 45 to 54 Years | 117 (74.1%) | 0 (0.0%) |
| 55 to 59 Years | 108 (68.4%) | 0 (0.0%) |
| 60 to 64 Years | 100 (61.3%) | 0 (0.0%) |
| 65 to 74 Years | 52 (15.2%) | 0 (0.0%) |
| 75 Years and over | 0 (0.0%) | 0 (0.0%) |
| Total | 454 (45.4%) | 23 (5.1%) |
Employment Status by Educational Attainment in Funny River
According to labor force statistics for Funny River, 64.3% of individuals (377) out of the total population between 25 and 64 years of age (586) are in the labor force, with 6.1% or 23 of them being unemployed. The group with the highest labor force participation rate are those with the educational attainment of bachelor's degree or higher, with 82.4% or 103 individuals in the labor force. Within the labor force, individuals with less than high school education have the highest percentage of unemployment, with 32.4% or 23 of them being unemployed.
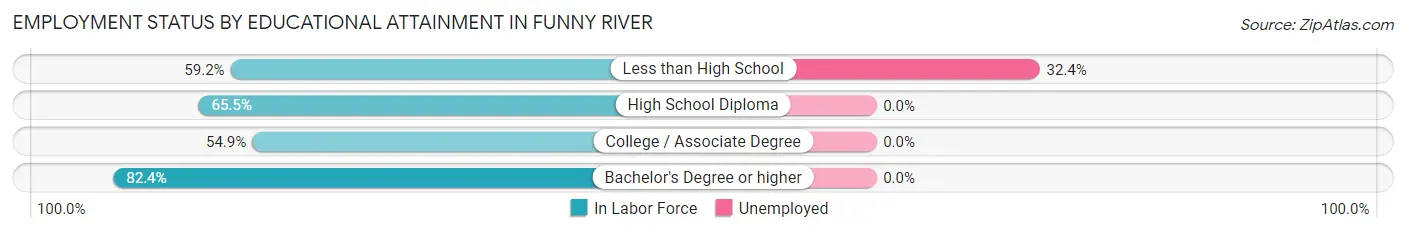
| Educational Attainment | In Labor Force | Unemployed |
| Less than High School | 71 (59.2%) | 39 (32.4%) |
| High School Diploma | 97 (65.5%) | 0 (0.0%) |
| College / Associate Degree | 106 (54.9%) | 0 (0.0%) |
| Bachelor's Degree or higher | 103 (82.4%) | 0 (0.0%) |
| Total | 377 (64.3%) | 36 (6.1%) |
Employment Occupations by Sex in Funny River
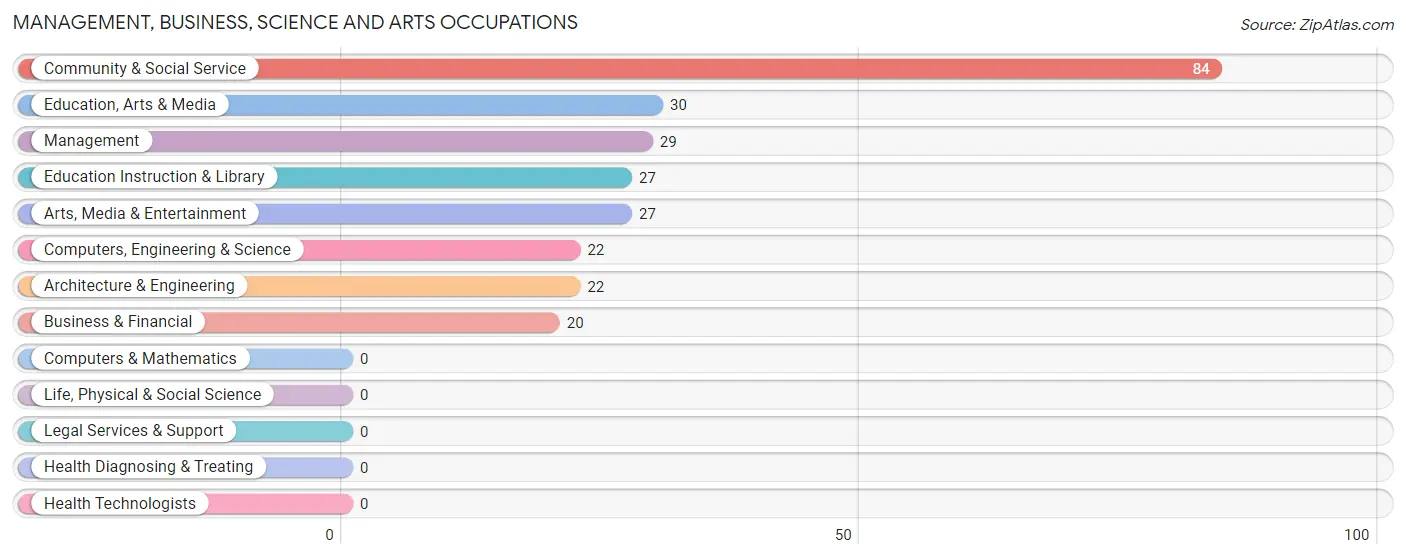
Management, Business, Science and Arts Occupations
The most common Management, Business, Science and Arts occupations in Funny River are Community & Social Service (84 | 19.5%), Education, Arts & Media (30 | 7.0%), Management (29 | 6.7%), Education Instruction & Library (27 | 6.3%), and Arts, Media & Entertainment (27 | 6.3%).
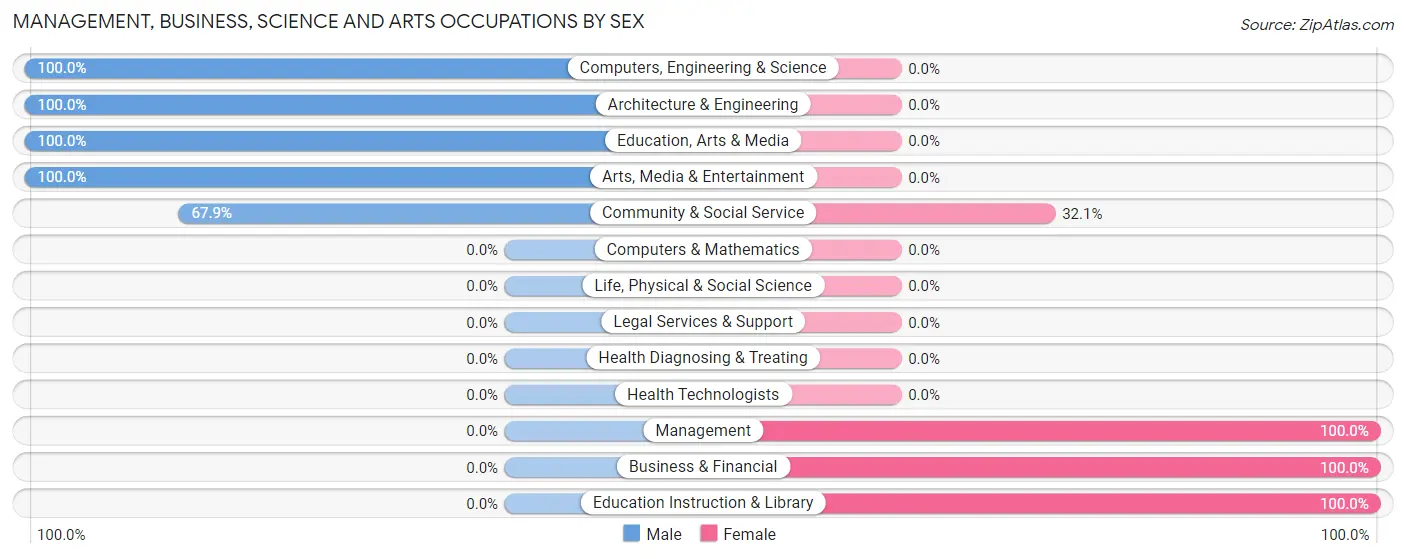
Management, Business, Science and Arts Occupations by Sex
Within the Management, Business, Science and Arts occupations in Funny River, the most male-oriented occupations are Computers, Engineering & Science (100.0%), Architecture & Engineering (100.0%), and Education, Arts & Media (100.0%), while the most female-oriented occupations are Management (100.0%), Business & Financial (100.0%), and Education Instruction & Library (100.0%).
| Occupation | Male | Female |
| Management | 0 (0.0%) | 29 (100.0%) |
| Business & Financial | 0 (0.0%) | 20 (100.0%) |
| Computers, Engineering & Science | 22 (100.0%) | 0 (0.0%) |
| Computers & Mathematics | 0 (0.0%) | 0 (0.0%) |
| Architecture & Engineering | 22 (100.0%) | 0 (0.0%) |
| Life, Physical & Social Science | 0 (0.0%) | 0 (0.0%) |
| Community & Social Service | 57 (67.9%) | 27 (32.1%) |
| Education, Arts & Media | 30 (100.0%) | 0 (0.0%) |
| Legal Services & Support | 0 (0.0%) | 0 (0.0%) |
| Education Instruction & Library | 0 (0.0%) | 27 (100.0%) |
| Arts, Media & Entertainment | 27 (100.0%) | 0 (0.0%) |
| Health Diagnosing & Treating | 0 (0.0%) | 0 (0.0%) |
| Health Technologists | 0 (0.0%) | 0 (0.0%) |
| Total (Category) | 79 (51.0%) | 76 (49.0%) |
| Total (Overall) | 221 (51.3%) | 210 (48.7%) |
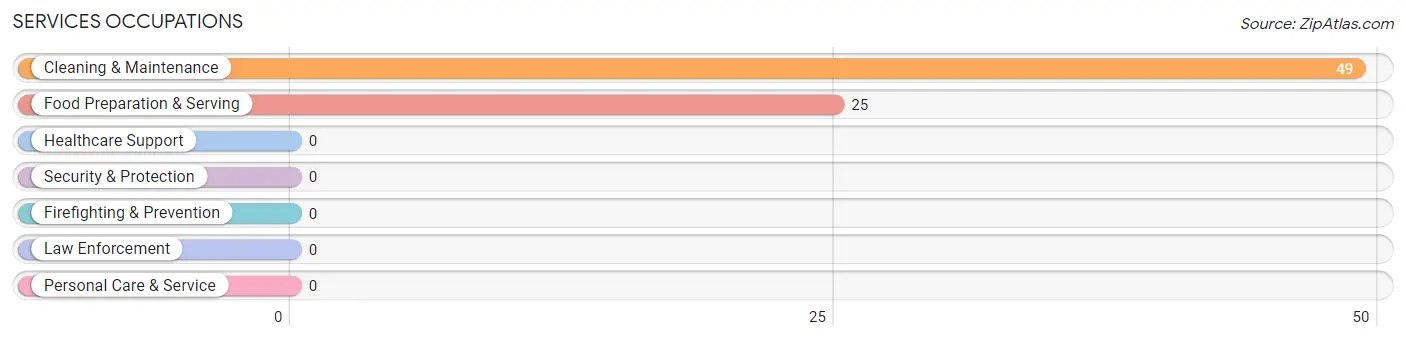
Services Occupations
The most common Services occupations in Funny River are Cleaning & Maintenance (49 | 11.4%), and Food Preparation & Serving (25 | 5.8%).
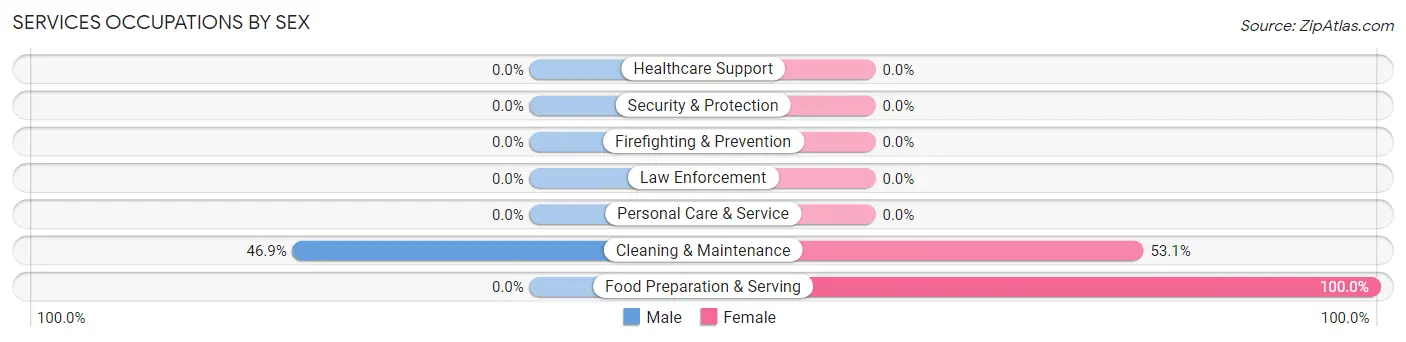
Services Occupations by Sex
| Occupation | Male | Female |
| Healthcare Support | 0 (0.0%) | 0 (0.0%) |
| Security & Protection | 0 (0.0%) | 0 (0.0%) |
| Firefighting & Prevention | 0 (0.0%) | 0 (0.0%) |
| Law Enforcement | 0 (0.0%) | 0 (0.0%) |
| Food Preparation & Serving | 0 (0.0%) | 25 (100.0%) |
| Cleaning & Maintenance | 23 (46.9%) | 26 (53.1%) |
| Personal Care & Service | 0 (0.0%) | 0 (0.0%) |
| Total (Category) | 23 (31.1%) | 51 (68.9%) |
| Total (Overall) | 221 (51.3%) | 210 (48.7%) |
Sales and Office Occupations
The most common Sales and Office occupations in Funny River are Sales & Related (80 | 18.6%), and Office & Administration (20 | 4.6%).
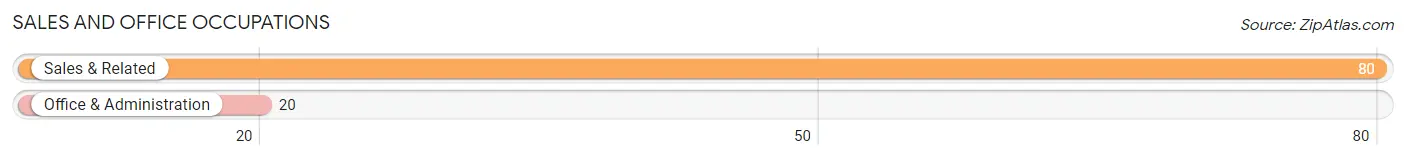
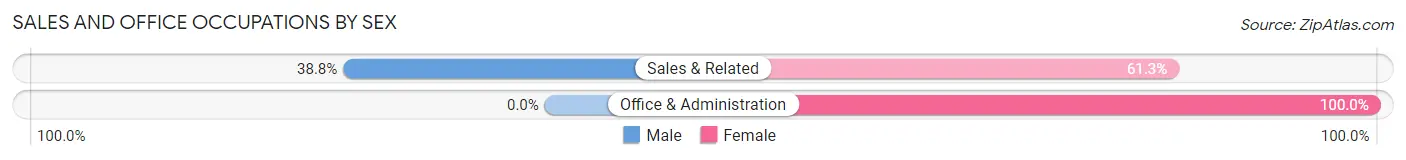
Sales and Office Occupations by Sex
| Occupation | Male | Female |
| Sales & Related | 31 (38.8%) | 49 (61.3%) |
| Office & Administration | 0 (0.0%) | 20 (100.0%) |
| Total (Category) | 31 (31.0%) | 69 (69.0%) |
| Total (Overall) | 221 (51.3%) | 210 (48.7%) |
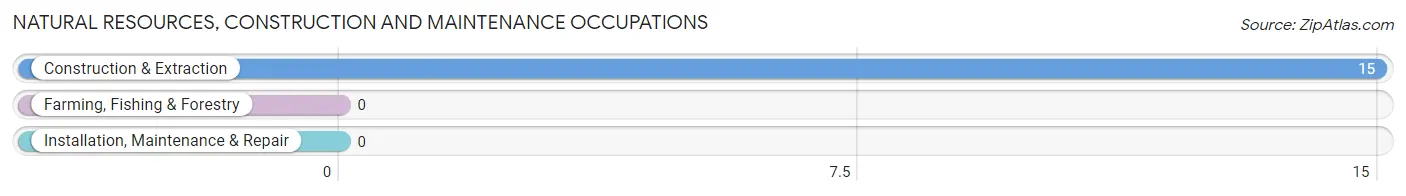
Natural Resources, Construction and Maintenance Occupations
The most common Natural Resources, Construction and Maintenance occupations in Funny River are , and Construction & Extraction (15 | 3.5%).
Natural Resources, Construction and Maintenance Occupations by Sex
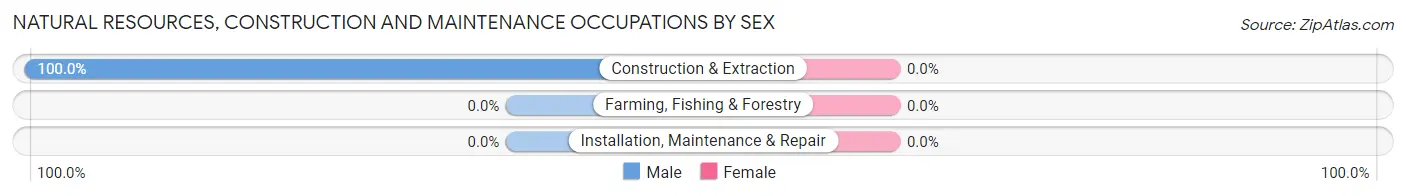
| Occupation | Male | Female |
| Farming, Fishing & Forestry | 0 (0.0%) | 0 (0.0%) |
| Construction & Extraction | 15 (100.0%) | 0 (0.0%) |
| Installation, Maintenance & Repair | 0 (0.0%) | 0 (0.0%) |
| Total (Category) | 15 (100.0%) | 0 (0.0%) |
| Total (Overall) | 221 (51.3%) | 210 (48.7%) |
Production, Transportation and Moving Occupations
The most common Production, Transportation and Moving occupations in Funny River are Material Moving (60 | 13.9%), and Production (27 | 6.3%).
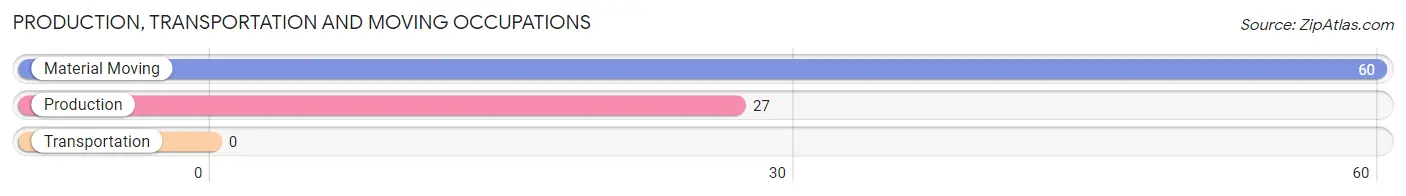
Production, Transportation and Moving Occupations by Sex
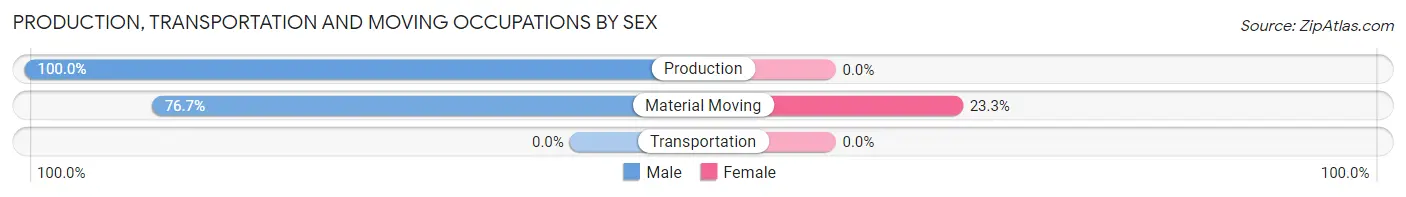
| Occupation | Male | Female |
| Production | 27 (100.0%) | 0 (0.0%) |
| Transportation | 0 (0.0%) | 0 (0.0%) |
| Material Moving | 46 (76.7%) | 14 (23.3%) |
| Total (Category) | 73 (83.9%) | 14 (16.1%) |
| Total (Overall) | 221 (51.3%) | 210 (48.7%) |
Employment Industries by Sex in Funny River
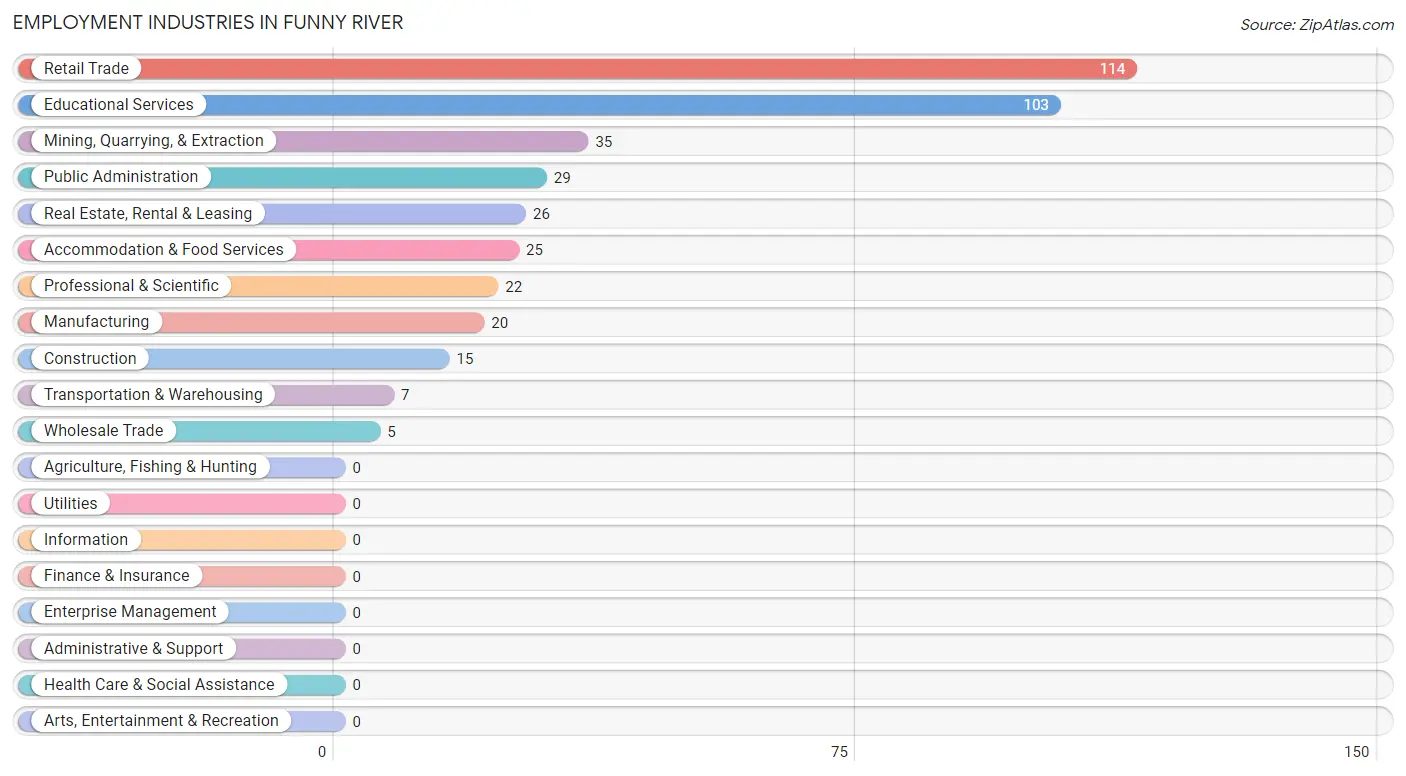
Employment Industries in Funny River
The major employment industries in Funny River include Retail Trade (114 | 26.5%), Educational Services (103 | 23.9%), Mining, Quarrying, & Extraction (35 | 8.1%), Public Administration (29 | 6.7%), and Real Estate, Rental & Leasing (26 | 6.0%).
Employment Industries by Sex in Funny River
The Funny River industries that see more men than women are Construction (100.0%), Wholesale Trade (100.0%), and Real Estate, Rental & Leasing (100.0%), whereas the industries that tend to have a higher number of women are Manufacturing (100.0%), Transportation & Warehousing (100.0%), and Accommodation & Food Services (100.0%).

| Industry | Male | Female |
| Agriculture, Fishing & Hunting | 0 (0.0%) | 0 (0.0%) |
| Mining, Quarrying, & Extraction | 21 (60.0%) | 14 (40.0%) |
| Construction | 15 (100.0%) | 0 (0.0%) |
| Manufacturing | 0 (0.0%) | 20 (100.0%) |
| Wholesale Trade | 5 (100.0%) | 0 (0.0%) |
| Retail Trade | 52 (45.6%) | 62 (54.4%) |
| Transportation & Warehousing | 0 (0.0%) | 7 (100.0%) |
| Utilities | 0 (0.0%) | 0 (0.0%) |
| Information | 0 (0.0%) | 0 (0.0%) |
| Finance & Insurance | 0 (0.0%) | 0 (0.0%) |
| Real Estate, Rental & Leasing | 26 (100.0%) | 0 (0.0%) |
| Professional & Scientific | 22 (100.0%) | 0 (0.0%) |
| Enterprise Management | 0 (0.0%) | 0 (0.0%) |
| Administrative & Support | 0 (0.0%) | 0 (0.0%) |
| Educational Services | 50 (48.5%) | 53 (51.5%) |
| Health Care & Social Assistance | 0 (0.0%) | 0 (0.0%) |
| Arts, Entertainment & Recreation | 0 (0.0%) | 0 (0.0%) |
| Accommodation & Food Services | 0 (0.0%) | 25 (100.0%) |
| Public Administration | 0 (0.0%) | 29 (100.0%) |
| Total | 221 (51.3%) | 210 (48.7%) |
Education in Funny River
School Enrollment in Funny River
The most common levels of schooling among the 51 students in Funny River are middle school (30 | 58.8%), and college / undergraduate (21 | 41.2%).
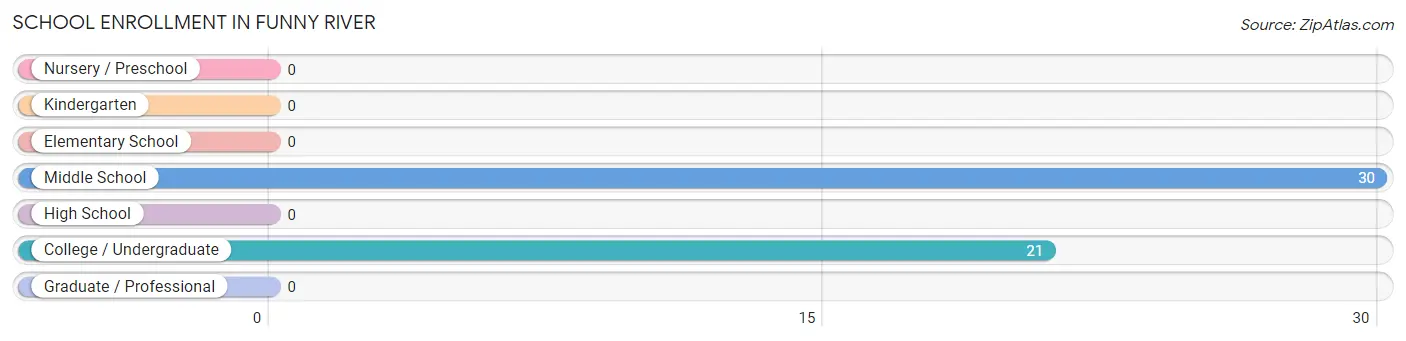
| School Level | # Students | % Students |
| Nursery / Preschool | 0 | 0.0% |
| Kindergarten | 0 | 0.0% |
| Elementary School | 0 | 0.0% |
| Middle School | 30 | 58.8% |
| High School | 0 | 0.0% |
| College / Undergraduate | 21 | 41.2% |
| Graduate / Professional | 0 | 0.0% |
| Total | 51 | 100.0% |
School Enrollment by Age by Funding Source in Funny River
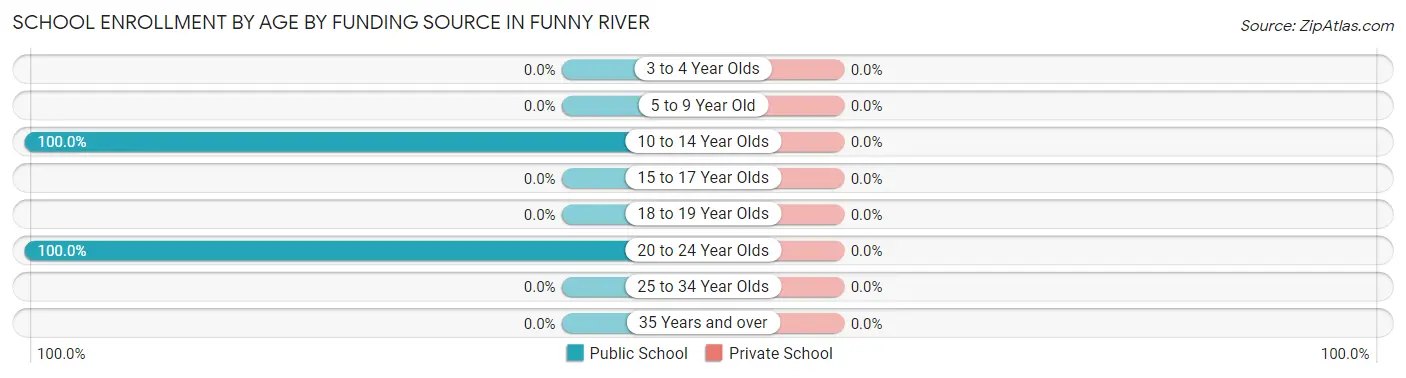
| Age Bracket | Public School | Private School |
| 3 to 4 Year Olds | 0 (0.0%) | 0 (0.0%) |
| 5 to 9 Year Old | 0 (0.0%) | 0 (0.0%) |
| 10 to 14 Year Olds | 30 (100.0%) | 0 (0.0%) |
| 15 to 17 Year Olds | 0 (0.0%) | 0 (0.0%) |
| 18 to 19 Year Olds | 0 (0.0%) | 0 (0.0%) |
| 20 to 24 Year Olds | 21 (100.0%) | 0 (0.0%) |
| 25 to 34 Year Olds | 0 (0.0%) | 0 (0.0%) |
| 35 Years and over | 0 (0.0%) | 0 (0.0%) |
| Total | 51 (100.0%) | 0 (0.0%) |
Educational Attainment by Field of Study in Funny River
Business (85 | 27.4%), engineering (52 | 16.8%), social sciences (27 | 8.7%), liberal arts & history (27 | 8.7%), and arts & humanities (25 | 8.1%) are the most common fields of study among 310 individuals in Funny River who have obtained a bachelor's degree or higher.
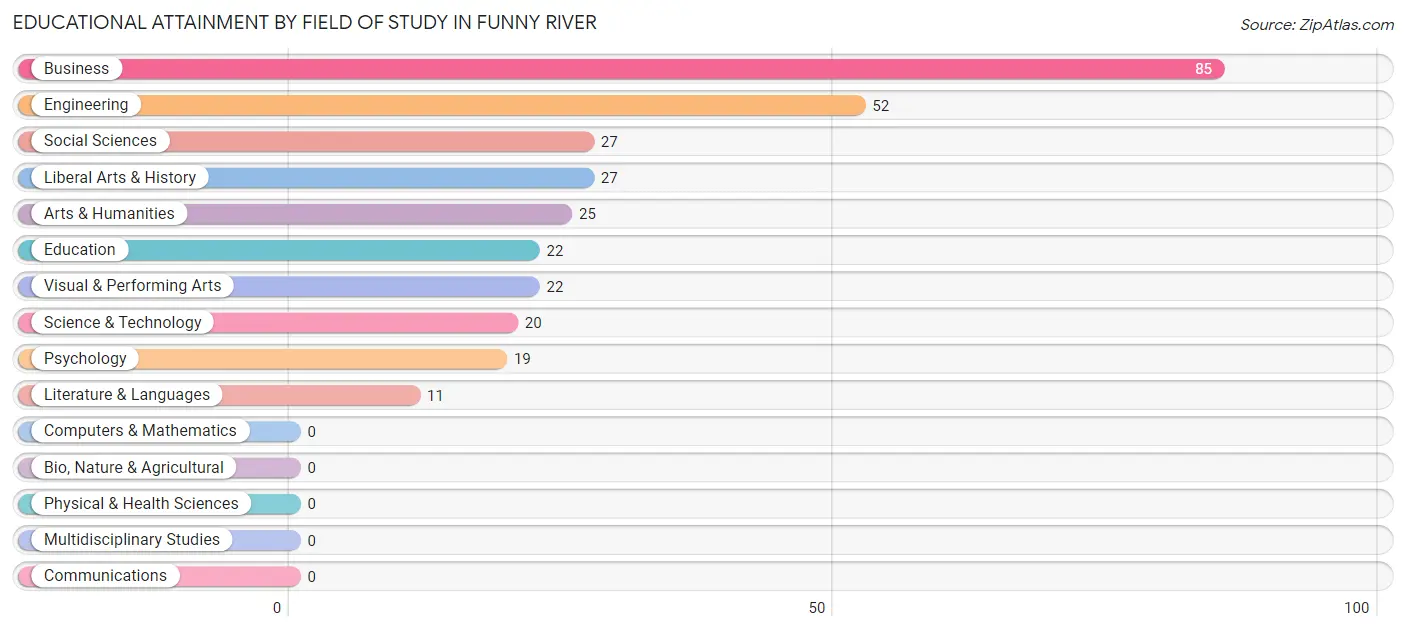
| Field of Study | # Graduates | % Graduates |
| Computers & Mathematics | 0 | 0.0% |
| Bio, Nature & Agricultural | 0 | 0.0% |
| Physical & Health Sciences | 0 | 0.0% |
| Psychology | 19 | 6.1% |
| Social Sciences | 27 | 8.7% |
| Engineering | 52 | 16.8% |
| Multidisciplinary Studies | 0 | 0.0% |
| Science & Technology | 20 | 6.5% |
| Business | 85 | 27.4% |
| Education | 22 | 7.1% |
| Literature & Languages | 11 | 3.5% |
| Liberal Arts & History | 27 | 8.7% |
| Visual & Performing Arts | 22 | 7.1% |
| Communications | 0 | 0.0% |
| Arts & Humanities | 25 | 8.1% |
| Total | 310 | 100.0% |
Transportation & Commute in Funny River
Vehicle Availability by Sex in Funny River
The most prevalent vehicle ownership categories in Funny River are males with 2 vehicles (95, accounting for 48.0%) and females with 2 vehicles (34, making up 45.2%).
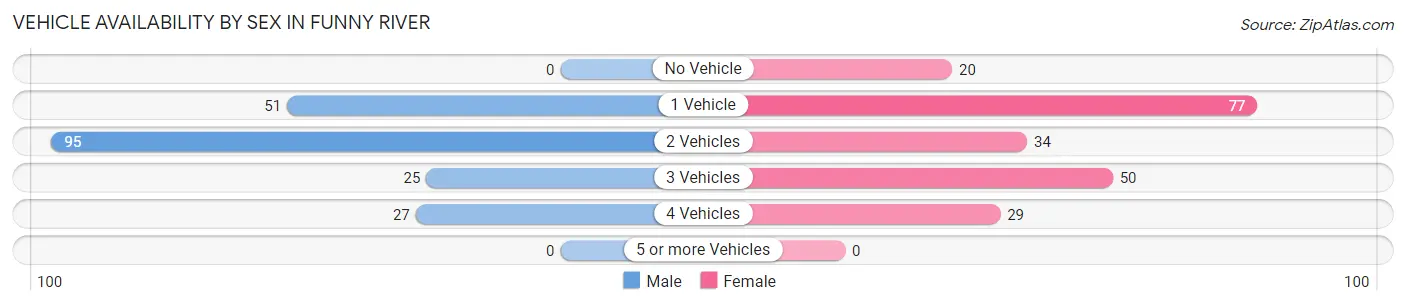
| Vehicles Available | Male | Female |
| No Vehicle | 0 (0.0%) | 20 (9.5%) |
| 1 Vehicle | 51 (25.8%) | 77 (36.7%) |
| 2 Vehicles | 95 (48.0%) | 34 (16.2%) |
| 3 Vehicles | 25 (12.6%) | 50 (23.8%) |
| 4 Vehicles | 27 (13.6%) | 29 (13.8%) |
| 5 or more Vehicles | 0 (0.0%) | 0 (0.0%) |
| Total | 198 (100.0%) | 210 (100.0%) |
Commute Time in Funny River
The most frequently occuring commute durations in Funny River are 45 to 59 minutes (76 commuters, 21.5%), 15 to 19 minutes (62 commuters, 17.5%), and 30 to 34 minutes (58 commuters, 16.4%).
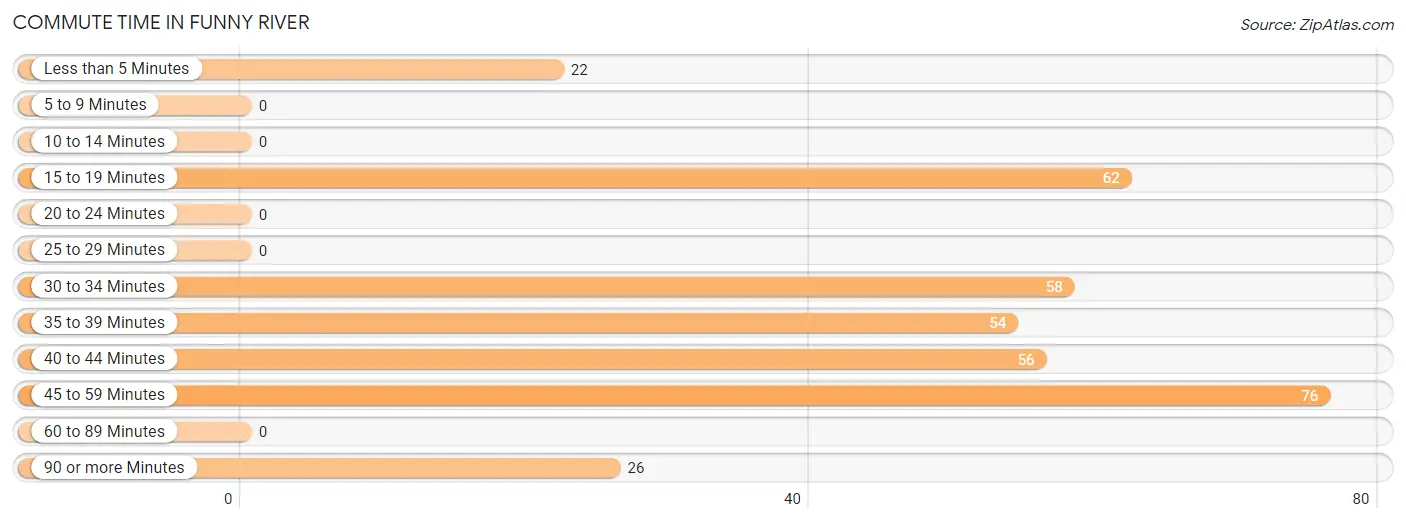
| Commute Time | # Commuters | % Commuters |
| Less than 5 Minutes | 22 | 6.2% |
| 5 to 9 Minutes | 0 | 0.0% |
| 10 to 14 Minutes | 0 | 0.0% |
| 15 to 19 Minutes | 62 | 17.5% |
| 20 to 24 Minutes | 0 | 0.0% |
| 25 to 29 Minutes | 0 | 0.0% |
| 30 to 34 Minutes | 58 | 16.4% |
| 35 to 39 Minutes | 54 | 15.2% |
| 40 to 44 Minutes | 56 | 15.8% |
| 45 to 59 Minutes | 76 | 21.5% |
| 60 to 89 Minutes | 0 | 0.0% |
| 90 or more Minutes | 26 | 7.3% |
Commute Time by Sex in Funny River
The most common commute times in Funny River are 30 to 34 minutes (51 commuters, 29.8%) for males and 45 to 59 minutes (76 commuters, 41.5%) for females.
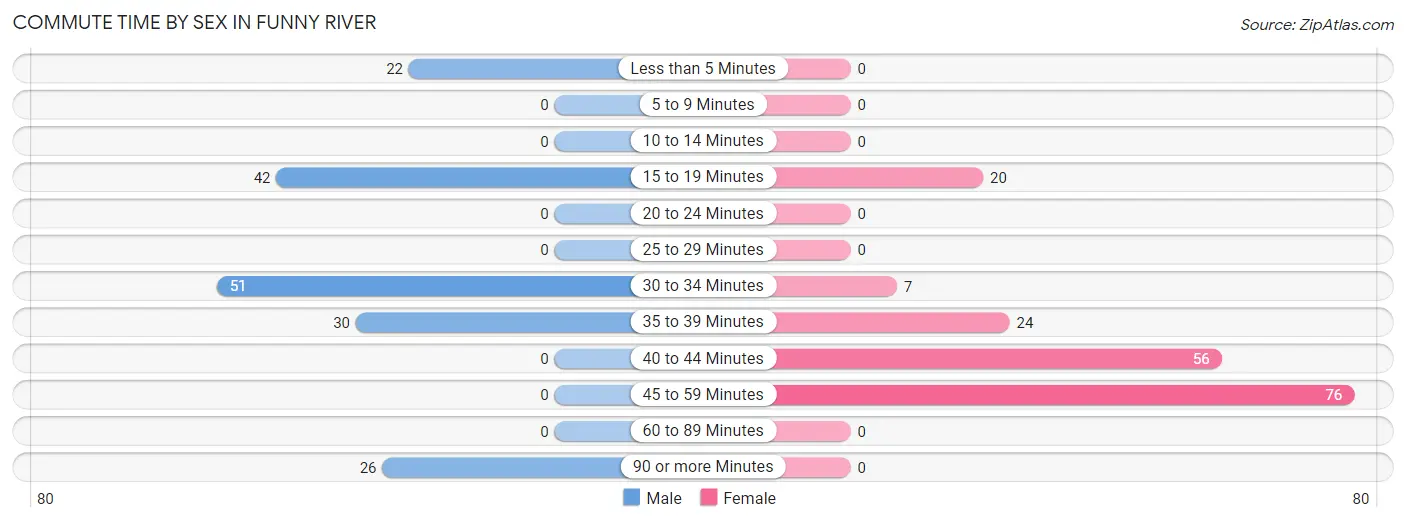
| Commute Time | Male | Female |
| Less than 5 Minutes | 22 (12.9%) | 0 (0.0%) |
| 5 to 9 Minutes | 0 (0.0%) | 0 (0.0%) |
| 10 to 14 Minutes | 0 (0.0%) | 0 (0.0%) |
| 15 to 19 Minutes | 42 (24.6%) | 20 (10.9%) |
| 20 to 24 Minutes | 0 (0.0%) | 0 (0.0%) |
| 25 to 29 Minutes | 0 (0.0%) | 0 (0.0%) |
| 30 to 34 Minutes | 51 (29.8%) | 7 (3.8%) |
| 35 to 39 Minutes | 30 (17.5%) | 24 (13.1%) |
| 40 to 44 Minutes | 0 (0.0%) | 56 (30.6%) |
| 45 to 59 Minutes | 0 (0.0%) | 76 (41.5%) |
| 60 to 89 Minutes | 0 (0.0%) | 0 (0.0%) |
| 90 or more Minutes | 26 (15.2%) | 0 (0.0%) |
Time of Departure to Work by Sex in Funny River
The most frequent times of departure to work in Funny River are 7:30 AM to 7:59 AM (51, 29.8%) for males and 4:00 PM to 11:59 PM (51, 27.9%) for females.
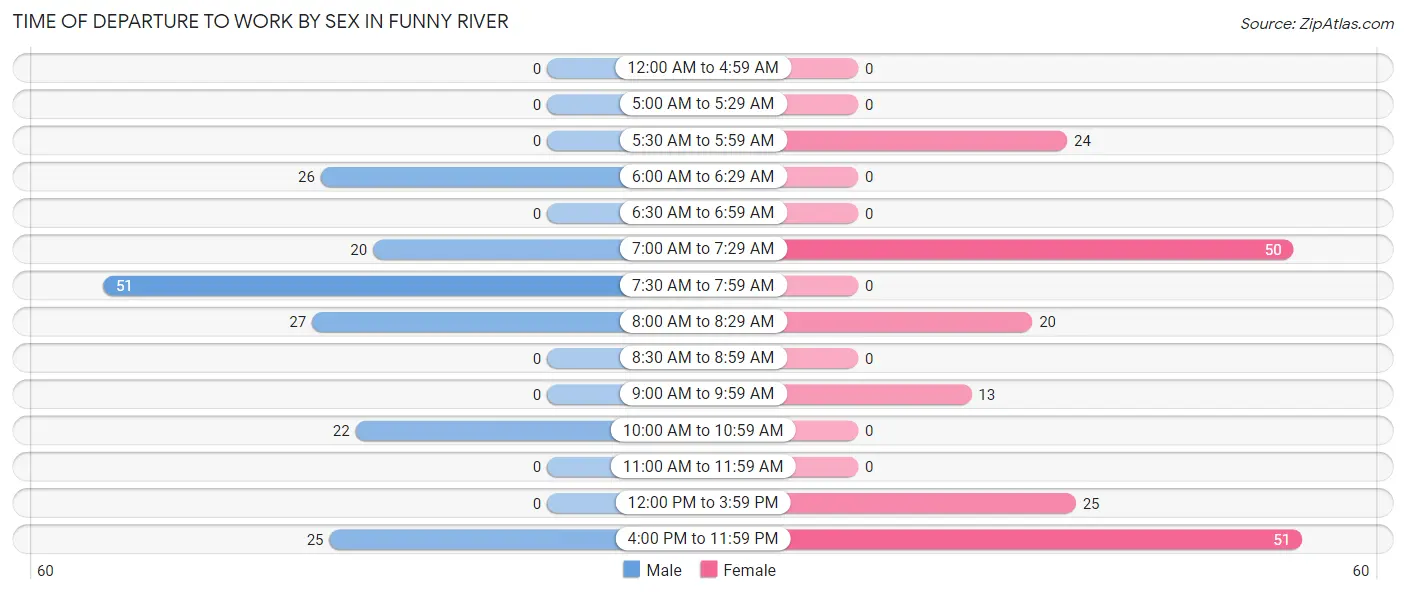
| Time of Departure | Male | Female |
| 12:00 AM to 4:59 AM | 0 (0.0%) | 0 (0.0%) |
| 5:00 AM to 5:29 AM | 0 (0.0%) | 0 (0.0%) |
| 5:30 AM to 5:59 AM | 0 (0.0%) | 24 (13.1%) |
| 6:00 AM to 6:29 AM | 26 (15.2%) | 0 (0.0%) |
| 6:30 AM to 6:59 AM | 0 (0.0%) | 0 (0.0%) |
| 7:00 AM to 7:29 AM | 20 (11.7%) | 50 (27.3%) |
| 7:30 AM to 7:59 AM | 51 (29.8%) | 0 (0.0%) |
| 8:00 AM to 8:29 AM | 27 (15.8%) | 20 (10.9%) |
| 8:30 AM to 8:59 AM | 0 (0.0%) | 0 (0.0%) |
| 9:00 AM to 9:59 AM | 0 (0.0%) | 13 (7.1%) |
| 10:00 AM to 10:59 AM | 22 (12.9%) | 0 (0.0%) |
| 11:00 AM to 11:59 AM | 0 (0.0%) | 0 (0.0%) |
| 12:00 PM to 3:59 PM | 0 (0.0%) | 25 (13.7%) |
| 4:00 PM to 11:59 PM | 25 (14.6%) | 51 (27.9%) |
| Total | 171 (100.0%) | 183 (100.0%) |
Housing Occupancy in Funny River
Occupancy by Ownership in Funny River
Of the total 589 dwellings in Funny River, owner-occupied units account for 481 (81.7%), while renter-occupied units make up 108 (18.3%).
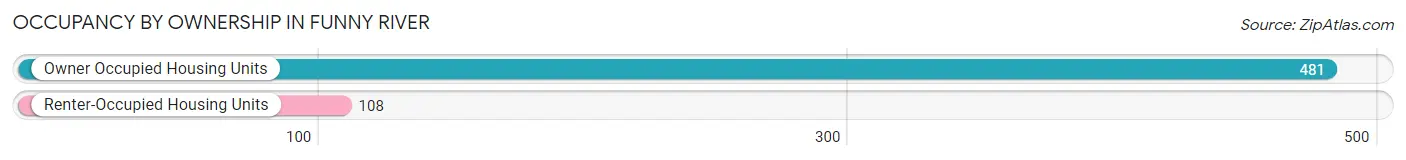
| Occupancy | # Housing Units | % Housing Units |
| Owner Occupied Housing Units | 481 | 81.7% |
| Renter-Occupied Housing Units | 108 | 18.3% |
| Total Occupied Housing Units | 589 | 100.0% |
Occupancy by Household Size in Funny River
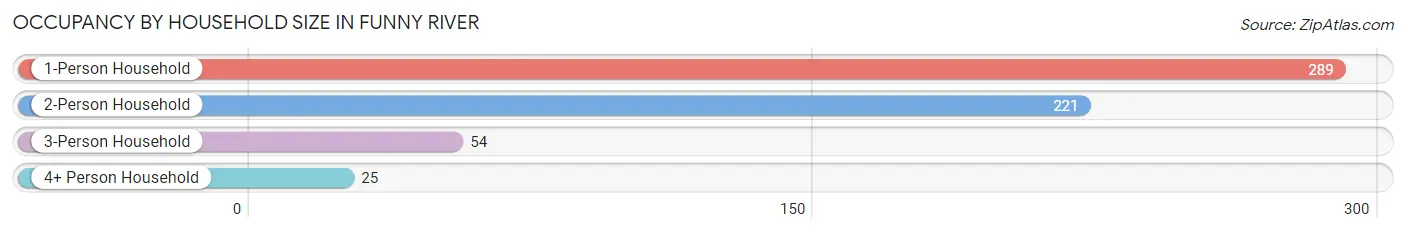
| Household Size | # Housing Units | % Housing Units |
| 1-Person Household | 289 | 49.1% |
| 2-Person Household | 221 | 37.5% |
| 3-Person Household | 54 | 9.2% |
| 4+ Person Household | 25 | 4.2% |
| Total Housing Units | 589 | 100.0% |
Occupancy by Ownership by Household Size in Funny River
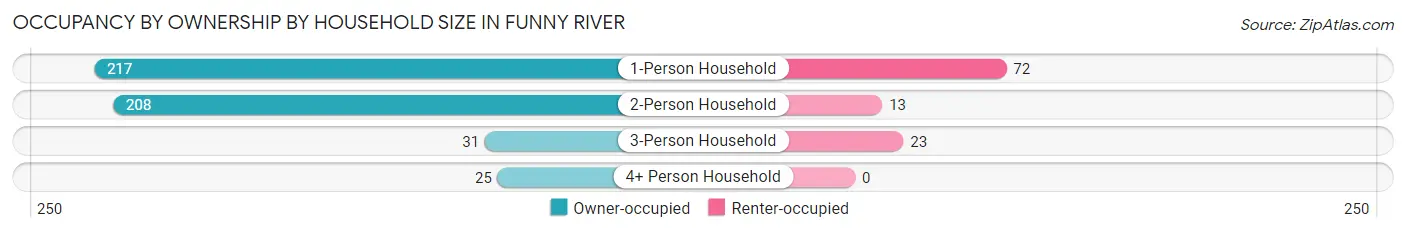
| Household Size | Owner-occupied | Renter-occupied |
| 1-Person Household | 217 (75.1%) | 72 (24.9%) |
| 2-Person Household | 208 (94.1%) | 13 (5.9%) |
| 3-Person Household | 31 (57.4%) | 23 (42.6%) |
| 4+ Person Household | 25 (100.0%) | 0 (0.0%) |
| Total Housing Units | 481 (81.7%) | 108 (18.3%) |
Occupancy by Educational Attainment in Funny River
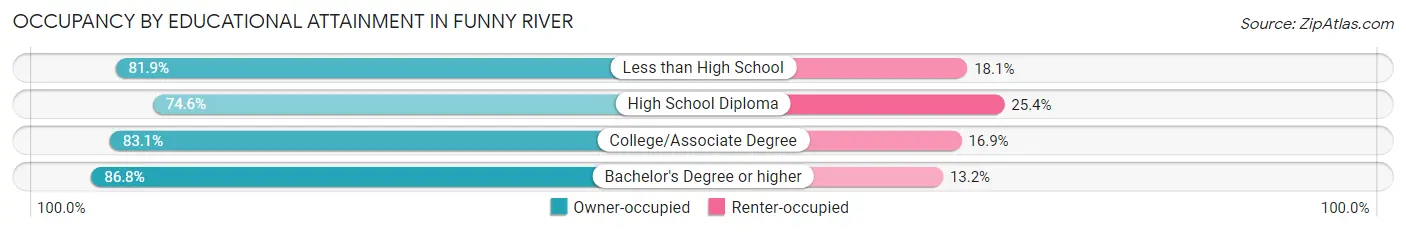
| Household Size | Owner-occupied | Renter-occupied |
| Less than High School | 59 (81.9%) | 13 (18.1%) |
| High School Diploma | 132 (74.6%) | 45 (25.4%) |
| College/Associate Degree | 113 (83.1%) | 23 (16.9%) |
| Bachelor's Degree or higher | 177 (86.8%) | 27 (13.2%) |
Occupancy by Age of Householder in Funny River
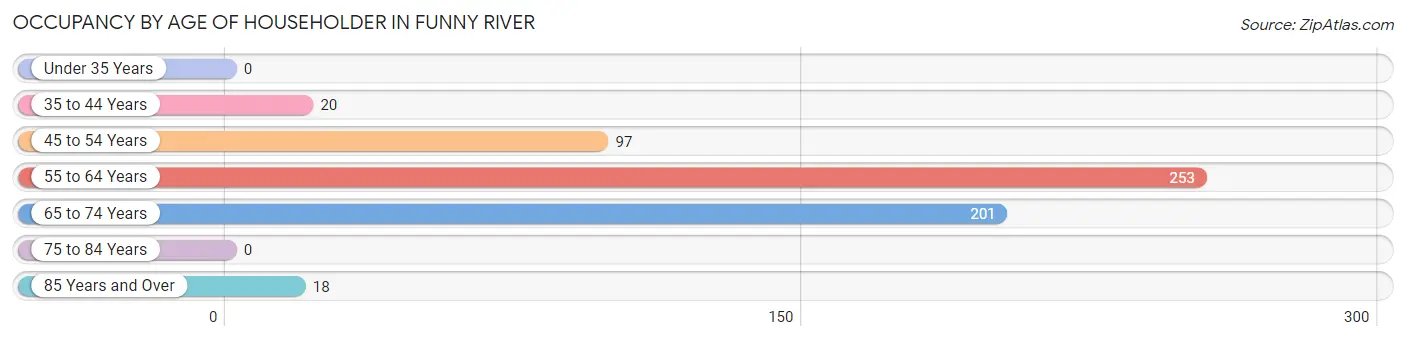
| Age Bracket | # Households | % Households |
| Under 35 Years | 0 | 0.0% |
| 35 to 44 Years | 20 | 3.4% |
| 45 to 54 Years | 97 | 16.5% |
| 55 to 64 Years | 253 | 42.9% |
| 65 to 74 Years | 201 | 34.1% |
| 75 to 84 Years | 0 | 0.0% |
| 85 Years and Over | 18 | 3.1% |
| Total | 589 | 100.0% |
Housing Finances in Funny River
Median Income by Occupancy in Funny River
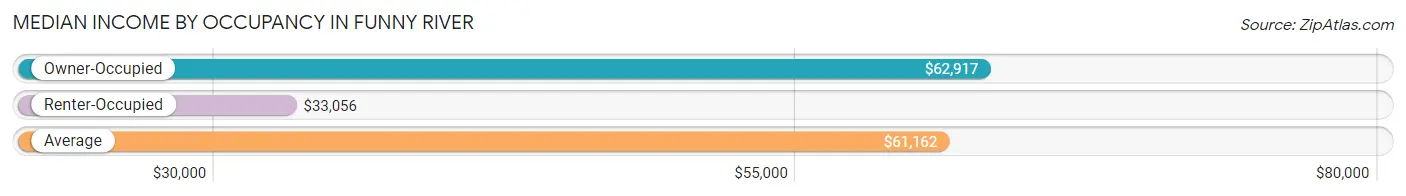
| Occupancy Type | # Households | Median Income |
| Owner-Occupied | 481 (81.7%) | $62,917 |
| Renter-Occupied | 108 (18.3%) | $33,056 |
| Average | 589 (100.0%) | $61,162 |
Occupancy by Householder Income Bracket in Funny River
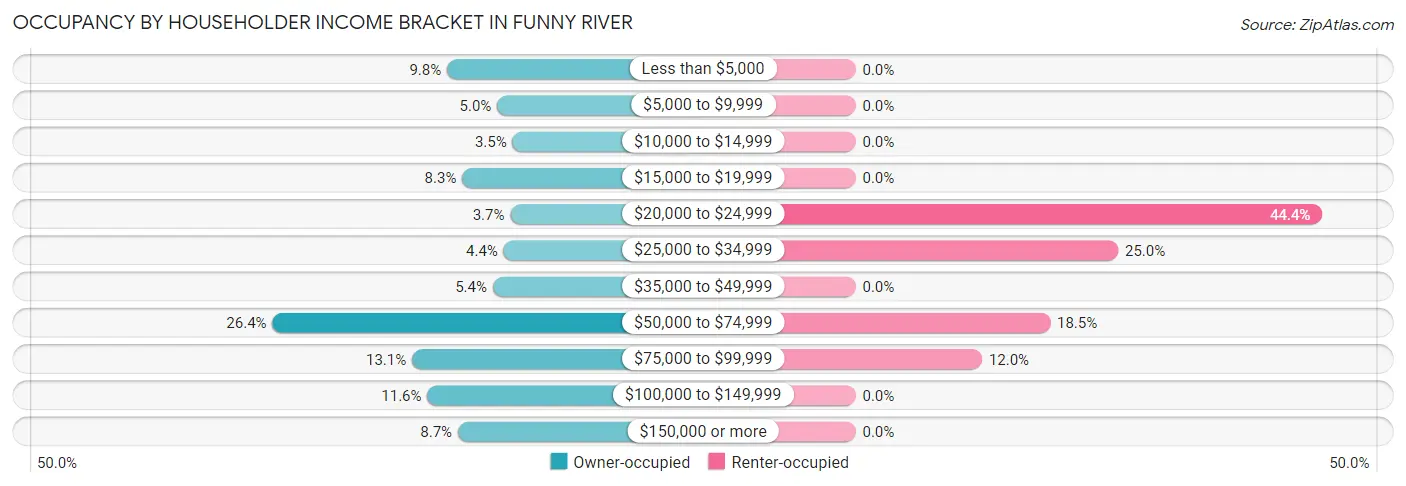
| Income Bracket | Owner-occupied | Renter-occupied |
| Less than $5,000 | 47 (9.8%) | 0 (0.0%) |
| $5,000 to $9,999 | 24 (5.0%) | 0 (0.0%) |
| $10,000 to $14,999 | 17 (3.5%) | 0 (0.0%) |
| $15,000 to $19,999 | 40 (8.3%) | 0 (0.0%) |
| $20,000 to $24,999 | 18 (3.7%) | 48 (44.4%) |
| $25,000 to $34,999 | 21 (4.4%) | 27 (25.0%) |
| $35,000 to $49,999 | 26 (5.4%) | 0 (0.0%) |
| $50,000 to $74,999 | 127 (26.4%) | 20 (18.5%) |
| $75,000 to $99,999 | 63 (13.1%) | 13 (12.0%) |
| $100,000 to $149,999 | 56 (11.6%) | 0 (0.0%) |
| $150,000 or more | 42 (8.7%) | 0 (0.0%) |
| Total | 481 (100.0%) | 108 (100.0%) |
Monthly Housing Cost Tiers in Funny River
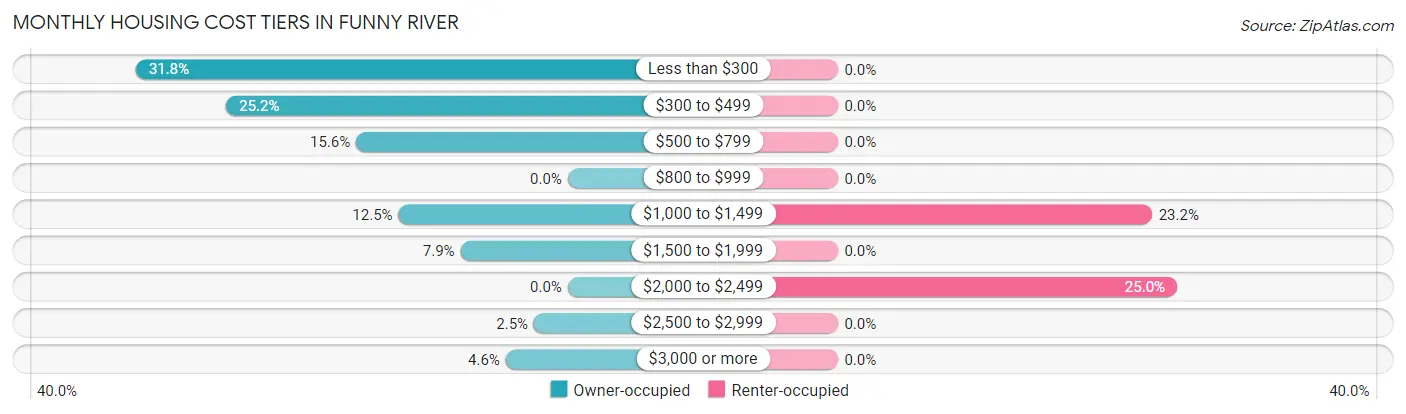
| Monthly Cost | Owner-occupied | Renter-occupied |
| Less than $300 | 153 (31.8%) | 0 (0.0%) |
| $300 to $499 | 121 (25.2%) | 0 (0.0%) |
| $500 to $799 | 75 (15.6%) | 0 (0.0%) |
| $800 to $999 | 0 (0.0%) | 0 (0.0%) |
| $1,000 to $1,499 | 60 (12.5%) | 25 (23.2%) |
| $1,500 to $1,999 | 38 (7.9%) | 0 (0.0%) |
| $2,000 to $2,499 | 0 (0.0%) | 27 (25.0%) |
| $2,500 to $2,999 | 12 (2.5%) | 0 (0.0%) |
| $3,000 or more | 22 (4.6%) | 0 (0.0%) |
| Total | 481 (100.0%) | 108 (100.0%) |
Physical Housing Characteristics in Funny River
Housing Structures in Funny River
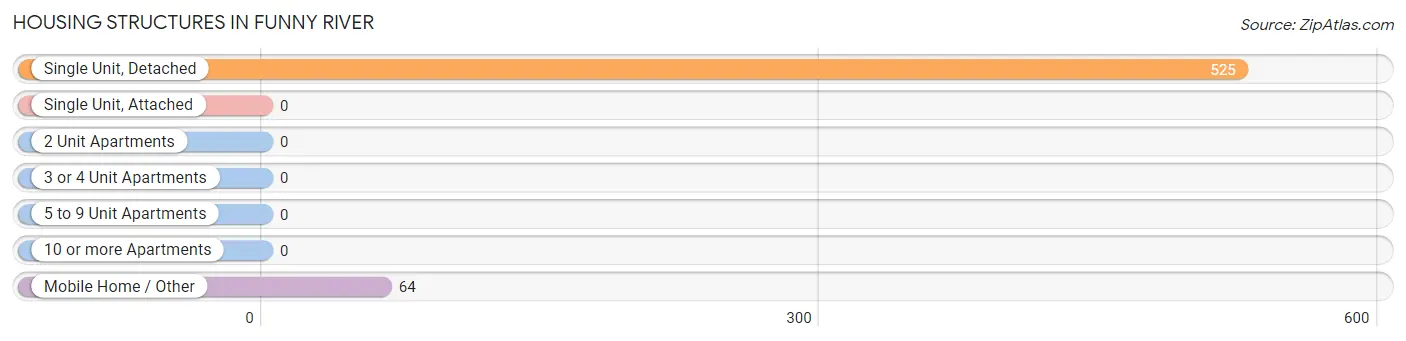
| Structure Type | # Housing Units | % Housing Units |
| Single Unit, Detached | 525 | 89.1% |
| Single Unit, Attached | 0 | 0.0% |
| 2 Unit Apartments | 0 | 0.0% |
| 3 or 4 Unit Apartments | 0 | 0.0% |
| 5 to 9 Unit Apartments | 0 | 0.0% |
| 10 or more Apartments | 0 | 0.0% |
| Mobile Home / Other | 64 | 10.9% |
| Total | 589 | 100.0% |
Housing Structures by Occupancy in Funny River
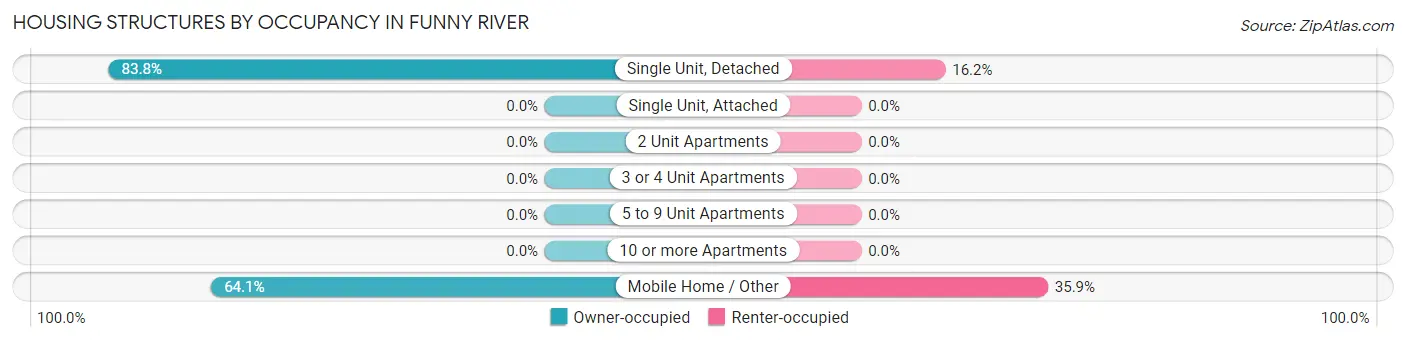
| Structure Type | Owner-occupied | Renter-occupied |
| Single Unit, Detached | 440 (83.8%) | 85 (16.2%) |
| Single Unit, Attached | 0 (0.0%) | 0 (0.0%) |
| 2 Unit Apartments | 0 (0.0%) | 0 (0.0%) |
| 3 or 4 Unit Apartments | 0 (0.0%) | 0 (0.0%) |
| 5 to 9 Unit Apartments | 0 (0.0%) | 0 (0.0%) |
| 10 or more Apartments | 0 (0.0%) | 0 (0.0%) |
| Mobile Home / Other | 41 (64.1%) | 23 (35.9%) |
| Total | 481 (81.7%) | 108 (18.3%) |
Housing Structures by Number of Rooms in Funny River
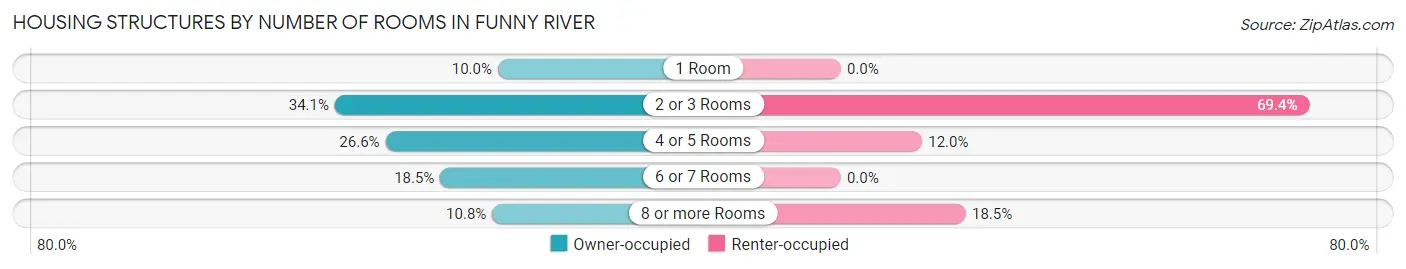
| Number of Rooms | Owner-occupied | Renter-occupied |
| 1 Room | 48 (10.0%) | 0 (0.0%) |
| 2 or 3 Rooms | 164 (34.1%) | 75 (69.4%) |
| 4 or 5 Rooms | 128 (26.6%) | 13 (12.0%) |
| 6 or 7 Rooms | 89 (18.5%) | 0 (0.0%) |
| 8 or more Rooms | 52 (10.8%) | 20 (18.5%) |
| Total | 481 (100.0%) | 108 (100.0%) |
Housing Structure by Heating Type in Funny River
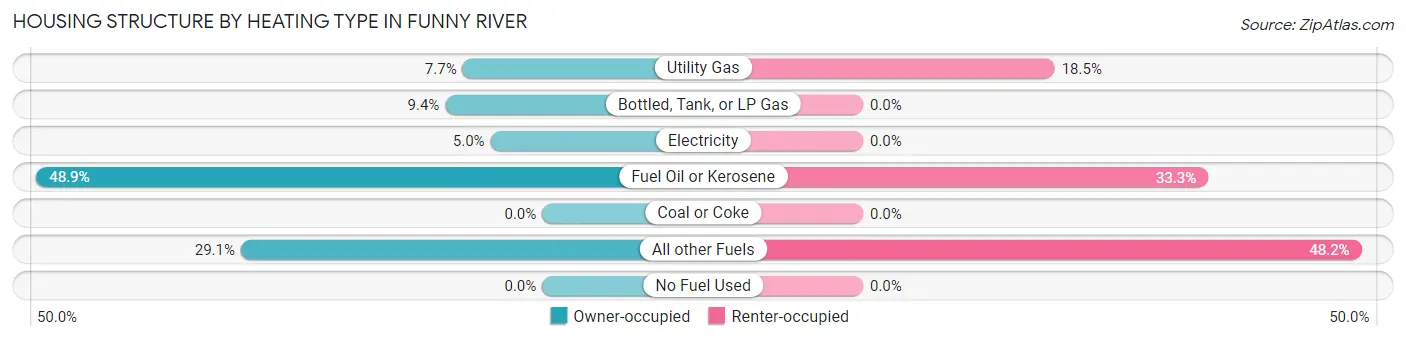
| Heating Type | Owner-occupied | Renter-occupied |
| Utility Gas | 37 (7.7%) | 20 (18.5%) |
| Bottled, Tank, or LP Gas | 45 (9.4%) | 0 (0.0%) |
| Electricity | 24 (5.0%) | 0 (0.0%) |
| Fuel Oil or Kerosene | 235 (48.9%) | 36 (33.3%) |
| Coal or Coke | 0 (0.0%) | 0 (0.0%) |
| All other Fuels | 140 (29.1%) | 52 (48.1%) |
| No Fuel Used | 0 (0.0%) | 0 (0.0%) |
| Total | 481 (100.0%) | 108 (100.0%) |
Household Vehicle Usage in Funny River
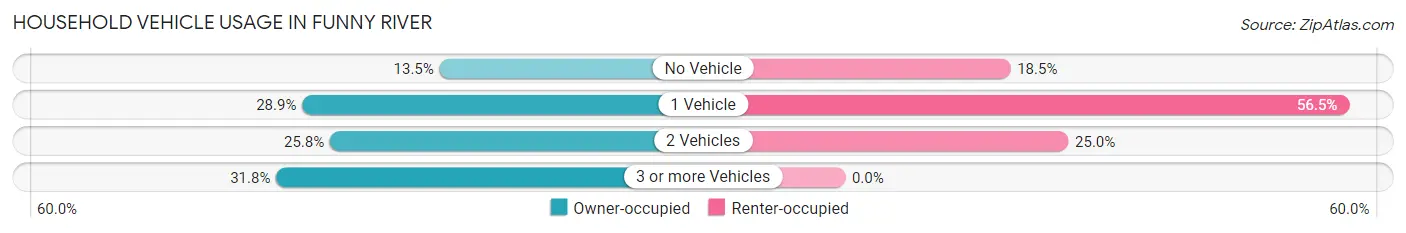
| Vehicles per Household | Owner-occupied | Renter-occupied |
| No Vehicle | 65 (13.5%) | 20 (18.5%) |
| 1 Vehicle | 139 (28.9%) | 61 (56.5%) |
| 2 Vehicles | 124 (25.8%) | 27 (25.0%) |
| 3 or more Vehicles | 153 (31.8%) | 0 (0.0%) |
| Total | 481 (100.0%) | 108 (100.0%) |
Real Estate & Mortgages in Funny River
Real Estate and Mortgage Overview in Funny River
| Characteristic | Without Mortgage | With Mortgage |
| Housing Units | 380 | 101 |
| Median Property Value | - | - |
| Median Household Income | $63,333 | $5 |
| Monthly Housing Costs | $382 | $22 |
| Real Estate Taxes | $1,320 | $15 |
Property Value by Mortgage Status in Funny River
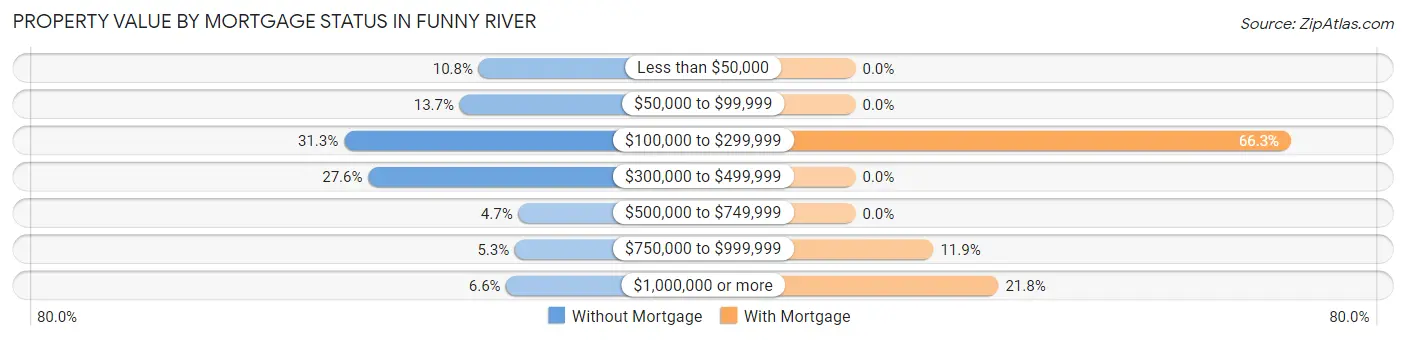
| Property Value | Without Mortgage | With Mortgage |
| Less than $50,000 | 41 (10.8%) | 0 (0.0%) |
| $50,000 to $99,999 | 52 (13.7%) | 0 (0.0%) |
| $100,000 to $299,999 | 119 (31.3%) | 67 (66.3%) |
| $300,000 to $499,999 | 105 (27.6%) | 0 (0.0%) |
| $500,000 to $749,999 | 18 (4.7%) | 0 (0.0%) |
| $750,000 to $999,999 | 20 (5.3%) | 12 (11.9%) |
| $1,000,000 or more | 25 (6.6%) | 22 (21.8%) |
| Total | 380 (100.0%) | 101 (100.0%) |
Household Income by Mortgage Status in Funny River
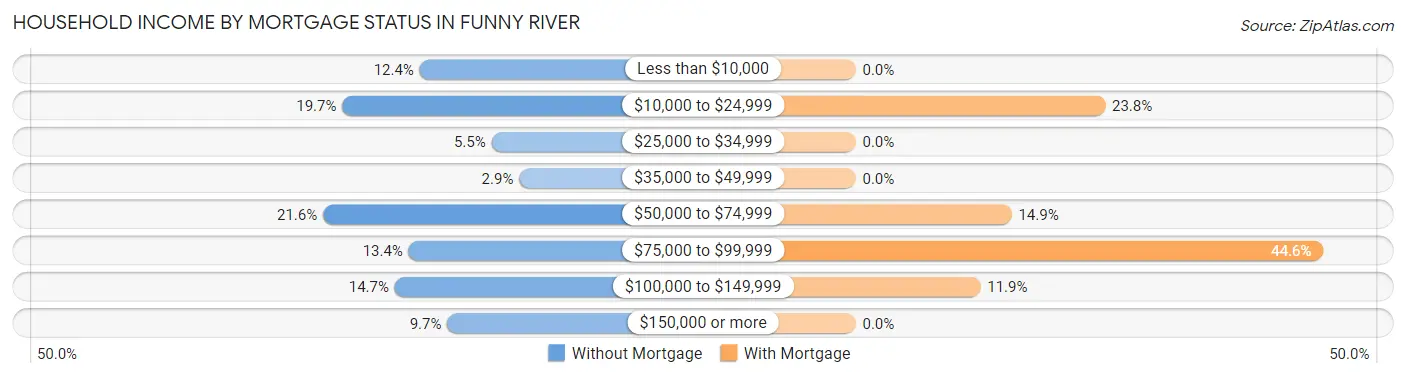
| Household Income | Without Mortgage | With Mortgage |
| Less than $10,000 | 47 (12.4%) | 0 (0.0%) |
| $10,000 to $24,999 | 75 (19.7%) | 24 (23.8%) |
| $25,000 to $34,999 | 21 (5.5%) | 0 (0.0%) |
| $35,000 to $49,999 | 11 (2.9%) | 0 (0.0%) |
| $50,000 to $74,999 | 82 (21.6%) | 15 (14.8%) |
| $75,000 to $99,999 | 51 (13.4%) | 45 (44.6%) |
| $100,000 to $149,999 | 56 (14.7%) | 12 (11.9%) |
| $150,000 or more | 37 (9.7%) | 0 (0.0%) |
| Total | 380 (100.0%) | 101 (100.0%) |
Property Value to Household Income Ratio in Funny River
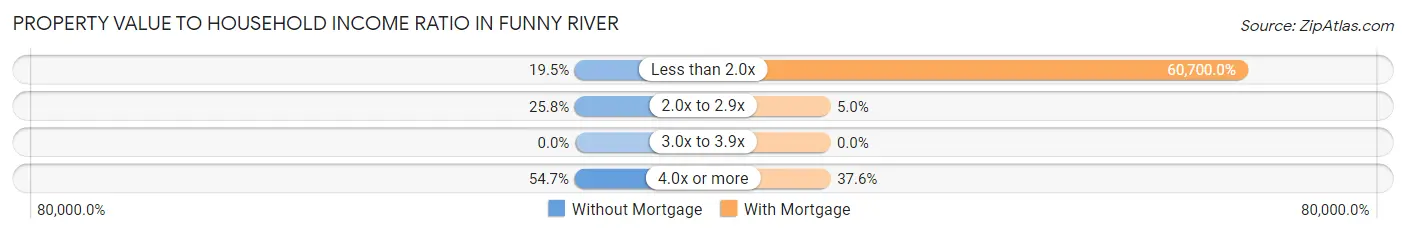
| Value-to-Income Ratio | Without Mortgage | With Mortgage |
| Less than 2.0x | 74 (19.5%) | 61,307 (60,700.0%) |
| 2.0x to 2.9x | 98 (25.8%) | 5 (5.0%) |
| 3.0x to 3.9x | 0 (0.0%) | 0 (0.0%) |
| 4.0x or more | 208 (54.7%) | 38 (37.6%) |
| Total | 380 (100.0%) | 101 (100.0%) |
Real Estate Taxes by Mortgage Status in Funny River
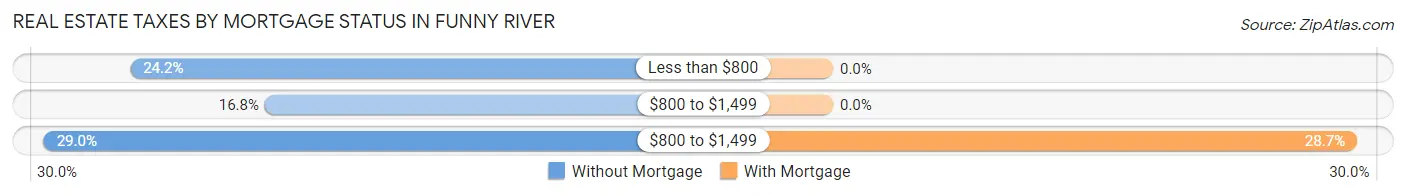
| Property Taxes | Without Mortgage | With Mortgage |
| Less than $800 | 92 (24.2%) | 0 (0.0%) |
| $800 to $1,499 | 64 (16.8%) | 0 (0.0%) |
| $800 to $1,499 | 110 (28.9%) | 29 (28.7%) |
| Total | 380 (100.0%) | 101 (100.0%) |
Health & Disability in Funny River
Health Insurance Coverage by Age in Funny River
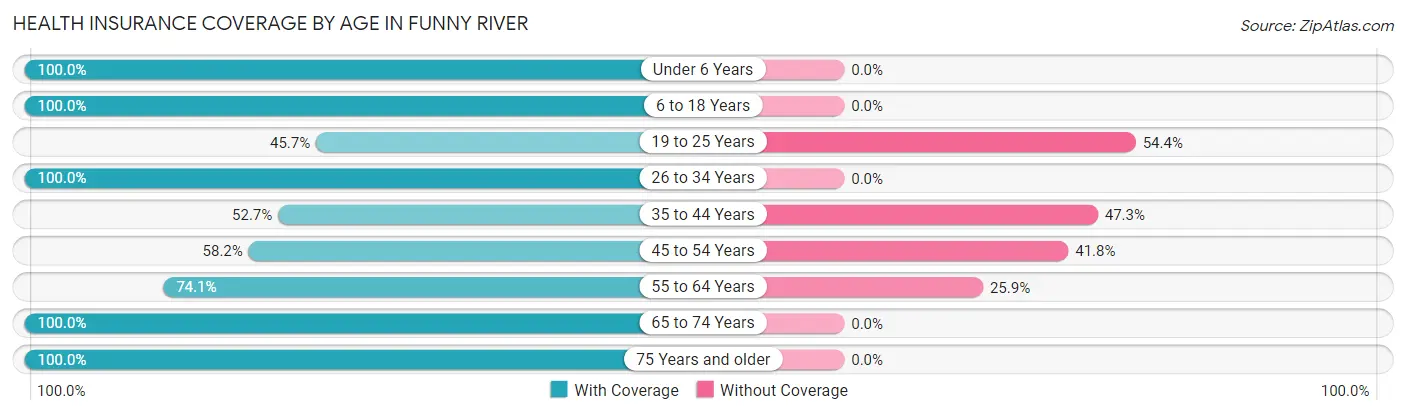
| Age Bracket | With Coverage | Without Coverage |
| Under 6 Years | 41 (100.0%) | 0 (0.0%) |
| 6 to 18 Years | 30 (100.0%) | 0 (0.0%) |
| 19 to 25 Years | 21 (45.7%) | 25 (54.3%) |
| 26 to 34 Years | 52 (100.0%) | 0 (0.0%) |
| 35 to 44 Years | 29 (52.7%) | 26 (47.3%) |
| 45 to 54 Years | 92 (58.2%) | 66 (41.8%) |
| 55 to 64 Years | 238 (74.1%) | 83 (25.9%) |
| 65 to 74 Years | 343 (100.0%) | 0 (0.0%) |
| 75 Years and older | 26 (100.0%) | 0 (0.0%) |
| Total | 872 (81.3%) | 200 (18.7%) |
Health Insurance Coverage by Citizenship Status in Funny River
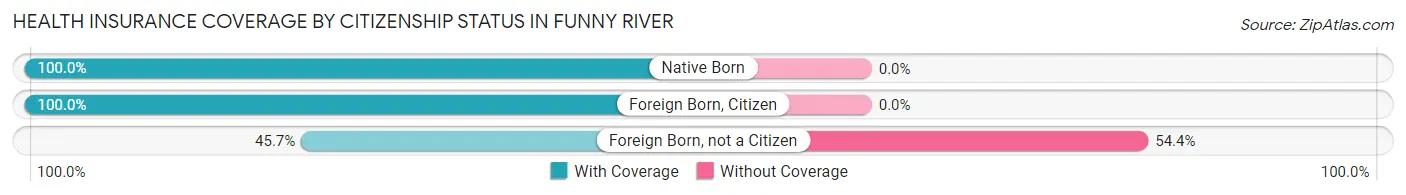
| Citizenship Status | With Coverage | Without Coverage |
| Native Born | 41 (100.0%) | 0 (0.0%) |
| Foreign Born, Citizen | 30 (100.0%) | 0 (0.0%) |
| Foreign Born, not a Citizen | 21 (45.7%) | 25 (54.3%) |
Health Insurance Coverage by Household Income in Funny River
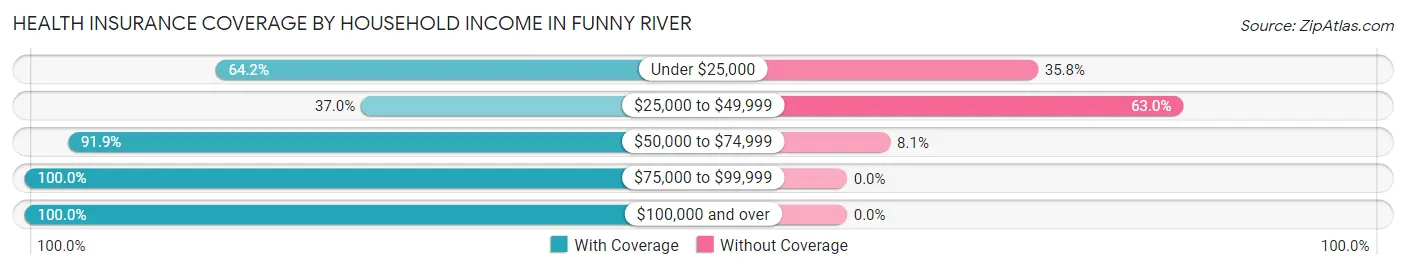
| Household Income | With Coverage | Without Coverage |
| Under $25,000 | 174 (64.2%) | 97 (35.8%) |
| $25,000 to $49,999 | 44 (37.0%) | 75 (63.0%) |
| $50,000 to $74,999 | 317 (91.9%) | 28 (8.1%) |
| $75,000 to $99,999 | 125 (100.0%) | 0 (0.0%) |
| $100,000 and over | 212 (100.0%) | 0 (0.0%) |
Public vs Private Health Insurance Coverage by Age in Funny River
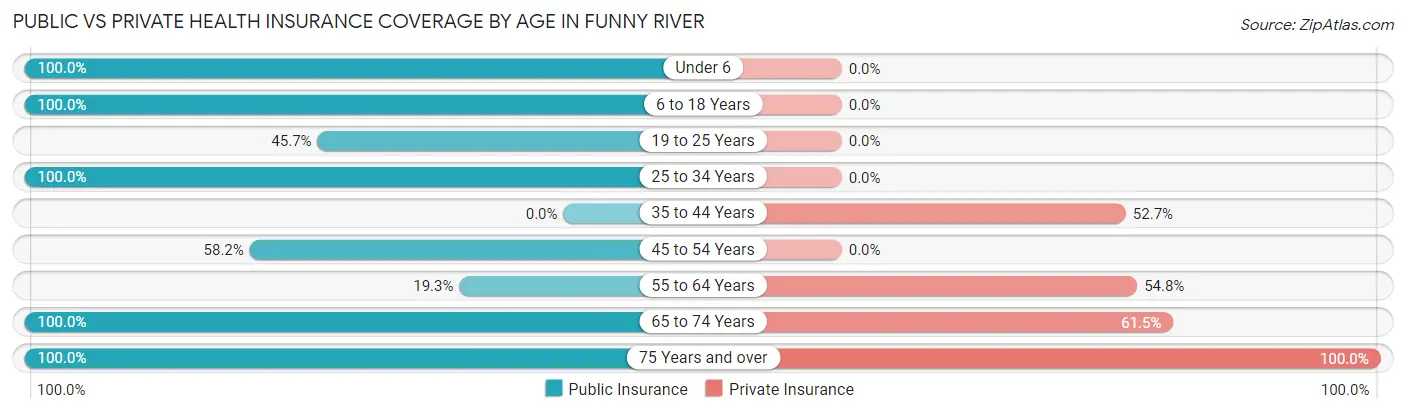
| Age Bracket | Public Insurance | Private Insurance |
| Under 6 | 41 (100.0%) | 0 (0.0%) |
| 6 to 18 Years | 30 (100.0%) | 0 (0.0%) |
| 19 to 25 Years | 21 (45.7%) | 0 (0.0%) |
| 25 to 34 Years | 52 (100.0%) | 0 (0.0%) |
| 35 to 44 Years | 0 (0.0%) | 29 (52.7%) |
| 45 to 54 Years | 92 (58.2%) | 0 (0.0%) |
| 55 to 64 Years | 62 (19.3%) | 176 (54.8%) |
| 65 to 74 Years | 343 (100.0%) | 211 (61.5%) |
| 75 Years and over | 26 (100.0%) | 26 (100.0%) |
| Total | 667 (62.2%) | 442 (41.2%) |
Disability Status by Sex by Age in Funny River
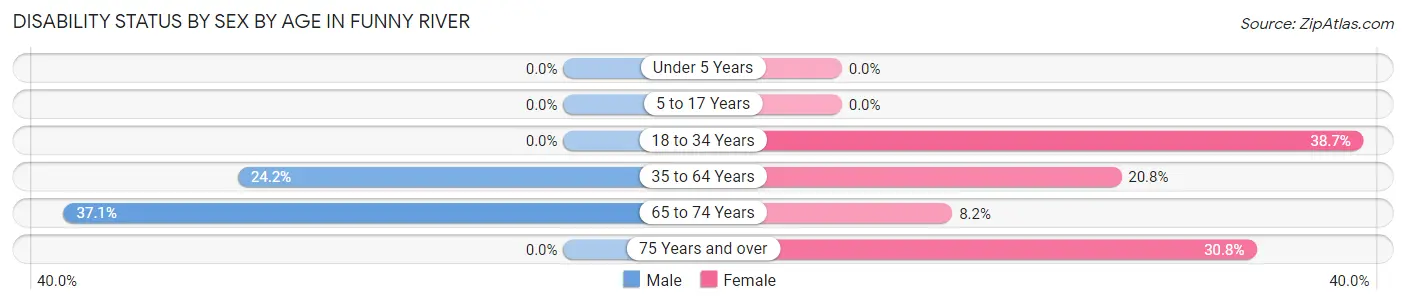
| Age Bracket | Male | Female |
| Under 5 Years | 0 (0.0%) | 0 (0.0%) |
| 5 to 17 Years | 0 (0.0%) | 0 (0.0%) |
| 18 to 34 Years | 0 (0.0%) | 29 (38.7%) |
| 35 to 64 Years | 65 (24.2%) | 55 (20.7%) |
| 65 to 74 Years | 82 (37.1%) | 10 (8.2%) |
| 75 Years and over | 0 (0.0%) | 8 (30.8%) |
Disability Class by Sex by Age in Funny River
Disability Class: Hearing Difficulty
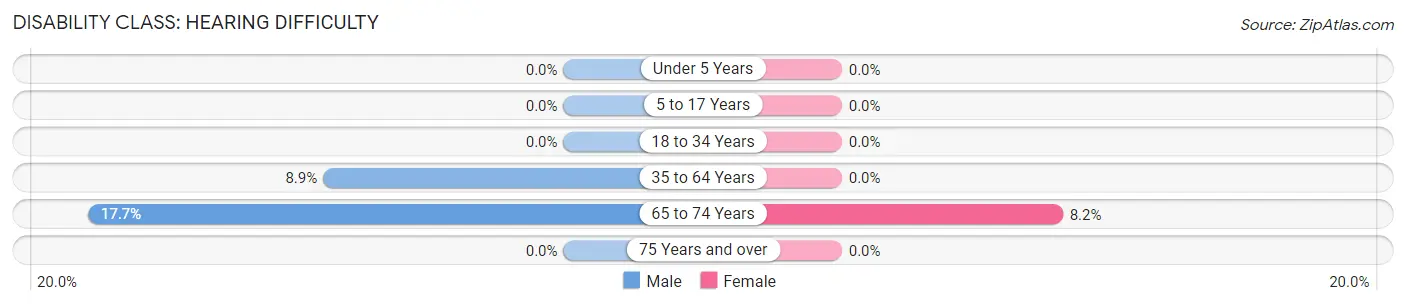
| Age Bracket | Male | Female |
| Under 5 Years | 0 (0.0%) | 0 (0.0%) |
| 5 to 17 Years | 0 (0.0%) | 0 (0.0%) |
| 18 to 34 Years | 0 (0.0%) | 0 (0.0%) |
| 35 to 64 Years | 24 (8.9%) | 0 (0.0%) |
| 65 to 74 Years | 39 (17.6%) | 10 (8.2%) |
| 75 Years and over | 0 (0.0%) | 0 (0.0%) |
Disability Class: Vision Difficulty
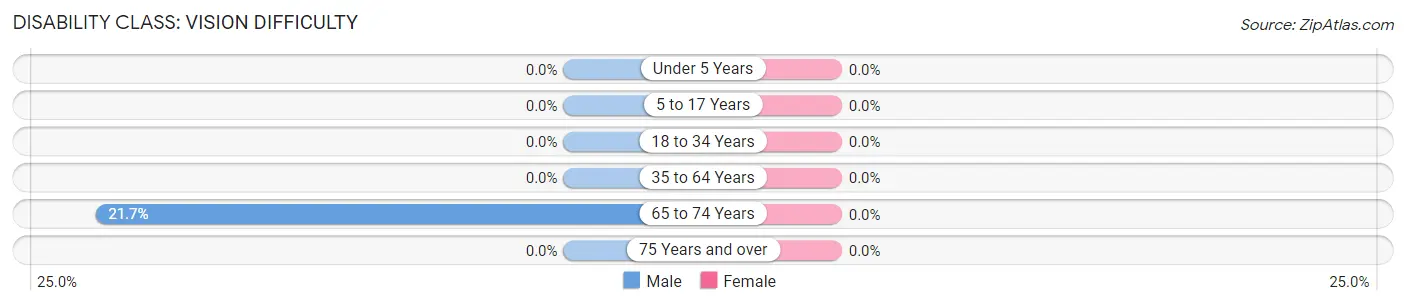
| Age Bracket | Male | Female |
| Under 5 Years | 0 (0.0%) | 0 (0.0%) |
| 5 to 17 Years | 0 (0.0%) | 0 (0.0%) |
| 18 to 34 Years | 0 (0.0%) | 0 (0.0%) |
| 35 to 64 Years | 0 (0.0%) | 0 (0.0%) |
| 65 to 74 Years | 48 (21.7%) | 0 (0.0%) |
| 75 Years and over | 0 (0.0%) | 0 (0.0%) |
Disability Class: Cognitive Difficulty
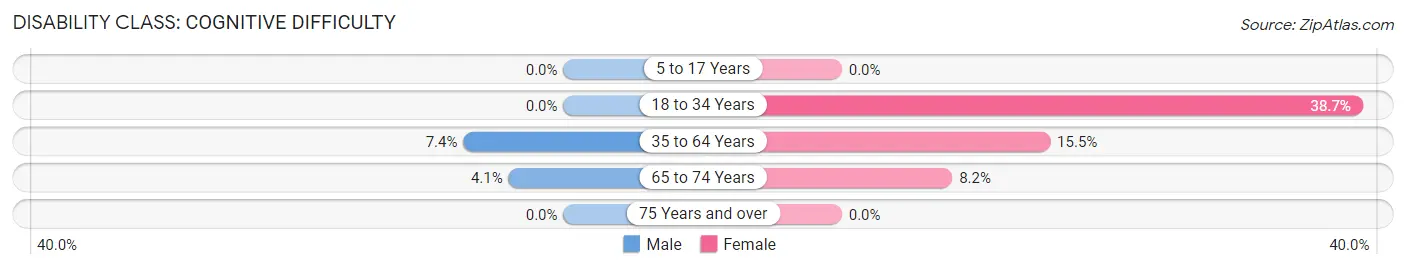
| Age Bracket | Male | Female |
| 5 to 17 Years | 0 (0.0%) | 0 (0.0%) |
| 18 to 34 Years | 0 (0.0%) | 29 (38.7%) |
| 35 to 64 Years | 20 (7.4%) | 41 (15.5%) |
| 65 to 74 Years | 9 (4.1%) | 10 (8.2%) |
| 75 Years and over | 0 (0.0%) | 0 (0.0%) |
Disability Class: Ambulatory Difficulty
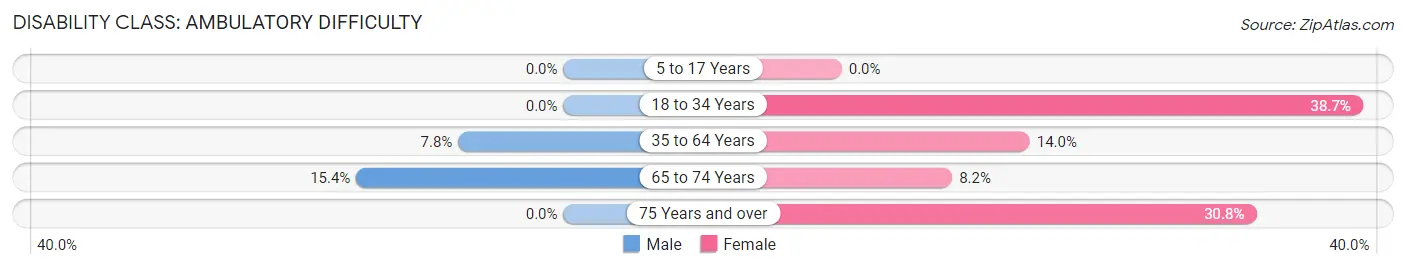
| Age Bracket | Male | Female |
| 5 to 17 Years | 0 (0.0%) | 0 (0.0%) |
| 18 to 34 Years | 0 (0.0%) | 29 (38.7%) |
| 35 to 64 Years | 21 (7.8%) | 37 (14.0%) |
| 65 to 74 Years | 34 (15.4%) | 10 (8.2%) |
| 75 Years and over | 0 (0.0%) | 8 (30.8%) |
Disability Class: Self-Care Difficulty
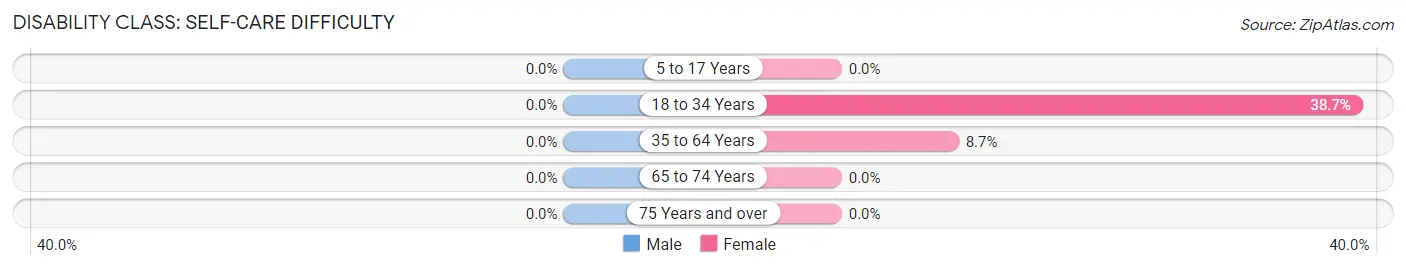
| Age Bracket | Male | Female |
| 5 to 17 Years | 0 (0.0%) | 0 (0.0%) |
| 18 to 34 Years | 0 (0.0%) | 29 (38.7%) |
| 35 to 64 Years | 0 (0.0%) | 23 (8.7%) |
| 65 to 74 Years | 0 (0.0%) | 0 (0.0%) |
| 75 Years and over | 0 (0.0%) | 0 (0.0%) |
Technology Access in Funny River
Computing Device Access in Funny River
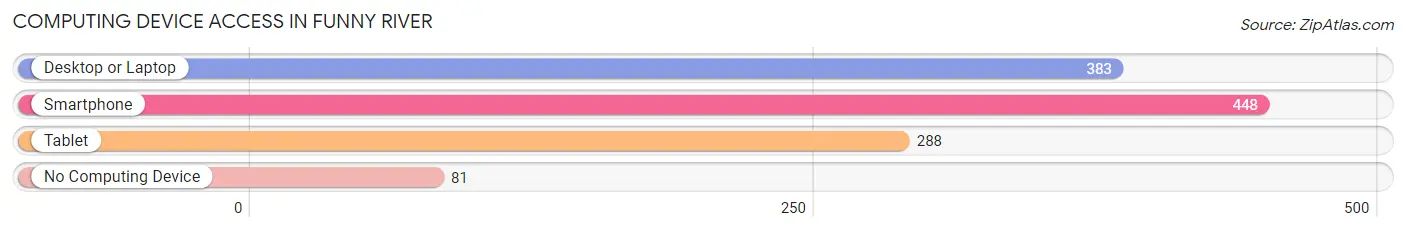
| Device Type | # Households | % Households |
| Desktop or Laptop | 383 | 65.0% |
| Smartphone | 448 | 76.1% |
| Tablet | 288 | 48.9% |
| No Computing Device | 81 | 13.8% |
| Total | 589 | 100.0% |
Internet Access in Funny River
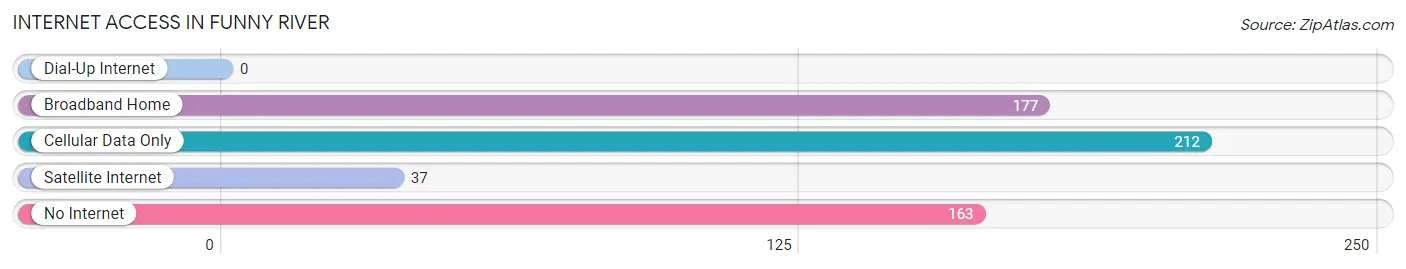
| Internet Type | # Households | % Households |
| Dial-Up Internet | 0 | 0.0% |
| Broadband Home | 177 | 30.0% |
| Cellular Data Only | 212 | 36.0% |
| Satellite Internet | 37 | 6.3% |
| No Internet | 163 | 27.7% |
| Total | 589 | 100.0% |
Funny River Summary
Funny River is an unincorporated community located in the Kenai Peninsula Borough of Alaska. It is located on the Kenai Peninsula, about 25 miles southwest of Soldotna. The community is situated on the banks of the Funny River, a tributary of the Kenai River. The population of Funny River was 1,068 as of the 2010 census.
History
The area around Funny River has been inhabited by the Dena’ina Athabascan people for thousands of years. The Dena’ina people have a rich culture and history in the area, and continue to live in the area today.
The first non-Native settlers in the area arrived in the late 1800s. The first homesteaders in the area were miners who were looking for gold. The area was also home to trappers and fishermen who were looking to make a living off the land.
The first post office in the area was established in 1915. The post office was named after the Funny River, which was named by a prospector who thought the river was funny because it was so shallow.
Geography
Funny River is located in the Kenai Peninsula Borough of Alaska. It is situated on the banks of the Funny River, a tributary of the Kenai River. The community is located about 25 miles southwest of Soldotna.
The area around Funny River is mostly flat, with some rolling hills. The area is covered in dense forests of spruce, birch, and alder. The area is also home to a variety of wildlife, including moose, bear, and beaver.
Economy
The economy of Funny River is largely based on fishing and tourism. The area is home to a variety of fish, including salmon, trout, and halibut. The area is also popular with tourists, who come to enjoy the area’s natural beauty and outdoor activities.
The area is also home to a variety of businesses, including restaurants, stores, and lodges. The area is also home to a number of small businesses, such as construction companies, auto repair shops, and landscaping companies.
Demographics
As of the 2010 census, the population of Funny River was 1,068. The population is mostly white, with a small percentage of Native Americans and other races. The median age of the population is 44.7 years. The median household income is $60,938.
Conclusion
Funny River is an unincorporated community located in the Kenai Peninsula Borough of Alaska. It is situated on the banks of the Funny River, a tributary of the Kenai River. The area has been inhabited by the Dena’ina Athabascan people for thousands of years, and was later settled by miners, trappers, and fishermen. The economy of Funny River is largely based on fishing and tourism. The population of Funny River was 1,068 as of the 2010 census.
Common Questions
What is Per Capita Income in Funny River?
Per Capita income in Funny River is $39,100.
What is the Median Family Income in Funny River?
Median Family Income in Funny River is $63,550.
What is the Median Household income in Funny River?
Median Household Income in Funny River is $61,162.
What is Income or Wage Gap in Funny River?
Income or Wage Gap in Funny River is 23.6%.
Women in Funny River earn 76.4 cents for every dollar earned by a man.
What is Inequality or Gini Index in Funny River?
Inequality or Gini Index in Funny River is 0.48.
What is the Total Population of Funny River?
Total Population of Funny River is 1,072.
What is the Total Male Population of Funny River?
Total Male Population of Funny River is 513.
What is the Total Female Population of Funny River?
Total Female Population of Funny River is 559.
What is the Ratio of Males per 100 Females in Funny River?
There are 91.77 Males per 100 Females in Funny River.
What is the Ratio of Females per 100 Males in Funny River?
There are 108.97 Females per 100 Males in Funny River.
What is the Median Population Age in Funny River?
Median Population Age in Funny River is 57.9 Years.
What is the Average Family Size in Funny River
Average Family Size in Funny River is 2.6 People.
What is the Average Household Size in Funny River
Average Household Size in Funny River is 1.8 People.
How Large is the Labor Force in Funny River?
There are 454 People in the Labor Forcein in Funny River.
What is the Percentage of People in the Labor Force in Funny River?
45.4% of People are in the Labor Force in Funny River.
What is the Unemployment Rate in Funny River?
Unemployment Rate in Funny River is 5.1%.