Buffalo Soapstone, AK Map & Demographics
Buffalo Soapstone Map
Buffalo Soapstone Overview
$35,111
PER CAPITA INCOME
$88,000
AVG FAMILY INCOME
$76,563
AVG HOUSEHOLD INCOME
21.8%
WAGE / INCOME GAP [ % ]
78.2¢/ $1
WAGE / INCOME GAP [ $ ]
0.43
INEQUALITY / GINI INDEX
959
TOTAL POPULATION
499
MALE POPULATION
460
FEMALE POPULATION
108.48
MALES / 100 FEMALES
92.18
FEMALES / 100 MALES
41.4
MEDIAN AGE
3.2
AVG FAMILY SIZE
2.8
AVG HOUSEHOLD SIZE
423
LABOR FORCE [ PEOPLE ]
56.5%
PERCENT IN LABOR FORCE
13.7%
UNEMPLOYMENT RATE
Income in Buffalo Soapstone
Income Overview in Buffalo Soapstone
Per Capita Income in Buffalo Soapstone is $35,111, while median incomes of families and households are $88,000 and $76,563 respectively.
| Characteristic | Number | Measure |
| Per Capita Income | 959 | $35,111 |
| Median Family Income | 266 | $88,000 |
| Mean Family Income | 266 | $109,618 |
| Median Household Income | 341 | $76,563 |
| Mean Household Income | 341 | $99,989 |
| Income Deficit | 266 | $0 |
| Wage / Income Gap (%) | 959 | 21.81% |
| Wage / Income Gap ($) | 959 | 78.19¢ per $1 |
| Gini / Inequality Index | 959 | 0.43 |
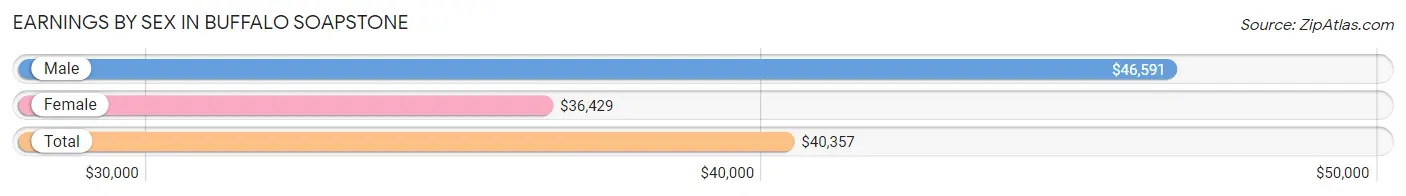
Earnings by Sex in Buffalo Soapstone
Average Earnings in Buffalo Soapstone are $40,357, $46,591 for men and $36,429 for women, a difference of 21.8%.
| Sex | Number | Average Earnings |
| Male | 266 (57.3%) | $46,591 |
| Female | 198 (42.7%) | $36,429 |
| Total | 464 (100.0%) | $40,357 |
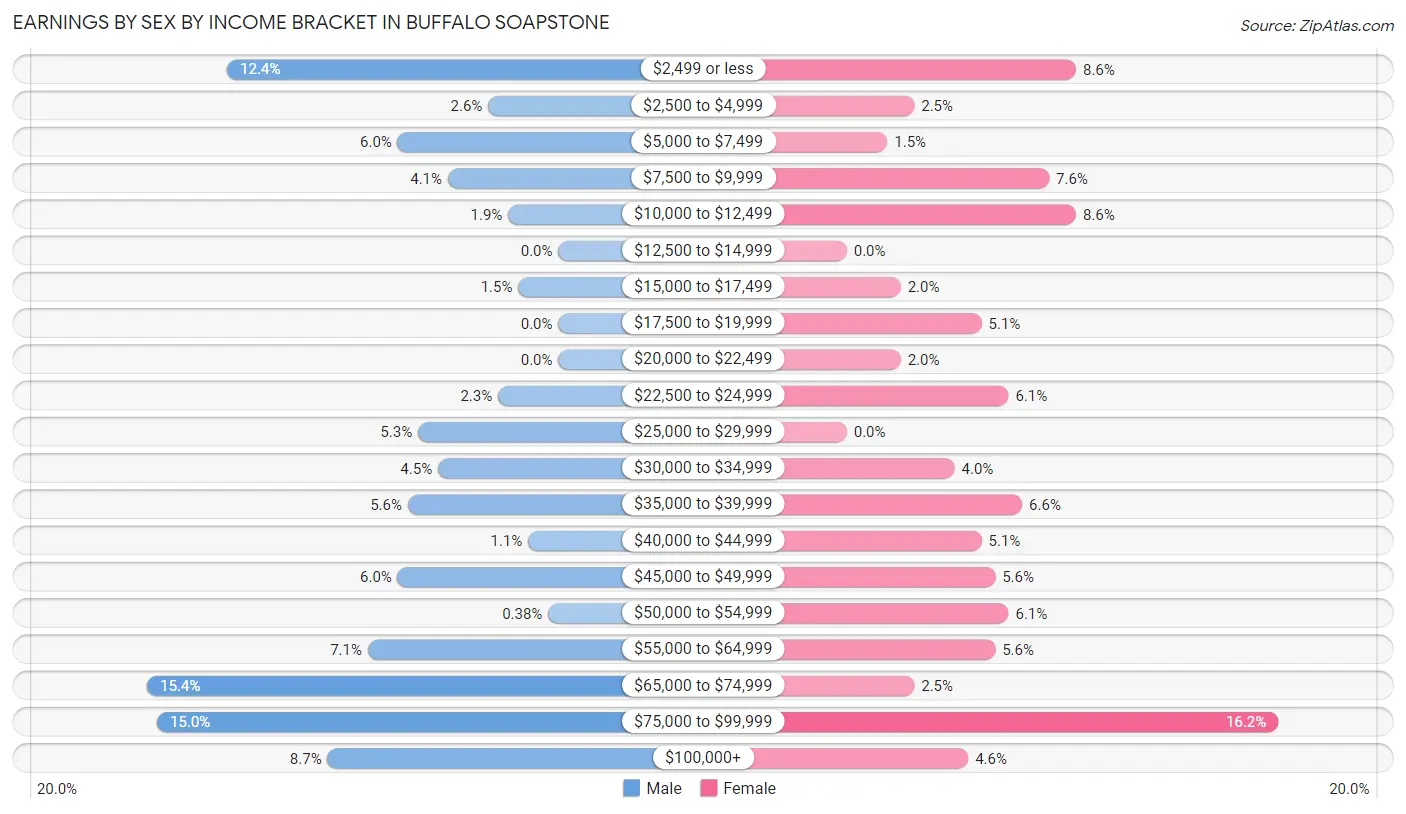
Earnings by Sex by Income Bracket in Buffalo Soapstone
The most common earnings brackets in Buffalo Soapstone are $65,000 to $74,999 for men (41 | 15.4%) and $75,000 to $99,999 for women (32 | 16.2%).
| Income | Male | Female |
| $2,499 or less | 33 (12.4%) | 17 (8.6%) |
| $2,500 to $4,999 | 7 (2.6%) | 5 (2.5%) |
| $5,000 to $7,499 | 16 (6.0%) | 3 (1.5%) |
| $7,500 to $9,999 | 11 (4.1%) | 15 (7.6%) |
| $10,000 to $12,499 | 5 (1.9%) | 17 (8.6%) |
| $12,500 to $14,999 | 0 (0.0%) | 0 (0.0%) |
| $15,000 to $17,499 | 4 (1.5%) | 4 (2.0%) |
| $17,500 to $19,999 | 0 (0.0%) | 10 (5.1%) |
| $20,000 to $22,499 | 0 (0.0%) | 4 (2.0%) |
| $22,500 to $24,999 | 6 (2.3%) | 12 (6.1%) |
| $25,000 to $29,999 | 14 (5.3%) | 0 (0.0%) |
| $30,000 to $34,999 | 12 (4.5%) | 8 (4.0%) |
| $35,000 to $39,999 | 15 (5.6%) | 13 (6.6%) |
| $40,000 to $44,999 | 3 (1.1%) | 10 (5.1%) |
| $45,000 to $49,999 | 16 (6.0%) | 11 (5.6%) |
| $50,000 to $54,999 | 1 (0.4%) | 12 (6.1%) |
| $55,000 to $64,999 | 19 (7.1%) | 11 (5.6%) |
| $65,000 to $74,999 | 41 (15.4%) | 5 (2.5%) |
| $75,000 to $99,999 | 40 (15.0%) | 32 (16.2%) |
| $100,000+ | 23 (8.6%) | 9 (4.5%) |
| Total | 266 (100.0%) | 198 (100.0%) |
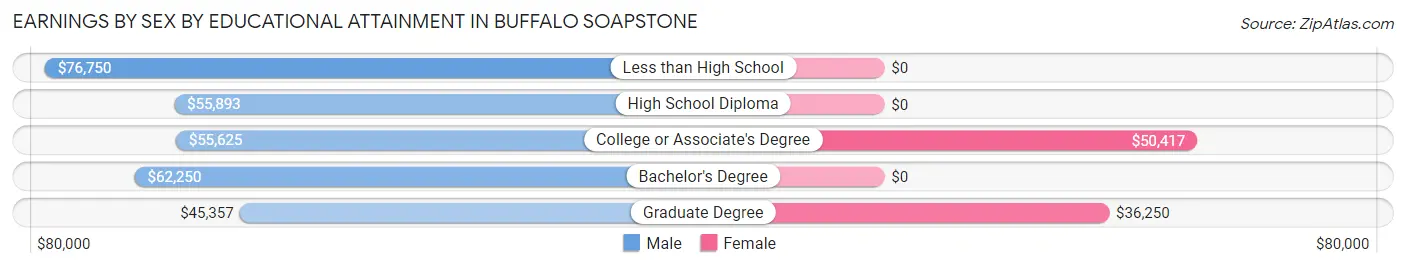
Earnings by Sex by Educational Attainment in Buffalo Soapstone
Average earnings in Buffalo Soapstone are $57,500 for men and $38,958 for women, a difference of 32.3%. Men with an educational attainment of less than high school enjoy the highest average annual earnings of $76,750, while those with graduate degree education earn the least with $45,357. Women with an educational attainment of college or associate's degree earn the most with the average annual earnings of $50,417, while those with graduate degree education have the smallest earnings of $36,250.
| Educational Attainment | Male Income | Female Income |
| Less than High School | $76,750 | $0 |
| High School Diploma | $55,893 | $0 |
| College or Associate's Degree | $55,625 | $50,417 |
| Bachelor's Degree | $62,250 | $0 |
| Graduate Degree | $45,357 | $36,250 |
| Total | $57,500 | $38,958 |
Family Income in Buffalo Soapstone
Family Income Brackets in Buffalo Soapstone
According to the Buffalo Soapstone family income data, there are 63 families falling into the $50,000 to $74,999 income range, which is the most common income bracket and makes up 23.7% of all families. Conversely, the $10,000 to $14,999 income bracket is the least frequent group with only 4 families (1.5%) belonging to this category.
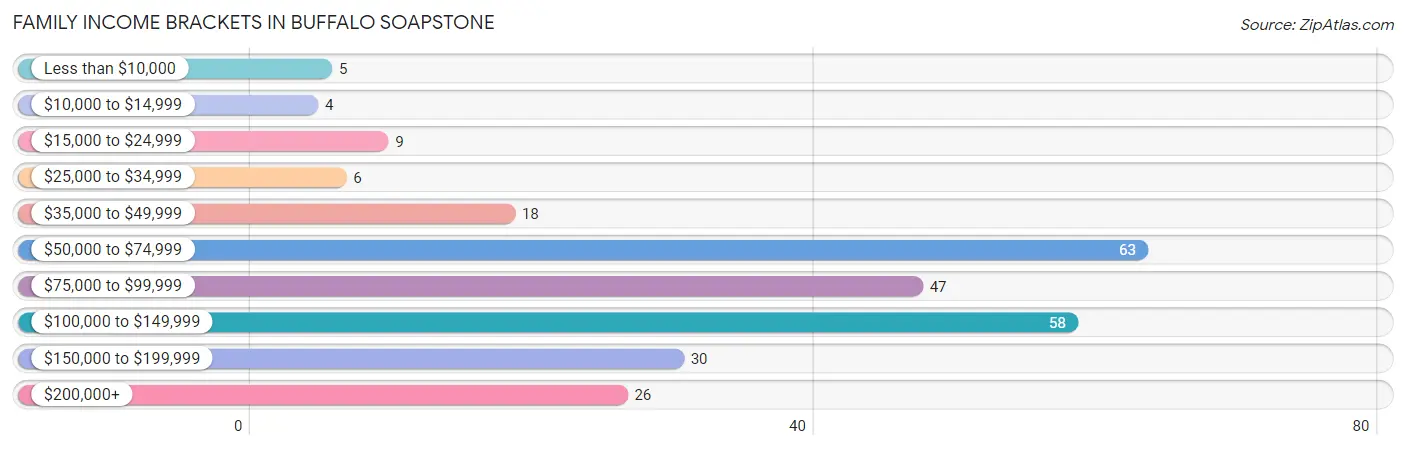
| Income Bracket | # Families | % Families |
| Less than $10,000 | 5 | 1.9% |
| $10,000 to $14,999 | 4 | 1.5% |
| $15,000 to $24,999 | 9 | 3.4% |
| $25,000 to $34,999 | 6 | 2.3% |
| $35,000 to $49,999 | 18 | 6.8% |
| $50,000 to $74,999 | 63 | 23.7% |
| $75,000 to $99,999 | 47 | 17.7% |
| $100,000 to $149,999 | 58 | 21.8% |
| $150,000 to $199,999 | 30 | 11.3% |
| $200,000+ | 26 | 9.8% |
Family Income by Famaliy Size in Buffalo Soapstone
6-person families (29 | 10.9%) account for the highest median family income in Buffalo Soapstone with $137,375 per family, while 3-person families (28 | 10.5%) have the highest median income of $38,500 per family member.
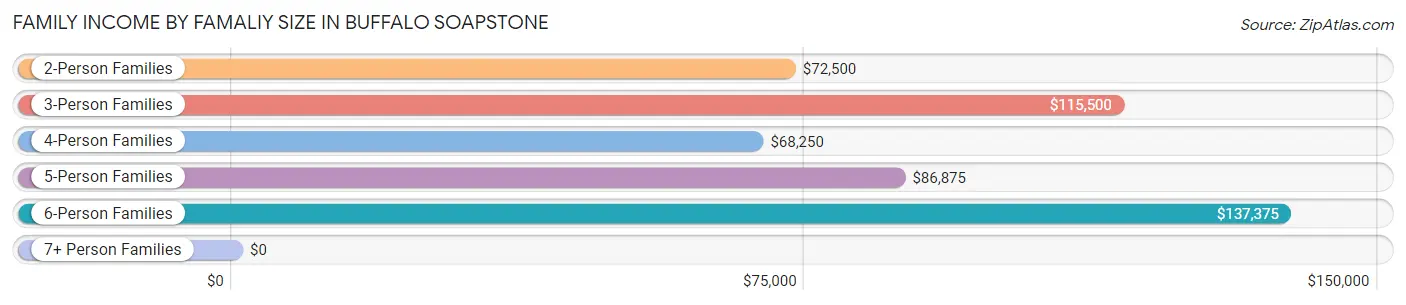
| Income Bracket | # Families | Median Income |
| 2-Person Families | 144 (54.1%) | $72,500 |
| 3-Person Families | 28 (10.5%) | $115,500 |
| 4-Person Families | 31 (11.7%) | $68,250 |
| 5-Person Families | 23 (8.6%) | $86,875 |
| 6-Person Families | 29 (10.9%) | $137,375 |
| 7+ Person Families | 11 (4.1%) | $0 |
| Total | 266 (100.0%) | $88,000 |
Family Income by Number of Earners in Buffalo Soapstone
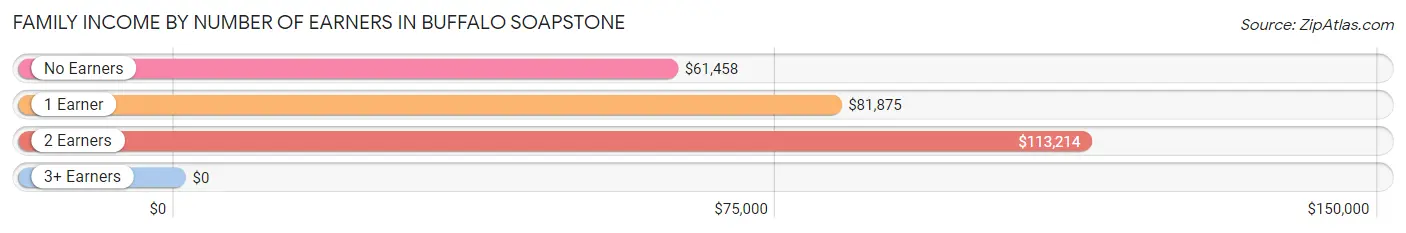
| Number of Earners | # Families | Median Income |
| No Earners | 39 (14.7%) | $61,458 |
| 1 Earner | 92 (34.6%) | $81,875 |
| 2 Earners | 100 (37.6%) | $113,214 |
| 3+ Earners | 35 (13.2%) | $0 |
| Total | 266 (100.0%) | $88,000 |
Household Income in Buffalo Soapstone
Household Income Brackets in Buffalo Soapstone
With 69 households falling in the category, the $50,000 to $74,999 income range is the most frequent in Buffalo Soapstone, accounting for 20.2% of all households. In contrast, only 8 households (2.4%) fall into the $10,000 to $14,999 income bracket, making it the least populous group.
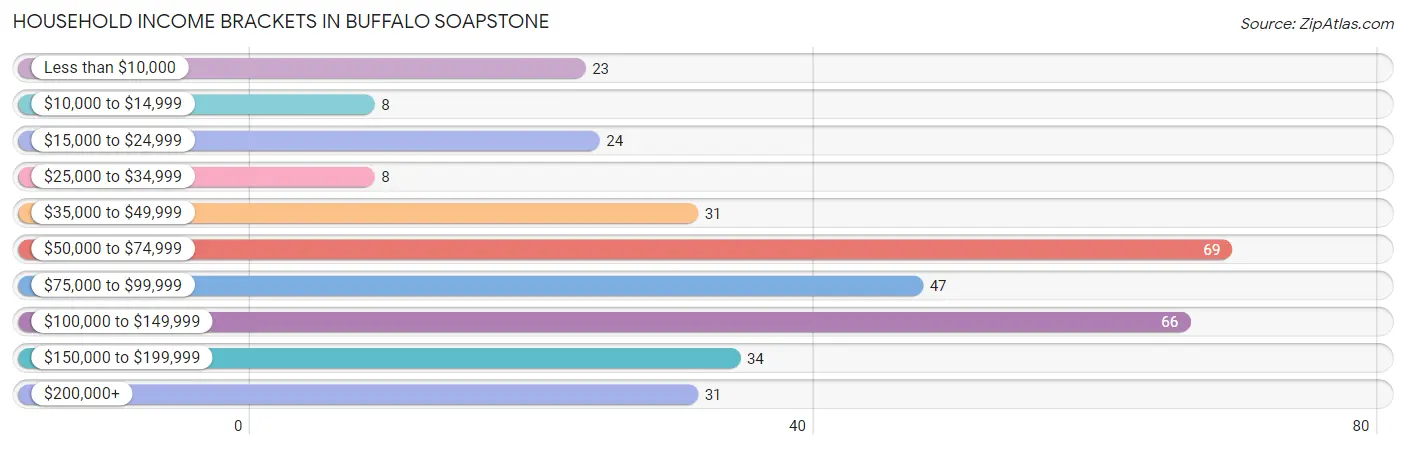
| Income Bracket | # Households | % Households |
| Less than $10,000 | 23 | 6.7% |
| $10,000 to $14,999 | 8 | 2.3% |
| $15,000 to $24,999 | 24 | 7.0% |
| $25,000 to $34,999 | 8 | 2.3% |
| $35,000 to $49,999 | 31 | 9.1% |
| $50,000 to $74,999 | 69 | 20.2% |
| $75,000 to $99,999 | 47 | 13.8% |
| $100,000 to $149,999 | 66 | 19.4% |
| $150,000 to $199,999 | 34 | 10.0% |
| $200,000+ | 31 | 9.1% |
Household Income by Householder Age in Buffalo Soapstone
The median household income in Buffalo Soapstone is $76,563, with the highest median household income of $100,625 found in the 25 to 44 years age bracket for the primary householder. A total of 93 households (27.3%) fall into this category. Meanwhile, the 15 to 24 years age bracket for the primary householder has the lowest median household income of $0, with 6 households (1.8%) in this group.
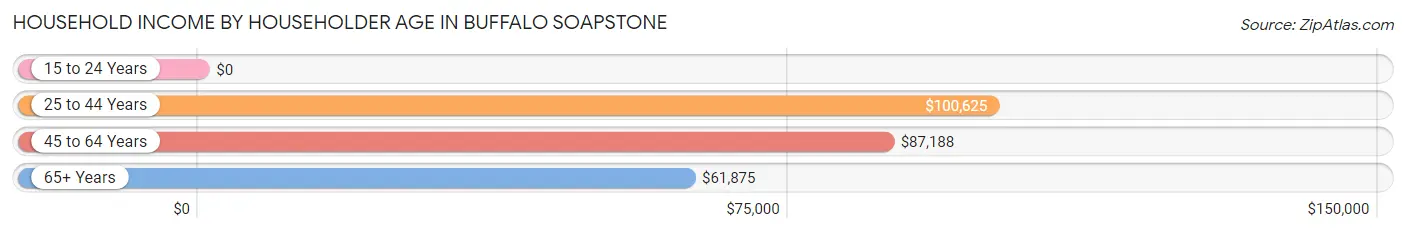
| Income Bracket | # Households | Median Income |
| 15 to 24 Years | 6 (1.8%) | $0 |
| 25 to 44 Years | 93 (27.3%) | $100,625 |
| 45 to 64 Years | 139 (40.8%) | $87,188 |
| 65+ Years | 103 (30.2%) | $61,875 |
| Total | 341 (100.0%) | $76,563 |
Poverty in Buffalo Soapstone
Income Below Poverty by Sex and Age in Buffalo Soapstone
With 9.2% poverty level for males and 8.4% for females among the residents of Buffalo Soapstone, under 5 year old males and 25 to 34 year old females are the most vulnerable to poverty, with 9 males (37.5%) and 19 females (27.5%) in their respective age groups living below the poverty level.
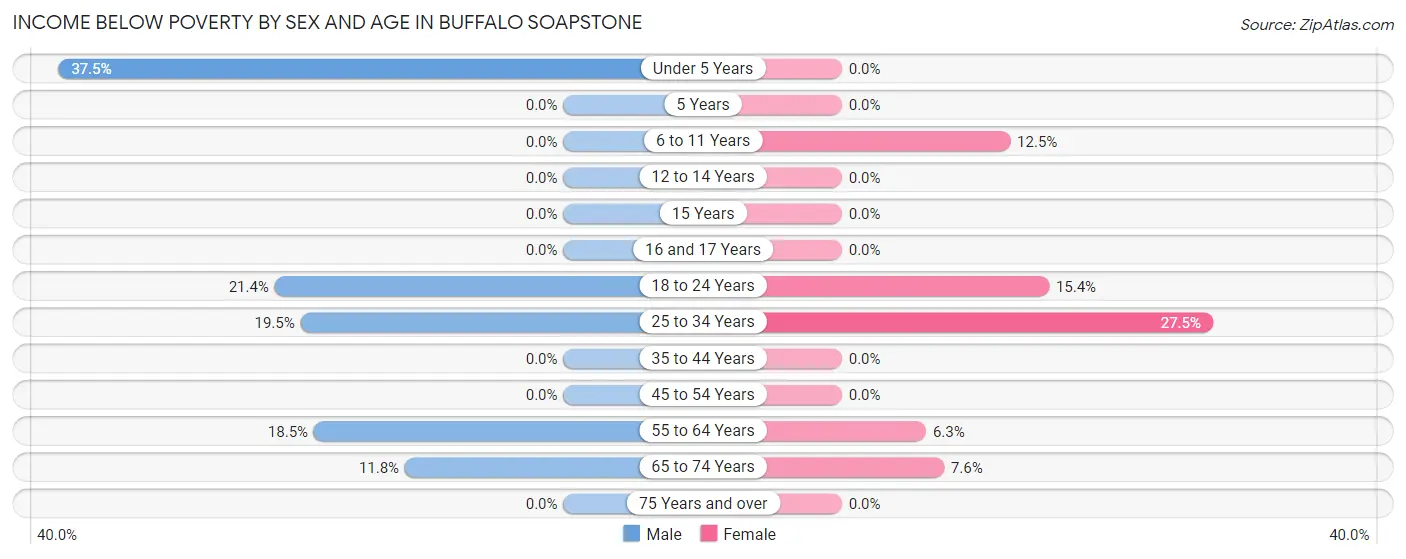
| Age Bracket | Male | Female |
| Under 5 Years | 9 (37.5%) | 0 (0.0%) |
| 5 Years | 0 (0.0%) | 0 (0.0%) |
| 6 to 11 Years | 0 (0.0%) | 6 (12.5%) |
| 12 to 14 Years | 0 (0.0%) | 0 (0.0%) |
| 15 Years | 0 (0.0%) | 0 (0.0%) |
| 16 and 17 Years | 0 (0.0%) | 0 (0.0%) |
| 18 to 24 Years | 6 (21.4%) | 4 (15.4%) |
| 25 to 34 Years | 8 (19.5%) | 19 (27.5%) |
| 35 to 44 Years | 0 (0.0%) | 0 (0.0%) |
| 45 to 54 Years | 0 (0.0%) | 0 (0.0%) |
| 55 to 64 Years | 15 (18.5%) | 4 (6.2%) |
| 65 to 74 Years | 8 (11.8%) | 5 (7.6%) |
| 75 Years and over | 0 (0.0%) | 0 (0.0%) |
| Total | 46 (9.2%) | 38 (8.4%) |
Income Above Poverty by Sex and Age in Buffalo Soapstone
According to the poverty statistics in Buffalo Soapstone, males aged 5 years and females aged under 5 years are the age groups that are most secure financially, with 100.0% of males and 100.0% of females in these age groups living above the poverty line.
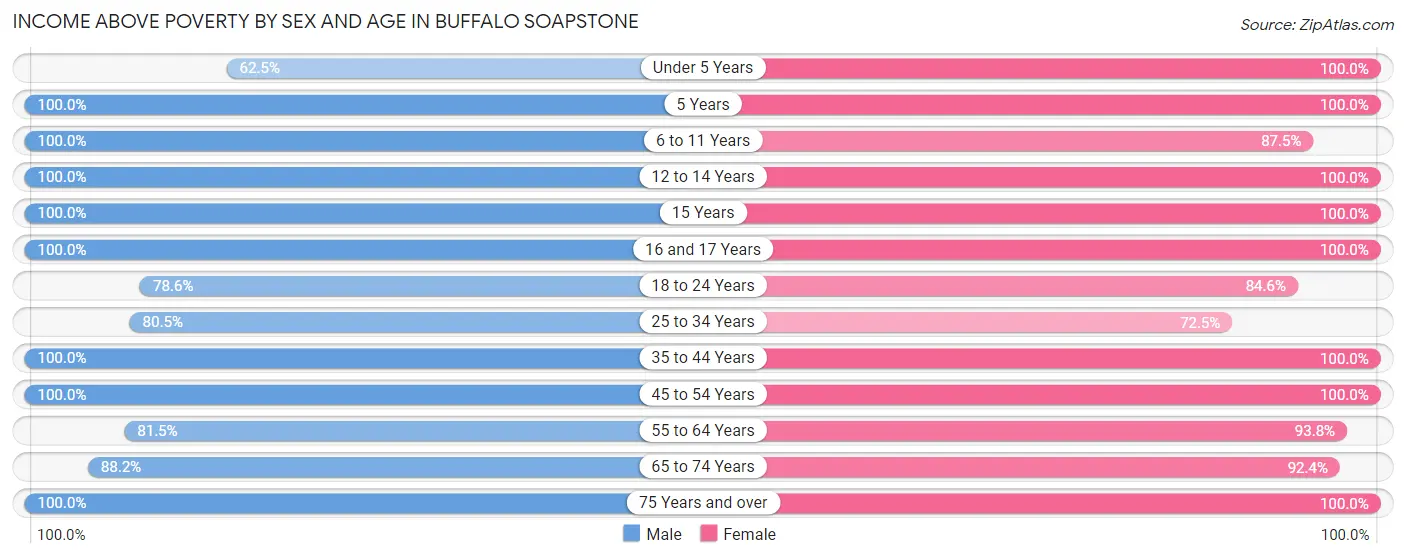
| Age Bracket | Male | Female |
| Under 5 Years | 15 (62.5%) | 5 (100.0%) |
| 5 Years | 12 (100.0%) | 11 (100.0%) |
| 6 to 11 Years | 36 (100.0%) | 42 (87.5%) |
| 12 to 14 Years | 18 (100.0%) | 19 (100.0%) |
| 15 Years | 25 (100.0%) | 3 (100.0%) |
| 16 and 17 Years | 23 (100.0%) | 16 (100.0%) |
| 18 to 24 Years | 22 (78.6%) | 22 (84.6%) |
| 25 to 34 Years | 33 (80.5%) | 50 (72.5%) |
| 35 to 44 Years | 64 (100.0%) | 64 (100.0%) |
| 45 to 54 Years | 64 (100.0%) | 42 (100.0%) |
| 55 to 64 Years | 66 (81.5%) | 60 (93.8%) |
| 65 to 74 Years | 60 (88.2%) | 61 (92.4%) |
| 75 Years and over | 15 (100.0%) | 18 (100.0%) |
| Total | 453 (90.8%) | 413 (91.6%) |
Income Below Poverty Among Married-Couple Families in Buffalo Soapstone
The poverty statistics for married-couple families in Buffalo Soapstone show that 8.1% or 19 of the total 235 families live below the poverty line. Families with 1 or 2 children have the highest poverty rate of 19.6%, comprising of 10 families. On the other hand, families with 3 or 4 children have the lowest poverty rate of 0.0%, which includes 0 families.
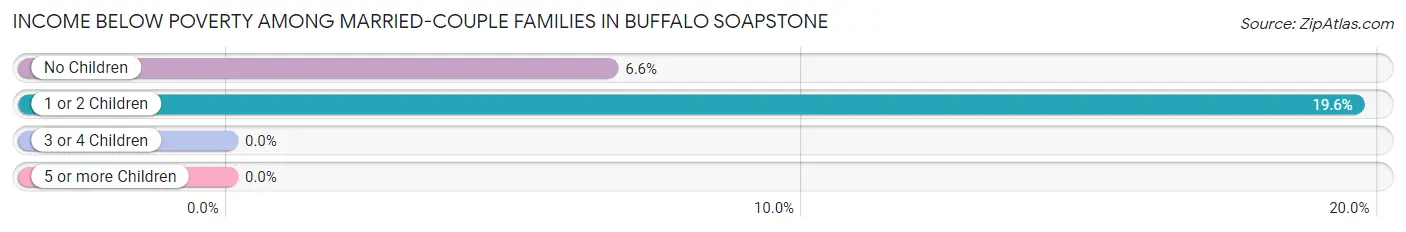
| Children | Above Poverty | Below Poverty |
| No Children | 127 (93.4%) | 9 (6.6%) |
| 1 or 2 Children | 41 (80.4%) | 10 (19.6%) |
| 3 or 4 Children | 48 (100.0%) | 0 (0.0%) |
| 5 or more Children | 0 (0.0%) | 0 (0.0%) |
| Total | 216 (91.9%) | 19 (8.1%) |
Income Below Poverty Among Single-Parent Households in Buffalo Soapstone
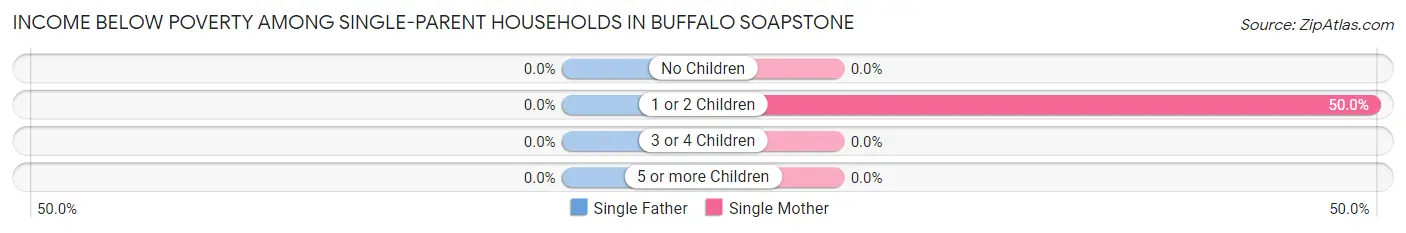
| Children | Single Father | Single Mother |
| No Children | 0 (0.0%) | 0 (0.0%) |
| 1 or 2 Children | 0 (0.0%) | 5 (50.0%) |
| 3 or 4 Children | 0 (0.0%) | 0 (0.0%) |
| 5 or more Children | 0 (0.0%) | 0 (0.0%) |
| Total | 0 (0.0%) | 5 (19.2%) |
Income Below Poverty Among Married-Couple vs Single-Parent Households in Buffalo Soapstone
The poverty data for Buffalo Soapstone shows that 19 of the married-couple family households (8.1%) and 5 of the single-parent households (16.1%) are living below the poverty level. Within the married-couple family households, those with 1 or 2 children have the highest poverty rate, with 10 households (19.6%) falling below the poverty line. Among the single-parent households, those with 1 or 2 children have the highest poverty rate, with 5 household (50.0%) living below poverty.
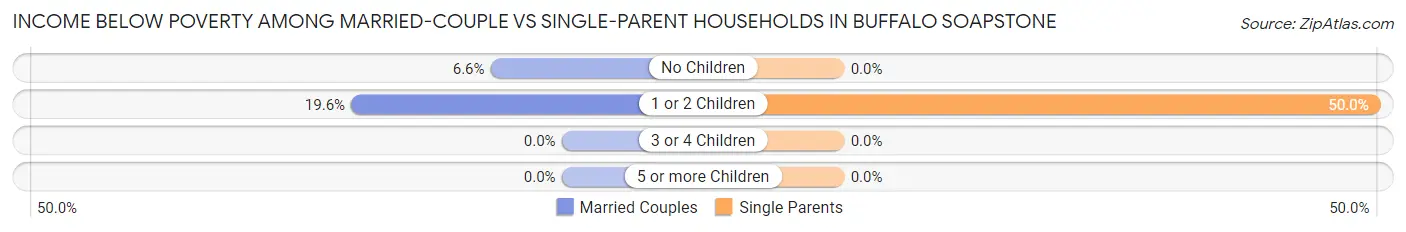
| Children | Married-Couple Families | Single-Parent Households |
| No Children | 9 (6.6%) | 0 (0.0%) |
| 1 or 2 Children | 10 (19.6%) | 5 (50.0%) |
| 3 or 4 Children | 0 (0.0%) | 0 (0.0%) |
| 5 or more Children | 0 (0.0%) | 0 (0.0%) |
| Total | 19 (8.1%) | 5 (16.1%) |
Race in Buffalo Soapstone
The most populous races in Buffalo Soapstone are White / Caucasian (756 | 78.8%), Two or more Races (158 | 16.5%), and Hispanic or Latino (63 | 6.6%).
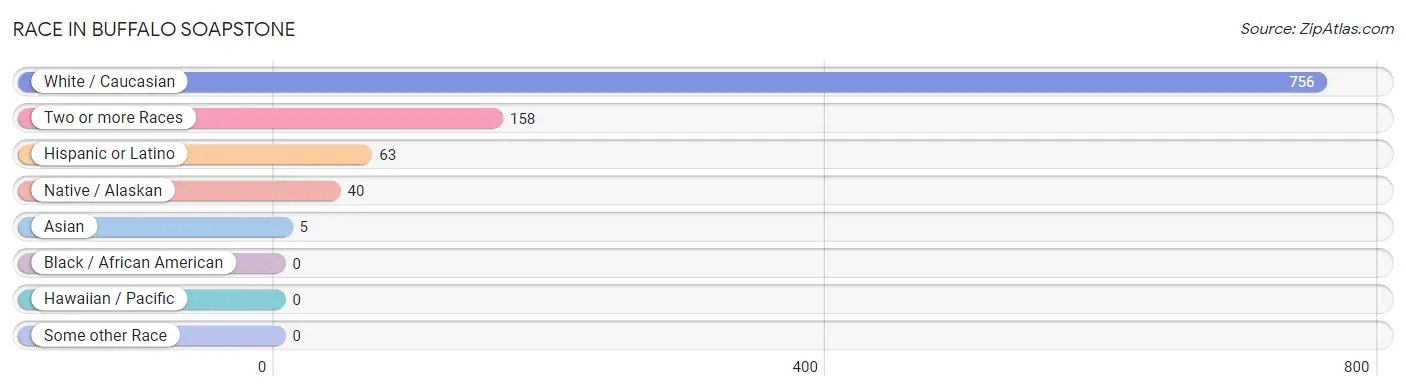
| Race | # Population | % Population |
| Asian | 5 | 0.5% |
| Black / African American | 0 | 0.0% |
| Hawaiian / Pacific | 0 | 0.0% |
| Hispanic or Latino | 63 | 6.6% |
| Native / Alaskan | 40 | 4.2% |
| White / Caucasian | 756 | 78.8% |
| Two or more Races | 158 | 16.5% |
| Some other Race | 0 | 0.0% |
| Total | 959 | 100.0% |
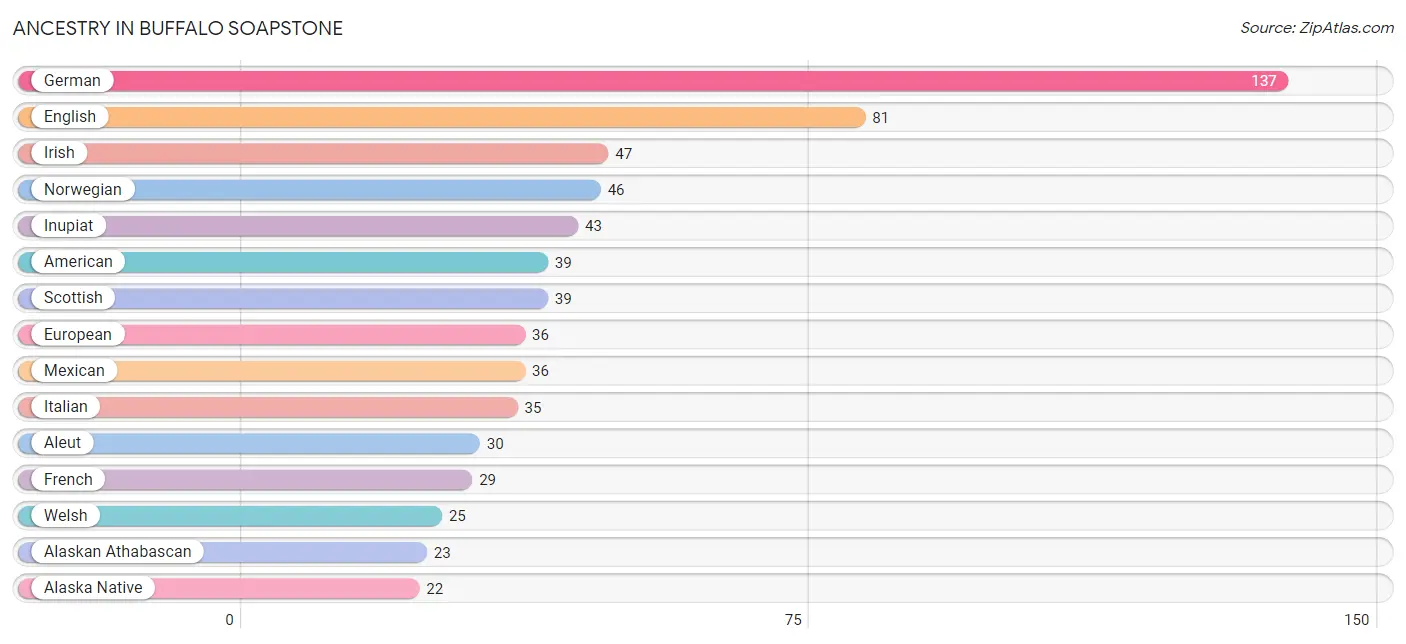
Ancestry in Buffalo Soapstone
The most populous ancestries reported in Buffalo Soapstone are German (137 | 14.3%), English (81 | 8.5%), Irish (47 | 4.9%), Norwegian (46 | 4.8%), and Inupiat (43 | 4.5%), together accounting for 36.9% of all Buffalo Soapstone residents.
| Ancestry | # Population | % Population |
| Alaska Native | 22 | 2.3% |
| Alaskan Athabascan | 23 | 2.4% |
| Aleut | 30 | 3.1% |
| American | 39 | 4.1% |
| British | 12 | 1.3% |
| Canadian | 8 | 0.8% |
| Central American | 1 | 0.1% |
| Central American Indian | 1 | 0.1% |
| Cherokee | 7 | 0.7% |
| Cuban | 8 | 0.8% |
| Danish | 18 | 1.9% |
| Dutch | 21 | 2.2% |
| Eastern European | 7 | 0.7% |
| English | 81 | 8.5% |
| European | 36 | 3.7% |
| French | 29 | 3.0% |
| French Canadian | 17 | 1.8% |
| German | 137 | 14.3% |
| Greek | 7 | 0.7% |
| Guatemalan | 1 | 0.1% |
| Inupiat | 43 | 4.5% |
| Irish | 47 | 4.9% |
| Italian | 35 | 3.6% |
| Korean | 5 | 0.5% |
| Lithuanian | 4 | 0.4% |
| Mexican | 36 | 3.7% |
| Native Hawaiian | 3 | 0.3% |
| Navajo | 2 | 0.2% |
| Northern European | 3 | 0.3% |
| Norwegian | 46 | 4.8% |
| Osage | 14 | 1.5% |
| Polish | 19 | 2.0% |
| Portuguese | 10 | 1.0% |
| Romanian | 5 | 0.5% |
| Russian | 5 | 0.5% |
| Scandinavian | 7 | 0.7% |
| Scotch-Irish | 8 | 0.8% |
| Scottish | 39 | 4.1% |
| Spaniard | 7 | 0.7% |
| Spanish | 11 | 1.1% |
| Swedish | 20 | 2.1% |
| Ukrainian | 22 | 2.3% |
| Welsh | 25 | 2.6% |
| Yup'ik | 6 | 0.6% | View All 44 Rows |
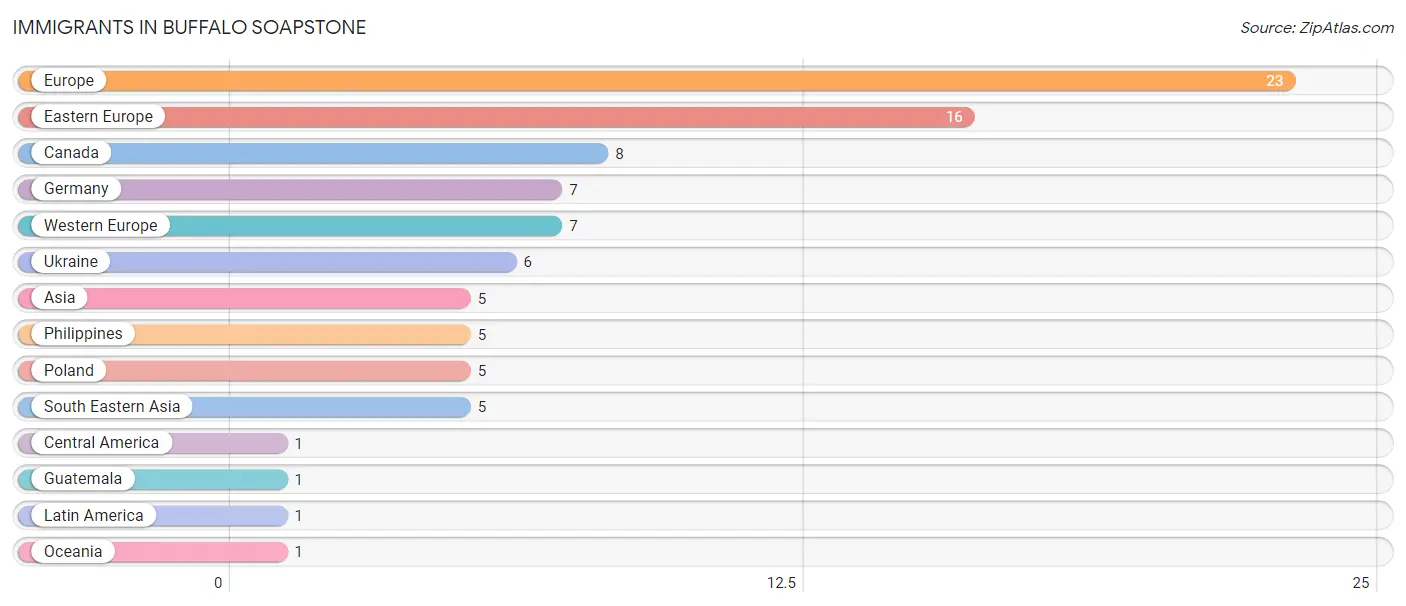
Immigrants in Buffalo Soapstone
The most numerous immigrant groups reported in Buffalo Soapstone came from Europe (23 | 2.4%), Eastern Europe (16 | 1.7%), Canada (8 | 0.8%), Germany (7 | 0.7%), and Western Europe (7 | 0.7%), together accounting for 6.4% of all Buffalo Soapstone residents.
| Immigration Origin | # Population | % Population |
| Asia | 5 | 0.5% |
| Canada | 8 | 0.8% |
| Central America | 1 | 0.1% |
| Eastern Europe | 16 | 1.7% |
| Europe | 23 | 2.4% |
| Germany | 7 | 0.7% |
| Guatemala | 1 | 0.1% |
| Latin America | 1 | 0.1% |
| Oceania | 1 | 0.1% |
| Philippines | 5 | 0.5% |
| Poland | 5 | 0.5% |
| South Eastern Asia | 5 | 0.5% |
| Ukraine | 6 | 0.6% |
| Western Europe | 7 | 0.7% | View All 14 Rows |
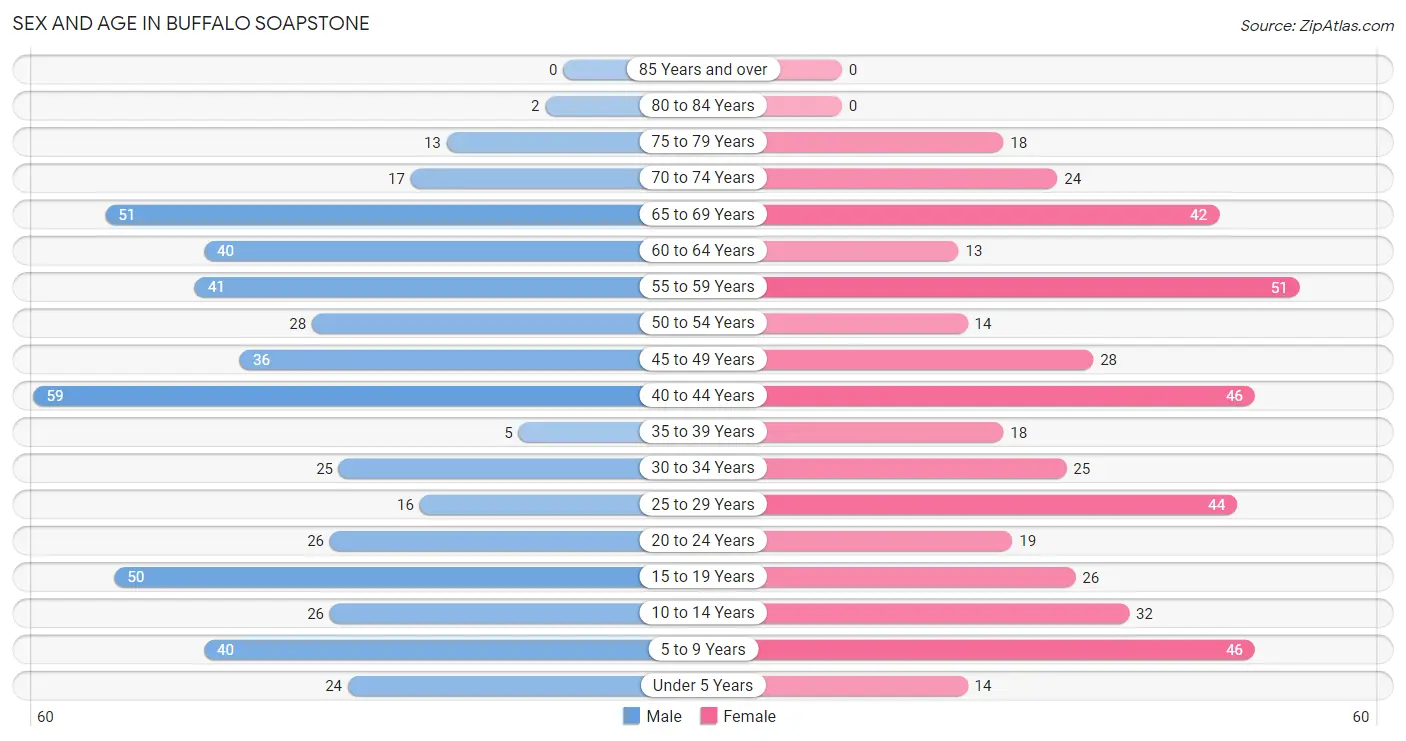
Sex and Age in Buffalo Soapstone
Sex and Age in Buffalo Soapstone
The most populous age groups in Buffalo Soapstone are 40 to 44 Years (59 | 11.8%) for men and 55 to 59 Years (51 | 11.1%) for women.
| Age Bracket | Male | Female |
| Under 5 Years | 24 (4.8%) | 14 (3.0%) |
| 5 to 9 Years | 40 (8.0%) | 46 (10.0%) |
| 10 to 14 Years | 26 (5.2%) | 32 (7.0%) |
| 15 to 19 Years | 50 (10.0%) | 26 (5.7%) |
| 20 to 24 Years | 26 (5.2%) | 19 (4.1%) |
| 25 to 29 Years | 16 (3.2%) | 44 (9.6%) |
| 30 to 34 Years | 25 (5.0%) | 25 (5.4%) |
| 35 to 39 Years | 5 (1.0%) | 18 (3.9%) |
| 40 to 44 Years | 59 (11.8%) | 46 (10.0%) |
| 45 to 49 Years | 36 (7.2%) | 28 (6.1%) |
| 50 to 54 Years | 28 (5.6%) | 14 (3.0%) |
| 55 to 59 Years | 41 (8.2%) | 51 (11.1%) |
| 60 to 64 Years | 40 (8.0%) | 13 (2.8%) |
| 65 to 69 Years | 51 (10.2%) | 42 (9.1%) |
| 70 to 74 Years | 17 (3.4%) | 24 (5.2%) |
| 75 to 79 Years | 13 (2.6%) | 18 (3.9%) |
| 80 to 84 Years | 2 (0.4%) | 0 (0.0%) |
| 85 Years and over | 0 (0.0%) | 0 (0.0%) |
| Total | 499 (100.0%) | 460 (100.0%) |
Families and Households in Buffalo Soapstone
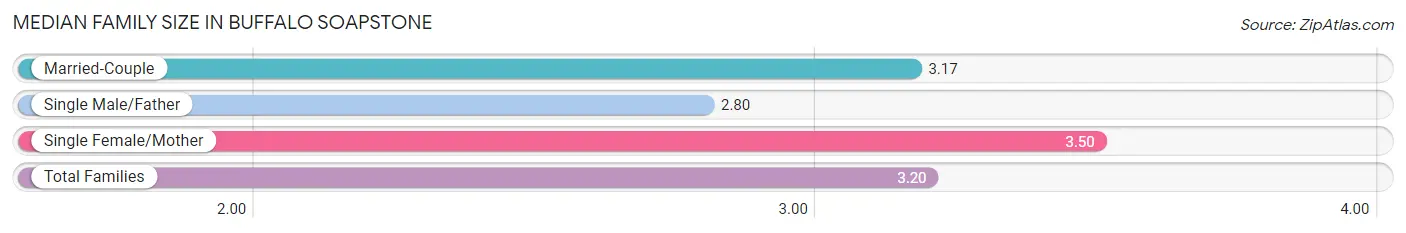
Median Family Size in Buffalo Soapstone
The median family size in Buffalo Soapstone is 3.20 persons per family, with single female/mother families (26 | 9.8%) accounting for the largest median family size of 3.5 persons per family. On the other hand, single male/father families (5 | 1.9%) represent the smallest median family size with 2.80 persons per family.
| Family Type | # Families | Family Size |
| Married-Couple | 235 (88.3%) | 3.17 |
| Single Male/Father | 5 (1.9%) | 2.80 |
| Single Female/Mother | 26 (9.8%) | 3.50 |
| Total Families | 266 (100.0%) | 3.20 |
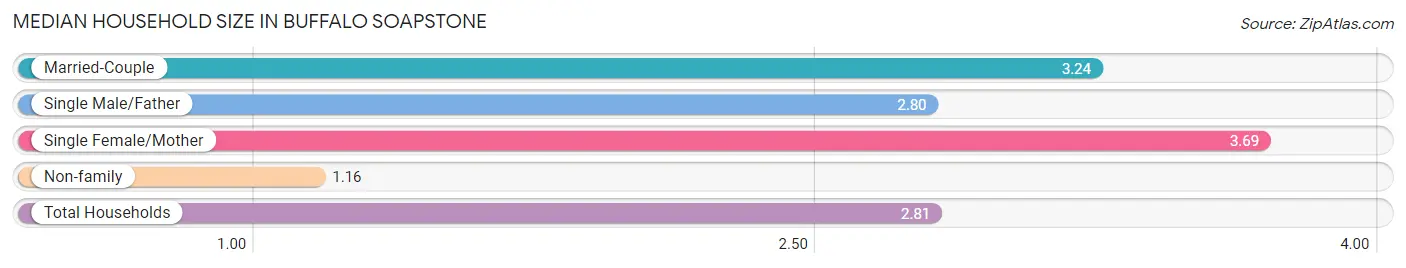
Median Household Size in Buffalo Soapstone
The median household size in Buffalo Soapstone is 2.81 persons per household, with single female/mother households (26 | 7.6%) accounting for the largest median household size of 3.69 persons per household. non-family households (75 | 22.0%) represent the smallest median household size with 1.16 persons per household.
| Household Type | # Households | Household Size |
| Married-Couple | 235 (68.9%) | 3.24 |
| Single Male/Father | 5 (1.5%) | 2.80 |
| Single Female/Mother | 26 (7.6%) | 3.69 |
| Non-family | 75 (22.0%) | 1.16 |
| Total Households | 341 (100.0%) | 2.81 |
Household Size by Marriage Status in Buffalo Soapstone
Out of a total of 341 households in Buffalo Soapstone, 266 (78.0%) are family households, while 75 (22.0%) are nonfamily households. The most numerous type of family households are 2-person households, comprising 141, and the most common type of nonfamily households are 1-person households, comprising 62.
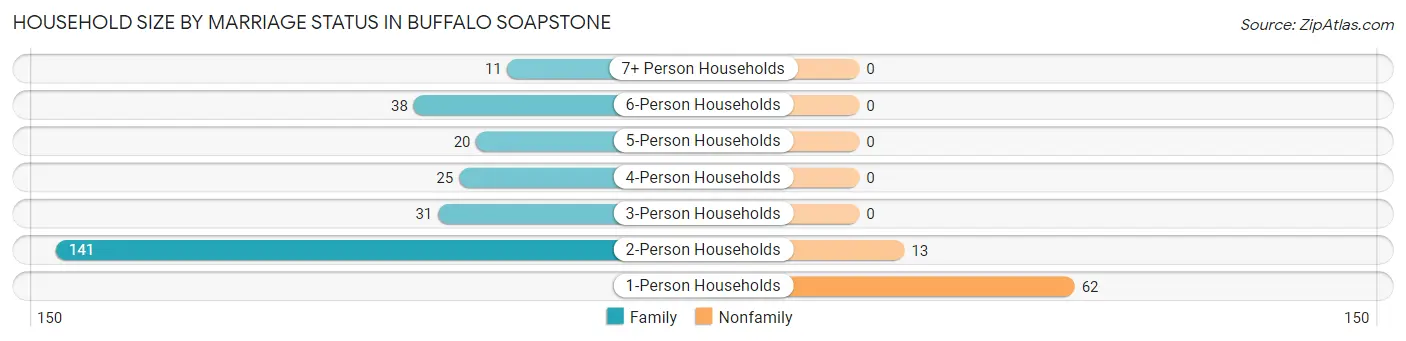
| Household Size | Family Households | Nonfamily Households |
| 1-Person Households | - | 62 (18.2%) |
| 2-Person Households | 141 (41.3%) | 13 (3.8%) |
| 3-Person Households | 31 (9.1%) | 0 (0.0%) |
| 4-Person Households | 25 (7.3%) | 0 (0.0%) |
| 5-Person Households | 20 (5.9%) | 0 (0.0%) |
| 6-Person Households | 38 (11.1%) | 0 (0.0%) |
| 7+ Person Households | 11 (3.2%) | 0 (0.0%) |
| Total | 266 (78.0%) | 75 (22.0%) |
Female Fertility in Buffalo Soapstone
Fertility by Age in Buffalo Soapstone
Average fertility rate in Buffalo Soapstone is 151.0 births per 1,000 women. Women in the age bracket of 35 to 50 years have the highest fertility rate with 214.0 births per 1,000 women. Women in the age bracket of 35 to 50 years acount for 65.6% of all women with births.
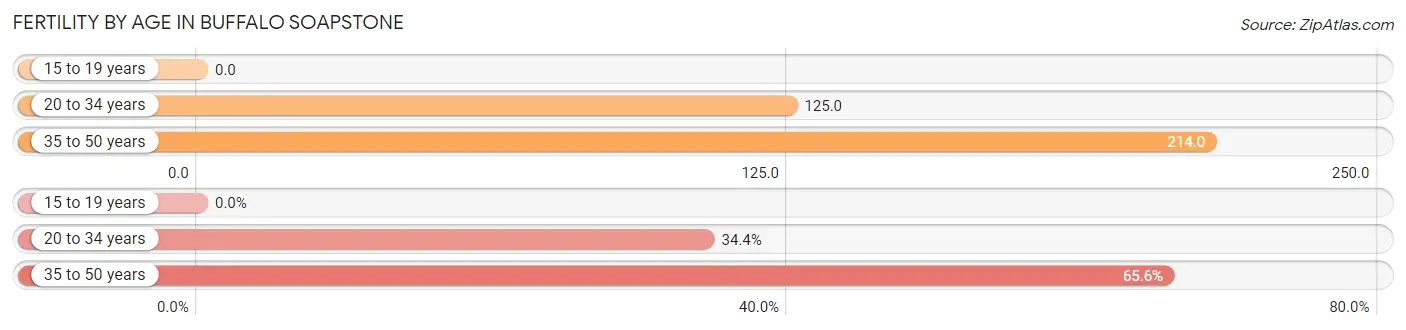
| Age Bracket | Women with Births | Births / 1,000 Women |
| 15 to 19 years | 0 (0.0%) | 0.0 |
| 20 to 34 years | 11 (34.4%) | 125.0 |
| 35 to 50 years | 21 (65.6%) | 214.0 |
| Total | 32 (100.0%) | 151.0 |
Fertility by Age by Marriage Status in Buffalo Soapstone
78.1% of women with births (32) in Buffalo Soapstone are married. The highest percentage of unmarried women with births falls into 35 to 50 years age bracket with 33.3% of them unmarried at the time of birth, while the lowest percentage of unmarried women with births belong to 20 to 34 years age bracket with 0.0% of them unmarried.
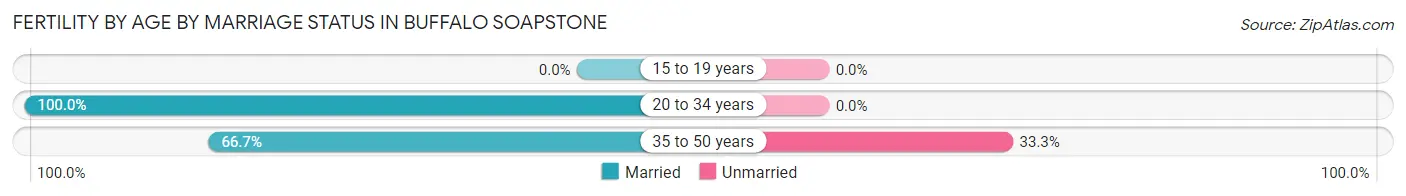
| Age Bracket | Married | Unmarried |
| 15 to 19 years | 0 (0.0%) | 0 (0.0%) |
| 20 to 34 years | 11 (100.0%) | 0 (0.0%) |
| 35 to 50 years | 14 (66.7%) | 7 (33.3%) |
| Total | 25 (78.1%) | 7 (21.9%) |
Fertility by Education in Buffalo Soapstone
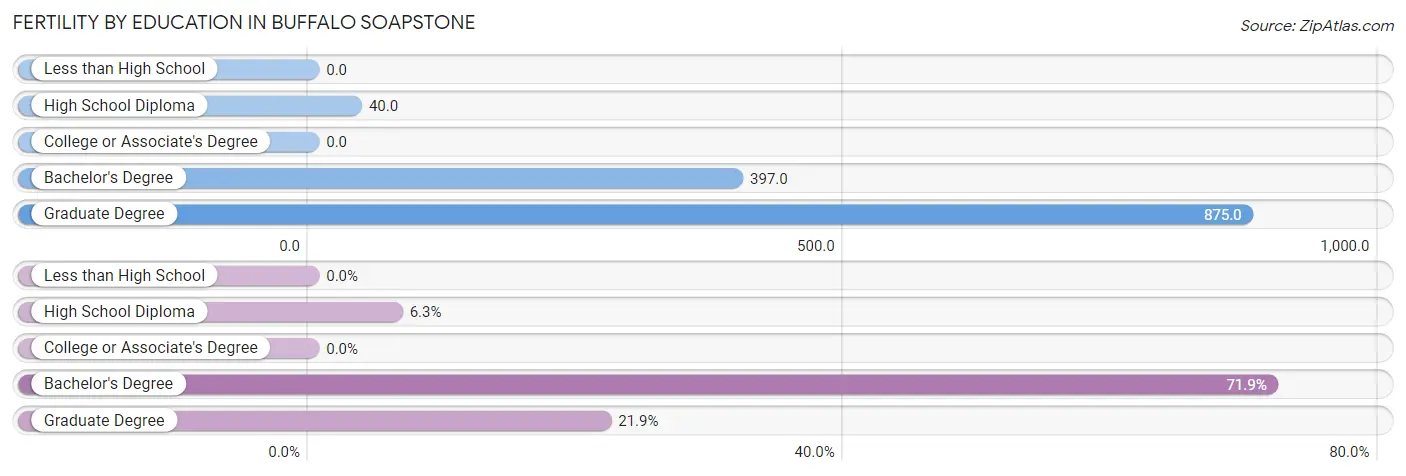
| Educational Attainment | Women with Births | Births / 1,000 Women |
| Less than High School | 0 (0.0%) | 0.0 |
| High School Diploma | 2 (6.2%) | 40.0 |
| College or Associate's Degree | 0 (0.0%) | 0.0 |
| Bachelor's Degree | 23 (71.9%) | 397.0 |
| Graduate Degree | 7 (21.9%) | 875.0 |
| Total | 32 (100.0%) | 151.0 |
Fertility by Education by Marriage Status in Buffalo Soapstone
21.9% of women with births in Buffalo Soapstone are unmarried. Women with the educational attainment of high school diploma are most likely to be married with 100.0% of them married at childbirth, while women with the educational attainment of graduate degree are least likely to be married with 100.0% of them unmarried at childbirth.
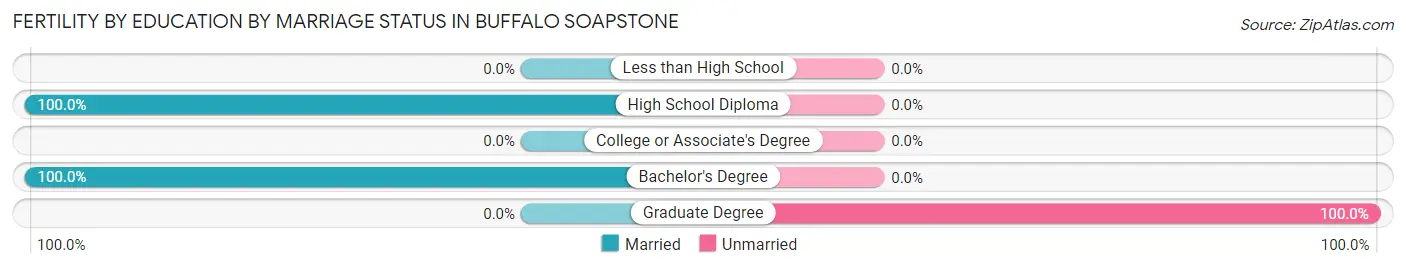
| Educational Attainment | Married | Unmarried |
| Less than High School | 0 (0.0%) | 0 (0.0%) |
| High School Diploma | 2 (100.0%) | 0 (0.0%) |
| College or Associate's Degree | 0 (0.0%) | 0 (0.0%) |
| Bachelor's Degree | 23 (100.0%) | 0 (0.0%) |
| Graduate Degree | 0 (0.0%) | 7 (100.0%) |
| Total | 25 (78.1%) | 7 (21.9%) |
Employment Characteristics in Buffalo Soapstone
Employment by Class of Employer in Buffalo Soapstone
Among the 356 employed individuals in Buffalo Soapstone, private company employees (181 | 50.8%), not-for-profit organizations (59 | 16.6%), and state government employees (35 | 9.8%) make up the most common classes of employment.
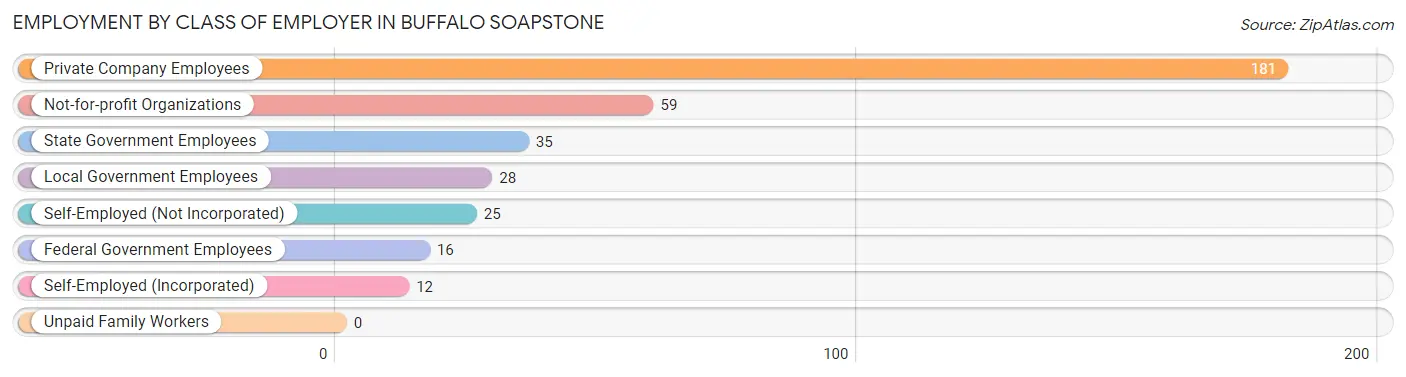
| Employer Class | # Employees | % Employees |
| Private Company Employees | 181 | 50.8% |
| Self-Employed (Incorporated) | 12 | 3.4% |
| Self-Employed (Not Incorporated) | 25 | 7.0% |
| Not-for-profit Organizations | 59 | 16.6% |
| Local Government Employees | 28 | 7.9% |
| State Government Employees | 35 | 9.8% |
| Federal Government Employees | 16 | 4.5% |
| Unpaid Family Workers | 0 | 0.0% |
| Total | 356 | 100.0% |
Employment Status by Age in Buffalo Soapstone
According to the labor force statistics for Buffalo Soapstone, out of the total population over 16 years of age (749), 56.5% or 423 individuals are in the labor force, with 13.7% or 58 of them unemployed. The age group with the highest labor force participation rate is 35 to 44 years, with 82.8% or 106 individuals in the labor force. Within the labor force, the 20 to 24 years age range has the highest percentage of unemployed individuals, with 43.3% or 13 of them being unemployed.
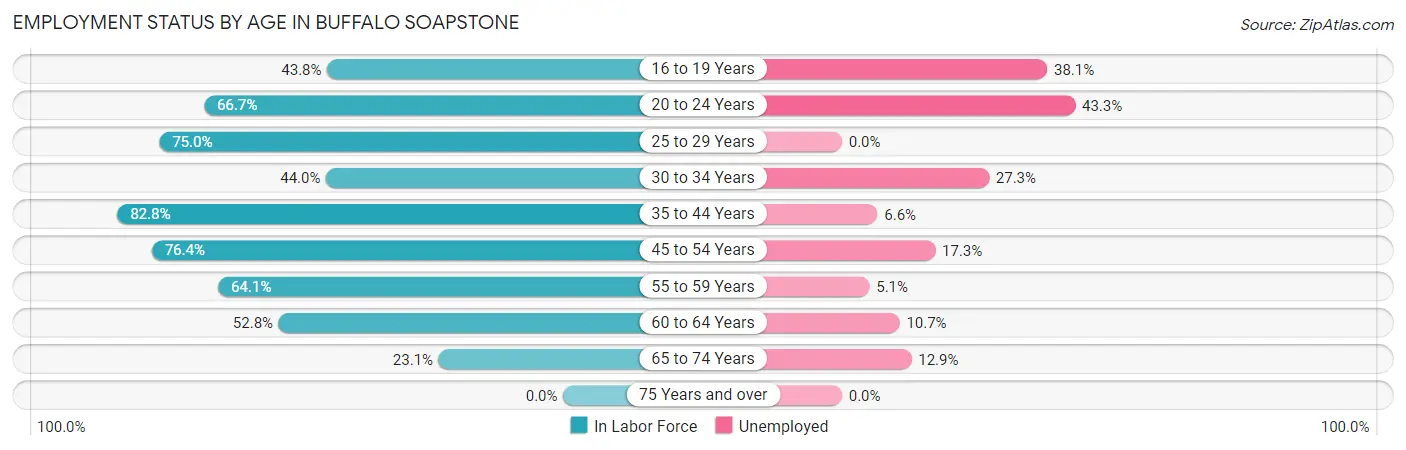
| Age Bracket | In Labor Force | Unemployed |
| 16 to 19 Years | 21 (43.8%) | 8 (38.1%) |
| 20 to 24 Years | 30 (66.7%) | 13 (43.3%) |
| 25 to 29 Years | 45 (75.0%) | 0 (0.0%) |
| 30 to 34 Years | 22 (44.0%) | 6 (27.3%) |
| 35 to 44 Years | 106 (82.8%) | 7 (6.6%) |
| 45 to 54 Years | 81 (76.4%) | 14 (17.3%) |
| 55 to 59 Years | 59 (64.1%) | 3 (5.1%) |
| 60 to 64 Years | 28 (52.8%) | 3 (10.7%) |
| 65 to 74 Years | 31 (23.1%) | 4 (12.9%) |
| 75 Years and over | 0 (0.0%) | 0 (0.0%) |
| Total | 423 (56.5%) | 58 (13.7%) |
Employment Status by Educational Attainment in Buffalo Soapstone
According to labor force statistics for Buffalo Soapstone, 69.7% of individuals (341) out of the total population between 25 and 64 years of age (489) are in the labor force, with 9.7% or 33 of them being unemployed. The group with the highest labor force participation rate are those with the educational attainment of bachelor's degree or higher, with 82.0% or 123 individuals in the labor force. Within the labor force, individuals with high school diploma education have the highest percentage of unemployment, with 12.2% or 10 of them being unemployed.
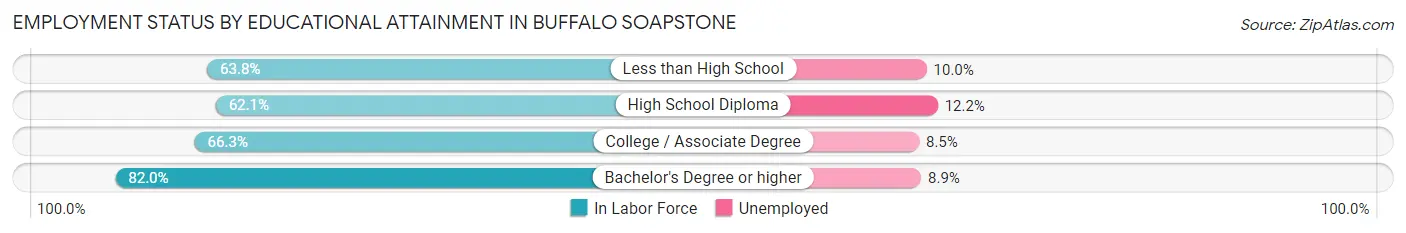
| Educational Attainment | In Labor Force | Unemployed |
| Less than High School | 30 (63.8%) | 5 (10.0%) |
| High School Diploma | 82 (62.1%) | 16 (12.2%) |
| College / Associate Degree | 106 (66.3%) | 14 (8.5%) |
| Bachelor's Degree or higher | 123 (82.0%) | 13 (8.9%) |
| Total | 341 (69.7%) | 47 (9.7%) |
Employment Occupations by Sex in Buffalo Soapstone
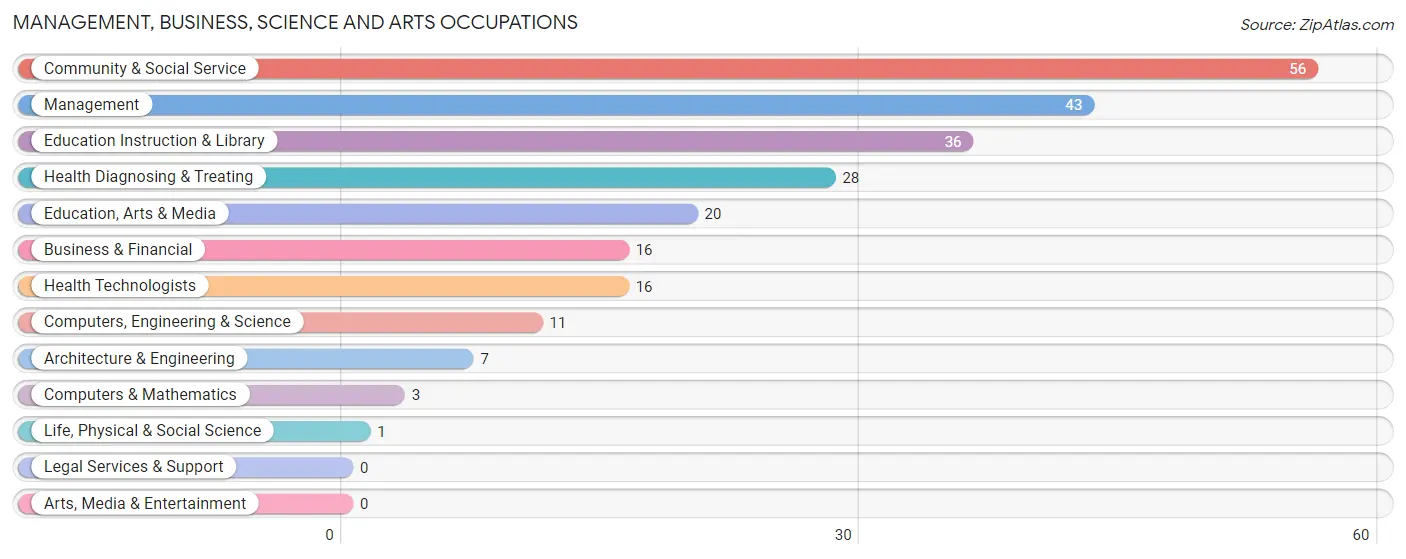
Management, Business, Science and Arts Occupations
The most common Management, Business, Science and Arts occupations in Buffalo Soapstone are Community & Social Service (56 | 15.3%), Management (43 | 11.8%), Education Instruction & Library (36 | 9.9%), Health Diagnosing & Treating (28 | 7.7%), and Education, Arts & Media (20 | 5.5%).
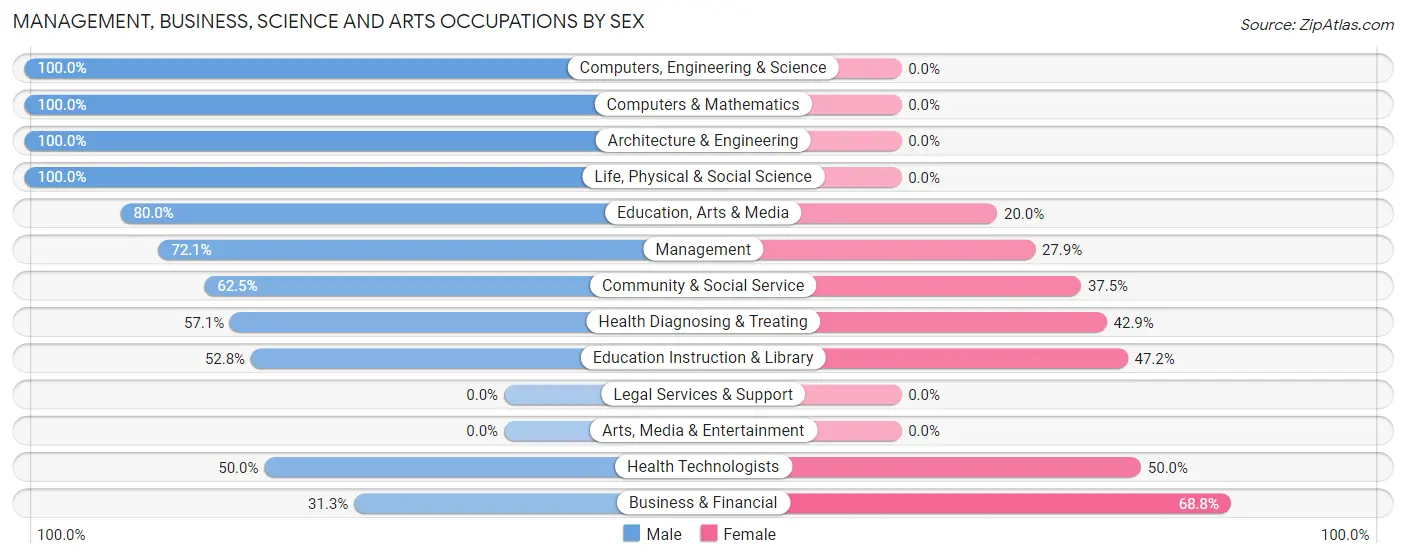
Management, Business, Science and Arts Occupations by Sex
Within the Management, Business, Science and Arts occupations in Buffalo Soapstone, the most male-oriented occupations are Computers, Engineering & Science (100.0%), Computers & Mathematics (100.0%), and Architecture & Engineering (100.0%), while the most female-oriented occupations are Business & Financial (68.8%), Health Technologists (50.0%), and Education Instruction & Library (47.2%).
| Occupation | Male | Female |
| Management | 31 (72.1%) | 12 (27.9%) |
| Business & Financial | 5 (31.2%) | 11 (68.8%) |
| Computers, Engineering & Science | 11 (100.0%) | 0 (0.0%) |
| Computers & Mathematics | 3 (100.0%) | 0 (0.0%) |
| Architecture & Engineering | 7 (100.0%) | 0 (0.0%) |
| Life, Physical & Social Science | 1 (100.0%) | 0 (0.0%) |
| Community & Social Service | 35 (62.5%) | 21 (37.5%) |
| Education, Arts & Media | 16 (80.0%) | 4 (20.0%) |
| Legal Services & Support | 0 (0.0%) | 0 (0.0%) |
| Education Instruction & Library | 19 (52.8%) | 17 (47.2%) |
| Arts, Media & Entertainment | 0 (0.0%) | 0 (0.0%) |
| Health Diagnosing & Treating | 16 (57.1%) | 12 (42.9%) |
| Health Technologists | 8 (50.0%) | 8 (50.0%) |
| Total (Category) | 98 (63.6%) | 56 (36.4%) |
| Total (Overall) | 202 (55.3%) | 163 (44.7%) |
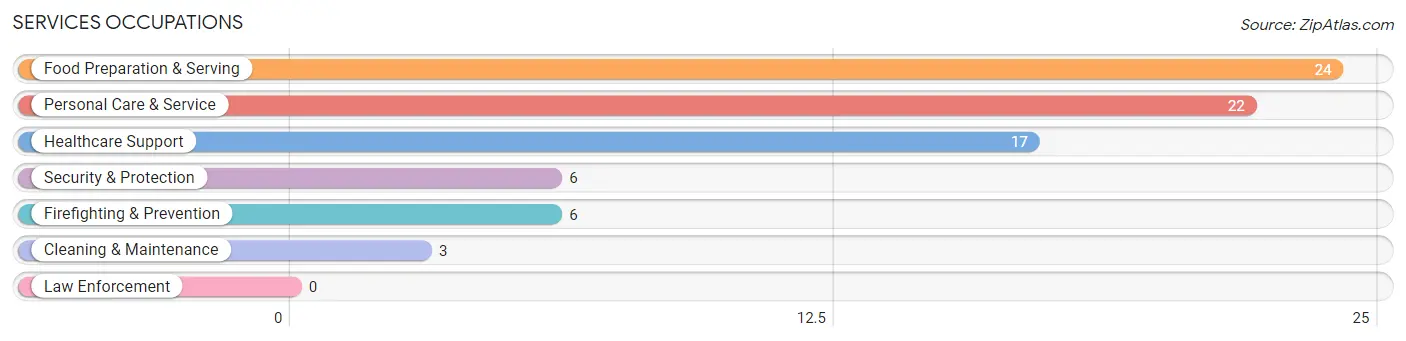
Services Occupations
The most common Services occupations in Buffalo Soapstone are Food Preparation & Serving (24 | 6.6%), Personal Care & Service (22 | 6.0%), Healthcare Support (17 | 4.7%), Security & Protection (6 | 1.6%), and Firefighting & Prevention (6 | 1.6%).
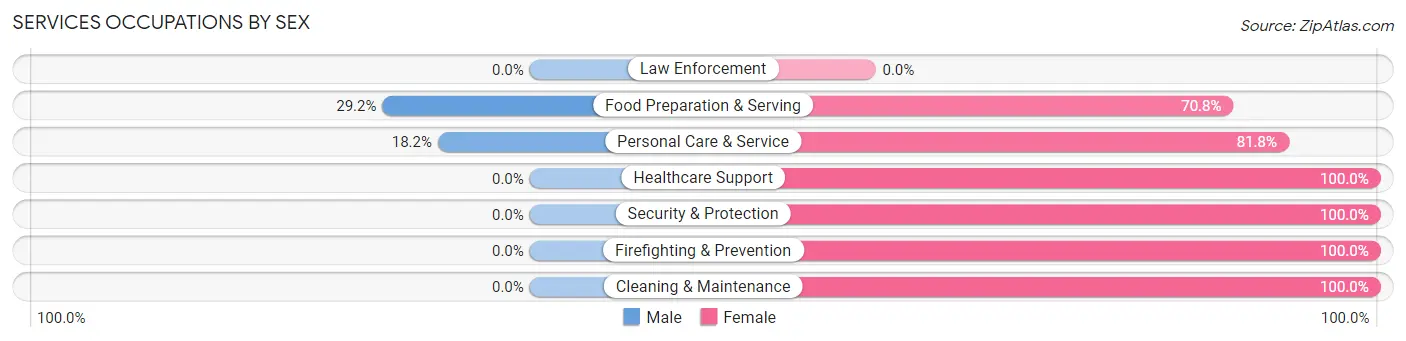
Services Occupations by Sex
Within the Services occupations in Buffalo Soapstone, the most male-oriented occupations are Food Preparation & Serving (29.2%), and Personal Care & Service (18.2%), while the most female-oriented occupations are Healthcare Support (100.0%), Security & Protection (100.0%), and Firefighting & Prevention (100.0%).
| Occupation | Male | Female |
| Healthcare Support | 0 (0.0%) | 17 (100.0%) |
| Security & Protection | 0 (0.0%) | 6 (100.0%) |
| Firefighting & Prevention | 0 (0.0%) | 6 (100.0%) |
| Law Enforcement | 0 (0.0%) | 0 (0.0%) |
| Food Preparation & Serving | 7 (29.2%) | 17 (70.8%) |
| Cleaning & Maintenance | 0 (0.0%) | 3 (100.0%) |
| Personal Care & Service | 4 (18.2%) | 18 (81.8%) |
| Total (Category) | 11 (15.3%) | 61 (84.7%) |
| Total (Overall) | 202 (55.3%) | 163 (44.7%) |
Sales and Office Occupations
The most common Sales and Office occupations in Buffalo Soapstone are Office & Administration (56 | 15.3%), and Sales & Related (16 | 4.4%).
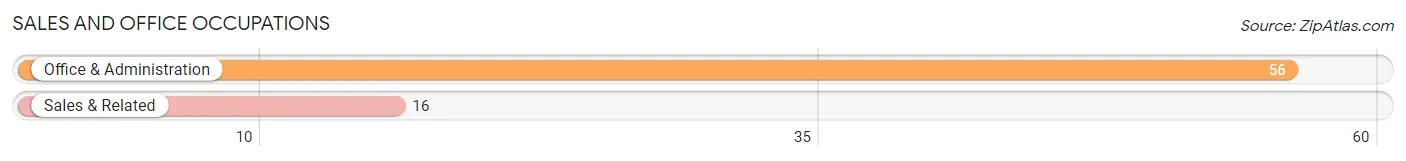
Sales and Office Occupations by Sex
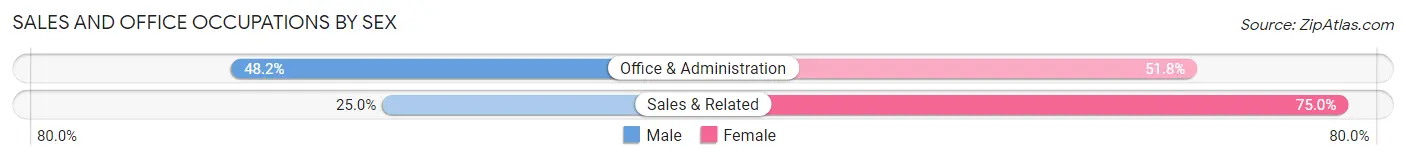
| Occupation | Male | Female |
| Sales & Related | 4 (25.0%) | 12 (75.0%) |
| Office & Administration | 27 (48.2%) | 29 (51.8%) |
| Total (Category) | 31 (43.1%) | 41 (56.9%) |
| Total (Overall) | 202 (55.3%) | 163 (44.7%) |
Natural Resources, Construction and Maintenance Occupations
The most common Natural Resources, Construction and Maintenance occupations in Buffalo Soapstone are Construction & Extraction (12 | 3.3%), and Installation, Maintenance & Repair (11 | 3.0%).
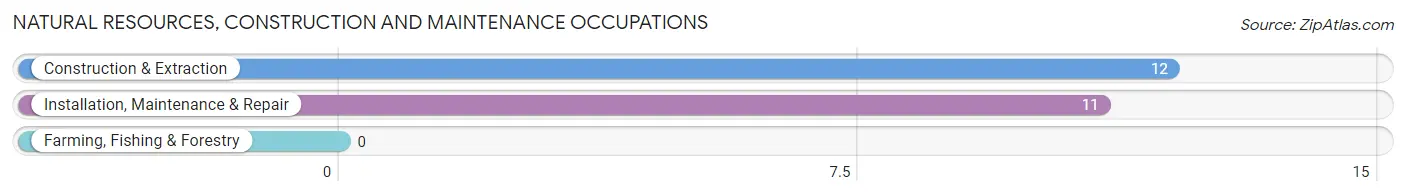
Natural Resources, Construction and Maintenance Occupations by Sex
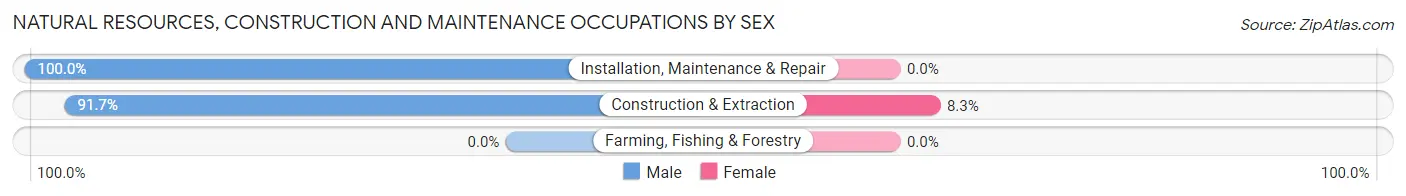
| Occupation | Male | Female |
| Farming, Fishing & Forestry | 0 (0.0%) | 0 (0.0%) |
| Construction & Extraction | 11 (91.7%) | 1 (8.3%) |
| Installation, Maintenance & Repair | 11 (100.0%) | 0 (0.0%) |
| Total (Category) | 22 (95.7%) | 1 (4.3%) |
| Total (Overall) | 202 (55.3%) | 163 (44.7%) |
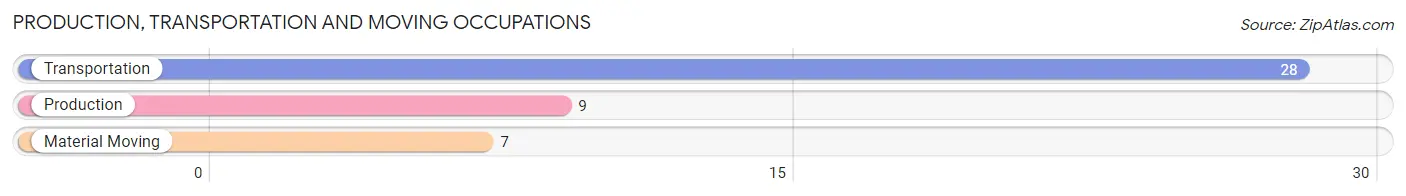
Production, Transportation and Moving Occupations
The most common Production, Transportation and Moving occupations in Buffalo Soapstone are Transportation (28 | 7.7%), Production (9 | 2.5%), and Material Moving (7 | 1.9%).
Production, Transportation and Moving Occupations by Sex
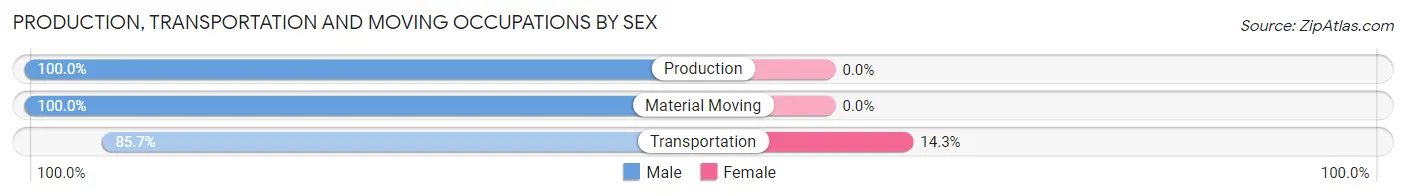
| Occupation | Male | Female |
| Production | 9 (100.0%) | 0 (0.0%) |
| Transportation | 24 (85.7%) | 4 (14.3%) |
| Material Moving | 7 (100.0%) | 0 (0.0%) |
| Total (Category) | 40 (90.9%) | 4 (9.1%) |
| Total (Overall) | 202 (55.3%) | 163 (44.7%) |
Employment Industries by Sex in Buffalo Soapstone
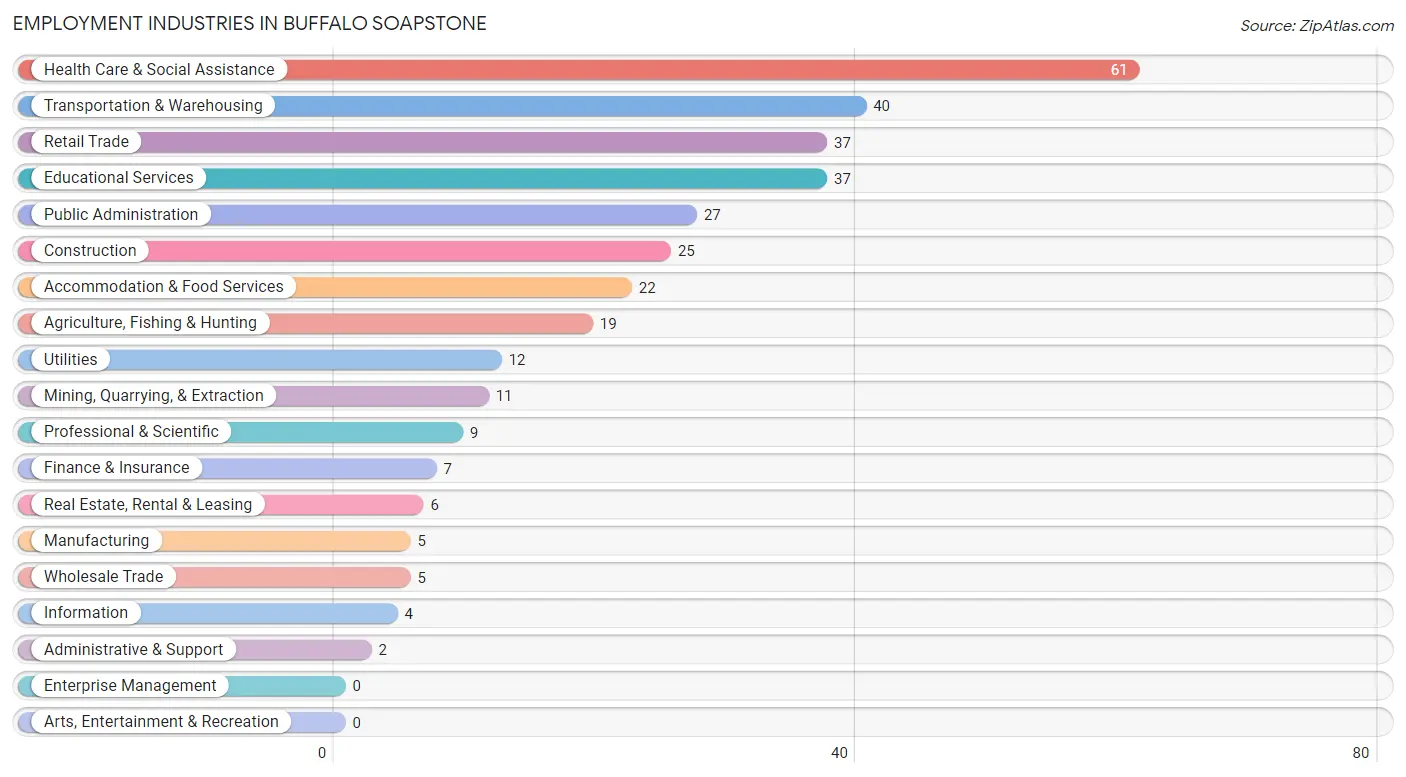
Employment Industries in Buffalo Soapstone
The major employment industries in Buffalo Soapstone include Health Care & Social Assistance (61 | 16.7%), Transportation & Warehousing (40 | 11.0%), Retail Trade (37 | 10.1%), Educational Services (37 | 10.1%), and Public Administration (27 | 7.4%).
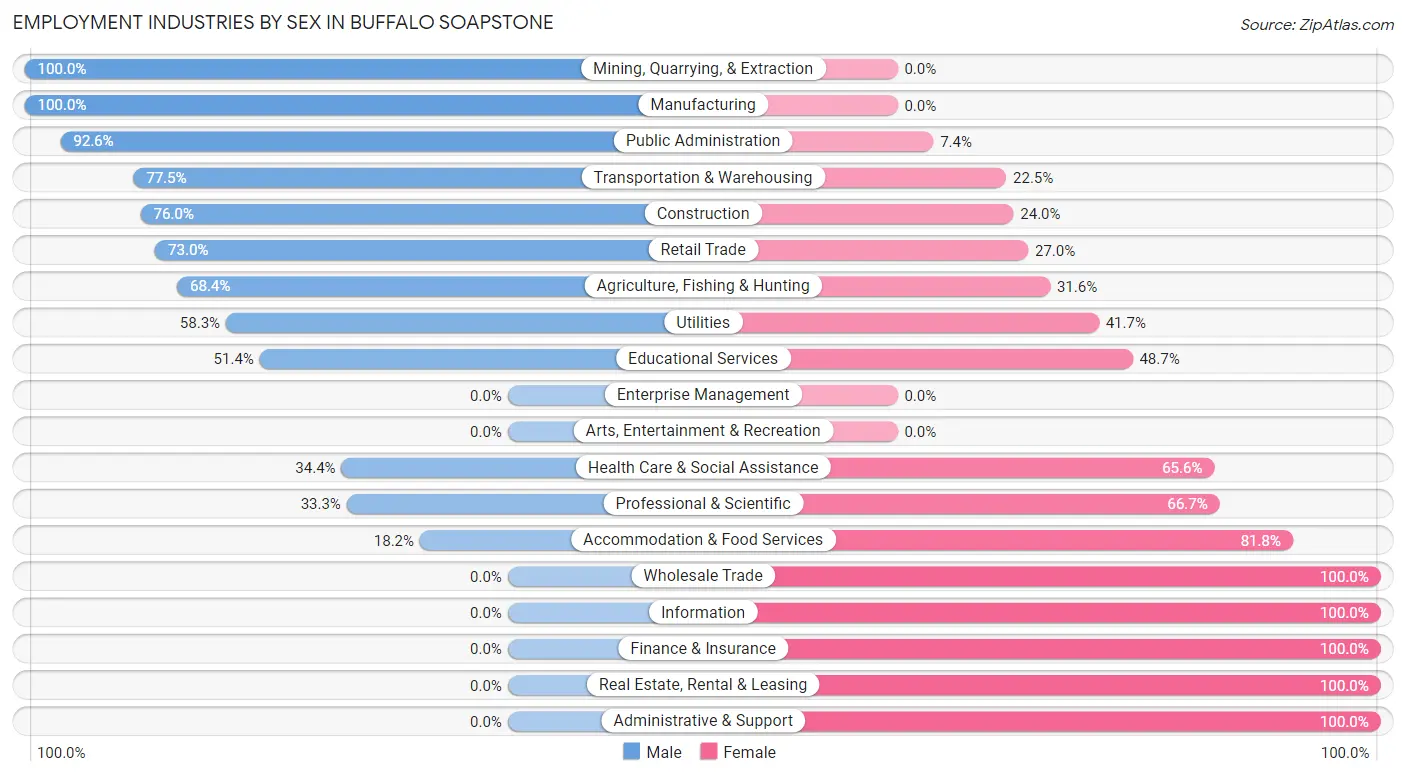
Employment Industries by Sex in Buffalo Soapstone
The Buffalo Soapstone industries that see more men than women are Mining, Quarrying, & Extraction (100.0%), Manufacturing (100.0%), and Public Administration (92.6%), whereas the industries that tend to have a higher number of women are Wholesale Trade (100.0%), Information (100.0%), and Finance & Insurance (100.0%).
| Industry | Male | Female |
| Agriculture, Fishing & Hunting | 13 (68.4%) | 6 (31.6%) |
| Mining, Quarrying, & Extraction | 11 (100.0%) | 0 (0.0%) |
| Construction | 19 (76.0%) | 6 (24.0%) |
| Manufacturing | 5 (100.0%) | 0 (0.0%) |
| Wholesale Trade | 0 (0.0%) | 5 (100.0%) |
| Retail Trade | 27 (73.0%) | 10 (27.0%) |
| Transportation & Warehousing | 31 (77.5%) | 9 (22.5%) |
| Utilities | 7 (58.3%) | 5 (41.7%) |
| Information | 0 (0.0%) | 4 (100.0%) |
| Finance & Insurance | 0 (0.0%) | 7 (100.0%) |
| Real Estate, Rental & Leasing | 0 (0.0%) | 6 (100.0%) |
| Professional & Scientific | 3 (33.3%) | 6 (66.7%) |
| Enterprise Management | 0 (0.0%) | 0 (0.0%) |
| Administrative & Support | 0 (0.0%) | 2 (100.0%) |
| Educational Services | 19 (51.3%) | 18 (48.6%) |
| Health Care & Social Assistance | 21 (34.4%) | 40 (65.6%) |
| Arts, Entertainment & Recreation | 0 (0.0%) | 0 (0.0%) |
| Accommodation & Food Services | 4 (18.2%) | 18 (81.8%) |
| Public Administration | 25 (92.6%) | 2 (7.4%) |
| Total | 202 (55.3%) | 163 (44.7%) |
Education in Buffalo Soapstone
School Enrollment in Buffalo Soapstone
The most common levels of schooling among the 250 students in Buffalo Soapstone are high school (65 | 26.0%), middle school (61 | 24.4%), and elementary school (59 | 23.6%).
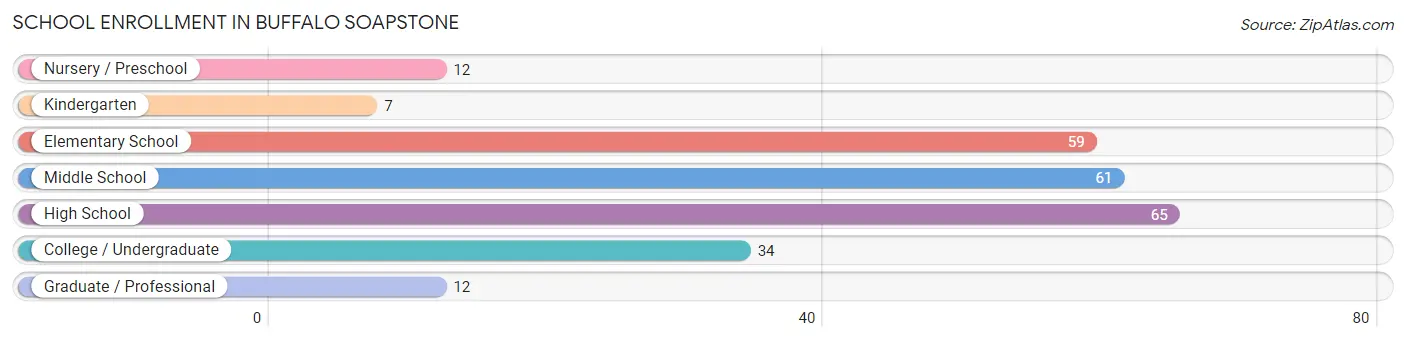
| School Level | # Students | % Students |
| Nursery / Preschool | 12 | 4.8% |
| Kindergarten | 7 | 2.8% |
| Elementary School | 59 | 23.6% |
| Middle School | 61 | 24.4% |
| High School | 65 | 26.0% |
| College / Undergraduate | 34 | 13.6% |
| Graduate / Professional | 12 | 4.8% |
| Total | 250 | 100.0% |
School Enrollment by Age by Funding Source in Buffalo Soapstone
Out of a total of 250 students who are enrolled in schools in Buffalo Soapstone, 108 (43.2%) attend a private institution, while the remaining 142 (56.8%) are enrolled in public schools. The age group of 35 years and over has the highest likelihood of being enrolled in private schools, with 16 (76.2% in the age bracket) enrolled. Conversely, the age group of 3 to 4 year olds has the lowest likelihood of being enrolled in a private school, with 5 (100.0% in the age bracket) attending a public institution.
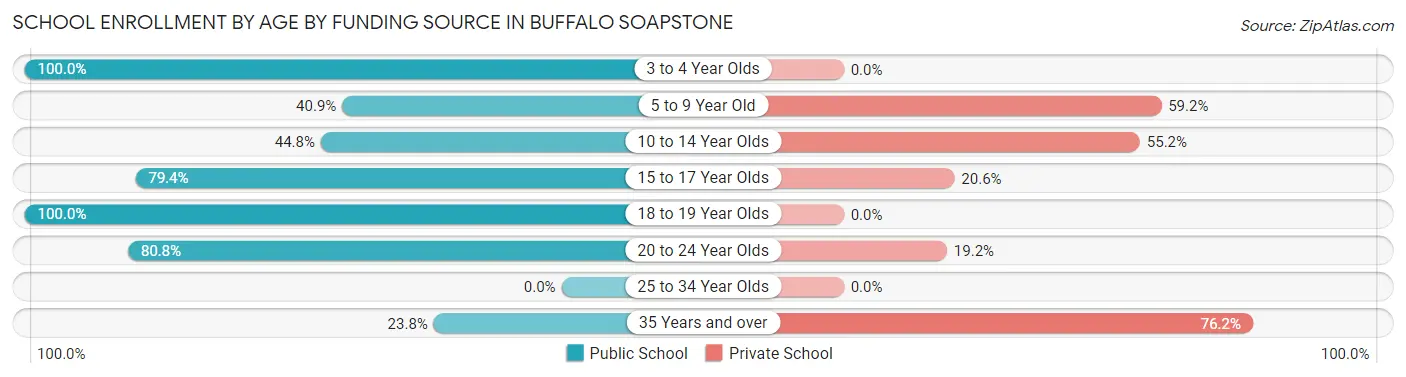
| Age Bracket | Public School | Private School |
| 3 to 4 Year Olds | 5 (100.0%) | 0 (0.0%) |
| 5 to 9 Year Old | 29 (40.8%) | 42 (59.2%) |
| 10 to 14 Year Olds | 26 (44.8%) | 32 (55.2%) |
| 15 to 17 Year Olds | 50 (79.4%) | 13 (20.6%) |
| 18 to 19 Year Olds | 6 (100.0%) | 0 (0.0%) |
| 20 to 24 Year Olds | 21 (80.8%) | 5 (19.2%) |
| 25 to 34 Year Olds | 0 (0.0%) | 0 (0.0%) |
| 35 Years and over | 5 (23.8%) | 16 (76.2%) |
| Total | 142 (56.8%) | 108 (43.2%) |
Educational Attainment by Field of Study in Buffalo Soapstone
Education (49 | 20.9%), arts & humanities (32 | 13.7%), bio, nature & agricultural (24 | 10.3%), psychology (23 | 9.8%), and business (22 | 9.4%) are the most common fields of study among 234 individuals in Buffalo Soapstone who have obtained a bachelor's degree or higher.
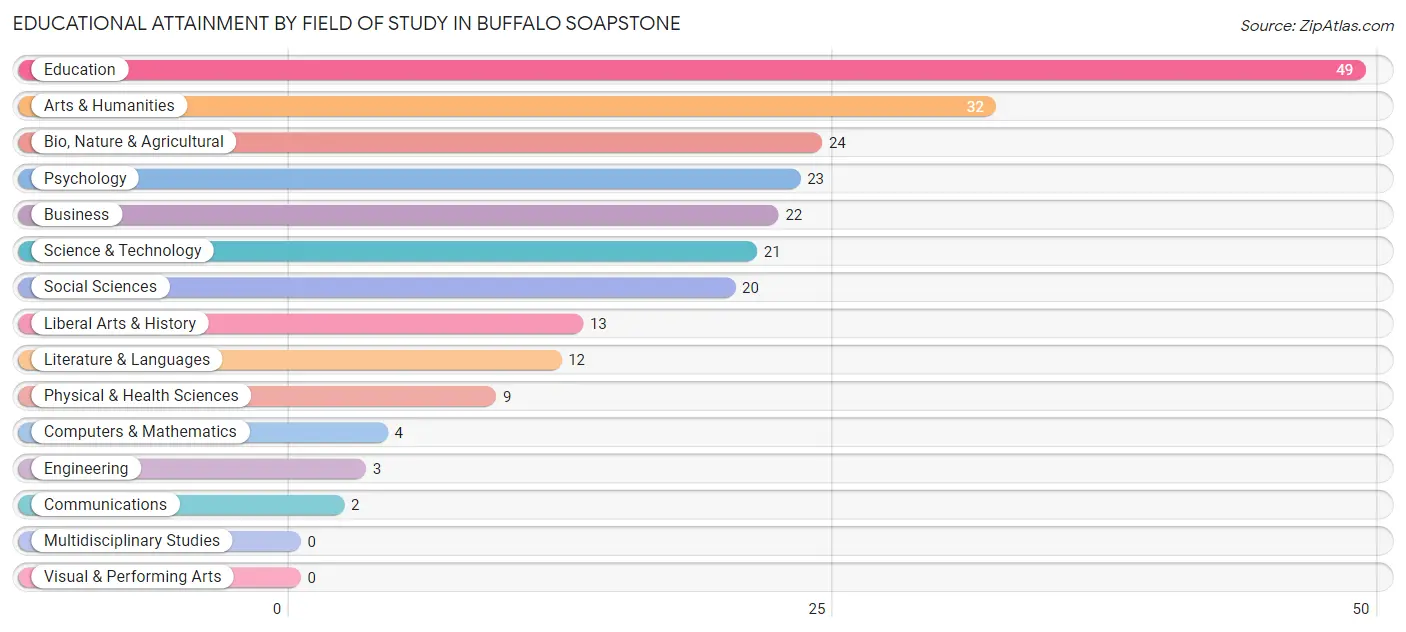
| Field of Study | # Graduates | % Graduates |
| Computers & Mathematics | 4 | 1.7% |
| Bio, Nature & Agricultural | 24 | 10.3% |
| Physical & Health Sciences | 9 | 3.8% |
| Psychology | 23 | 9.8% |
| Social Sciences | 20 | 8.6% |
| Engineering | 3 | 1.3% |
| Multidisciplinary Studies | 0 | 0.0% |
| Science & Technology | 21 | 9.0% |
| Business | 22 | 9.4% |
| Education | 49 | 20.9% |
| Literature & Languages | 12 | 5.1% |
| Liberal Arts & History | 13 | 5.6% |
| Visual & Performing Arts | 0 | 0.0% |
| Communications | 2 | 0.9% |
| Arts & Humanities | 32 | 13.7% |
| Total | 234 | 100.0% |
Transportation & Commute in Buffalo Soapstone
Vehicle Availability by Sex in Buffalo Soapstone
The most prevalent vehicle ownership categories in Buffalo Soapstone are males with 3 vehicles (62, accounting for 30.7%) and females with 3 vehicles (45, making up 40.3%).
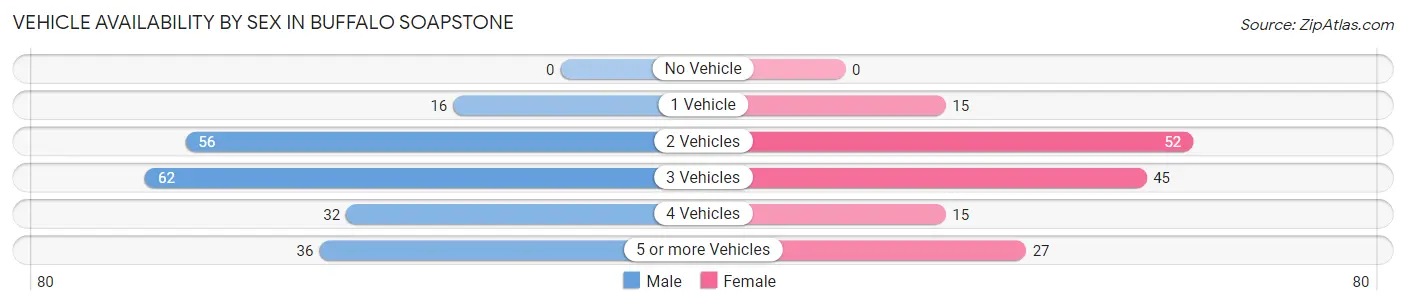
| Vehicles Available | Male | Female |
| No Vehicle | 0 (0.0%) | 0 (0.0%) |
| 1 Vehicle | 16 (7.9%) | 15 (9.7%) |
| 2 Vehicles | 56 (27.7%) | 52 (33.8%) |
| 3 Vehicles | 62 (30.7%) | 45 (29.2%) |
| 4 Vehicles | 32 (15.8%) | 15 (9.7%) |
| 5 or more Vehicles | 36 (17.8%) | 27 (17.5%) |
| Total | 202 (100.0%) | 154 (100.0%) |
Commute Time in Buffalo Soapstone
The most frequently occuring commute durations in Buffalo Soapstone are 45 to 59 minutes (58 commuters, 17.4%), 15 to 19 minutes (57 commuters, 17.1%), and 60 to 89 minutes (44 commuters, 13.2%).
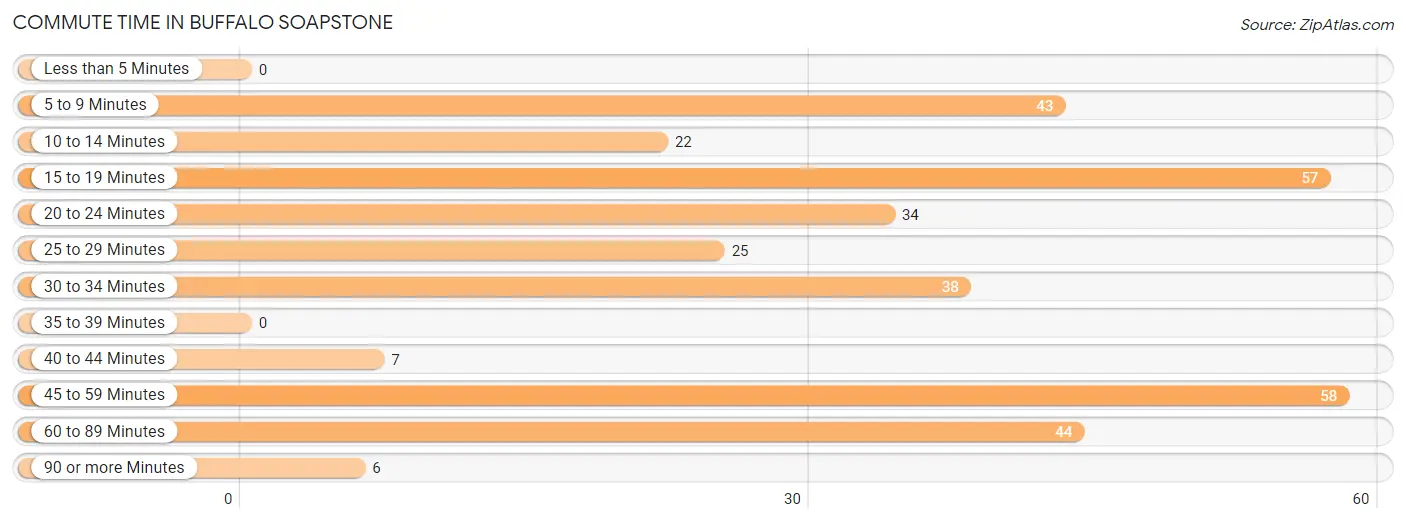
| Commute Time | # Commuters | % Commuters |
| Less than 5 Minutes | 0 | 0.0% |
| 5 to 9 Minutes | 43 | 12.9% |
| 10 to 14 Minutes | 22 | 6.6% |
| 15 to 19 Minutes | 57 | 17.1% |
| 20 to 24 Minutes | 34 | 10.2% |
| 25 to 29 Minutes | 25 | 7.5% |
| 30 to 34 Minutes | 38 | 11.4% |
| 35 to 39 Minutes | 0 | 0.0% |
| 40 to 44 Minutes | 7 | 2.1% |
| 45 to 59 Minutes | 58 | 17.4% |
| 60 to 89 Minutes | 44 | 13.2% |
| 90 or more Minutes | 6 | 1.8% |
Commute Time by Sex in Buffalo Soapstone
The most common commute times in Buffalo Soapstone are 60 to 89 minutes (40 commuters, 20.6%) for males and 45 to 59 minutes (29 commuters, 20.7%) for females.
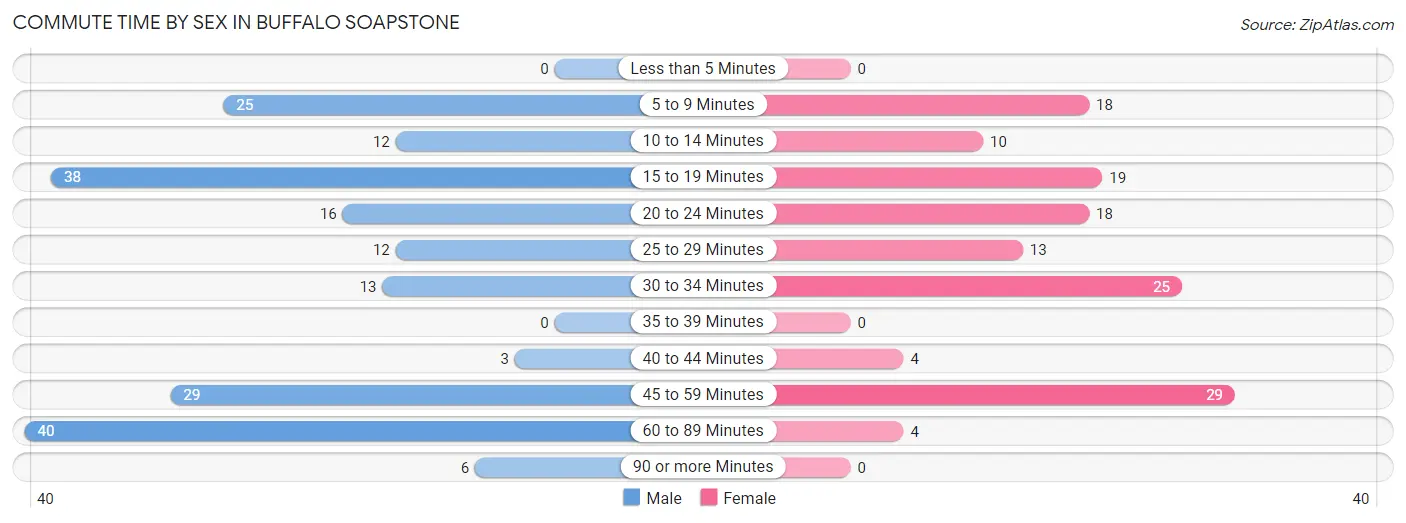
| Commute Time | Male | Female |
| Less than 5 Minutes | 0 (0.0%) | 0 (0.0%) |
| 5 to 9 Minutes | 25 (12.9%) | 18 (12.9%) |
| 10 to 14 Minutes | 12 (6.2%) | 10 (7.1%) |
| 15 to 19 Minutes | 38 (19.6%) | 19 (13.6%) |
| 20 to 24 Minutes | 16 (8.3%) | 18 (12.9%) |
| 25 to 29 Minutes | 12 (6.2%) | 13 (9.3%) |
| 30 to 34 Minutes | 13 (6.7%) | 25 (17.9%) |
| 35 to 39 Minutes | 0 (0.0%) | 0 (0.0%) |
| 40 to 44 Minutes | 3 (1.5%) | 4 (2.9%) |
| 45 to 59 Minutes | 29 (14.9%) | 29 (20.7%) |
| 60 to 89 Minutes | 40 (20.6%) | 4 (2.9%) |
| 90 or more Minutes | 6 (3.1%) | 0 (0.0%) |
Time of Departure to Work by Sex in Buffalo Soapstone
The most frequent times of departure to work in Buffalo Soapstone are 6:30 AM to 6:59 AM (48, 24.7%) for males and 6:00 AM to 6:29 AM (28, 20.0%) for females.
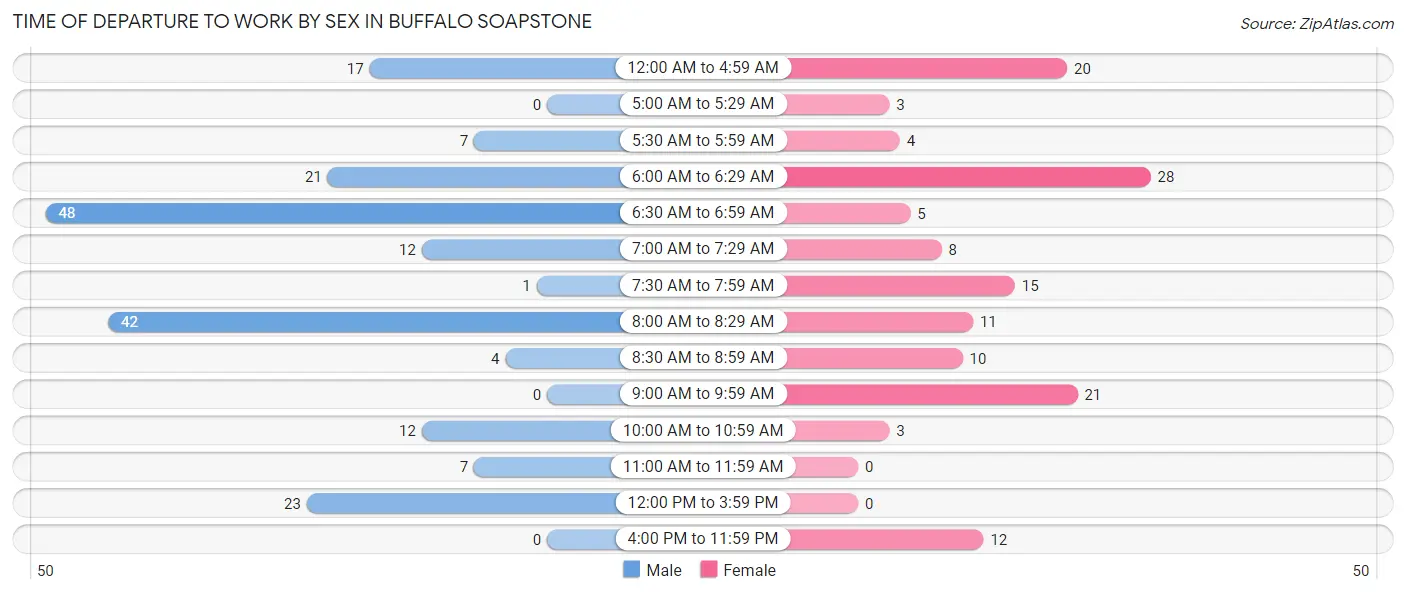
| Time of Departure | Male | Female |
| 12:00 AM to 4:59 AM | 17 (8.8%) | 20 (14.3%) |
| 5:00 AM to 5:29 AM | 0 (0.0%) | 3 (2.1%) |
| 5:30 AM to 5:59 AM | 7 (3.6%) | 4 (2.9%) |
| 6:00 AM to 6:29 AM | 21 (10.8%) | 28 (20.0%) |
| 6:30 AM to 6:59 AM | 48 (24.7%) | 5 (3.6%) |
| 7:00 AM to 7:29 AM | 12 (6.2%) | 8 (5.7%) |
| 7:30 AM to 7:59 AM | 1 (0.5%) | 15 (10.7%) |
| 8:00 AM to 8:29 AM | 42 (21.6%) | 11 (7.9%) |
| 8:30 AM to 8:59 AM | 4 (2.1%) | 10 (7.1%) |
| 9:00 AM to 9:59 AM | 0 (0.0%) | 21 (15.0%) |
| 10:00 AM to 10:59 AM | 12 (6.2%) | 3 (2.1%) |
| 11:00 AM to 11:59 AM | 7 (3.6%) | 0 (0.0%) |
| 12:00 PM to 3:59 PM | 23 (11.9%) | 0 (0.0%) |
| 4:00 PM to 11:59 PM | 0 (0.0%) | 12 (8.6%) |
| Total | 194 (100.0%) | 140 (100.0%) |
Housing Occupancy in Buffalo Soapstone
Occupancy by Ownership in Buffalo Soapstone
Of the total 341 dwellings in Buffalo Soapstone, owner-occupied units account for 304 (89.1%), while renter-occupied units make up 37 (10.8%).
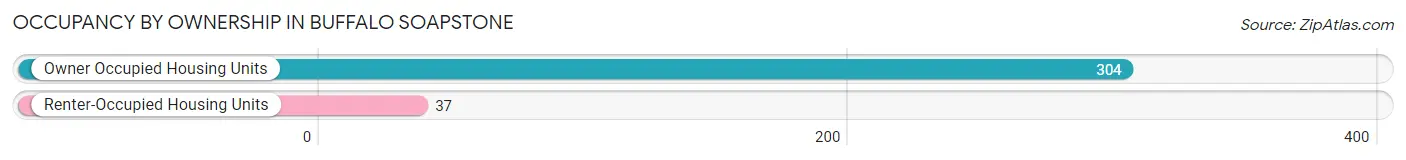
| Occupancy | # Housing Units | % Housing Units |
| Owner Occupied Housing Units | 304 | 89.1% |
| Renter-Occupied Housing Units | 37 | 10.8% |
| Total Occupied Housing Units | 341 | 100.0% |
Occupancy by Household Size in Buffalo Soapstone
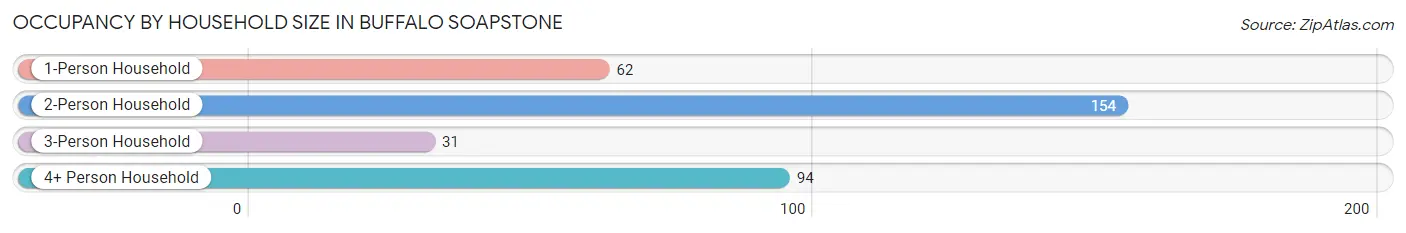
| Household Size | # Housing Units | % Housing Units |
| 1-Person Household | 62 | 18.2% |
| 2-Person Household | 154 | 45.2% |
| 3-Person Household | 31 | 9.1% |
| 4+ Person Household | 94 | 27.6% |
| Total Housing Units | 341 | 100.0% |
Occupancy by Ownership by Household Size in Buffalo Soapstone
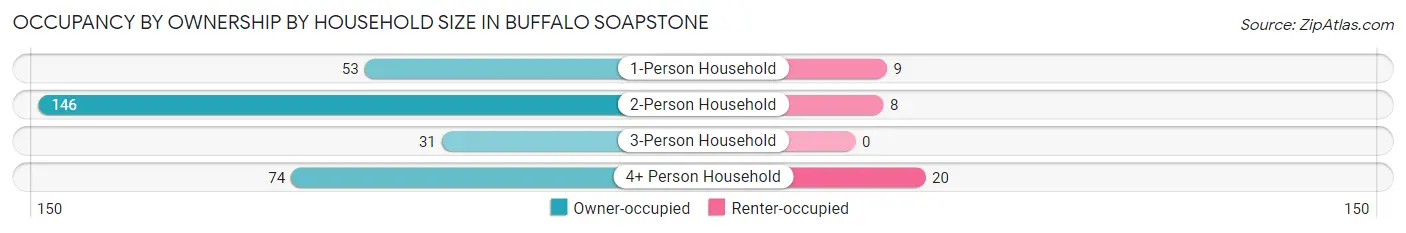
| Household Size | Owner-occupied | Renter-occupied |
| 1-Person Household | 53 (85.5%) | 9 (14.5%) |
| 2-Person Household | 146 (94.8%) | 8 (5.2%) |
| 3-Person Household | 31 (100.0%) | 0 (0.0%) |
| 4+ Person Household | 74 (78.7%) | 20 (21.3%) |
| Total Housing Units | 304 (89.1%) | 37 (10.8%) |
Occupancy by Educational Attainment in Buffalo Soapstone
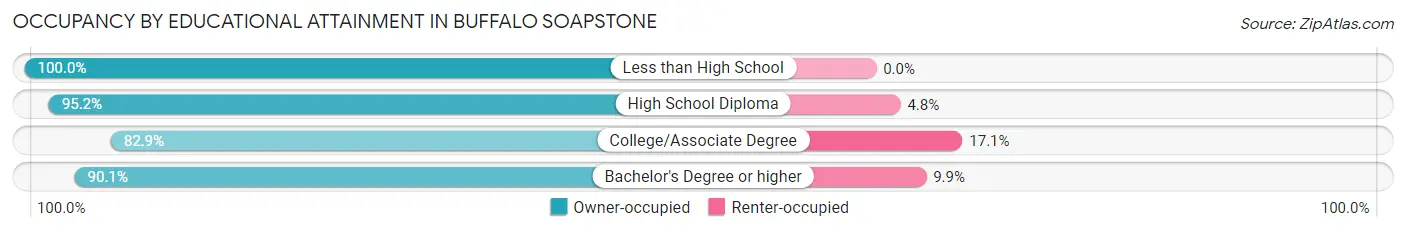
| Household Size | Owner-occupied | Renter-occupied |
| Less than High School | 10 (100.0%) | 0 (0.0%) |
| High School Diploma | 79 (95.2%) | 4 (4.8%) |
| College/Associate Degree | 97 (82.9%) | 20 (17.1%) |
| Bachelor's Degree or higher | 118 (90.1%) | 13 (9.9%) |
Occupancy by Age of Householder in Buffalo Soapstone
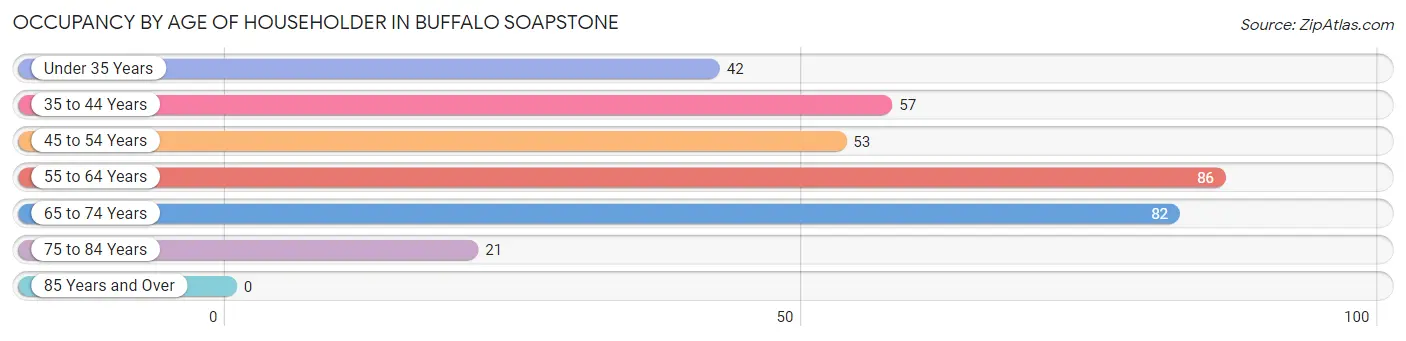
| Age Bracket | # Households | % Households |
| Under 35 Years | 42 | 12.3% |
| 35 to 44 Years | 57 | 16.7% |
| 45 to 54 Years | 53 | 15.5% |
| 55 to 64 Years | 86 | 25.2% |
| 65 to 74 Years | 82 | 24.0% |
| 75 to 84 Years | 21 | 6.2% |
| 85 Years and Over | 0 | 0.0% |
| Total | 341 | 100.0% |
Housing Finances in Buffalo Soapstone
Median Income by Occupancy in Buffalo Soapstone
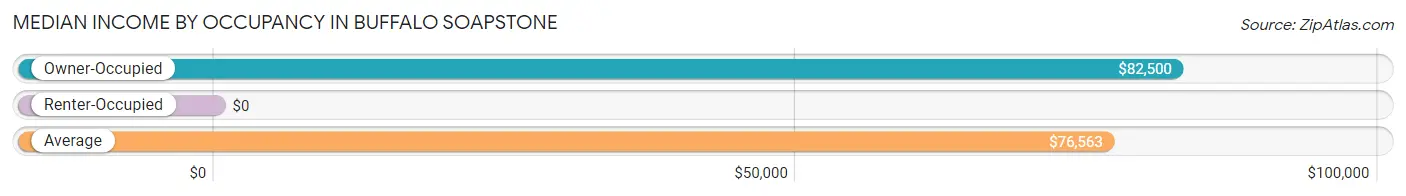
| Occupancy Type | # Households | Median Income |
| Owner-Occupied | 304 (89.1%) | $82,500 |
| Renter-Occupied | 37 (10.8%) | $0 |
| Average | 341 (100.0%) | $76,563 |
Occupancy by Householder Income Bracket in Buffalo Soapstone
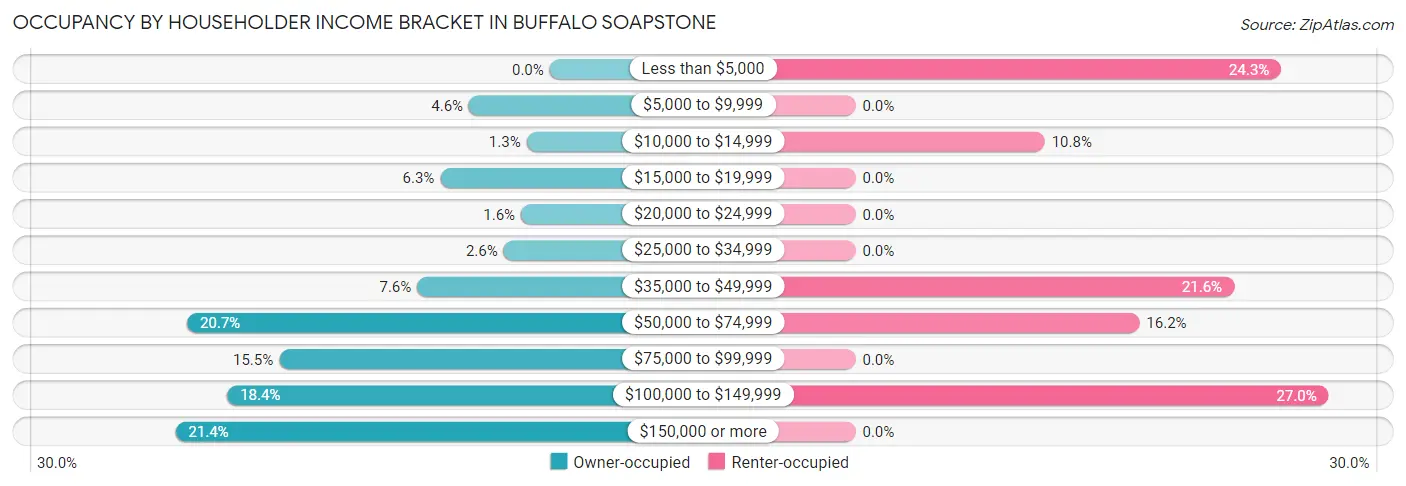
| Income Bracket | Owner-occupied | Renter-occupied |
| Less than $5,000 | 0 (0.0%) | 9 (24.3%) |
| $5,000 to $9,999 | 14 (4.6%) | 0 (0.0%) |
| $10,000 to $14,999 | 4 (1.3%) | 4 (10.8%) |
| $15,000 to $19,999 | 19 (6.2%) | 0 (0.0%) |
| $20,000 to $24,999 | 5 (1.6%) | 0 (0.0%) |
| $25,000 to $34,999 | 8 (2.6%) | 0 (0.0%) |
| $35,000 to $49,999 | 23 (7.6%) | 8 (21.6%) |
| $50,000 to $74,999 | 63 (20.7%) | 6 (16.2%) |
| $75,000 to $99,999 | 47 (15.5%) | 0 (0.0%) |
| $100,000 to $149,999 | 56 (18.4%) | 10 (27.0%) |
| $150,000 or more | 65 (21.4%) | 0 (0.0%) |
| Total | 304 (100.0%) | 37 (100.0%) |
Monthly Housing Cost Tiers in Buffalo Soapstone
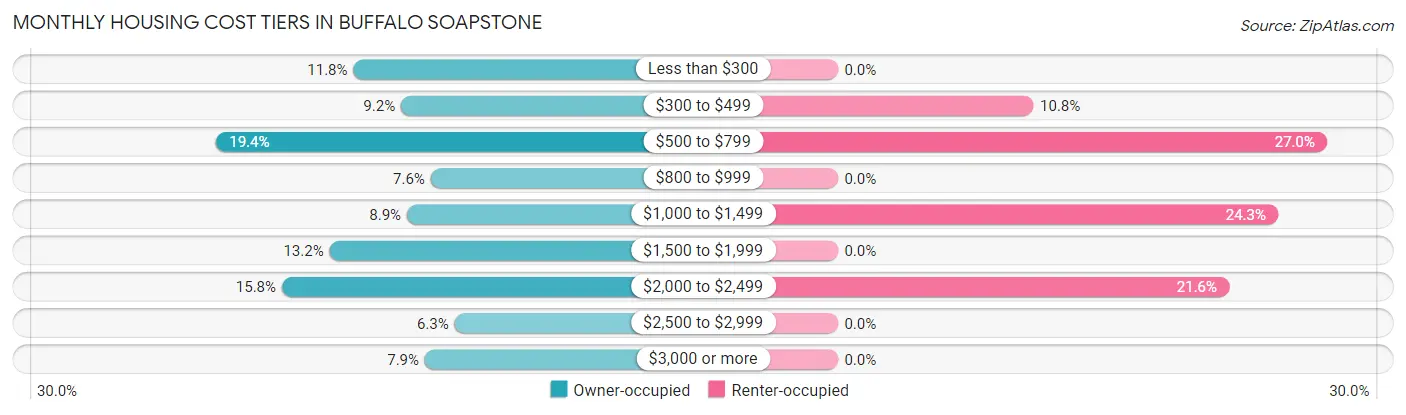
| Monthly Cost | Owner-occupied | Renter-occupied |
| Less than $300 | 36 (11.8%) | 0 (0.0%) |
| $300 to $499 | 28 (9.2%) | 4 (10.8%) |
| $500 to $799 | 59 (19.4%) | 10 (27.0%) |
| $800 to $999 | 23 (7.6%) | 0 (0.0%) |
| $1,000 to $1,499 | 27 (8.9%) | 9 (24.3%) |
| $1,500 to $1,999 | 40 (13.2%) | 0 (0.0%) |
| $2,000 to $2,499 | 48 (15.8%) | 8 (21.6%) |
| $2,500 to $2,999 | 19 (6.2%) | 0 (0.0%) |
| $3,000 or more | 24 (7.9%) | 0 (0.0%) |
| Total | 304 (100.0%) | 37 (100.0%) |
Physical Housing Characteristics in Buffalo Soapstone
Housing Structures in Buffalo Soapstone
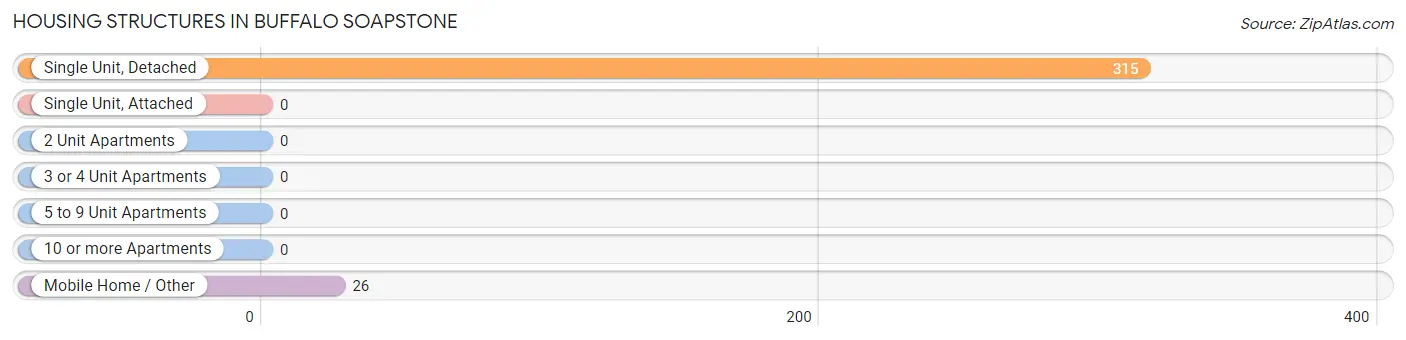
| Structure Type | # Housing Units | % Housing Units |
| Single Unit, Detached | 315 | 92.4% |
| Single Unit, Attached | 0 | 0.0% |
| 2 Unit Apartments | 0 | 0.0% |
| 3 or 4 Unit Apartments | 0 | 0.0% |
| 5 to 9 Unit Apartments | 0 | 0.0% |
| 10 or more Apartments | 0 | 0.0% |
| Mobile Home / Other | 26 | 7.6% |
| Total | 341 | 100.0% |
Housing Structures by Occupancy in Buffalo Soapstone
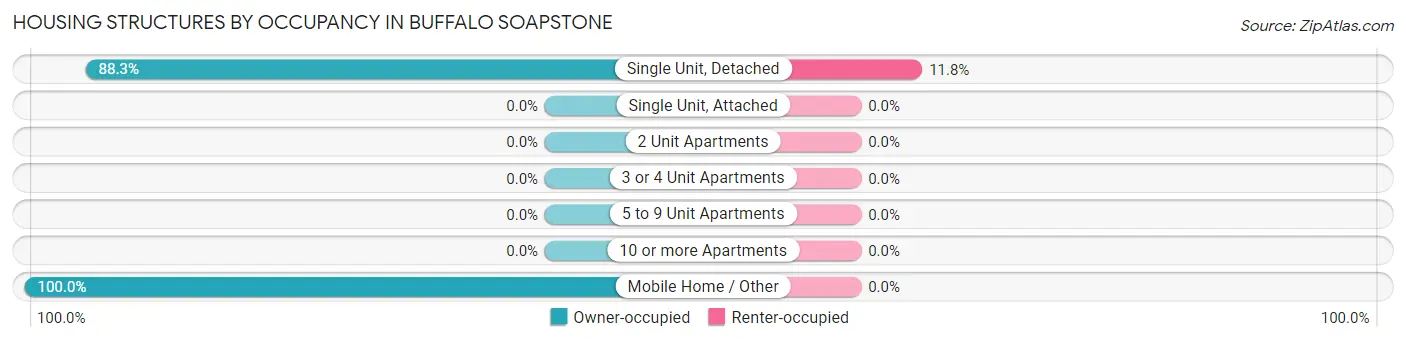
| Structure Type | Owner-occupied | Renter-occupied |
| Single Unit, Detached | 278 (88.2%) | 37 (11.7%) |
| Single Unit, Attached | 0 (0.0%) | 0 (0.0%) |
| 2 Unit Apartments | 0 (0.0%) | 0 (0.0%) |
| 3 or 4 Unit Apartments | 0 (0.0%) | 0 (0.0%) |
| 5 to 9 Unit Apartments | 0 (0.0%) | 0 (0.0%) |
| 10 or more Apartments | 0 (0.0%) | 0 (0.0%) |
| Mobile Home / Other | 26 (100.0%) | 0 (0.0%) |
| Total | 304 (89.1%) | 37 (10.8%) |
Housing Structures by Number of Rooms in Buffalo Soapstone
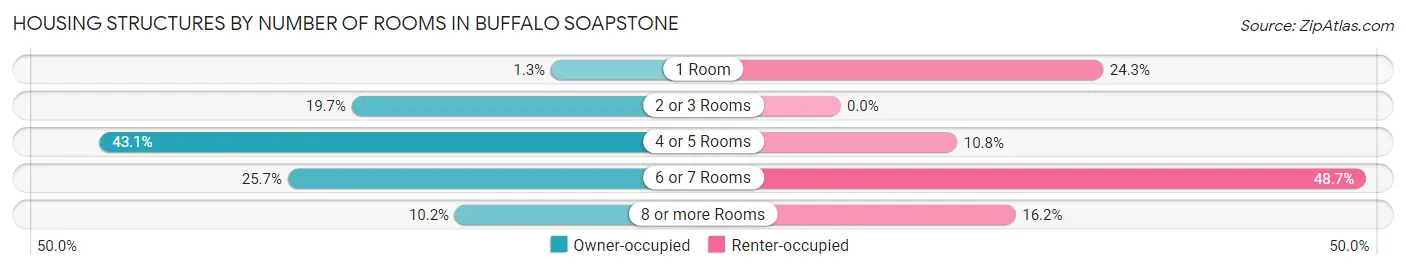
| Number of Rooms | Owner-occupied | Renter-occupied |
| 1 Room | 4 (1.3%) | 9 (24.3%) |
| 2 or 3 Rooms | 60 (19.7%) | 0 (0.0%) |
| 4 or 5 Rooms | 131 (43.1%) | 4 (10.8%) |
| 6 or 7 Rooms | 78 (25.7%) | 18 (48.6%) |
| 8 or more Rooms | 31 (10.2%) | 6 (16.2%) |
| Total | 304 (100.0%) | 37 (100.0%) |
Housing Structure by Heating Type in Buffalo Soapstone
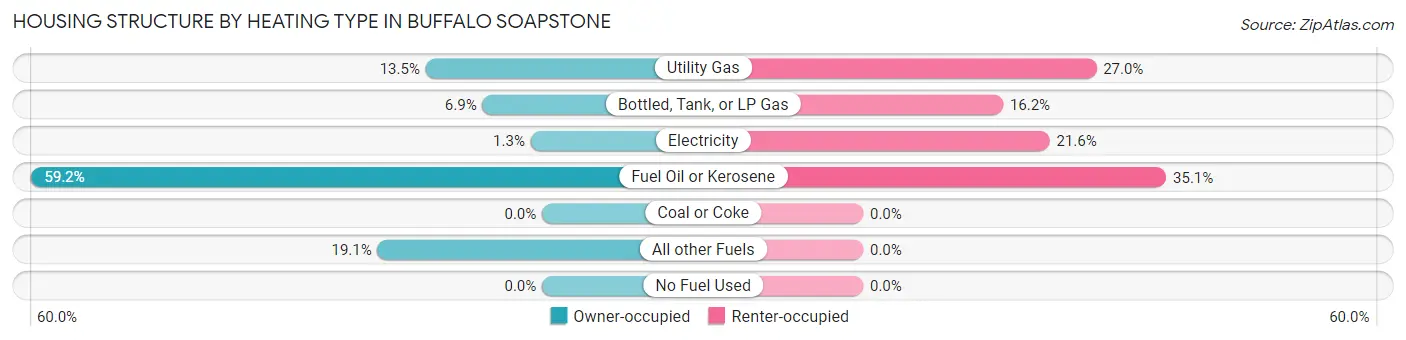
| Heating Type | Owner-occupied | Renter-occupied |
| Utility Gas | 41 (13.5%) | 10 (27.0%) |
| Bottled, Tank, or LP Gas | 21 (6.9%) | 6 (16.2%) |
| Electricity | 4 (1.3%) | 8 (21.6%) |
| Fuel Oil or Kerosene | 180 (59.2%) | 13 (35.1%) |
| Coal or Coke | 0 (0.0%) | 0 (0.0%) |
| All other Fuels | 58 (19.1%) | 0 (0.0%) |
| No Fuel Used | 0 (0.0%) | 0 (0.0%) |
| Total | 304 (100.0%) | 37 (100.0%) |
Household Vehicle Usage in Buffalo Soapstone
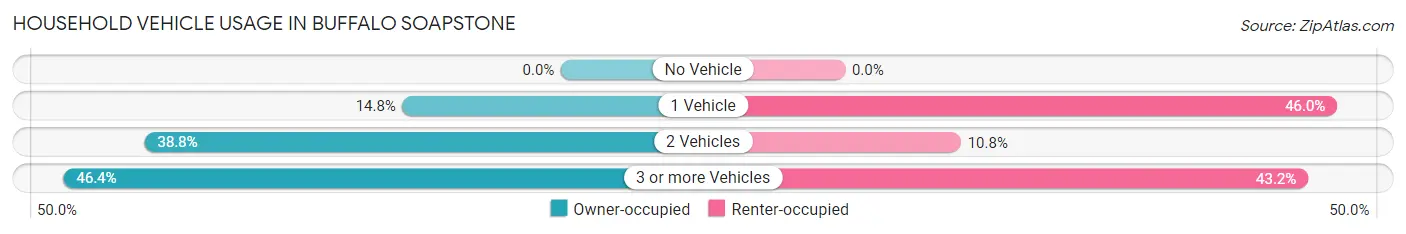
| Vehicles per Household | Owner-occupied | Renter-occupied |
| No Vehicle | 0 (0.0%) | 0 (0.0%) |
| 1 Vehicle | 45 (14.8%) | 17 (46.0%) |
| 2 Vehicles | 118 (38.8%) | 4 (10.8%) |
| 3 or more Vehicles | 141 (46.4%) | 16 (43.2%) |
| Total | 304 (100.0%) | 37 (100.0%) |
Real Estate & Mortgages in Buffalo Soapstone
Real Estate and Mortgage Overview in Buffalo Soapstone
| Characteristic | Without Mortgage | With Mortgage |
| Housing Units | 151 | 153 |
| Median Property Value | $172,800 | $341,300 |
| Median Household Income | $65,417 | $44 |
| Monthly Housing Costs | $564 | $24 |
| Real Estate Taxes | $1,333 | $10 |
Property Value by Mortgage Status in Buffalo Soapstone
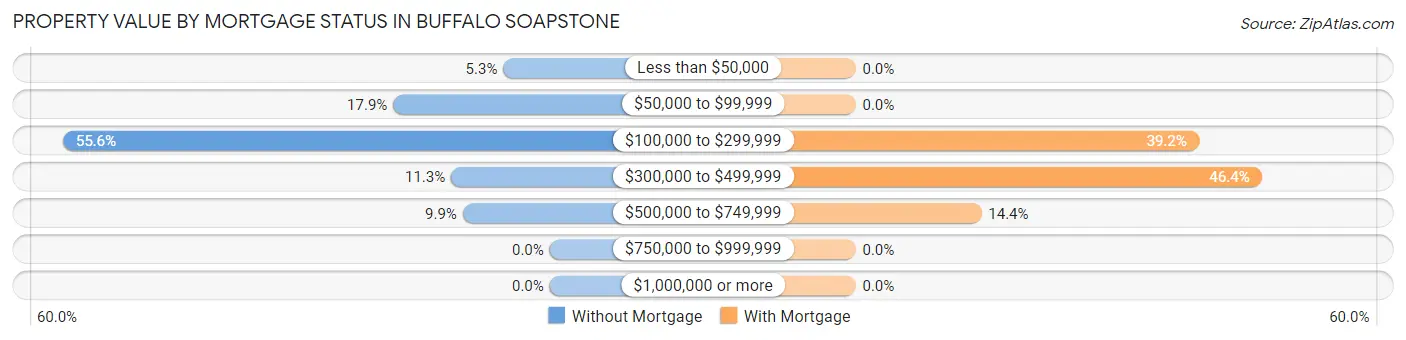
| Property Value | Without Mortgage | With Mortgage |
| Less than $50,000 | 8 (5.3%) | 0 (0.0%) |
| $50,000 to $99,999 | 27 (17.9%) | 0 (0.0%) |
| $100,000 to $299,999 | 84 (55.6%) | 60 (39.2%) |
| $300,000 to $499,999 | 17 (11.3%) | 71 (46.4%) |
| $500,000 to $749,999 | 15 (9.9%) | 22 (14.4%) |
| $750,000 to $999,999 | 0 (0.0%) | 0 (0.0%) |
| $1,000,000 or more | 0 (0.0%) | 0 (0.0%) |
| Total | 151 (100.0%) | 153 (100.0%) |
Household Income by Mortgage Status in Buffalo Soapstone
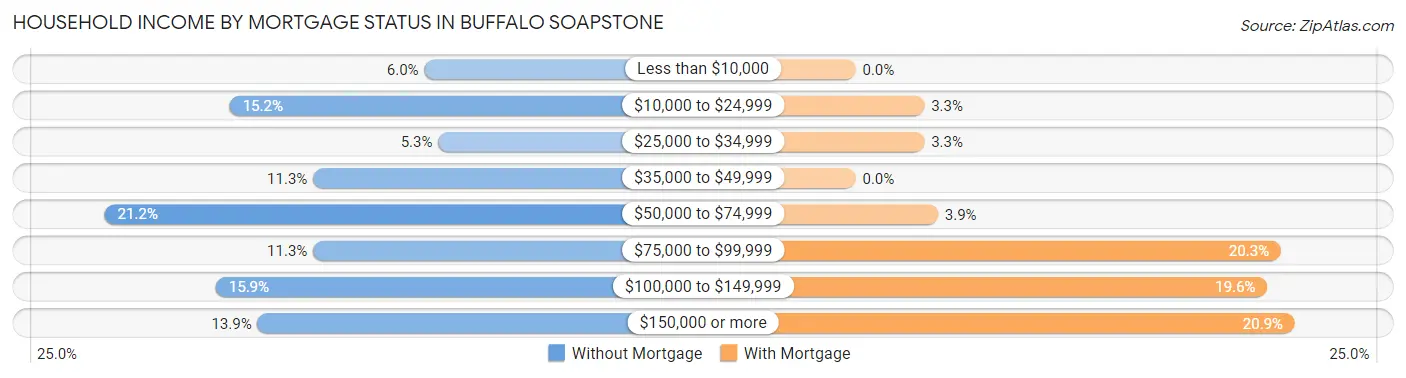
| Household Income | Without Mortgage | With Mortgage |
| Less than $10,000 | 9 (6.0%) | 0 (0.0%) |
| $10,000 to $24,999 | 23 (15.2%) | 5 (3.3%) |
| $25,000 to $34,999 | 8 (5.3%) | 5 (3.3%) |
| $35,000 to $49,999 | 17 (11.3%) | 0 (0.0%) |
| $50,000 to $74,999 | 32 (21.2%) | 6 (3.9%) |
| $75,000 to $99,999 | 17 (11.3%) | 31 (20.3%) |
| $100,000 to $149,999 | 24 (15.9%) | 30 (19.6%) |
| $150,000 or more | 21 (13.9%) | 32 (20.9%) |
| Total | 151 (100.0%) | 153 (100.0%) |
Property Value to Household Income Ratio in Buffalo Soapstone
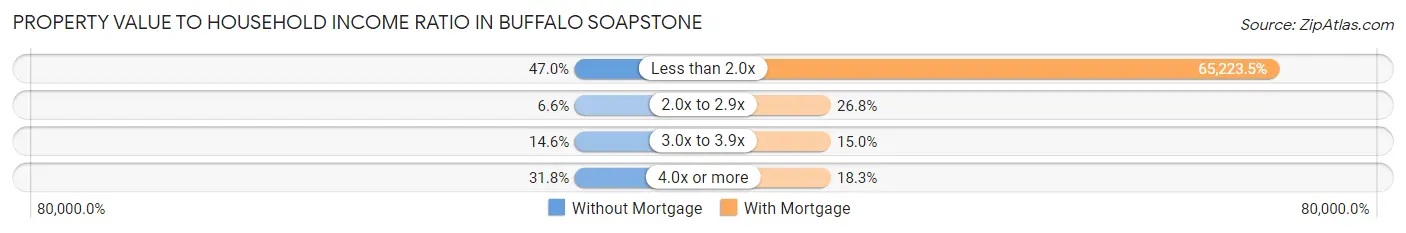
| Value-to-Income Ratio | Without Mortgage | With Mortgage |
| Less than 2.0x | 71 (47.0%) | 99,792 (65,223.5%) |
| 2.0x to 2.9x | 10 (6.6%) | 41 (26.8%) |
| 3.0x to 3.9x | 22 (14.6%) | 23 (15.0%) |
| 4.0x or more | 48 (31.8%) | 28 (18.3%) |
| Total | 151 (100.0%) | 153 (100.0%) |
Real Estate Taxes by Mortgage Status in Buffalo Soapstone
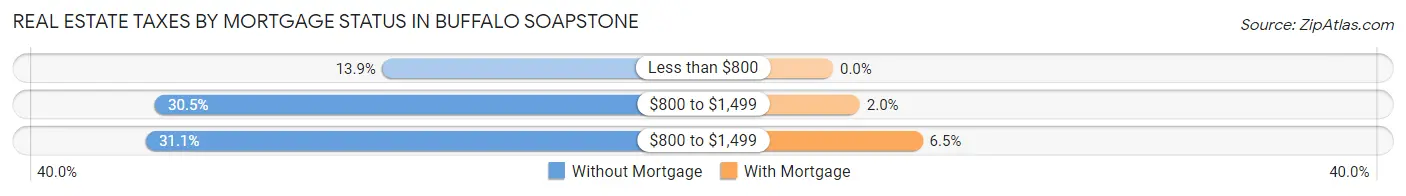
| Property Taxes | Without Mortgage | With Mortgage |
| Less than $800 | 21 (13.9%) | 0 (0.0%) |
| $800 to $1,499 | 46 (30.5%) | 3 (2.0%) |
| $800 to $1,499 | 47 (31.1%) | 10 (6.5%) |
| Total | 151 (100.0%) | 153 (100.0%) |
Health & Disability in Buffalo Soapstone
Health Insurance Coverage by Age in Buffalo Soapstone
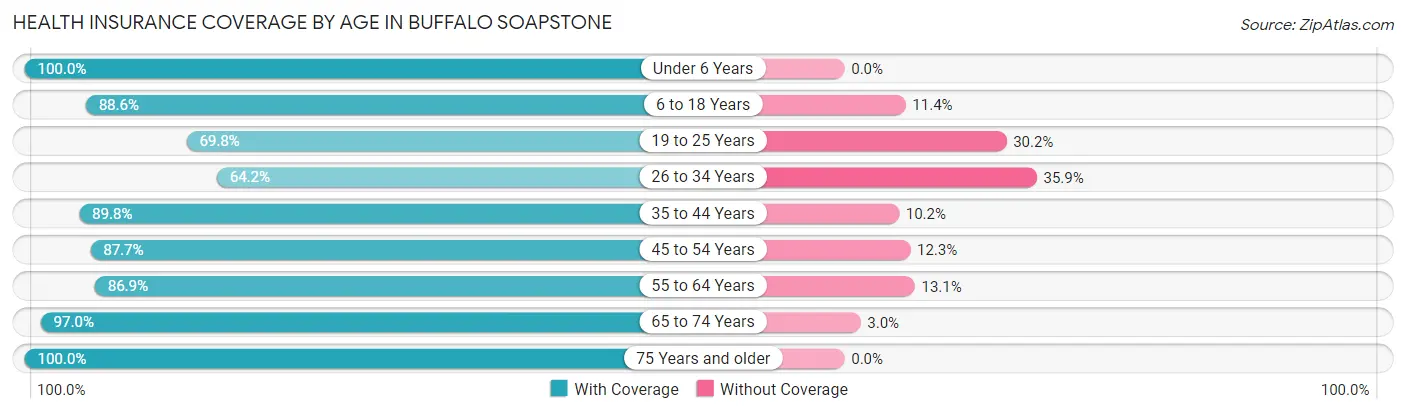
| Age Bracket | With Coverage | Without Coverage |
| Under 6 Years | 61 (100.0%) | 0 (0.0%) |
| 6 to 18 Years | 171 (88.6%) | 22 (11.4%) |
| 19 to 25 Years | 37 (69.8%) | 16 (30.2%) |
| 26 to 34 Years | 68 (64.1%) | 38 (35.8%) |
| 35 to 44 Years | 115 (89.8%) | 13 (10.2%) |
| 45 to 54 Years | 93 (87.7%) | 13 (12.3%) |
| 55 to 64 Years | 126 (86.9%) | 19 (13.1%) |
| 65 to 74 Years | 130 (97.0%) | 4 (3.0%) |
| 75 Years and older | 33 (100.0%) | 0 (0.0%) |
| Total | 834 (87.0%) | 125 (13.0%) |
Health Insurance Coverage by Citizenship Status in Buffalo Soapstone
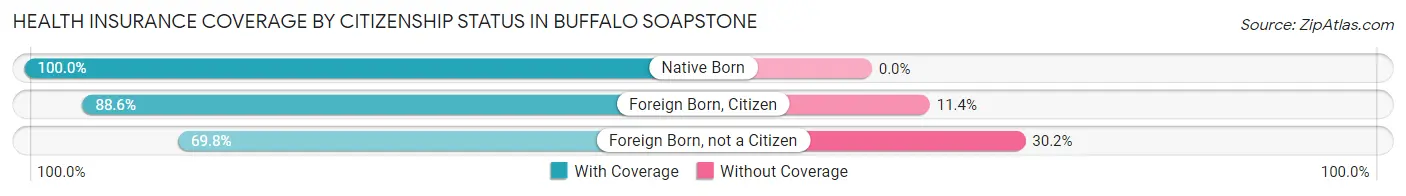
| Citizenship Status | With Coverage | Without Coverage |
| Native Born | 61 (100.0%) | 0 (0.0%) |
| Foreign Born, Citizen | 171 (88.6%) | 22 (11.4%) |
| Foreign Born, not a Citizen | 37 (69.8%) | 16 (30.2%) |
Health Insurance Coverage by Household Income in Buffalo Soapstone
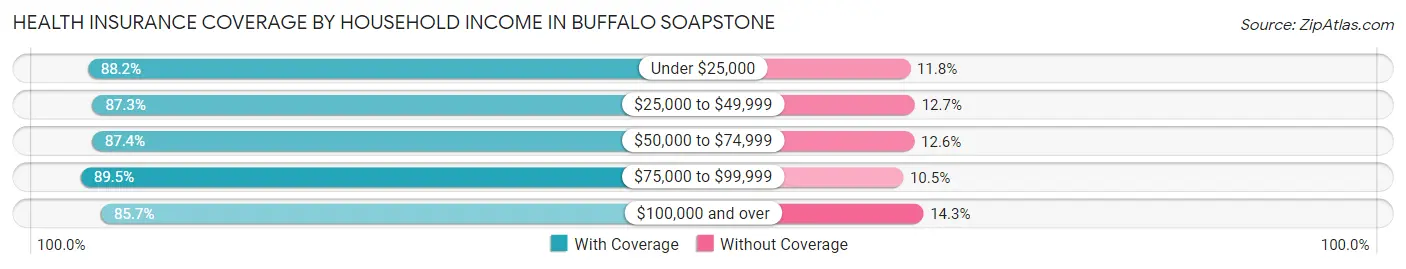
| Household Income | With Coverage | Without Coverage |
| Under $25,000 | 67 (88.2%) | 9 (11.8%) |
| $25,000 to $49,999 | 48 (87.3%) | 7 (12.7%) |
| $50,000 to $74,999 | 194 (87.4%) | 28 (12.6%) |
| $75,000 to $99,999 | 136 (89.5%) | 16 (10.5%) |
| $100,000 and over | 389 (85.7%) | 65 (14.3%) |
Public vs Private Health Insurance Coverage by Age in Buffalo Soapstone
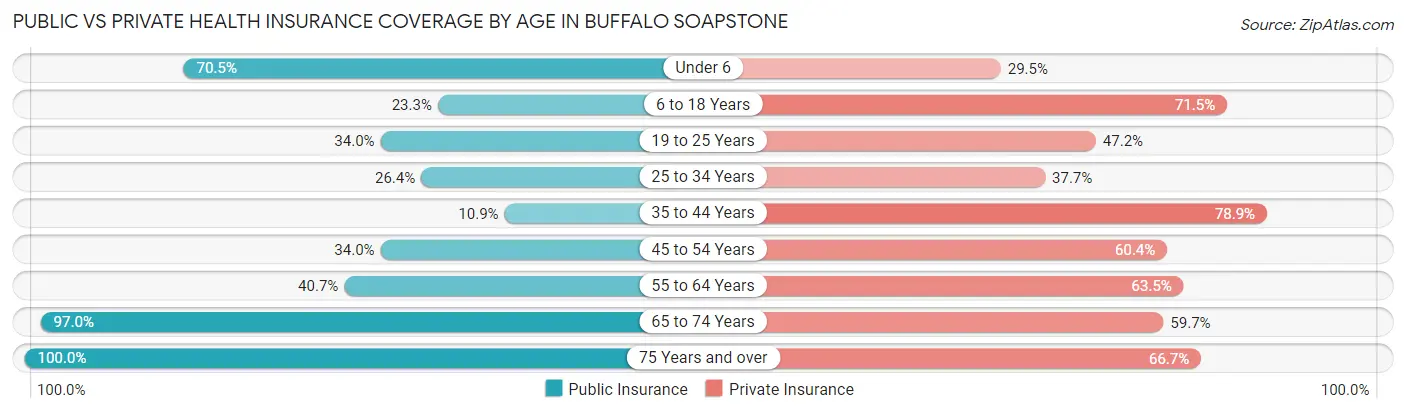
| Age Bracket | Public Insurance | Private Insurance |
| Under 6 | 43 (70.5%) | 18 (29.5%) |
| 6 to 18 Years | 45 (23.3%) | 138 (71.5%) |
| 19 to 25 Years | 18 (34.0%) | 25 (47.2%) |
| 25 to 34 Years | 28 (26.4%) | 40 (37.7%) |
| 35 to 44 Years | 14 (10.9%) | 101 (78.9%) |
| 45 to 54 Years | 36 (34.0%) | 64 (60.4%) |
| 55 to 64 Years | 59 (40.7%) | 92 (63.4%) |
| 65 to 74 Years | 130 (97.0%) | 80 (59.7%) |
| 75 Years and over | 33 (100.0%) | 22 (66.7%) |
| Total | 406 (42.3%) | 580 (60.5%) |
Disability Status by Sex by Age in Buffalo Soapstone
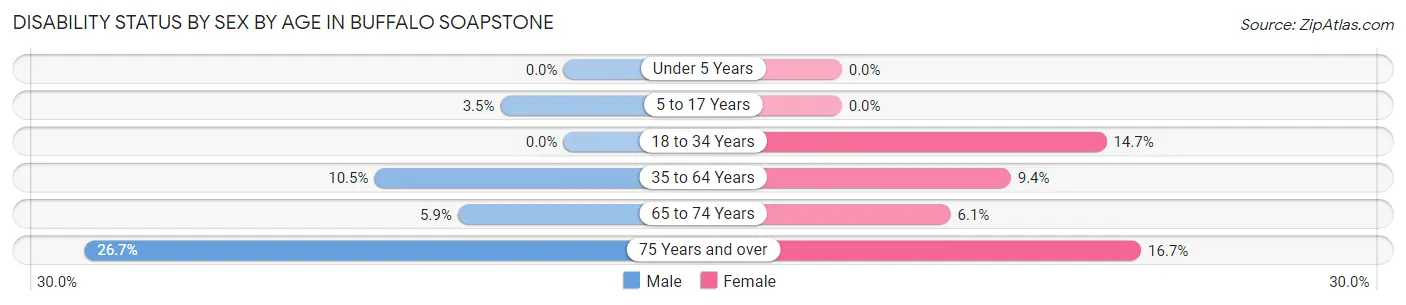
| Age Bracket | Male | Female |
| Under 5 Years | 0 (0.0%) | 0 (0.0%) |
| 5 to 17 Years | 4 (3.5%) | 0 (0.0%) |
| 18 to 34 Years | 0 (0.0%) | 14 (14.7%) |
| 35 to 64 Years | 22 (10.5%) | 16 (9.4%) |
| 65 to 74 Years | 4 (5.9%) | 4 (6.1%) |
| 75 Years and over | 4 (26.7%) | 3 (16.7%) |
Disability Class by Sex by Age in Buffalo Soapstone
Disability Class: Hearing Difficulty
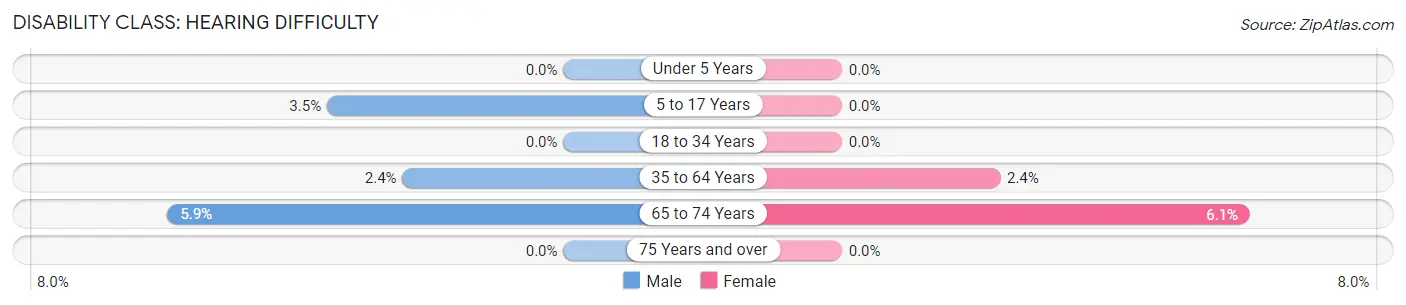
| Age Bracket | Male | Female |
| Under 5 Years | 0 (0.0%) | 0 (0.0%) |
| 5 to 17 Years | 4 (3.5%) | 0 (0.0%) |
| 18 to 34 Years | 0 (0.0%) | 0 (0.0%) |
| 35 to 64 Years | 5 (2.4%) | 4 (2.4%) |
| 65 to 74 Years | 4 (5.9%) | 4 (6.1%) |
| 75 Years and over | 0 (0.0%) | 0 (0.0%) |
Disability Class: Vision Difficulty
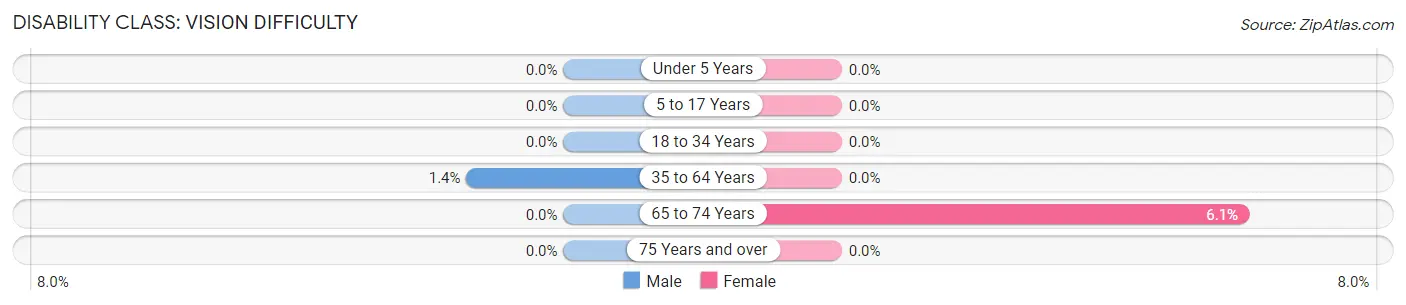
| Age Bracket | Male | Female |
| Under 5 Years | 0 (0.0%) | 0 (0.0%) |
| 5 to 17 Years | 0 (0.0%) | 0 (0.0%) |
| 18 to 34 Years | 0 (0.0%) | 0 (0.0%) |
| 35 to 64 Years | 3 (1.4%) | 0 (0.0%) |
| 65 to 74 Years | 0 (0.0%) | 4 (6.1%) |
| 75 Years and over | 0 (0.0%) | 0 (0.0%) |
Disability Class: Cognitive Difficulty
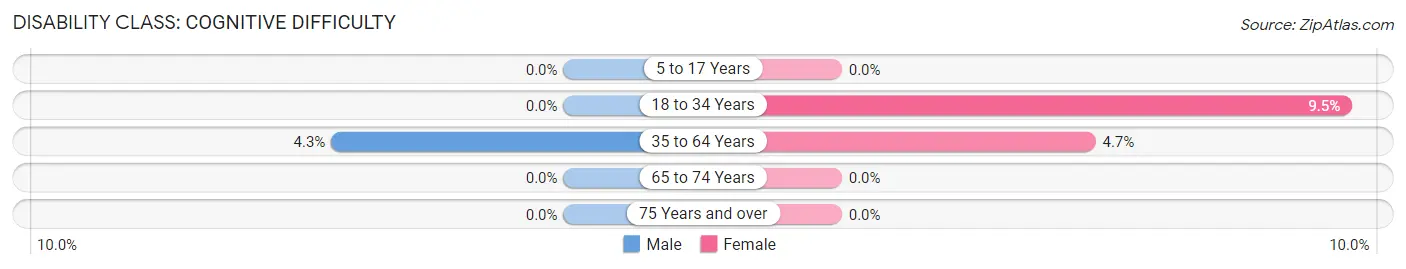
| Age Bracket | Male | Female |
| 5 to 17 Years | 0 (0.0%) | 0 (0.0%) |
| 18 to 34 Years | 0 (0.0%) | 9 (9.5%) |
| 35 to 64 Years | 9 (4.3%) | 8 (4.7%) |
| 65 to 74 Years | 0 (0.0%) | 0 (0.0%) |
| 75 Years and over | 0 (0.0%) | 0 (0.0%) |
Disability Class: Ambulatory Difficulty
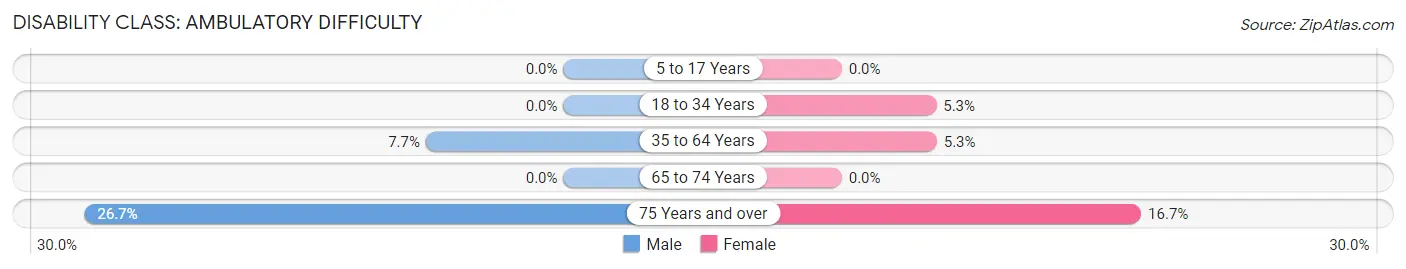
| Age Bracket | Male | Female |
| 5 to 17 Years | 0 (0.0%) | 0 (0.0%) |
| 18 to 34 Years | 0 (0.0%) | 5 (5.3%) |
| 35 to 64 Years | 16 (7.7%) | 9 (5.3%) |
| 65 to 74 Years | 0 (0.0%) | 0 (0.0%) |
| 75 Years and over | 4 (26.7%) | 3 (16.7%) |
Disability Class: Self-Care Difficulty
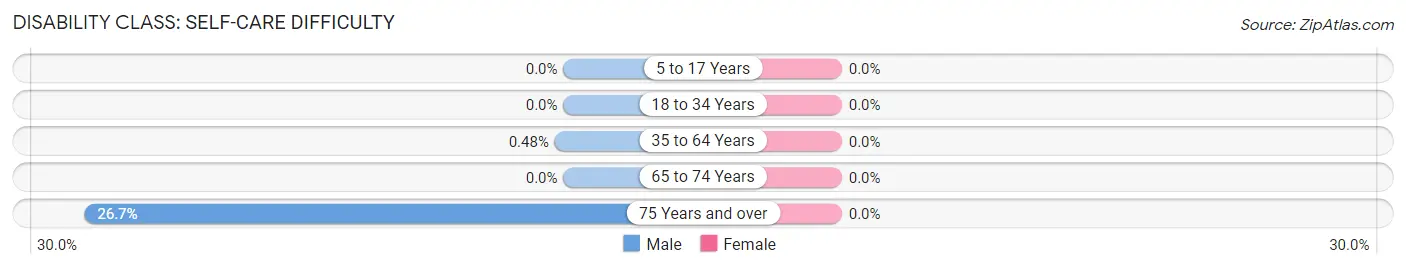
| Age Bracket | Male | Female |
| 5 to 17 Years | 0 (0.0%) | 0 (0.0%) |
| 18 to 34 Years | 0 (0.0%) | 0 (0.0%) |
| 35 to 64 Years | 1 (0.5%) | 0 (0.0%) |
| 65 to 74 Years | 0 (0.0%) | 0 (0.0%) |
| 75 Years and over | 4 (26.7%) | 0 (0.0%) |
Technology Access in Buffalo Soapstone
Computing Device Access in Buffalo Soapstone
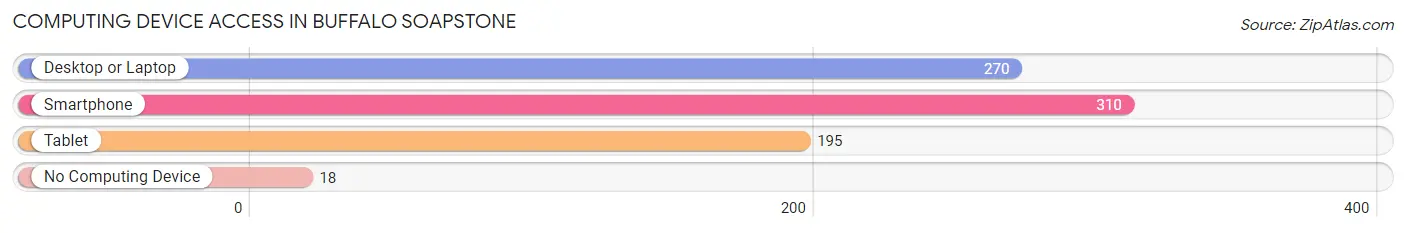
| Device Type | # Households | % Households |
| Desktop or Laptop | 270 | 79.2% |
| Smartphone | 310 | 90.9% |
| Tablet | 195 | 57.2% |
| No Computing Device | 18 | 5.3% |
| Total | 341 | 100.0% |
Internet Access in Buffalo Soapstone
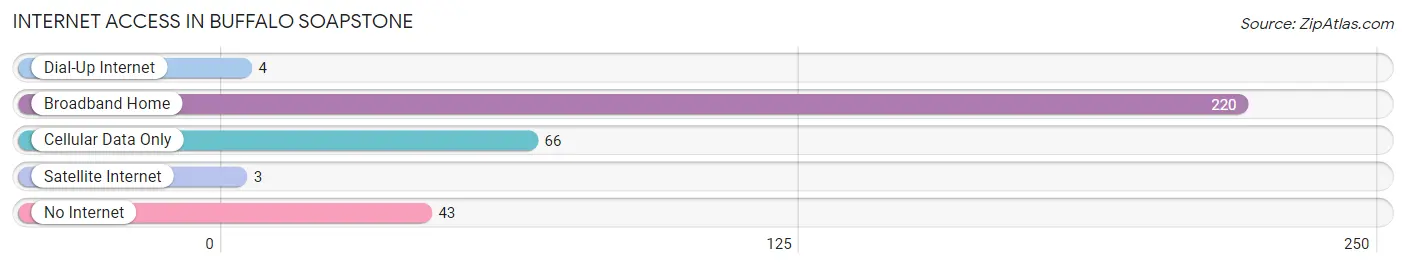
| Internet Type | # Households | % Households |
| Dial-Up Internet | 4 | 1.2% |
| Broadband Home | 220 | 64.5% |
| Cellular Data Only | 66 | 19.4% |
| Satellite Internet | 3 | 0.9% |
| No Internet | 43 | 12.6% |
| Total | 341 | 100.0% |
Buffalo Soapstone Summary
Buffalo Soapstone is a small unincorporated community located in the Matanuska-Susitna Borough of Alaska. It is located on the south side of the Susitna River, approximately 25 miles northeast of Wasilla. The community is named after the nearby Buffalo Soapstone Quarry, which was discovered in the early 1900s.
History
The area around Buffalo Soapstone has been inhabited for thousands of years by the Dena’ina Athabascan people. The Dena’ina used the soapstone from the quarry to make tools and weapons. The first non-Native settlers arrived in the area in the early 1900s, when gold miners discovered the soapstone quarry. The miners used the soapstone to build cabins and other structures.
In the early 1920s, the Alaska Railroad was built through the area, connecting Buffalo Soapstone to the rest of Alaska. This allowed for increased development in the area, and the community began to grow. In the 1950s, the Alaska Native Claims Settlement Act (ANCSA) was passed, which allowed for the formation of Native Corporations in Alaska. The Dena’ina people formed the Chugach Alaska Corporation, which owns much of the land around Buffalo Soapstone.
Geography
Buffalo Soapstone is located in the Matanuska-Susitna Borough of Alaska. It is situated on the south side of the Susitna River, approximately 25 miles northeast of Wasilla. The community is surrounded by mountains and forests, and is located in a valley. The climate in the area is generally cold and dry, with temperatures ranging from -20°F in the winter to 70°F in the summer.
Economy
The economy of Buffalo Soapstone is largely based on tourism and subsistence activities. The area is popular with hunters and fishermen, and there are several lodges and cabins in the area. The Chugach Alaska Corporation also owns and operates a soapstone quarry in the area, which provides employment for some of the local residents.
Demographics
As of the 2010 census, the population of Buffalo Soapstone was estimated to be around 50 people. The majority of the population is Native American, with the Dena’ina Athabascan people making up the majority of the population. The median household income in the area is around $50,000, and the median age is around 40 years old.
Common Questions
What is Per Capita Income in Buffalo Soapstone?
Per Capita income in Buffalo Soapstone is $35,111.
What is the Median Family Income in Buffalo Soapstone?
Median Family Income in Buffalo Soapstone is $88,000.
What is the Median Household income in Buffalo Soapstone?
Median Household Income in Buffalo Soapstone is $76,563.
What is Income or Wage Gap in Buffalo Soapstone?
Income or Wage Gap in Buffalo Soapstone is 21.8%.
Women in Buffalo Soapstone earn 78.2 cents for every dollar earned by a man.
What is Inequality or Gini Index in Buffalo Soapstone?
Inequality or Gini Index in Buffalo Soapstone is 0.43.
What is the Total Population of Buffalo Soapstone?
Total Population of Buffalo Soapstone is 959.
What is the Total Male Population of Buffalo Soapstone?
Total Male Population of Buffalo Soapstone is 499.
What is the Total Female Population of Buffalo Soapstone?
Total Female Population of Buffalo Soapstone is 460.
What is the Ratio of Males per 100 Females in Buffalo Soapstone?
There are 108.48 Males per 100 Females in Buffalo Soapstone.
What is the Ratio of Females per 100 Males in Buffalo Soapstone?
There are 92.18 Females per 100 Males in Buffalo Soapstone.
What is the Median Population Age in Buffalo Soapstone?
Median Population Age in Buffalo Soapstone is 41.4 Years.
What is the Average Family Size in Buffalo Soapstone
Average Family Size in Buffalo Soapstone is 3.2 People.
What is the Average Household Size in Buffalo Soapstone
Average Household Size in Buffalo Soapstone is 2.8 People.
How Large is the Labor Force in Buffalo Soapstone?
There are 423 People in the Labor Forcein in Buffalo Soapstone.
What is the Percentage of People in the Labor Force in Buffalo Soapstone?
56.5% of People are in the Labor Force in Buffalo Soapstone.
What is the Unemployment Rate in Buffalo Soapstone?
Unemployment Rate in Buffalo Soapstone is 13.7%.