Glacier View, AK Map & Demographics
Glacier View Map
Glacier View Overview
$56,251
PER CAPITA INCOME
$31,875
AVG HOUSEHOLD INCOME
0.68
INEQUALITY / GINI INDEX
216
TOTAL POPULATION
96
MALE POPULATION
120
FEMALE POPULATION
80.00
MALES / 100 FEMALES
125.00
FEMALES / 100 MALES
54.2
MEDIAN AGE
2.5
AVG FAMILY SIZE
1.5
AVG HOUSEHOLD SIZE
99
LABOR FORCE [ PEOPLE ]
50.3%
PERCENT IN LABOR FORCE
Income in Glacier View
Income Overview in Glacier View
| Characteristic | Number | Measure |
| Per Capita Income | 216 | $56,251 |
| Median Family Income | 39 | $0 |
| Mean Family Income | 39 | $180,036 |
| Median Household Income | 124 | $31,875 |
| Mean Household Income | 124 | $75,998 |
| Income Deficit | 39 | $0 |
| Wage / Income Gap (%) | 216 | 0.00% |
| Wage / Income Gap ($) | 216 | 100.00¢ per $1 |
| Gini / Inequality Index | 216 | 0.68 |
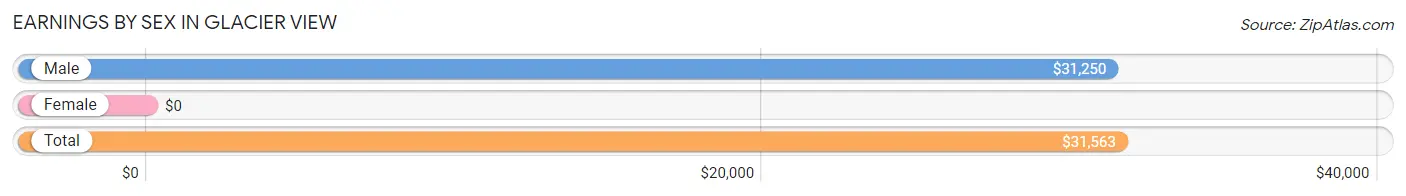
Earnings by Sex in Glacier View
| Sex | Number | Average Earnings |
| Male | 74 (63.2%) | $31,250 |
| Female | 43 (36.7%) | $0 |
| Total | 117 (100.0%) | $31,563 |
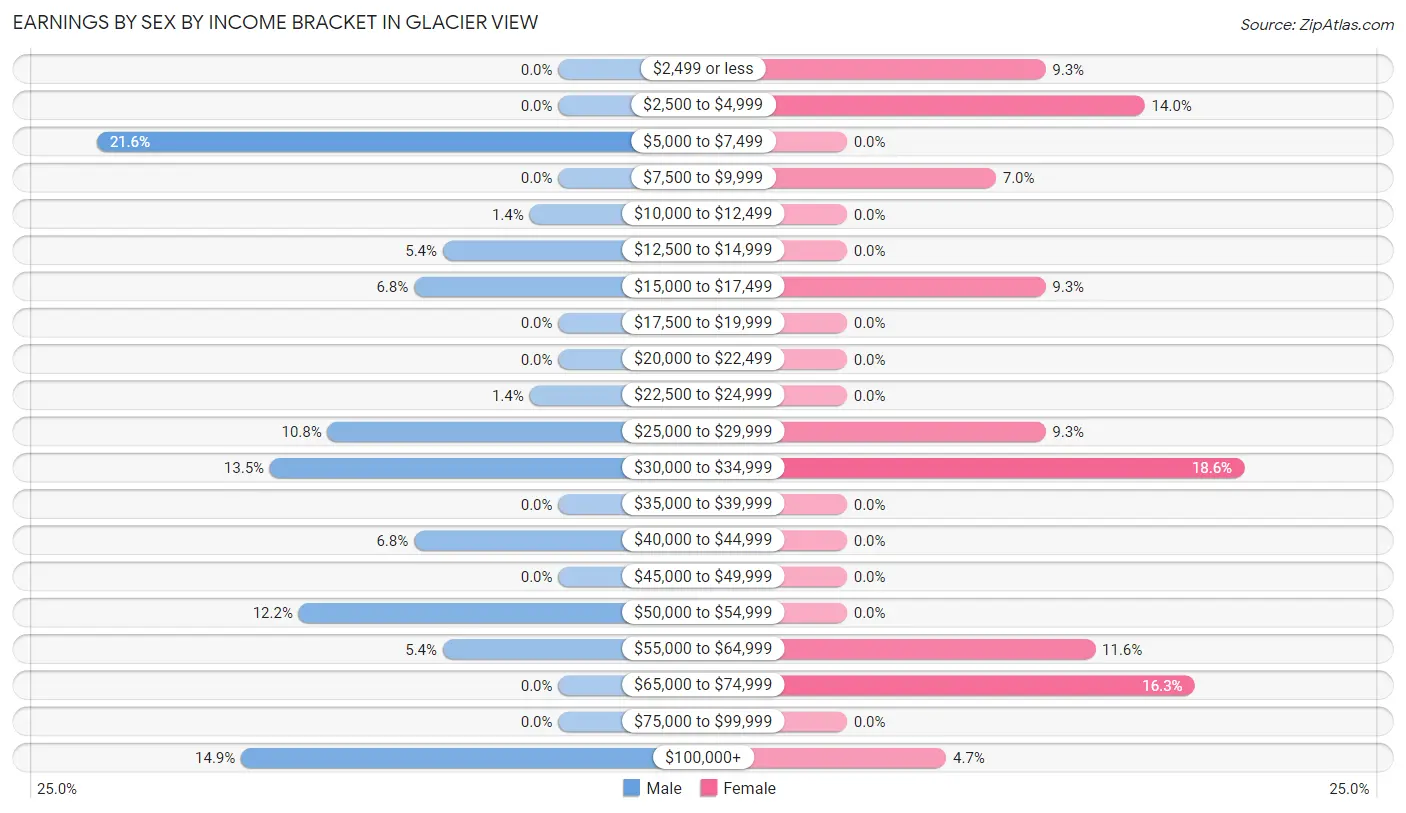
Earnings by Sex by Income Bracket in Glacier View
The most common earnings brackets in Glacier View are $5,000 to $7,499 for men (16 | 21.6%) and $30,000 to $34,999 for women (8 | 18.6%).
| Income | Male | Female |
| $2,499 or less | 0 (0.0%) | 4 (9.3%) |
| $2,500 to $4,999 | 0 (0.0%) | 6 (14.0%) |
| $5,000 to $7,499 | 16 (21.6%) | 0 (0.0%) |
| $7,500 to $9,999 | 0 (0.0%) | 3 (7.0%) |
| $10,000 to $12,499 | 1 (1.3%) | 0 (0.0%) |
| $12,500 to $14,999 | 4 (5.4%) | 0 (0.0%) |
| $15,000 to $17,499 | 5 (6.8%) | 4 (9.3%) |
| $17,500 to $19,999 | 0 (0.0%) | 0 (0.0%) |
| $20,000 to $22,499 | 0 (0.0%) | 0 (0.0%) |
| $22,500 to $24,999 | 1 (1.3%) | 0 (0.0%) |
| $25,000 to $29,999 | 8 (10.8%) | 4 (9.3%) |
| $30,000 to $34,999 | 10 (13.5%) | 8 (18.6%) |
| $35,000 to $39,999 | 0 (0.0%) | 0 (0.0%) |
| $40,000 to $44,999 | 5 (6.8%) | 0 (0.0%) |
| $45,000 to $49,999 | 0 (0.0%) | 0 (0.0%) |
| $50,000 to $54,999 | 9 (12.2%) | 0 (0.0%) |
| $55,000 to $64,999 | 4 (5.4%) | 5 (11.6%) |
| $65,000 to $74,999 | 0 (0.0%) | 7 (16.3%) |
| $75,000 to $99,999 | 0 (0.0%) | 0 (0.0%) |
| $100,000+ | 11 (14.9%) | 2 (4.6%) |
| Total | 74 (100.0%) | 43 (100.0%) |
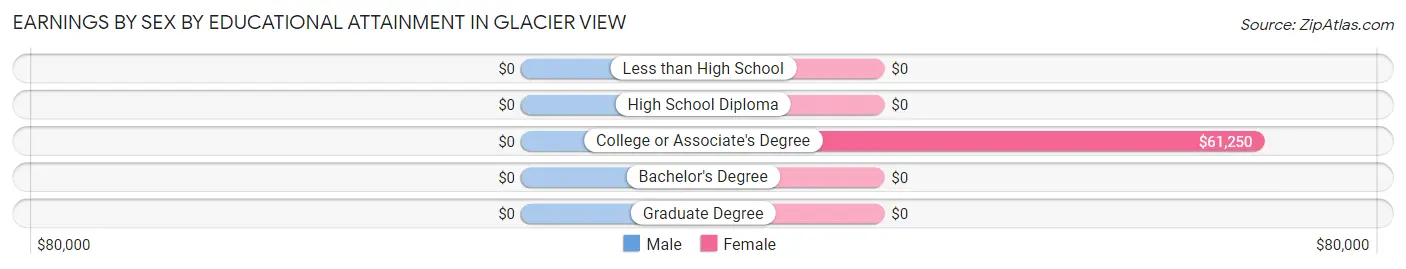
Earnings by Sex by Educational Attainment in Glacier View
| Educational Attainment | Male Income | Female Income |
| Less than High School | - | - |
| High School Diploma | - | - |
| College or Associate's Degree | - | - |
| Bachelor's Degree | - | - |
| Graduate Degree | - | - |
| Total | $32,708 | $0 |
Family Income in Glacier View
Family Income Brackets in Glacier View
According to the Glacier View family income data, there are 13 families falling into the $35,000 to $49,999 income range, which is the most common income bracket and makes up 33.3% of all families.
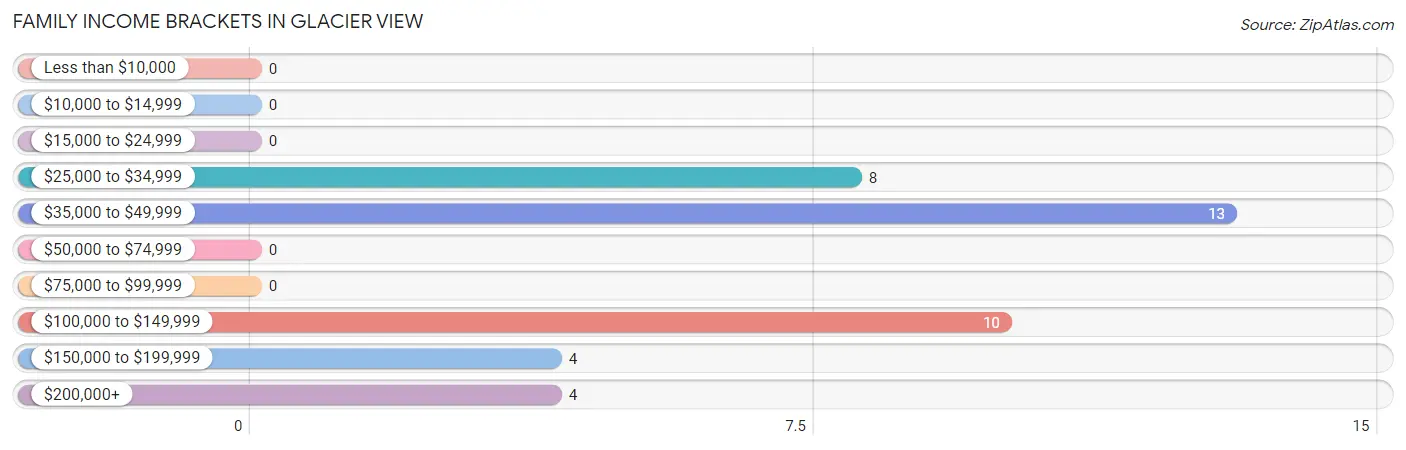
| Income Bracket | # Families | % Families |
| Less than $10,000 | 0 | 0.0% |
| $10,000 to $14,999 | 0 | 0.0% |
| $15,000 to $24,999 | 0 | 0.0% |
| $25,000 to $34,999 | 8 | 20.5% |
| $35,000 to $49,999 | 13 | 33.3% |
| $50,000 to $74,999 | 0 | 0.0% |
| $75,000 to $99,999 | 0 | 0.0% |
| $100,000 to $149,999 | 10 | 25.6% |
| $150,000 to $199,999 | 4 | 10.3% |
| $200,000+ | 4 | 10.3% |
Family Income by Famaliy Size in Glacier View
2-person families (25 | 64.1%) account for the highest median family income in Glacier View with $117,250 per family, while 2-person families (25 | 64.1%) have the highest median income of $58,625 per family member.
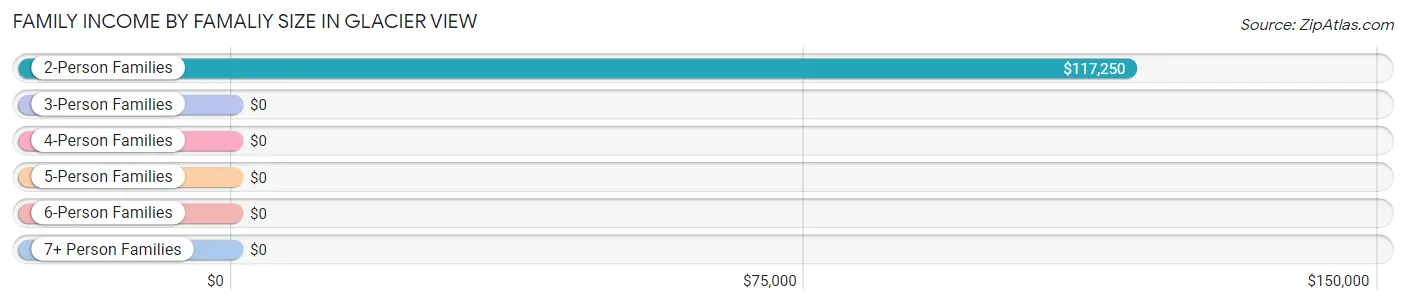
| Income Bracket | # Families | Median Income |
| 2-Person Families | 25 (64.1%) | $117,250 |
| 3-Person Families | 6 (15.4%) | $0 |
| 4-Person Families | 8 (20.5%) | $0 |
| 5-Person Families | 0 (0.0%) | $0 |
| 6-Person Families | 0 (0.0%) | $0 |
| 7+ Person Families | 0 (0.0%) | $0 |
| Total | 39 (100.0%) | $0 |
Family Income by Number of Earners in Glacier View
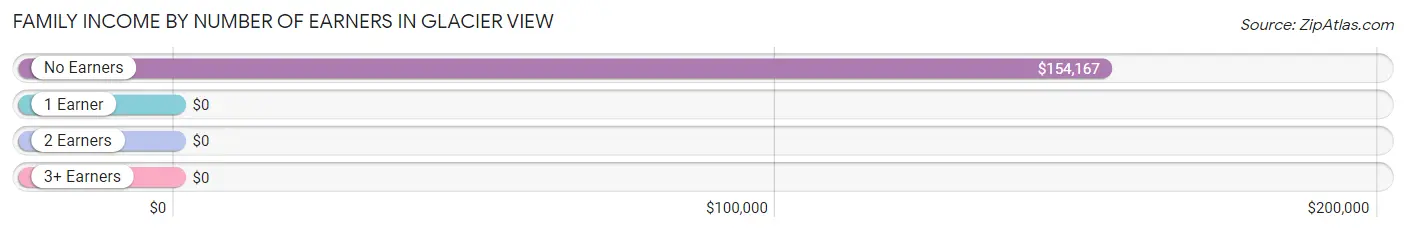
| Number of Earners | # Families | Median Income |
| No Earners | 10 (25.6%) | $154,167 |
| 1 Earner | 6 (15.4%) | $0 |
| 2 Earners | 23 (59.0%) | $0 |
| 3+ Earners | 0 (0.0%) | $0 |
| Total | 39 (100.0%) | $0 |
Household Income in Glacier View
Household Income Brackets in Glacier View
With 30 households falling in the category, the $35,000 to $49,999 income range is the most frequent in Glacier View, accounting for 24.2% of all households. In contrast, only 4 households (3.2%) fall into the $50,000 to $74,999 income bracket, making it the least populous group.
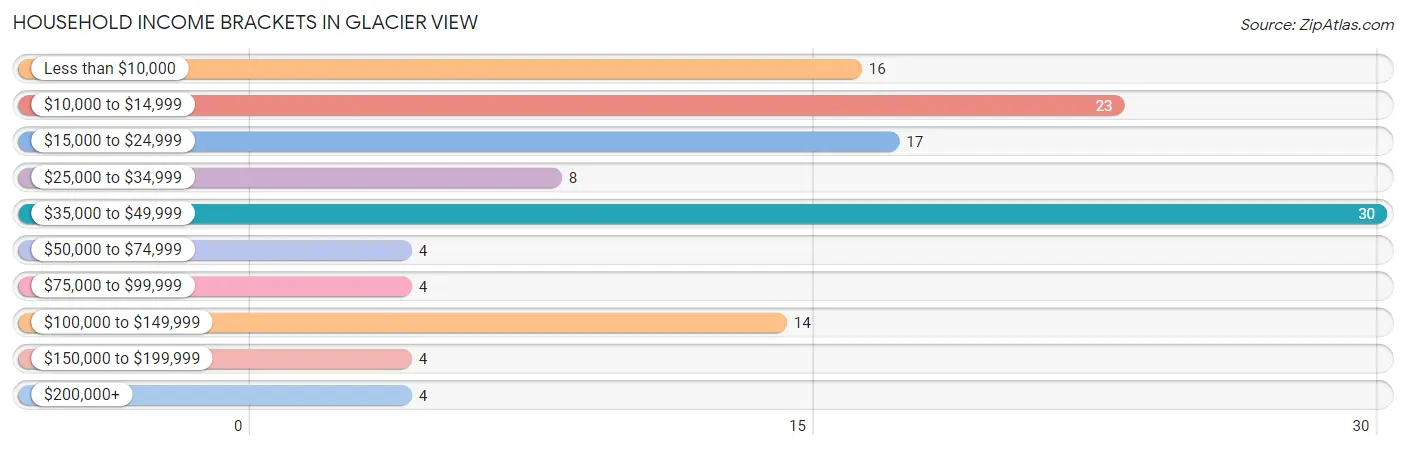
| Income Bracket | # Households | % Households |
| Less than $10,000 | 16 | 12.9% |
| $10,000 to $14,999 | 23 | 18.5% |
| $15,000 to $24,999 | 17 | 13.7% |
| $25,000 to $34,999 | 8 | 6.5% |
| $35,000 to $49,999 | 30 | 24.2% |
| $50,000 to $74,999 | 4 | 3.2% |
| $75,000 to $99,999 | 4 | 3.2% |
| $100,000 to $149,999 | 14 | 11.3% |
| $150,000 to $199,999 | 4 | 3.2% |
| $200,000+ | 4 | 3.2% |
Household Income by Householder Age in Glacier View
The median household income in Glacier View is $31,875, with the highest median household income of $45,417 found in the 45 to 64 years age bracket for the primary householder. A total of 25 households (20.2%) fall into this category. Meanwhile, the 15 to 24 years age bracket for the primary householder has the lowest median household income of $0, with 5 households (4.0%) in this group.
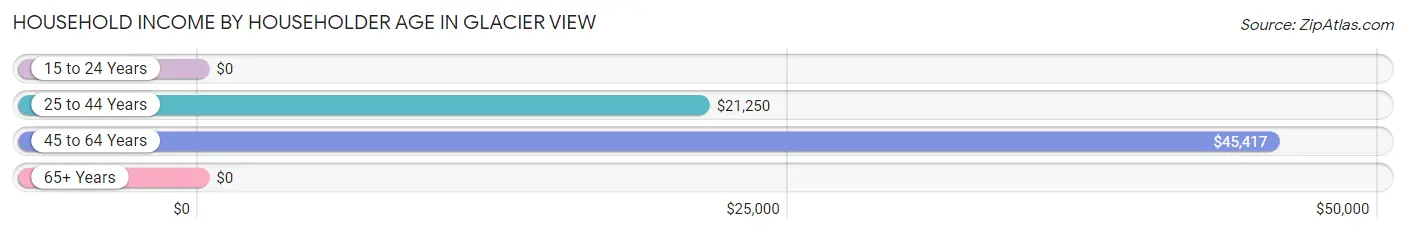
| Income Bracket | # Households | Median Income |
| 15 to 24 Years | 5 (4.0%) | $0 |
| 25 to 44 Years | 40 (32.3%) | $21,250 |
| 45 to 64 Years | 25 (20.2%) | $45,417 |
| 65+ Years | 54 (43.5%) | $0 |
| Total | 124 (100.0%) | $31,875 |
Poverty in Glacier View
Income Below Poverty by Sex and Age in Glacier View
With 11.5% poverty level for males and 23.3% for females among the residents of Glacier View, 35 to 44 year old males and 65 to 74 year old females are the most vulnerable to poverty, with 11 males (36.7%) and 28 females (75.7%) in their respective age groups living below the poverty level.
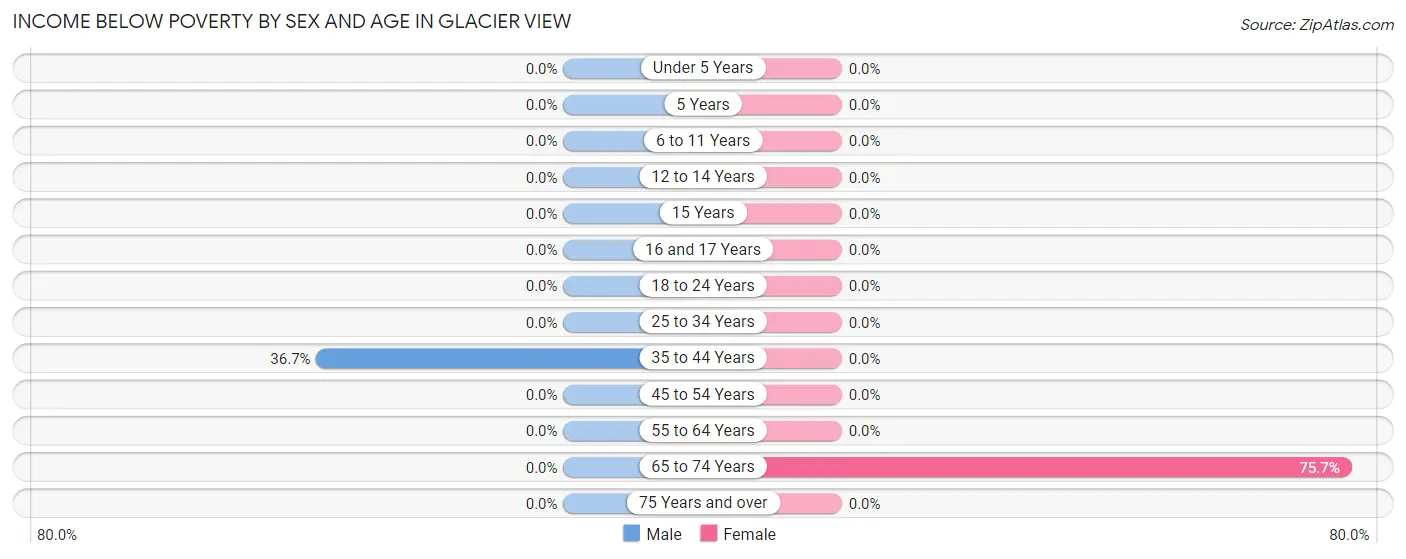
| Age Bracket | Male | Female |
| Under 5 Years | 0 (0.0%) | 0 (0.0%) |
| 5 Years | 0 (0.0%) | 0 (0.0%) |
| 6 to 11 Years | 0 (0.0%) | 0 (0.0%) |
| 12 to 14 Years | 0 (0.0%) | 0 (0.0%) |
| 15 Years | 0 (0.0%) | 0 (0.0%) |
| 16 and 17 Years | 0 (0.0%) | 0 (0.0%) |
| 18 to 24 Years | 0 (0.0%) | 0 (0.0%) |
| 25 to 34 Years | 0 (0.0%) | 0 (0.0%) |
| 35 to 44 Years | 11 (36.7%) | 0 (0.0%) |
| 45 to 54 Years | 0 (0.0%) | 0 (0.0%) |
| 55 to 64 Years | 0 (0.0%) | 0 (0.0%) |
| 65 to 74 Years | 0 (0.0%) | 28 (75.7%) |
| 75 Years and over | 0 (0.0%) | 0 (0.0%) |
| Total | 11 (11.5%) | 28 (23.3%) |
Income Above Poverty by Sex and Age in Glacier View
According to the poverty statistics in Glacier View, males aged 16 and 17 years and females aged under 5 years are the age groups that are most secure financially, with 100.0% of males and 100.0% of females in these age groups living above the poverty line.
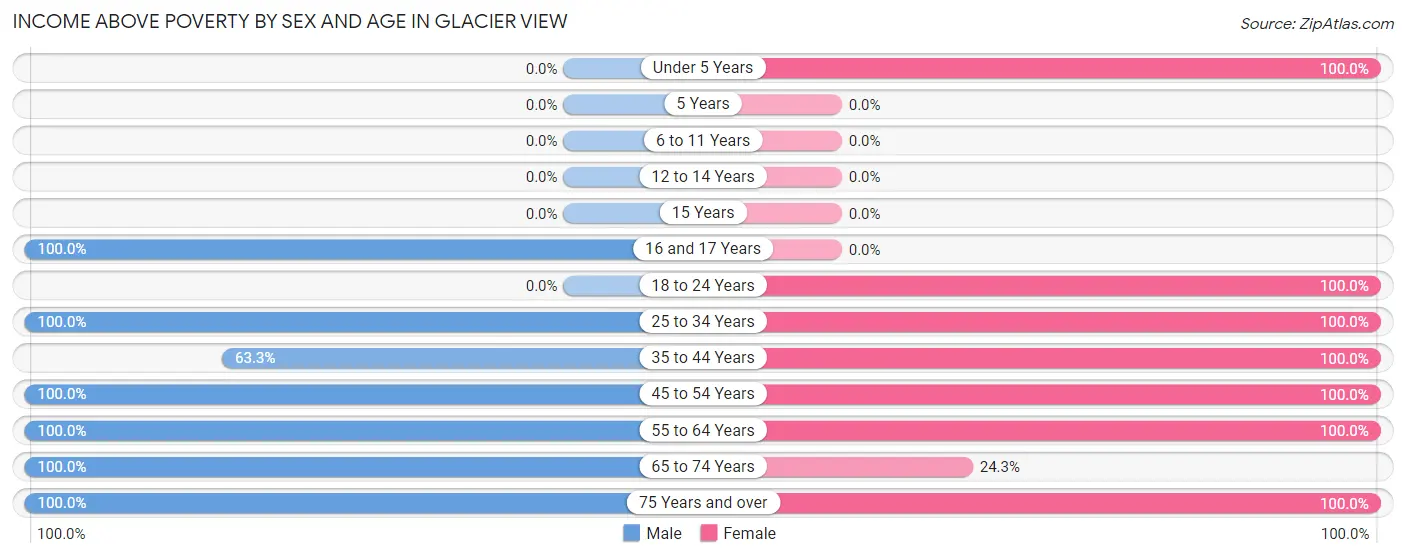
| Age Bracket | Male | Female |
| Under 5 Years | 0 (0.0%) | 19 (100.0%) |
| 5 Years | 0 (0.0%) | 0 (0.0%) |
| 6 to 11 Years | 0 (0.0%) | 0 (0.0%) |
| 12 to 14 Years | 0 (0.0%) | 0 (0.0%) |
| 15 Years | 0 (0.0%) | 0 (0.0%) |
| 16 and 17 Years | 5 (100.0%) | 0 (0.0%) |
| 18 to 24 Years | 0 (0.0%) | 8 (100.0%) |
| 25 to 34 Years | 15 (100.0%) | 11 (100.0%) |
| 35 to 44 Years | 19 (63.3%) | 14 (100.0%) |
| 45 to 54 Years | 5 (100.0%) | 5 (100.0%) |
| 55 to 64 Years | 25 (100.0%) | 12 (100.0%) |
| 65 to 74 Years | 10 (100.0%) | 9 (24.3%) |
| 75 Years and over | 6 (100.0%) | 14 (100.0%) |
| Total | 85 (88.5%) | 92 (76.7%) |
Income Below Poverty Among Married-Couple Families in Glacier View
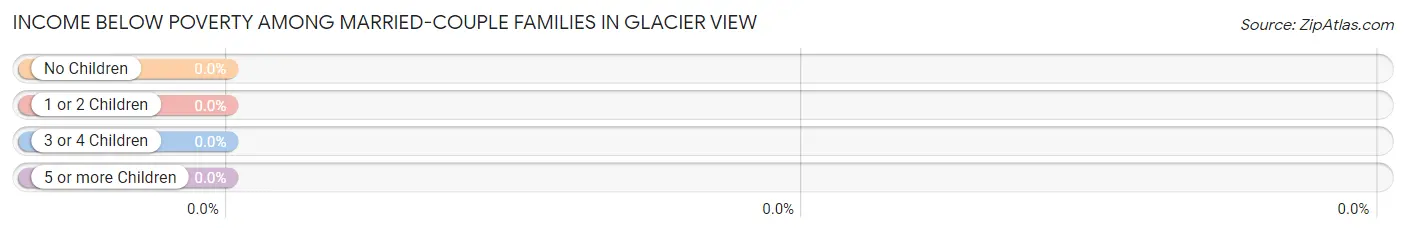
| Children | Above Poverty | Below Poverty |
| No Children | 20 (100.0%) | 0 (0.0%) |
| 1 or 2 Children | 14 (100.0%) | 0 (0.0%) |
| 3 or 4 Children | 0 (0.0%) | 0 (0.0%) |
| 5 or more Children | 0 (0.0%) | 0 (0.0%) |
| Total | 34 (100.0%) | 0 (0.0%) |
Income Below Poverty Among Single-Parent Households in Glacier View
| Children | Single Father | Single Mother |
| No Children | 0 (0.0%) | 0 (0.0%) |
| 1 or 2 Children | 0 (0.0%) | 0 (0.0%) |
| 3 or 4 Children | 0 (0.0%) | 0 (0.0%) |
| 5 or more Children | 0 (0.0%) | 0 (0.0%) |
| Total | 0 (0.0%) | 0 (0.0%) |
Income Below Poverty Among Married-Couple vs Single-Parent Households in Glacier View
| Children | Married-Couple Families | Single-Parent Households |
| No Children | 0 (0.0%) | 0 (0.0%) |
| 1 or 2 Children | 0 (0.0%) | 0 (0.0%) |
| 3 or 4 Children | 0 (0.0%) | 0 (0.0%) |
| 5 or more Children | 0 (0.0%) | 0 (0.0%) |
| Total | 0 (0.0%) | 0 (0.0%) |
Race in Glacier View
The most populous races in Glacier View are White / Caucasian (200 | 92.6%), Hispanic or Latino (22 | 10.2%), and Asian (7 | 3.2%).
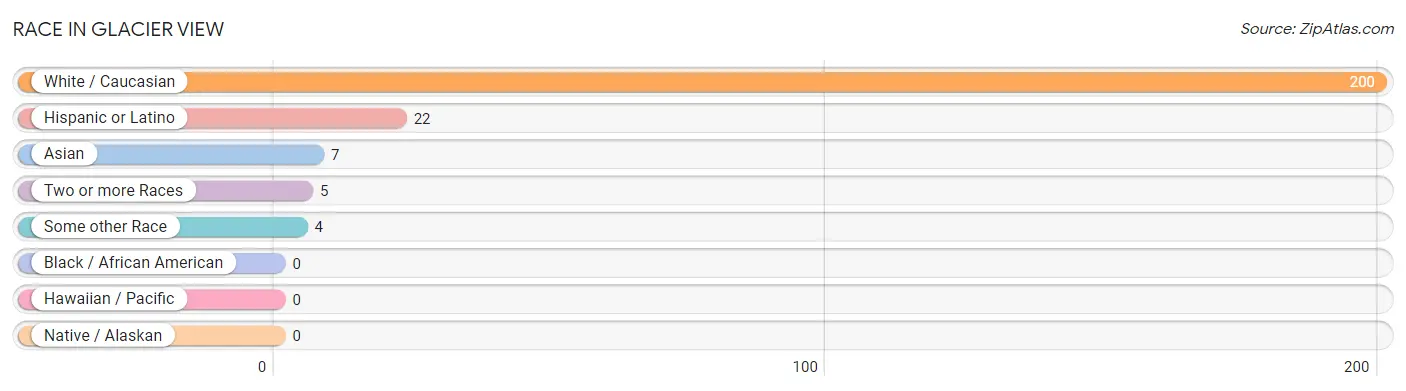
| Race | # Population | % Population |
| Asian | 7 | 3.2% |
| Black / African American | 0 | 0.0% |
| Hawaiian / Pacific | 0 | 0.0% |
| Hispanic or Latino | 22 | 10.2% |
| Native / Alaskan | 0 | 0.0% |
| White / Caucasian | 200 | 92.6% |
| Two or more Races | 5 | 2.3% |
| Some other Race | 4 | 1.8% |
| Total | 216 | 100.0% |
Ancestry in Glacier View
The most populous ancestries reported in Glacier View are German (66 | 30.6%), European (23 | 10.6%), English (11 | 5.1%), Irish (9 | 4.2%), and Mexican (9 | 4.2%), together accounting for 54.6% of all Glacier View residents.
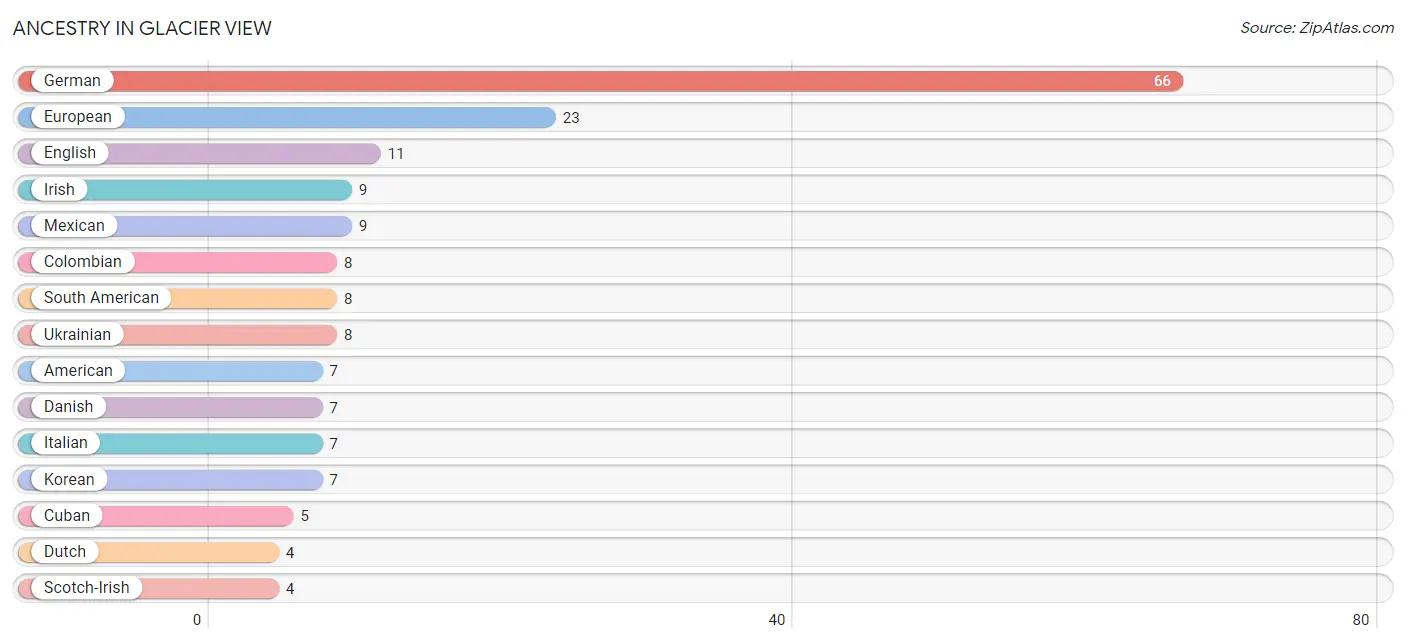
| Ancestry | # Population | % Population |
| American | 7 | 3.2% |
| Colombian | 8 | 3.7% |
| Cuban | 5 | 2.3% |
| Danish | 7 | 3.2% |
| Dutch | 4 | 1.8% |
| English | 11 | 5.1% |
| European | 23 | 10.6% |
| German | 66 | 30.6% |
| Irish | 9 | 4.2% |
| Italian | 7 | 3.2% |
| Korean | 7 | 3.2% |
| Lithuanian | 3 | 1.4% |
| Mexican | 9 | 4.2% |
| Russian | 1 | 0.5% |
| Scotch-Irish | 4 | 1.8% |
| Scottish | 4 | 1.8% |
| South American | 8 | 3.7% |
| Swedish | 4 | 1.8% |
| Ukrainian | 8 | 3.7% |
| Welsh | 4 | 1.8% | View All 20 Rows |
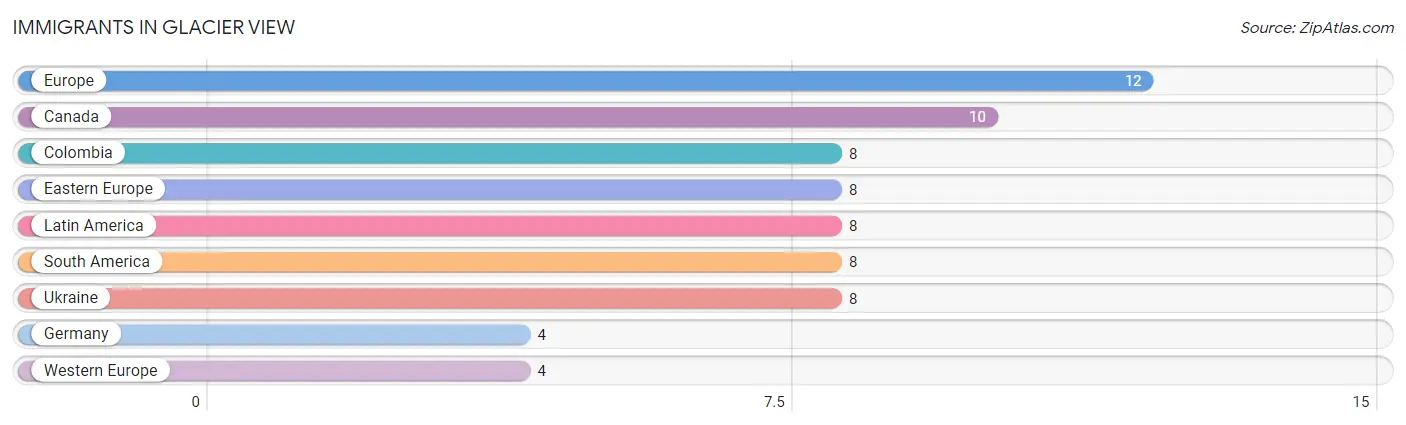
Immigrants in Glacier View
The most numerous immigrant groups reported in Glacier View came from Europe (12 | 5.6%), Canada (10 | 4.6%), Colombia (8 | 3.7%), Eastern Europe (8 | 3.7%), and Latin America (8 | 3.7%), together accounting for 21.3% of all Glacier View residents.
| Immigration Origin | # Population | % Population |
| Canada | 10 | 4.6% |
| Colombia | 8 | 3.7% |
| Eastern Europe | 8 | 3.7% |
| Europe | 12 | 5.6% |
| Germany | 4 | 1.8% |
| Latin America | 8 | 3.7% |
| South America | 8 | 3.7% |
| Ukraine | 8 | 3.7% |
| Western Europe | 4 | 1.8% | View All 9 Rows |
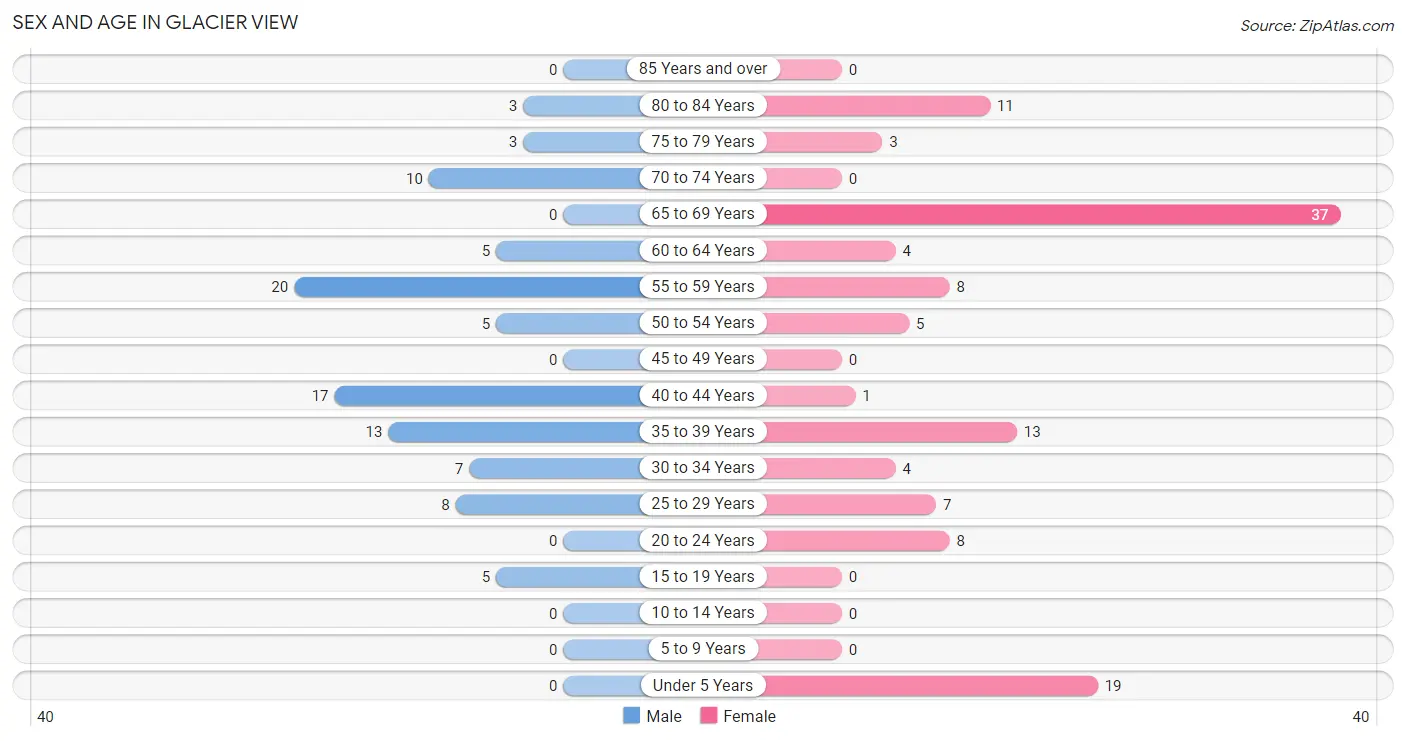
Sex and Age in Glacier View
Sex and Age in Glacier View
The most populous age groups in Glacier View are 55 to 59 Years (20 | 20.8%) for men and 65 to 69 Years (37 | 30.8%) for women.
| Age Bracket | Male | Female |
| Under 5 Years | 0 (0.0%) | 19 (15.8%) |
| 5 to 9 Years | 0 (0.0%) | 0 (0.0%) |
| 10 to 14 Years | 0 (0.0%) | 0 (0.0%) |
| 15 to 19 Years | 5 (5.2%) | 0 (0.0%) |
| 20 to 24 Years | 0 (0.0%) | 8 (6.7%) |
| 25 to 29 Years | 8 (8.3%) | 7 (5.8%) |
| 30 to 34 Years | 7 (7.3%) | 4 (3.3%) |
| 35 to 39 Years | 13 (13.5%) | 13 (10.8%) |
| 40 to 44 Years | 17 (17.7%) | 1 (0.8%) |
| 45 to 49 Years | 0 (0.0%) | 0 (0.0%) |
| 50 to 54 Years | 5 (5.2%) | 5 (4.2%) |
| 55 to 59 Years | 20 (20.8%) | 8 (6.7%) |
| 60 to 64 Years | 5 (5.2%) | 4 (3.3%) |
| 65 to 69 Years | 0 (0.0%) | 37 (30.8%) |
| 70 to 74 Years | 10 (10.4%) | 0 (0.0%) |
| 75 to 79 Years | 3 (3.1%) | 3 (2.5%) |
| 80 to 84 Years | 3 (3.1%) | 11 (9.2%) |
| 85 Years and over | 0 (0.0%) | 0 (0.0%) |
| Total | 96 (100.0%) | 120 (100.0%) |
Families and Households in Glacier View
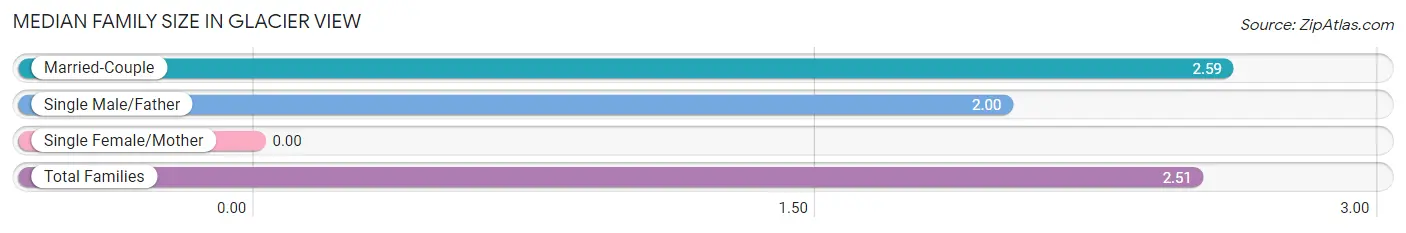
Median Family Size in Glacier View
| Family Type | # Families | Family Size |
| Married-Couple | 34 (87.2%) | 2.59 |
| Single Male/Father | 5 (12.8%) | 2.00 |
| Single Female/Mother | 0 (0.0%) | - |
| Total Families | 39 (100.0%) | 2.51 |
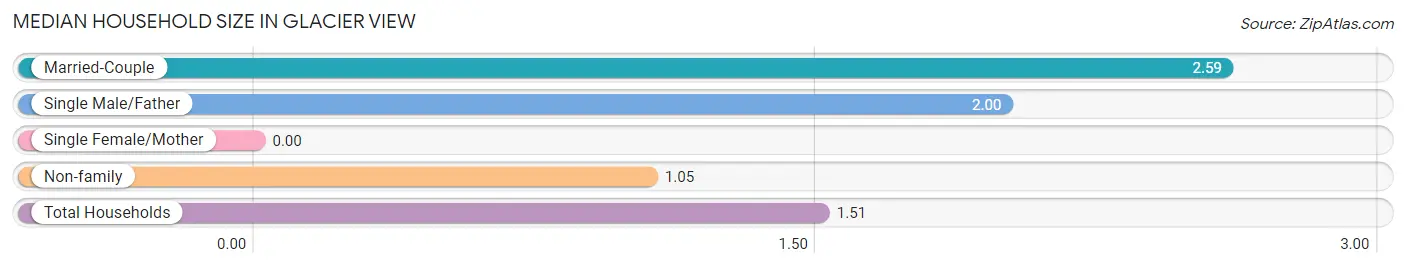
Median Household Size in Glacier View
| Household Type | # Households | Household Size |
| Married-Couple | 34 (27.4%) | 2.59 |
| Single Male/Father | 5 (4.0%) | 2.00 |
| Single Female/Mother | 0 (0.0%) | - |
| Non-family | 85 (68.5%) | 1.05 |
| Total Households | 124 (100.0%) | 1.51 |
Household Size by Marriage Status in Glacier View
Out of a total of 124 households in Glacier View, 39 (31.5%) are family households, while 85 (68.5%) are nonfamily households. The most numerous type of family households are 2-person households, comprising 25, and the most common type of nonfamily households are 1-person households, comprising 81.
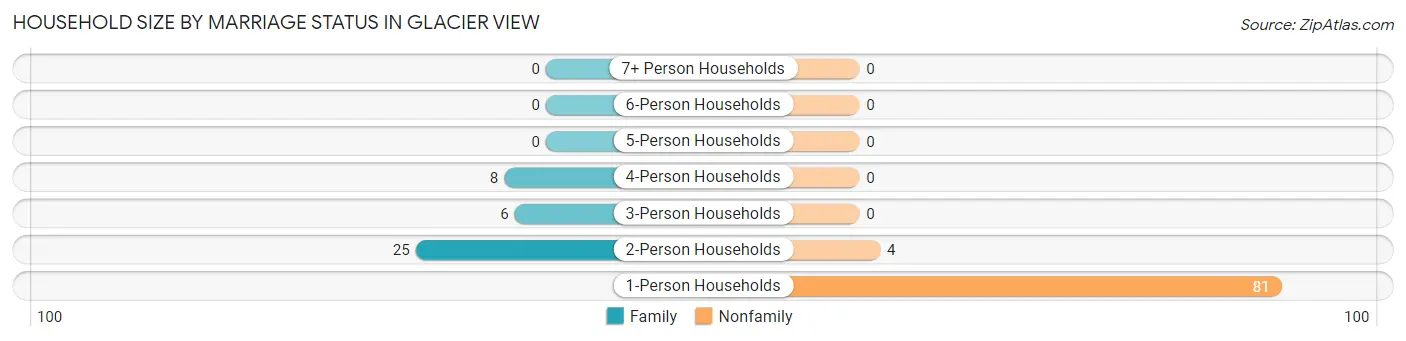
| Household Size | Family Households | Nonfamily Households |
| 1-Person Households | - | 81 (65.3%) |
| 2-Person Households | 25 (20.2%) | 4 (3.2%) |
| 3-Person Households | 6 (4.8%) | 0 (0.0%) |
| 4-Person Households | 8 (6.5%) | 0 (0.0%) |
| 5-Person Households | 0 (0.0%) | 0 (0.0%) |
| 6-Person Households | 0 (0.0%) | 0 (0.0%) |
| 7+ Person Households | 0 (0.0%) | 0 (0.0%) |
| Total | 39 (31.5%) | 85 (68.5%) |
Female Fertility in Glacier View
Fertility by Age in Glacier View
| Age Bracket | Women with Births | Births / 1,000 Women |
| 15 to 19 years | 0 (0.0%) | 0.0 |
| 20 to 34 years | 0 (0.0%) | 0.0 |
| 35 to 50 years | 0 (0.0%) | 0.0 |
| Total | 0 (0.0%) | 0.0 |
Fertility by Age by Marriage Status in Glacier View
| Age Bracket | Married | Unmarried |
| 15 to 19 years | 0 (0.0%) | 0 (0.0%) |
| 20 to 34 years | 0 (0.0%) | 0 (0.0%) |
| 35 to 50 years | 0 (0.0%) | 0 (0.0%) |
| Total | 0 (0.0%) | 0 (0.0%) |
Fertility by Education in Glacier View
| Educational Attainment | Women with Births | Births / 1,000 Women |
| Less than High School | 0 (0.0%) | 0.0 |
| High School Diploma | 0 (0.0%) | 0.0 |
| College or Associate's Degree | 0 (0.0%) | 0.0 |
| Bachelor's Degree | 0 (0.0%) | 0.0 |
| Graduate Degree | 0 (0.0%) | 0.0 |
| Total | 0 (0.0%) | 0.0 |
Fertility by Education by Marriage Status in Glacier View
| Educational Attainment | Married | Unmarried |
| Less than High School | 0 (0.0%) | 0 (0.0%) |
| High School Diploma | 0 (0.0%) | 0 (0.0%) |
| College or Associate's Degree | 0 (0.0%) | 0 (0.0%) |
| Bachelor's Degree | 0 (0.0%) | 0 (0.0%) |
| Graduate Degree | 0 (0.0%) | 0 (0.0%) |
| Total | 0 (0.0%) | 0 (0.0%) |
Employment Characteristics in Glacier View
Employment by Class of Employer in Glacier View
Among the 99 employed individuals in Glacier View, private company employees (51 | 51.5%), not-for-profit organizations (34 | 34.3%), and local government employees (6 | 6.1%) make up the most common classes of employment.
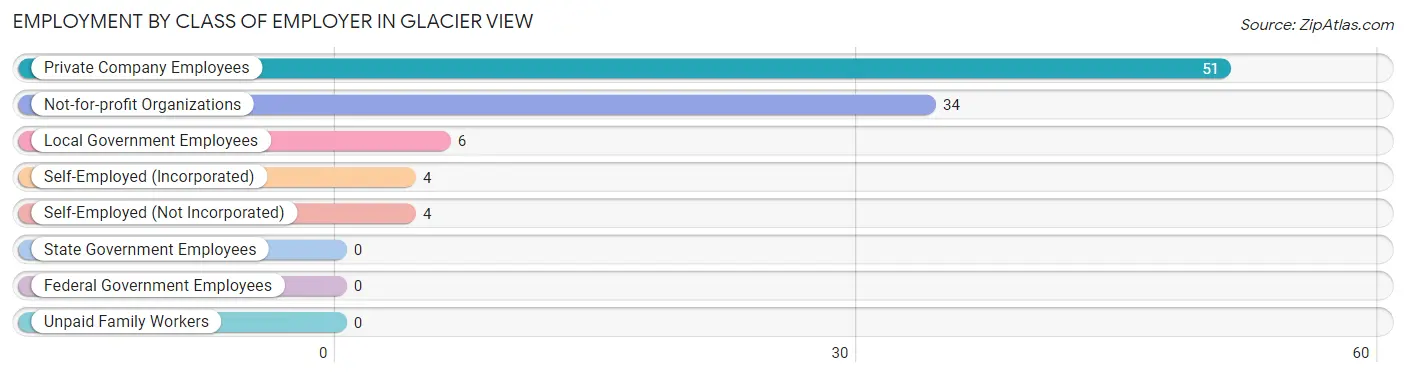
| Employer Class | # Employees | % Employees |
| Private Company Employees | 51 | 51.5% |
| Self-Employed (Incorporated) | 4 | 4.0% |
| Self-Employed (Not Incorporated) | 4 | 4.0% |
| Not-for-profit Organizations | 34 | 34.3% |
| Local Government Employees | 6 | 6.1% |
| State Government Employees | 0 | 0.0% |
| Federal Government Employees | 0 | 0.0% |
| Unpaid Family Workers | 0 | 0.0% |
| Total | 99 | 100.0% |
Employment Status by Age in Glacier View
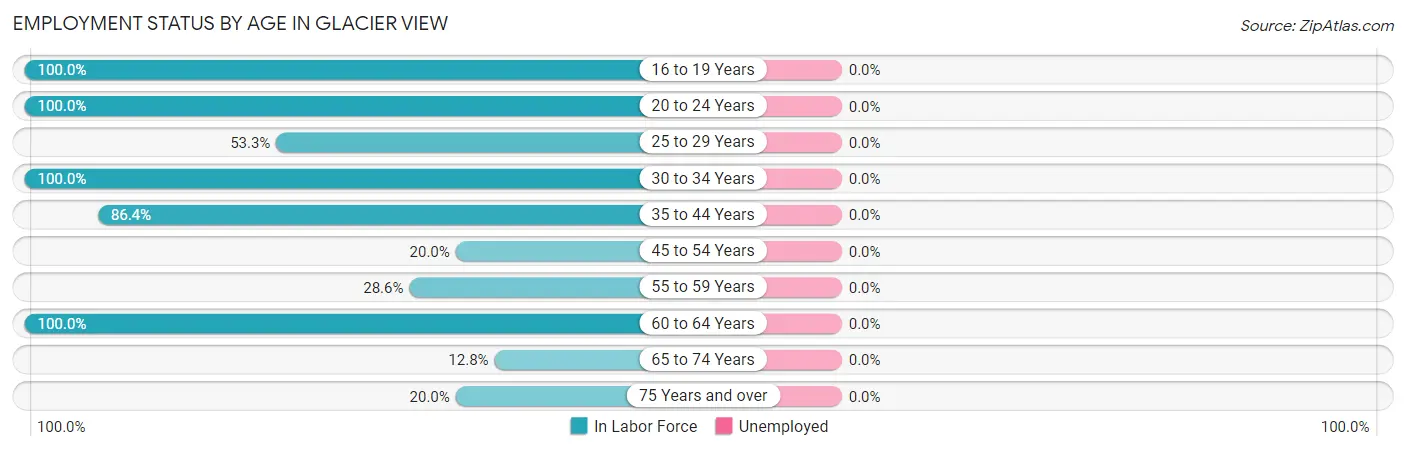
| Age Bracket | In Labor Force | Unemployed |
| 16 to 19 Years | 5 (100.0%) | 0 (0.0%) |
| 20 to 24 Years | 8 (100.0%) | 0 (0.0%) |
| 25 to 29 Years | 8 (53.3%) | 0 (0.0%) |
| 30 to 34 Years | 11 (100.0%) | 0 (0.0%) |
| 35 to 44 Years | 38 (86.4%) | 0 (0.0%) |
| 45 to 54 Years | 2 (20.0%) | 0 (0.0%) |
| 55 to 59 Years | 8 (28.6%) | 0 (0.0%) |
| 60 to 64 Years | 9 (100.0%) | 0 (0.0%) |
| 65 to 74 Years | 6 (12.8%) | 0 (0.0%) |
| 75 Years and over | 4 (20.0%) | 0 (0.0%) |
| Total | 99 (50.3%) | 0 (0.0%) |
Employment Status by Educational Attainment in Glacier View
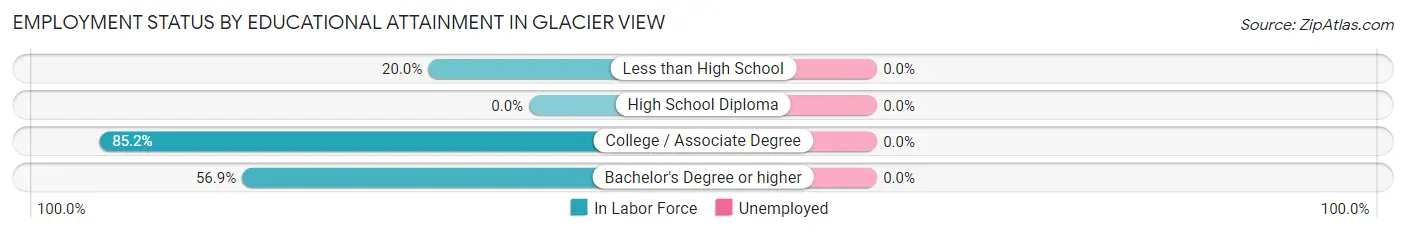
| Educational Attainment | In Labor Force | Unemployed |
| Less than High School | 1 (20.0%) | 0 (0.0%) |
| High School Diploma | 0 (0.0%) | 0 (0.0%) |
| College / Associate Degree | 46 (85.2%) | 0 (0.0%) |
| Bachelor's Degree or higher | 29 (56.9%) | 0 (0.0%) |
| Total | 76 (65.0%) | 0 (0.0%) |
Employment Occupations by Sex in Glacier View
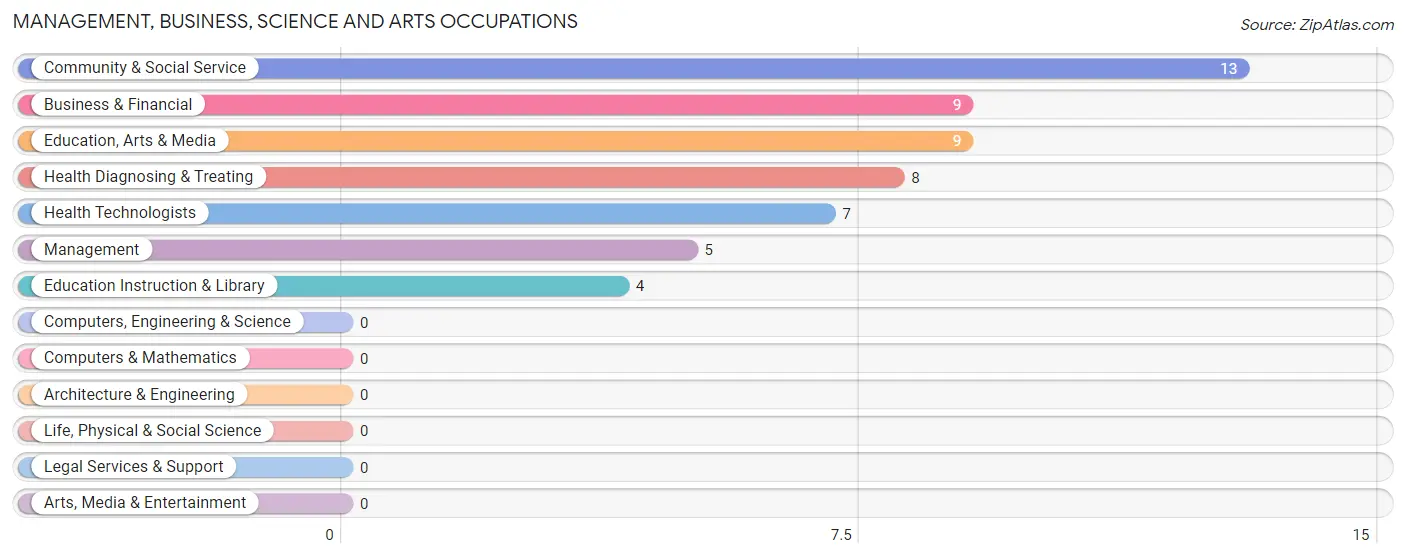
Management, Business, Science and Arts Occupations
The most common Management, Business, Science and Arts occupations in Glacier View are Community & Social Service (13 | 13.1%), Business & Financial (9 | 9.1%), Education, Arts & Media (9 | 9.1%), Health Diagnosing & Treating (8 | 8.1%), and Health Technologists (7 | 7.1%).
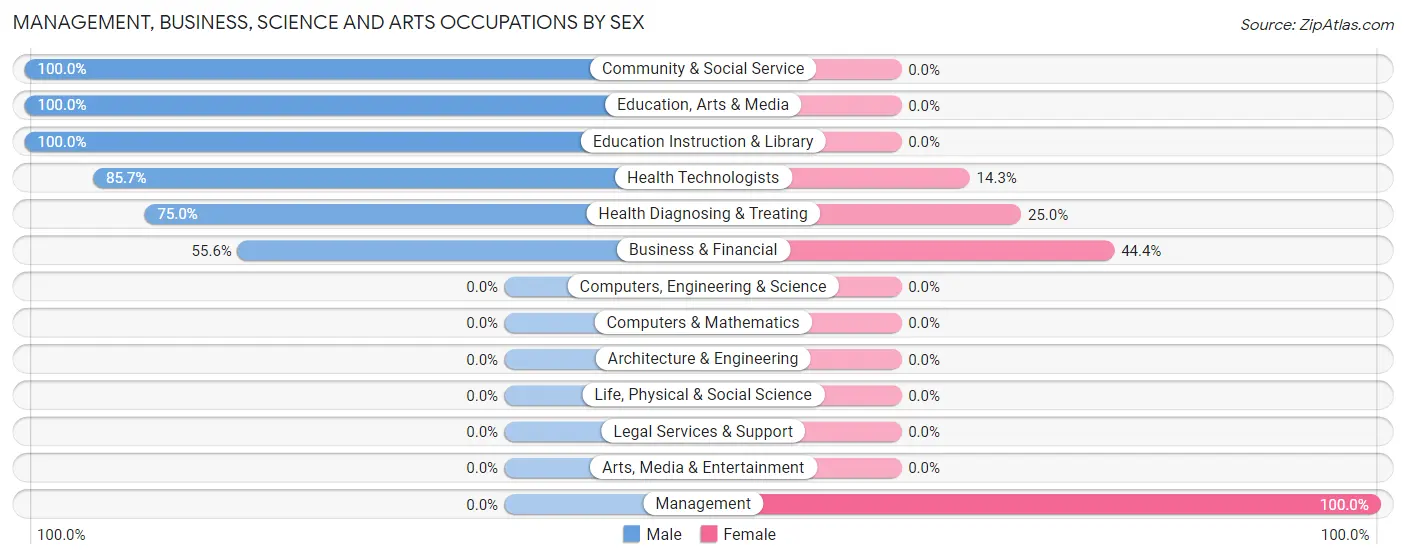
Management, Business, Science and Arts Occupations by Sex
Within the Management, Business, Science and Arts occupations in Glacier View, the most male-oriented occupations are Community & Social Service (100.0%), Education, Arts & Media (100.0%), and Education Instruction & Library (100.0%), while the most female-oriented occupations are Management (100.0%), Business & Financial (44.4%), and Health Diagnosing & Treating (25.0%).
| Occupation | Male | Female |
| Management | 0 (0.0%) | 5 (100.0%) |
| Business & Financial | 5 (55.6%) | 4 (44.4%) |
| Computers, Engineering & Science | 0 (0.0%) | 0 (0.0%) |
| Computers & Mathematics | 0 (0.0%) | 0 (0.0%) |
| Architecture & Engineering | 0 (0.0%) | 0 (0.0%) |
| Life, Physical & Social Science | 0 (0.0%) | 0 (0.0%) |
| Community & Social Service | 13 (100.0%) | 0 (0.0%) |
| Education, Arts & Media | 9 (100.0%) | 0 (0.0%) |
| Legal Services & Support | 0 (0.0%) | 0 (0.0%) |
| Education Instruction & Library | 4 (100.0%) | 0 (0.0%) |
| Arts, Media & Entertainment | 0 (0.0%) | 0 (0.0%) |
| Health Diagnosing & Treating | 6 (75.0%) | 2 (25.0%) |
| Health Technologists | 6 (85.7%) | 1 (14.3%) |
| Total (Category) | 24 (68.6%) | 11 (31.4%) |
| Total (Overall) | 69 (69.7%) | 30 (30.3%) |
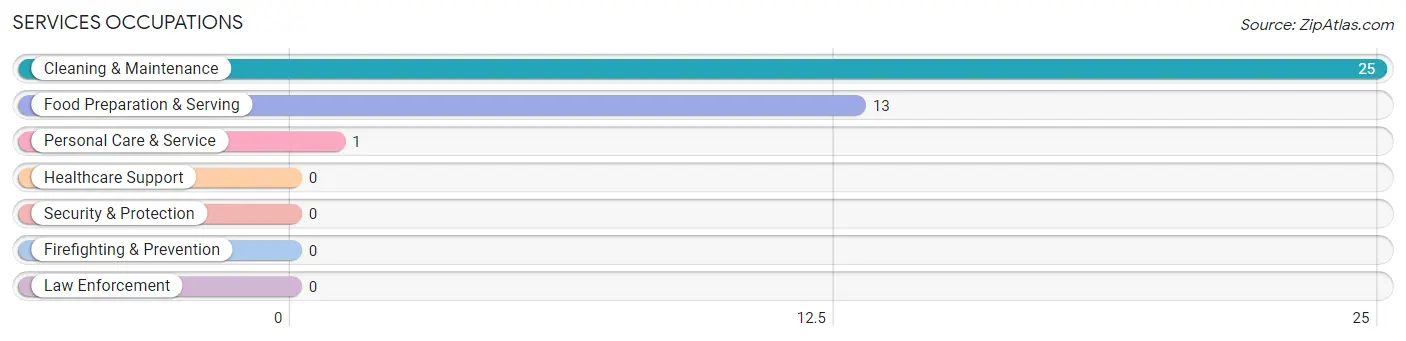
Services Occupations
The most common Services occupations in Glacier View are Cleaning & Maintenance (25 | 25.3%), Food Preparation & Serving (13 | 13.1%), and Personal Care & Service (1 | 1.0%).
Services Occupations by Sex
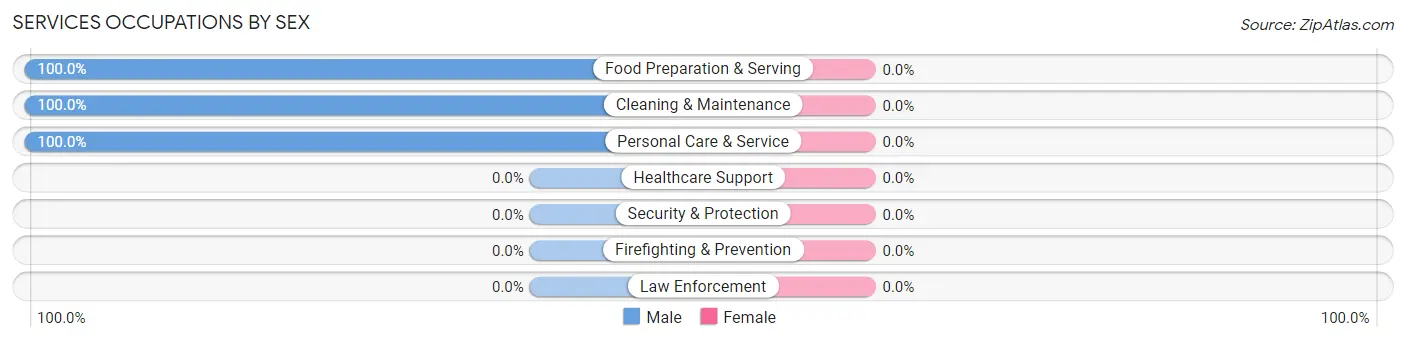
| Occupation | Male | Female |
| Healthcare Support | 0 (0.0%) | 0 (0.0%) |
| Security & Protection | 0 (0.0%) | 0 (0.0%) |
| Firefighting & Prevention | 0 (0.0%) | 0 (0.0%) |
| Law Enforcement | 0 (0.0%) | 0 (0.0%) |
| Food Preparation & Serving | 13 (100.0%) | 0 (0.0%) |
| Cleaning & Maintenance | 25 (100.0%) | 0 (0.0%) |
| Personal Care & Service | 1 (100.0%) | 0 (0.0%) |
| Total (Category) | 39 (100.0%) | 0 (0.0%) |
| Total (Overall) | 69 (69.7%) | 30 (30.3%) |
Sales and Office Occupations
The most common Sales and Office occupations in Glacier View are Office & Administration (7 | 7.1%), and Sales & Related (4 | 4.0%).
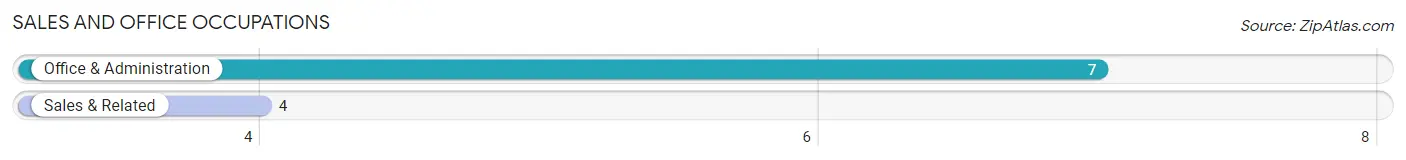
Sales and Office Occupations by Sex
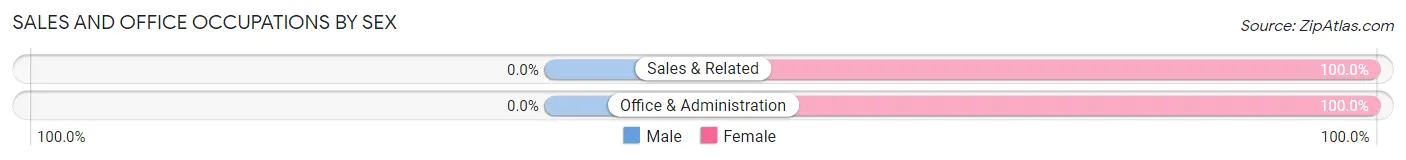
| Occupation | Male | Female |
| Sales & Related | 0 (0.0%) | 4 (100.0%) |
| Office & Administration | 0 (0.0%) | 7 (100.0%) |
| Total (Category) | 0 (0.0%) | 11 (100.0%) |
| Total (Overall) | 69 (69.7%) | 30 (30.3%) |
Natural Resources, Construction and Maintenance Occupations
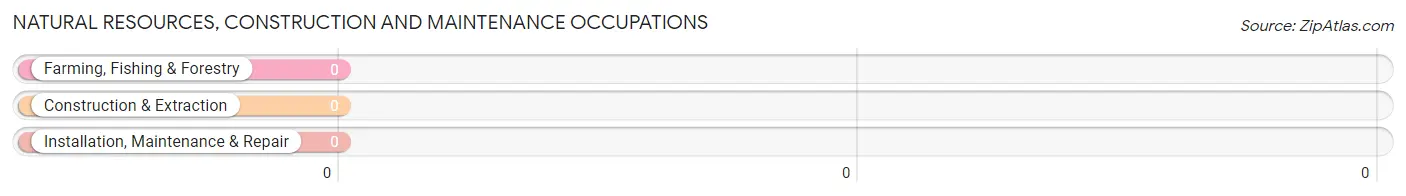
Natural Resources, Construction and Maintenance Occupations by Sex
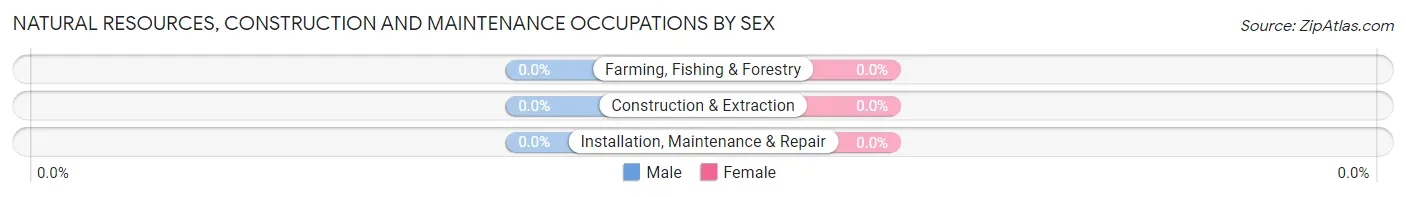
| Occupation | Male | Female |
| Farming, Fishing & Forestry | 0 (0.0%) | 0 (0.0%) |
| Construction & Extraction | 0 (0.0%) | 0 (0.0%) |
| Installation, Maintenance & Repair | 0 (0.0%) | 0 (0.0%) |
| Total (Category) | 0 (0.0%) | 0 (0.0%) |
| Total (Overall) | 69 (69.7%) | 30 (30.3%) |
Production, Transportation and Moving Occupations
The most common Production, Transportation and Moving occupations in Glacier View are Production (8 | 8.1%), and Transportation (6 | 6.1%).
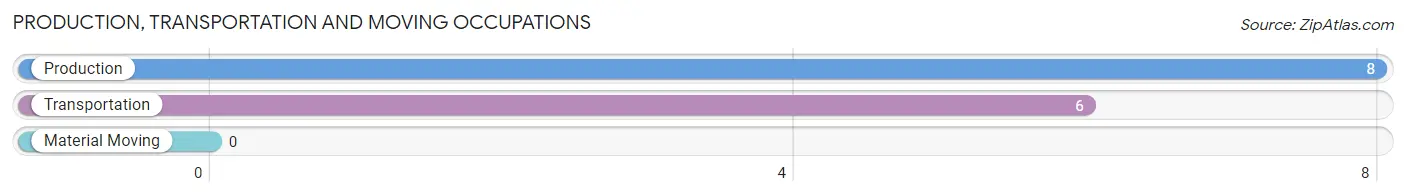
Production, Transportation and Moving Occupations by Sex
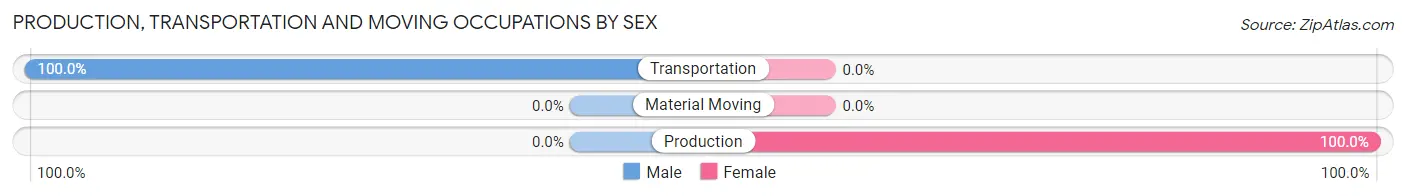
| Occupation | Male | Female |
| Production | 0 (0.0%) | 8 (100.0%) |
| Transportation | 6 (100.0%) | 0 (0.0%) |
| Material Moving | 0 (0.0%) | 0 (0.0%) |
| Total (Category) | 6 (42.9%) | 8 (57.1%) |
| Total (Overall) | 69 (69.7%) | 30 (30.3%) |
Employment Industries by Sex in Glacier View
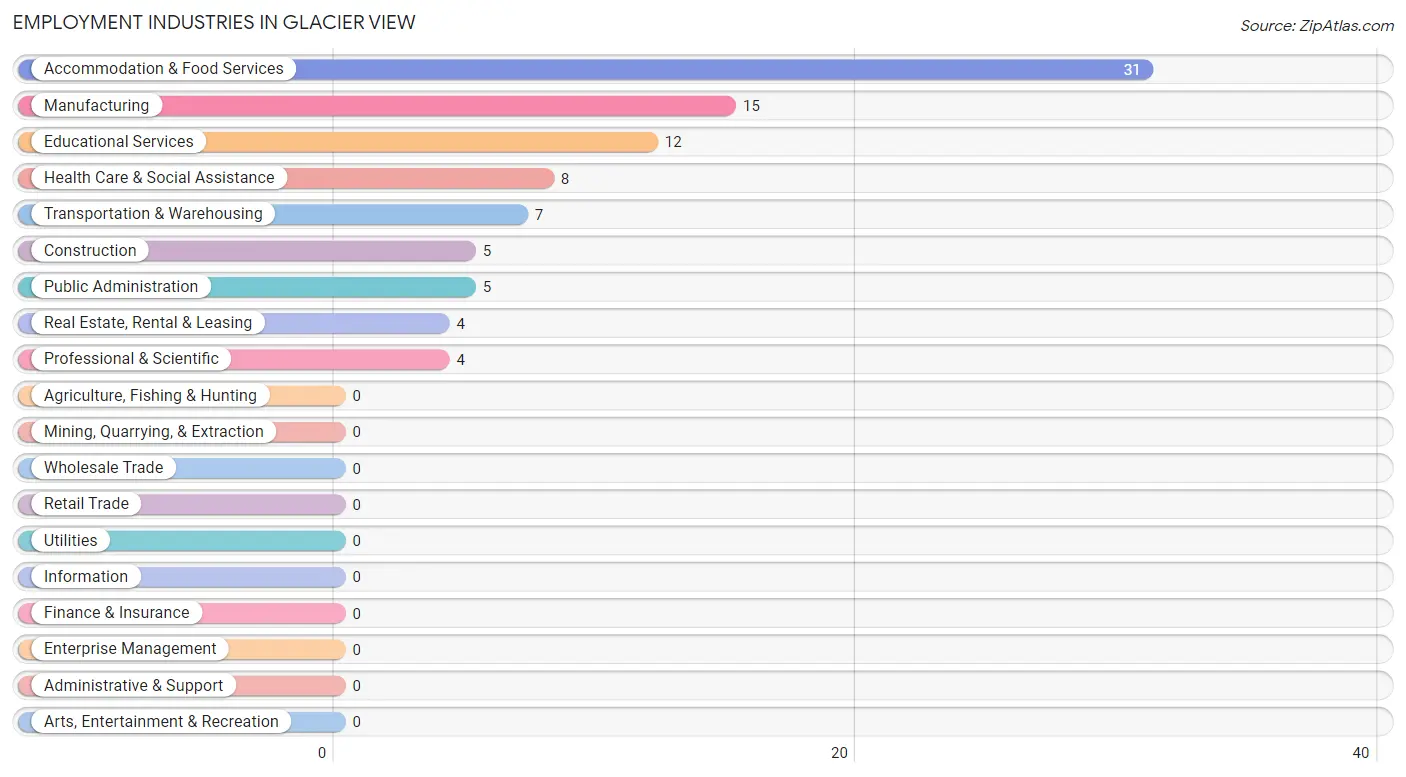
Employment Industries in Glacier View
The major employment industries in Glacier View include Accommodation & Food Services (31 | 31.3%), Manufacturing (15 | 15.1%), Educational Services (12 | 12.1%), Health Care & Social Assistance (8 | 8.1%), and Transportation & Warehousing (7 | 7.1%).
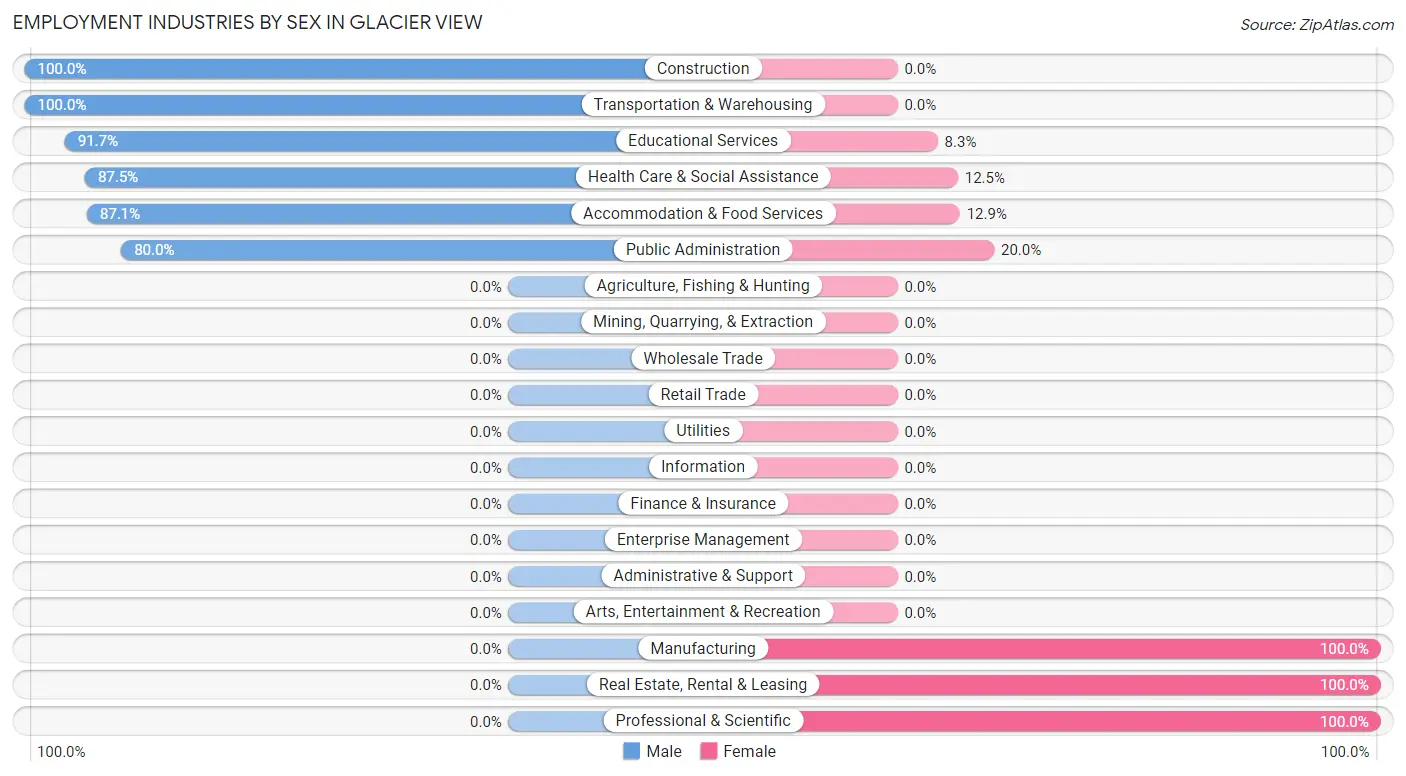
Employment Industries by Sex in Glacier View
The Glacier View industries that see more men than women are Construction (100.0%), Transportation & Warehousing (100.0%), and Educational Services (91.7%), whereas the industries that tend to have a higher number of women are Manufacturing (100.0%), Real Estate, Rental & Leasing (100.0%), and Professional & Scientific (100.0%).
| Industry | Male | Female |
| Agriculture, Fishing & Hunting | 0 (0.0%) | 0 (0.0%) |
| Mining, Quarrying, & Extraction | 0 (0.0%) | 0 (0.0%) |
| Construction | 5 (100.0%) | 0 (0.0%) |
| Manufacturing | 0 (0.0%) | 15 (100.0%) |
| Wholesale Trade | 0 (0.0%) | 0 (0.0%) |
| Retail Trade | 0 (0.0%) | 0 (0.0%) |
| Transportation & Warehousing | 7 (100.0%) | 0 (0.0%) |
| Utilities | 0 (0.0%) | 0 (0.0%) |
| Information | 0 (0.0%) | 0 (0.0%) |
| Finance & Insurance | 0 (0.0%) | 0 (0.0%) |
| Real Estate, Rental & Leasing | 0 (0.0%) | 4 (100.0%) |
| Professional & Scientific | 0 (0.0%) | 4 (100.0%) |
| Enterprise Management | 0 (0.0%) | 0 (0.0%) |
| Administrative & Support | 0 (0.0%) | 0 (0.0%) |
| Educational Services | 11 (91.7%) | 1 (8.3%) |
| Health Care & Social Assistance | 7 (87.5%) | 1 (12.5%) |
| Arts, Entertainment & Recreation | 0 (0.0%) | 0 (0.0%) |
| Accommodation & Food Services | 27 (87.1%) | 4 (12.9%) |
| Public Administration | 4 (80.0%) | 1 (20.0%) |
| Total | 69 (69.7%) | 30 (30.3%) |
Education in Glacier View
School Enrollment in Glacier View
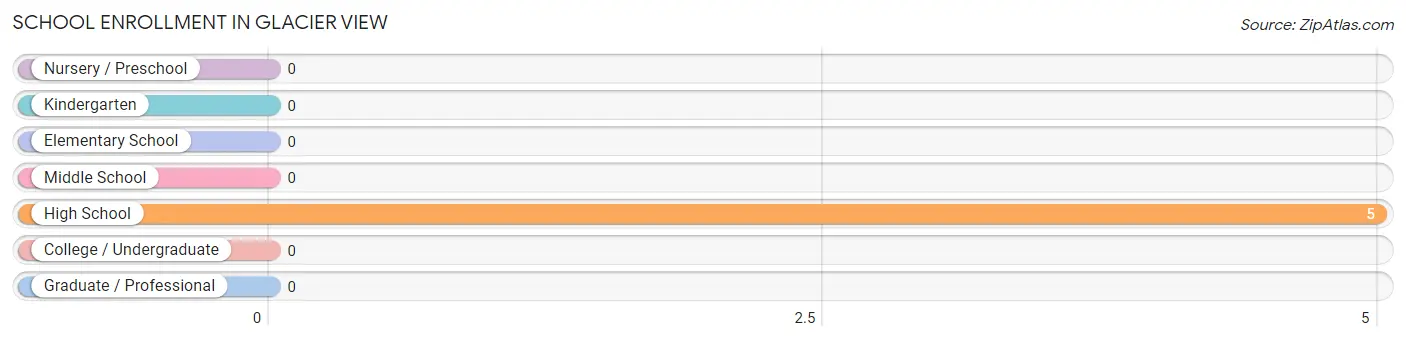
| School Level | # Students | % Students |
| Nursery / Preschool | 0 | 0.0% |
| Kindergarten | 0 | 0.0% |
| Elementary School | 0 | 0.0% |
| Middle School | 0 | 0.0% |
| High School | 5 | 100.0% |
| College / Undergraduate | 0 | 0.0% |
| Graduate / Professional | 0 | 0.0% |
| Total | 5 | 100.0% |
School Enrollment by Age by Funding Source in Glacier View
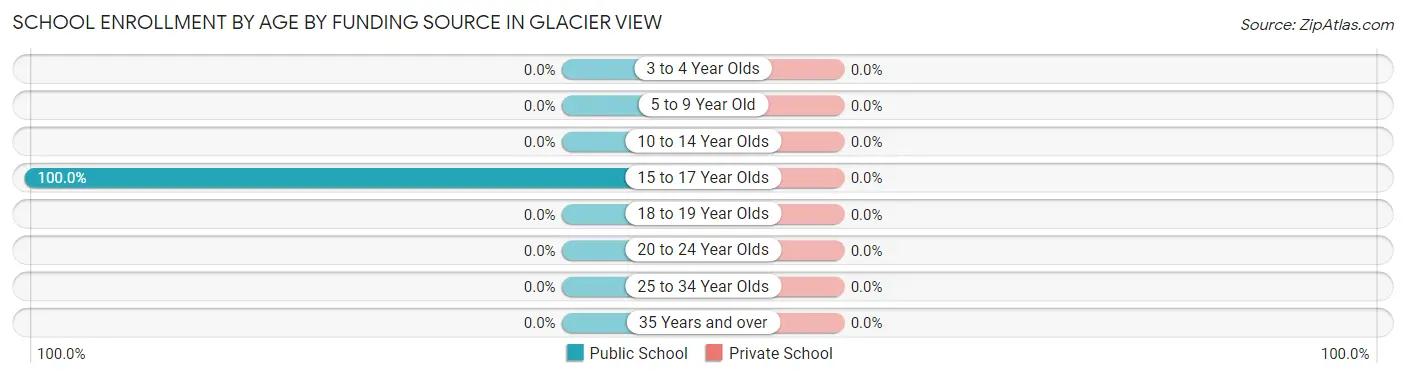
| Age Bracket | Public School | Private School |
| 3 to 4 Year Olds | 0 (0.0%) | 0 (0.0%) |
| 5 to 9 Year Old | 0 (0.0%) | 0 (0.0%) |
| 10 to 14 Year Olds | 0 (0.0%) | 0 (0.0%) |
| 15 to 17 Year Olds | 5 (100.0%) | 0 (0.0%) |
| 18 to 19 Year Olds | 0 (0.0%) | 0 (0.0%) |
| 20 to 24 Year Olds | 0 (0.0%) | 0 (0.0%) |
| 25 to 34 Year Olds | 0 (0.0%) | 0 (0.0%) |
| 35 Years and over | 0 (0.0%) | 0 (0.0%) |
| Total | 5 (100.0%) | 0 (0.0%) |
Educational Attainment by Field of Study in Glacier View
Business (21 | 28.4%), physical & health sciences (15 | 20.3%), engineering (10 | 13.5%), bio, nature & agricultural (7 | 9.5%), and science & technology (6 | 8.1%) are the most common fields of study among 74 individuals in Glacier View who have obtained a bachelor's degree or higher.
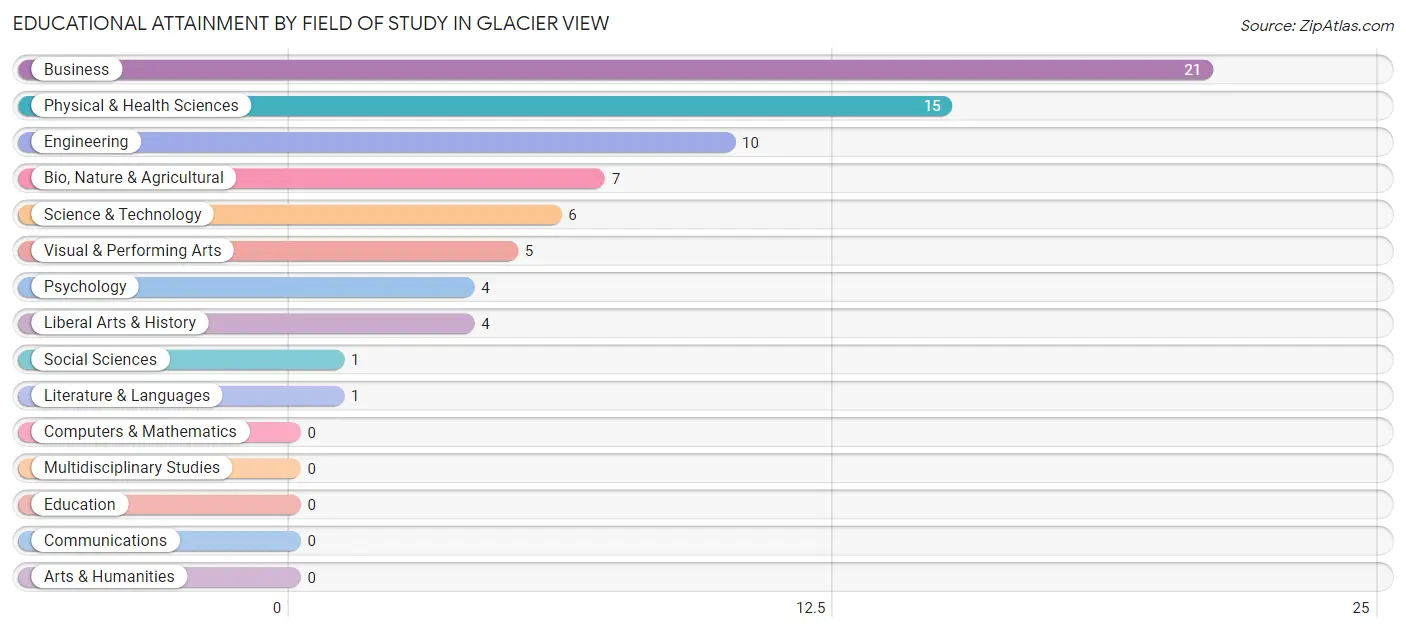
| Field of Study | # Graduates | % Graduates |
| Computers & Mathematics | 0 | 0.0% |
| Bio, Nature & Agricultural | 7 | 9.5% |
| Physical & Health Sciences | 15 | 20.3% |
| Psychology | 4 | 5.4% |
| Social Sciences | 1 | 1.3% |
| Engineering | 10 | 13.5% |
| Multidisciplinary Studies | 0 | 0.0% |
| Science & Technology | 6 | 8.1% |
| Business | 21 | 28.4% |
| Education | 0 | 0.0% |
| Literature & Languages | 1 | 1.3% |
| Liberal Arts & History | 4 | 5.4% |
| Visual & Performing Arts | 5 | 6.8% |
| Communications | 0 | 0.0% |
| Arts & Humanities | 0 | 0.0% |
| Total | 74 | 100.0% |
Transportation & Commute in Glacier View
Vehicle Availability by Sex in Glacier View
The most prevalent vehicle ownership categories in Glacier View are males with 1 vehicle (33, accounting for 60.0%) and females with 1 vehicle (8, making up 220.0%).
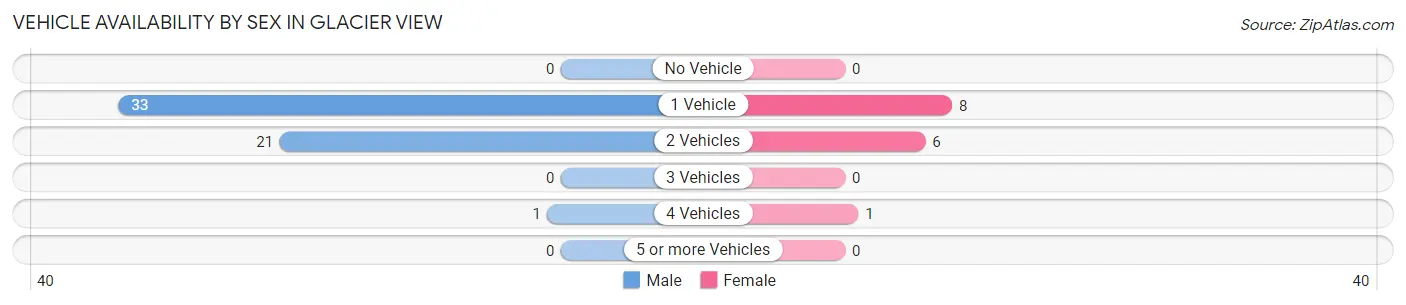
| Vehicles Available | Male | Female |
| No Vehicle | 0 (0.0%) | 0 (0.0%) |
| 1 Vehicle | 33 (60.0%) | 8 (53.3%) |
| 2 Vehicles | 21 (38.2%) | 6 (40.0%) |
| 3 Vehicles | 0 (0.0%) | 0 (0.0%) |
| 4 Vehicles | 1 (1.8%) | 1 (6.7%) |
| 5 or more Vehicles | 0 (0.0%) | 0 (0.0%) |
| Total | 55 (100.0%) | 15 (100.0%) |
Commute Time in Glacier View
The most frequently occuring commute durations in Glacier View are 5 to 9 minutes (24 commuters, 28.9%), less than 5 minutes (22 commuters, 26.5%), and 60 to 89 minutes (22 commuters, 26.5%).
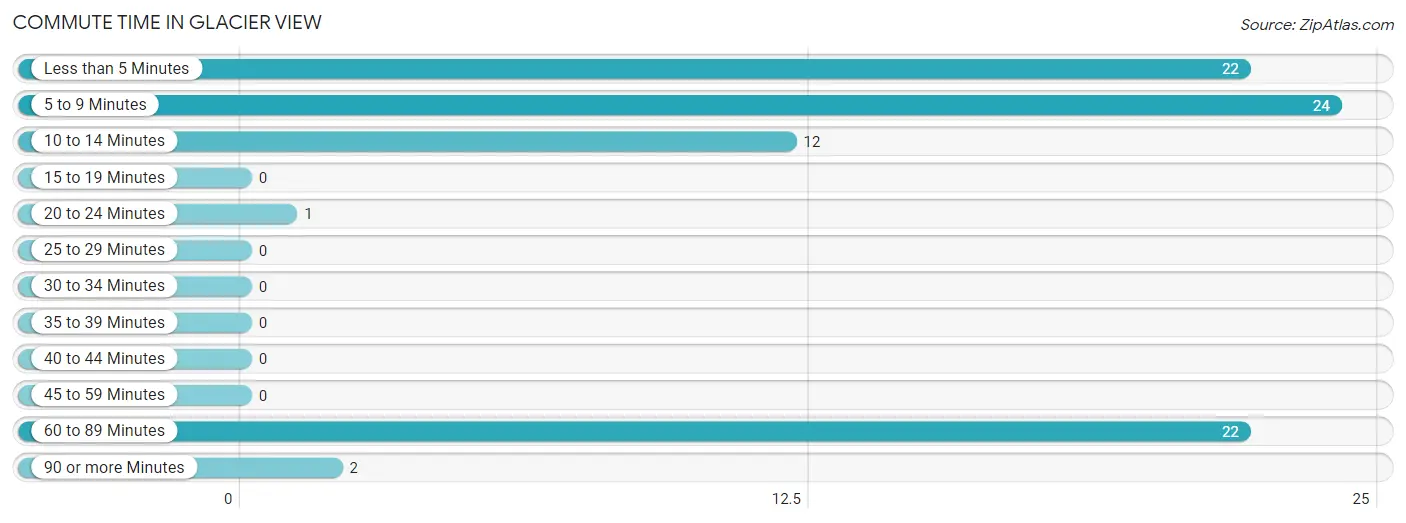
| Commute Time | # Commuters | % Commuters |
| Less than 5 Minutes | 22 | 26.5% |
| 5 to 9 Minutes | 24 | 28.9% |
| 10 to 14 Minutes | 12 | 14.5% |
| 15 to 19 Minutes | 0 | 0.0% |
| 20 to 24 Minutes | 1 | 1.2% |
| 25 to 29 Minutes | 0 | 0.0% |
| 30 to 34 Minutes | 0 | 0.0% |
| 35 to 39 Minutes | 0 | 0.0% |
| 40 to 44 Minutes | 0 | 0.0% |
| 45 to 59 Minutes | 0 | 0.0% |
| 60 to 89 Minutes | 22 | 26.5% |
| 90 or more Minutes | 2 | 2.4% |
Commute Time by Sex in Glacier View
The most common commute times in Glacier View are 60 to 89 minutes (21 commuters, 36.8%) for males and 5 to 9 minutes (11 commuters, 42.3%) for females.
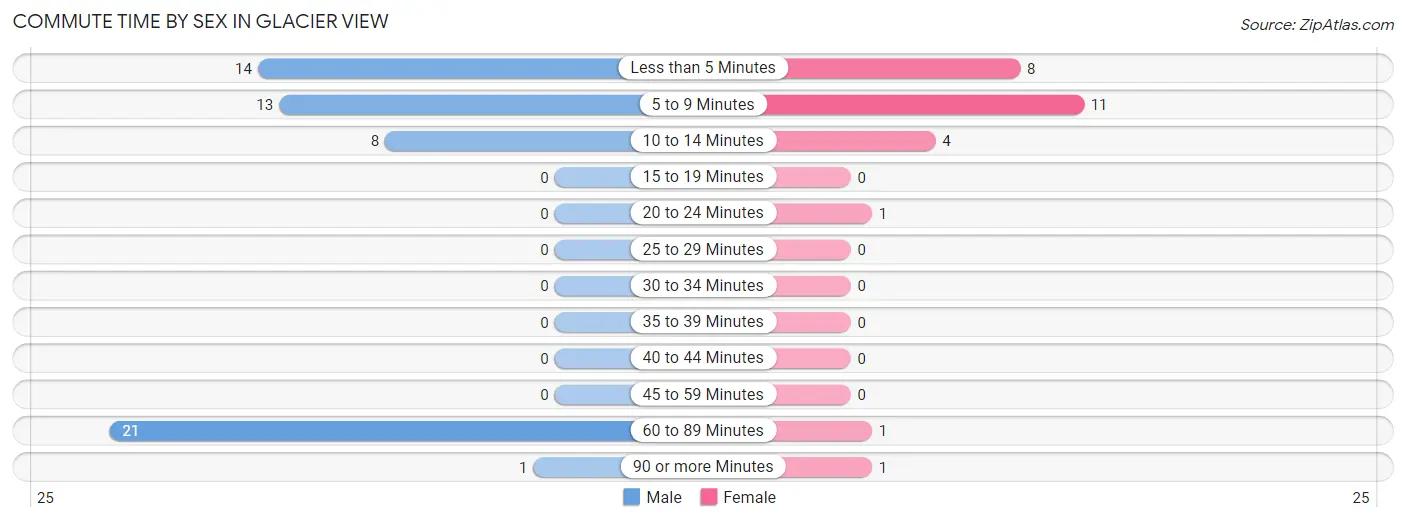
| Commute Time | Male | Female |
| Less than 5 Minutes | 14 (24.6%) | 8 (30.8%) |
| 5 to 9 Minutes | 13 (22.8%) | 11 (42.3%) |
| 10 to 14 Minutes | 8 (14.0%) | 4 (15.4%) |
| 15 to 19 Minutes | 0 (0.0%) | 0 (0.0%) |
| 20 to 24 Minutes | 0 (0.0%) | 1 (3.8%) |
| 25 to 29 Minutes | 0 (0.0%) | 0 (0.0%) |
| 30 to 34 Minutes | 0 (0.0%) | 0 (0.0%) |
| 35 to 39 Minutes | 0 (0.0%) | 0 (0.0%) |
| 40 to 44 Minutes | 0 (0.0%) | 0 (0.0%) |
| 45 to 59 Minutes | 0 (0.0%) | 0 (0.0%) |
| 60 to 89 Minutes | 21 (36.8%) | 1 (3.8%) |
| 90 or more Minutes | 1 (1.8%) | 1 (3.8%) |
Time of Departure to Work by Sex in Glacier View
The most frequent times of departure to work in Glacier View are 8:00 AM to 8:29 AM (19, 33.3%) for males and 6:00 AM to 6:29 AM (9, 34.6%) for females.
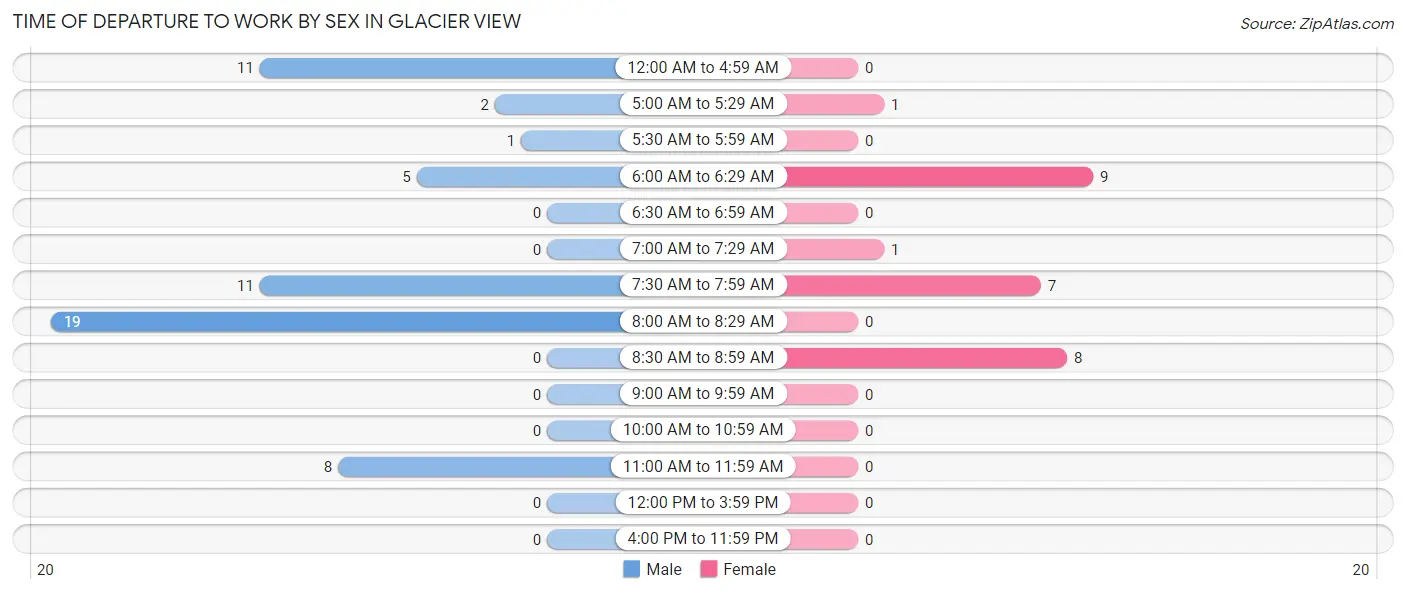
| Time of Departure | Male | Female |
| 12:00 AM to 4:59 AM | 11 (19.3%) | 0 (0.0%) |
| 5:00 AM to 5:29 AM | 2 (3.5%) | 1 (3.8%) |
| 5:30 AM to 5:59 AM | 1 (1.8%) | 0 (0.0%) |
| 6:00 AM to 6:29 AM | 5 (8.8%) | 9 (34.6%) |
| 6:30 AM to 6:59 AM | 0 (0.0%) | 0 (0.0%) |
| 7:00 AM to 7:29 AM | 0 (0.0%) | 1 (3.8%) |
| 7:30 AM to 7:59 AM | 11 (19.3%) | 7 (26.9%) |
| 8:00 AM to 8:29 AM | 19 (33.3%) | 0 (0.0%) |
| 8:30 AM to 8:59 AM | 0 (0.0%) | 8 (30.8%) |
| 9:00 AM to 9:59 AM | 0 (0.0%) | 0 (0.0%) |
| 10:00 AM to 10:59 AM | 0 (0.0%) | 0 (0.0%) |
| 11:00 AM to 11:59 AM | 8 (14.0%) | 0 (0.0%) |
| 12:00 PM to 3:59 PM | 0 (0.0%) | 0 (0.0%) |
| 4:00 PM to 11:59 PM | 0 (0.0%) | 0 (0.0%) |
| Total | 57 (100.0%) | 26 (100.0%) |
Housing Occupancy in Glacier View
Occupancy by Ownership in Glacier View
Of the total 124 dwellings in Glacier View, owner-occupied units account for 97 (78.2%), while renter-occupied units make up 27 (21.8%).
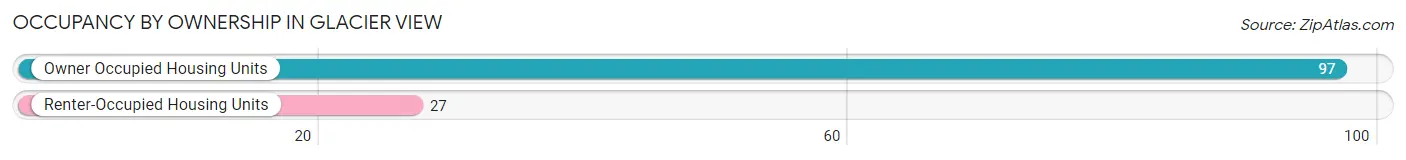
| Occupancy | # Housing Units | % Housing Units |
| Owner Occupied Housing Units | 97 | 78.2% |
| Renter-Occupied Housing Units | 27 | 21.8% |
| Total Occupied Housing Units | 124 | 100.0% |
Occupancy by Household Size in Glacier View
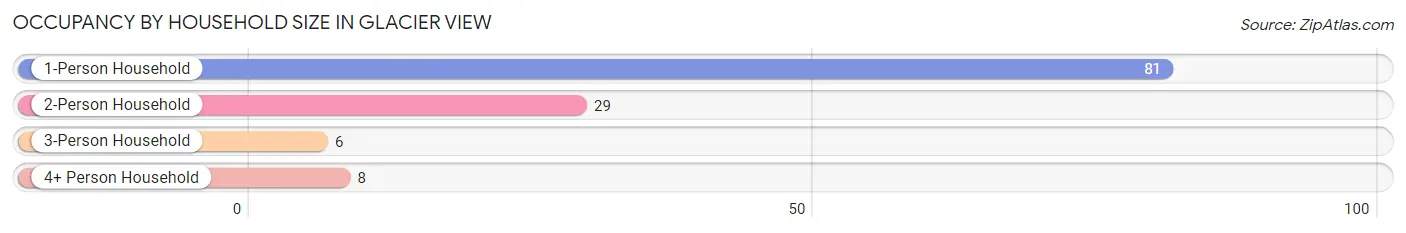
| Household Size | # Housing Units | % Housing Units |
| 1-Person Household | 81 | 65.3% |
| 2-Person Household | 29 | 23.4% |
| 3-Person Household | 6 | 4.8% |
| 4+ Person Household | 8 | 6.5% |
| Total Housing Units | 124 | 100.0% |
Occupancy by Ownership by Household Size in Glacier View
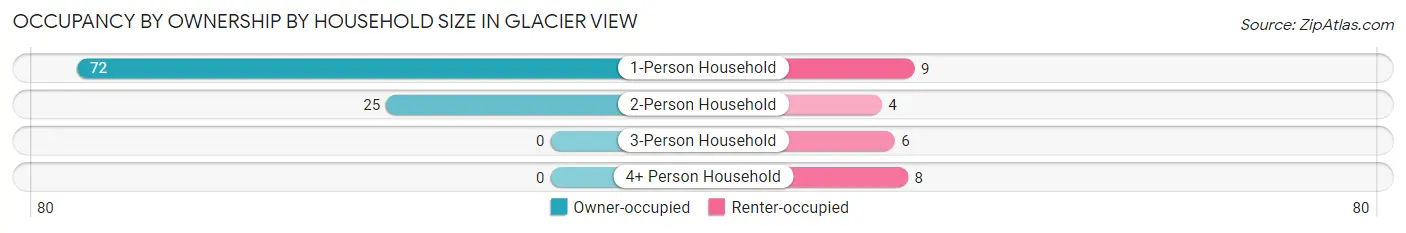
| Household Size | Owner-occupied | Renter-occupied |
| 1-Person Household | 72 (88.9%) | 9 (11.1%) |
| 2-Person Household | 25 (86.2%) | 4 (13.8%) |
| 3-Person Household | 0 (0.0%) | 6 (100.0%) |
| 4+ Person Household | 0 (0.0%) | 8 (100.0%) |
| Total Housing Units | 97 (78.2%) | 27 (21.8%) |
Occupancy by Educational Attainment in Glacier View
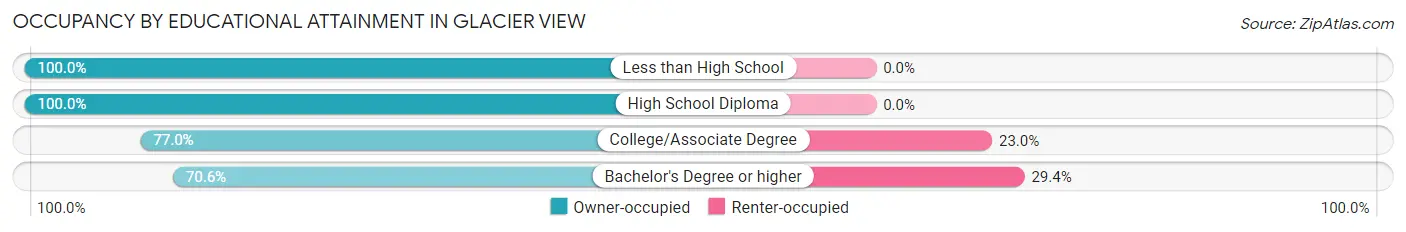
| Household Size | Owner-occupied | Renter-occupied |
| Less than High School | 10 (100.0%) | 0 (0.0%) |
| High School Diploma | 6 (100.0%) | 0 (0.0%) |
| College/Associate Degree | 57 (77.0%) | 17 (23.0%) |
| Bachelor's Degree or higher | 24 (70.6%) | 10 (29.4%) |
Occupancy by Age of Householder in Glacier View
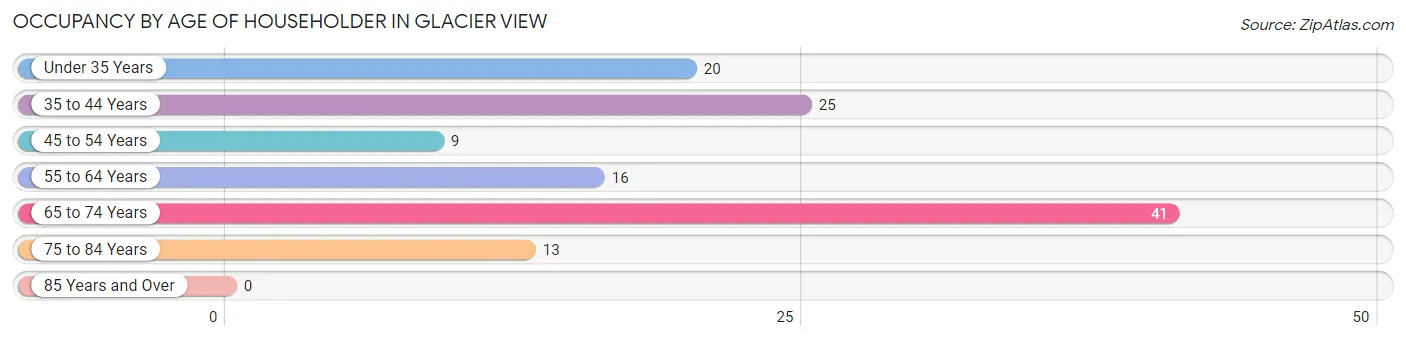
| Age Bracket | # Households | % Households |
| Under 35 Years | 20 | 16.1% |
| 35 to 44 Years | 25 | 20.2% |
| 45 to 54 Years | 9 | 7.3% |
| 55 to 64 Years | 16 | 12.9% |
| 65 to 74 Years | 41 | 33.1% |
| 75 to 84 Years | 13 | 10.5% |
| 85 Years and Over | 0 | 0.0% |
| Total | 124 | 100.0% |
Housing Finances in Glacier View
Median Income by Occupancy in Glacier View
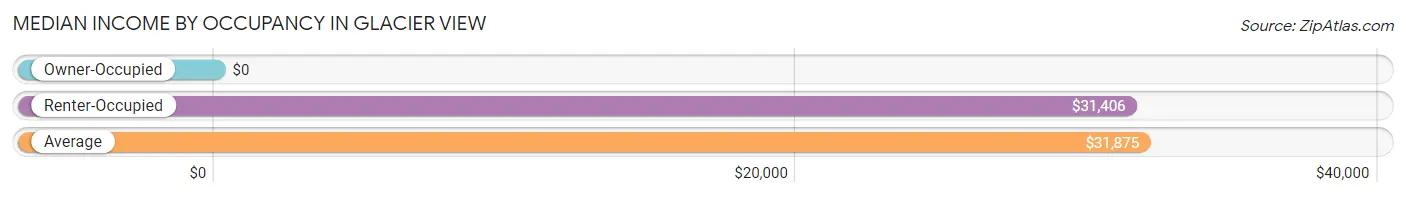
| Occupancy Type | # Households | Median Income |
| Owner-Occupied | 97 (78.2%) | $0 |
| Renter-Occupied | 27 (21.8%) | $31,406 |
| Average | 124 (100.0%) | $31,875 |
Occupancy by Householder Income Bracket in Glacier View
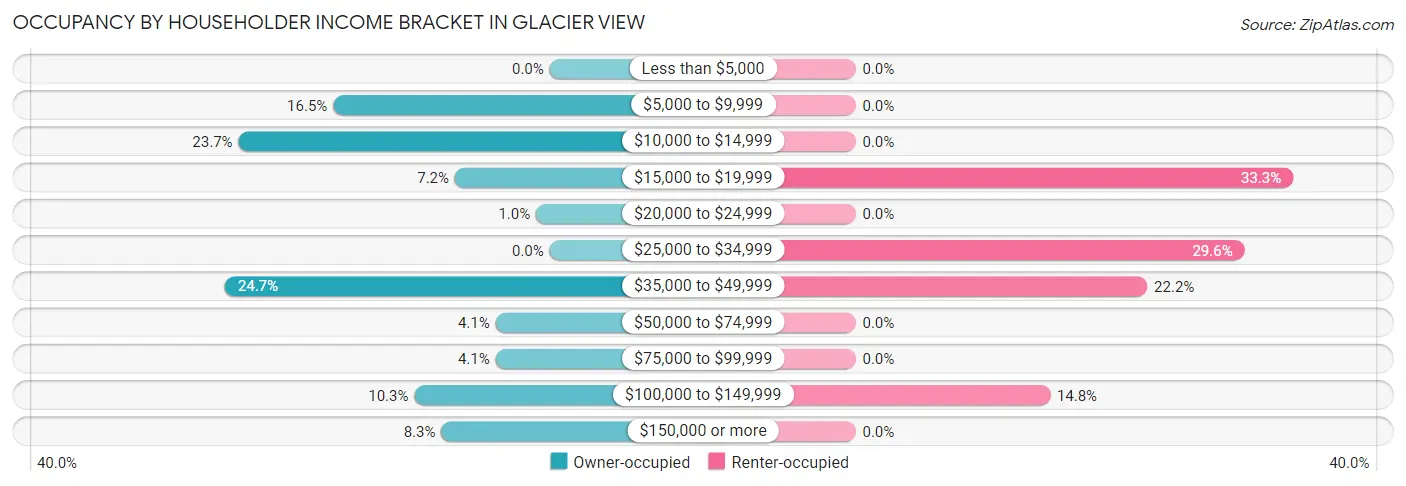
| Income Bracket | Owner-occupied | Renter-occupied |
| Less than $5,000 | 0 (0.0%) | 0 (0.0%) |
| $5,000 to $9,999 | 16 (16.5%) | 0 (0.0%) |
| $10,000 to $14,999 | 23 (23.7%) | 0 (0.0%) |
| $15,000 to $19,999 | 7 (7.2%) | 9 (33.3%) |
| $20,000 to $24,999 | 1 (1.0%) | 0 (0.0%) |
| $25,000 to $34,999 | 0 (0.0%) | 8 (29.6%) |
| $35,000 to $49,999 | 24 (24.7%) | 6 (22.2%) |
| $50,000 to $74,999 | 4 (4.1%) | 0 (0.0%) |
| $75,000 to $99,999 | 4 (4.1%) | 0 (0.0%) |
| $100,000 to $149,999 | 10 (10.3%) | 4 (14.8%) |
| $150,000 or more | 8 (8.3%) | 0 (0.0%) |
| Total | 97 (100.0%) | 27 (100.0%) |
Monthly Housing Cost Tiers in Glacier View
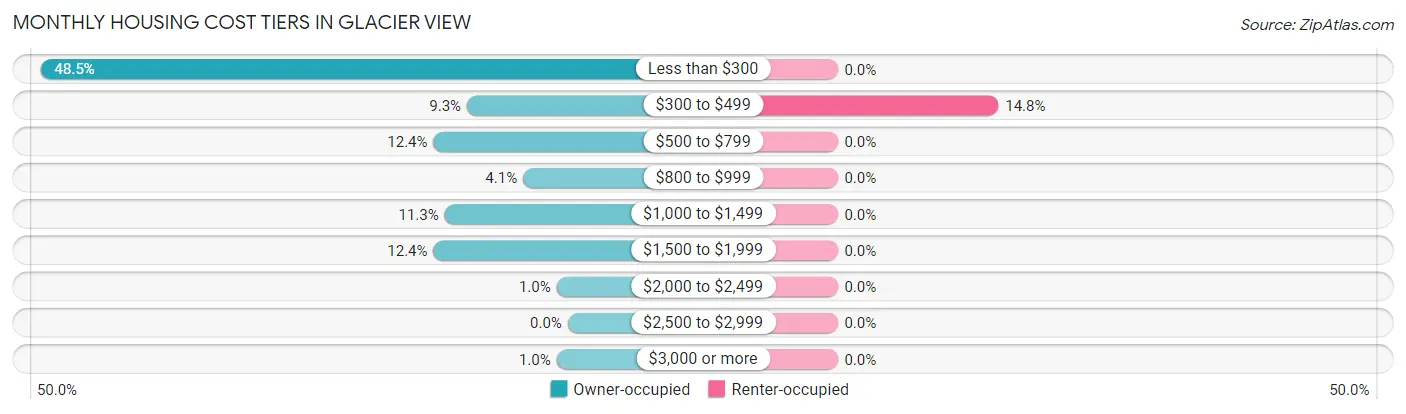
| Monthly Cost | Owner-occupied | Renter-occupied |
| Less than $300 | 47 (48.4%) | 0 (0.0%) |
| $300 to $499 | 9 (9.3%) | 4 (14.8%) |
| $500 to $799 | 12 (12.4%) | 0 (0.0%) |
| $800 to $999 | 4 (4.1%) | 0 (0.0%) |
| $1,000 to $1,499 | 11 (11.3%) | 0 (0.0%) |
| $1,500 to $1,999 | 12 (12.4%) | 0 (0.0%) |
| $2,000 to $2,499 | 1 (1.0%) | 0 (0.0%) |
| $2,500 to $2,999 | 0 (0.0%) | 0 (0.0%) |
| $3,000 or more | 1 (1.0%) | 0 (0.0%) |
| Total | 97 (100.0%) | 27 (100.0%) |
Physical Housing Characteristics in Glacier View
Housing Structures in Glacier View
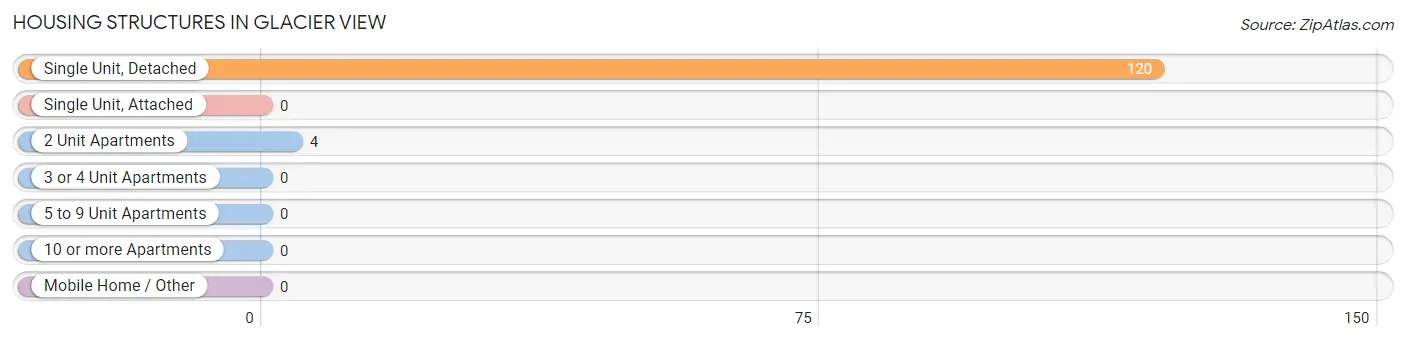
| Structure Type | # Housing Units | % Housing Units |
| Single Unit, Detached | 120 | 96.8% |
| Single Unit, Attached | 0 | 0.0% |
| 2 Unit Apartments | 4 | 3.2% |
| 3 or 4 Unit Apartments | 0 | 0.0% |
| 5 to 9 Unit Apartments | 0 | 0.0% |
| 10 or more Apartments | 0 | 0.0% |
| Mobile Home / Other | 0 | 0.0% |
| Total | 124 | 100.0% |
Housing Structures by Occupancy in Glacier View
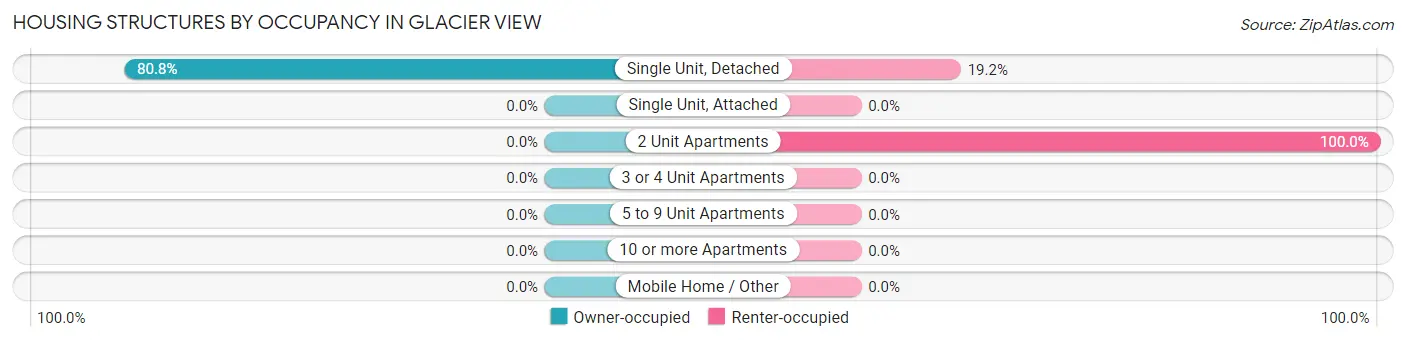
| Structure Type | Owner-occupied | Renter-occupied |
| Single Unit, Detached | 97 (80.8%) | 23 (19.2%) |
| Single Unit, Attached | 0 (0.0%) | 0 (0.0%) |
| 2 Unit Apartments | 0 (0.0%) | 4 (100.0%) |
| 3 or 4 Unit Apartments | 0 (0.0%) | 0 (0.0%) |
| 5 to 9 Unit Apartments | 0 (0.0%) | 0 (0.0%) |
| 10 or more Apartments | 0 (0.0%) | 0 (0.0%) |
| Mobile Home / Other | 0 (0.0%) | 0 (0.0%) |
| Total | 97 (78.2%) | 27 (21.8%) |
Housing Structures by Number of Rooms in Glacier View
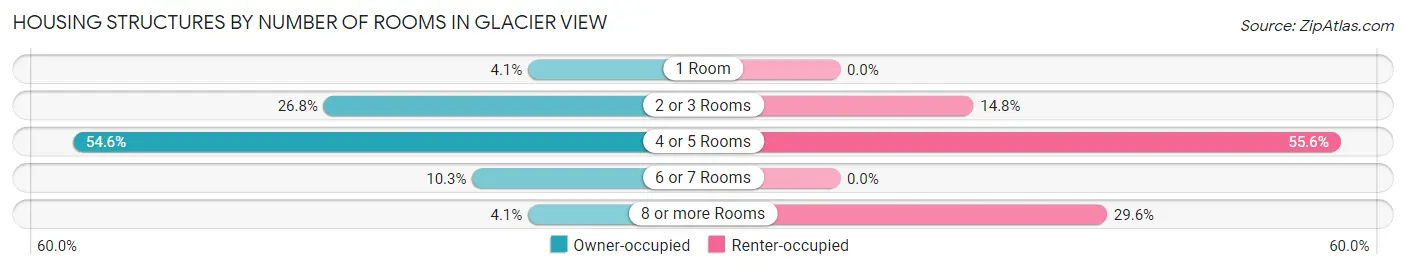
| Number of Rooms | Owner-occupied | Renter-occupied |
| 1 Room | 4 (4.1%) | 0 (0.0%) |
| 2 or 3 Rooms | 26 (26.8%) | 4 (14.8%) |
| 4 or 5 Rooms | 53 (54.6%) | 15 (55.6%) |
| 6 or 7 Rooms | 10 (10.3%) | 0 (0.0%) |
| 8 or more Rooms | 4 (4.1%) | 8 (29.6%) |
| Total | 97 (100.0%) | 27 (100.0%) |
Housing Structure by Heating Type in Glacier View
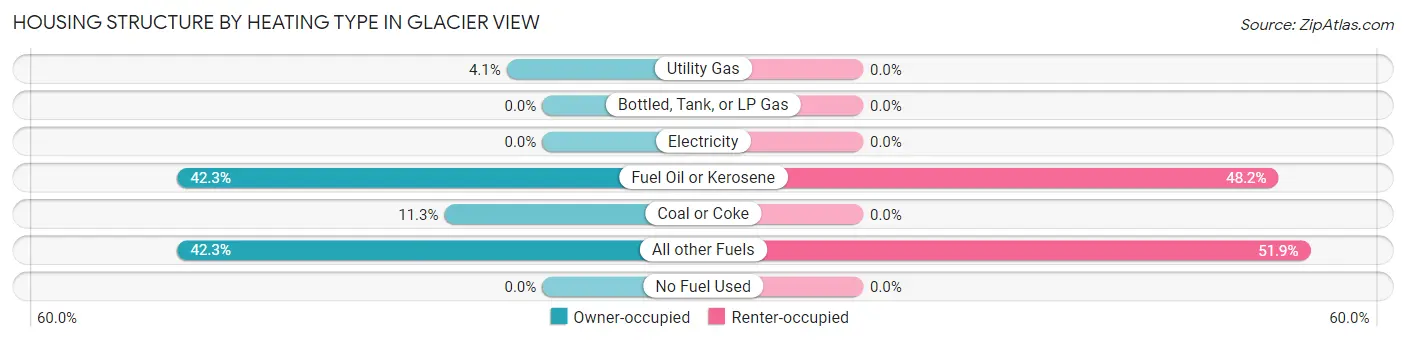
| Heating Type | Owner-occupied | Renter-occupied |
| Utility Gas | 4 (4.1%) | 0 (0.0%) |
| Bottled, Tank, or LP Gas | 0 (0.0%) | 0 (0.0%) |
| Electricity | 0 (0.0%) | 0 (0.0%) |
| Fuel Oil or Kerosene | 41 (42.3%) | 13 (48.1%) |
| Coal or Coke | 11 (11.3%) | 0 (0.0%) |
| All other Fuels | 41 (42.3%) | 14 (51.8%) |
| No Fuel Used | 0 (0.0%) | 0 (0.0%) |
| Total | 97 (100.0%) | 27 (100.0%) |
Household Vehicle Usage in Glacier View
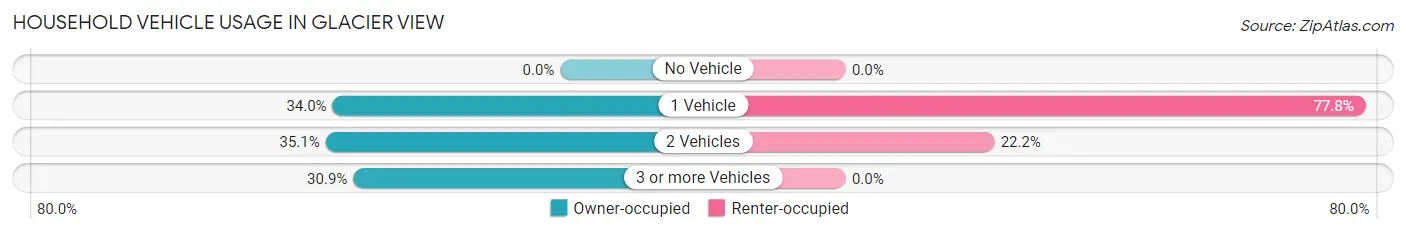
| Vehicles per Household | Owner-occupied | Renter-occupied |
| No Vehicle | 0 (0.0%) | 0 (0.0%) |
| 1 Vehicle | 33 (34.0%) | 21 (77.8%) |
| 2 Vehicles | 34 (35.0%) | 6 (22.2%) |
| 3 or more Vehicles | 30 (30.9%) | 0 (0.0%) |
| Total | 97 (100.0%) | 27 (100.0%) |
Real Estate & Mortgages in Glacier View
Real Estate and Mortgage Overview in Glacier View
| Characteristic | Without Mortgage | With Mortgage |
| Housing Units | 79 | 18 |
| Median Property Value | - | - |
| Median Household Income | $37,188 | $1 |
| Monthly Housing Costs | $245 | $1 |
| Real Estate Taxes | $1,250 | $15 |
Property Value by Mortgage Status in Glacier View
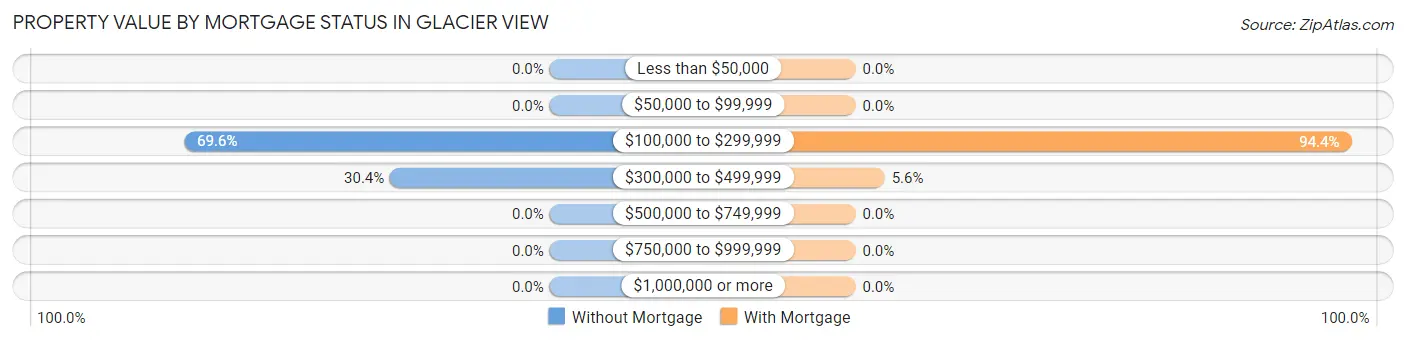
| Property Value | Without Mortgage | With Mortgage |
| Less than $50,000 | 0 (0.0%) | 0 (0.0%) |
| $50,000 to $99,999 | 0 (0.0%) | 0 (0.0%) |
| $100,000 to $299,999 | 55 (69.6%) | 17 (94.4%) |
| $300,000 to $499,999 | 24 (30.4%) | 1 (5.6%) |
| $500,000 to $749,999 | 0 (0.0%) | 0 (0.0%) |
| $750,000 to $999,999 | 0 (0.0%) | 0 (0.0%) |
| $1,000,000 or more | 0 (0.0%) | 0 (0.0%) |
| Total | 79 (100.0%) | 18 (100.0%) |
Household Income by Mortgage Status in Glacier View
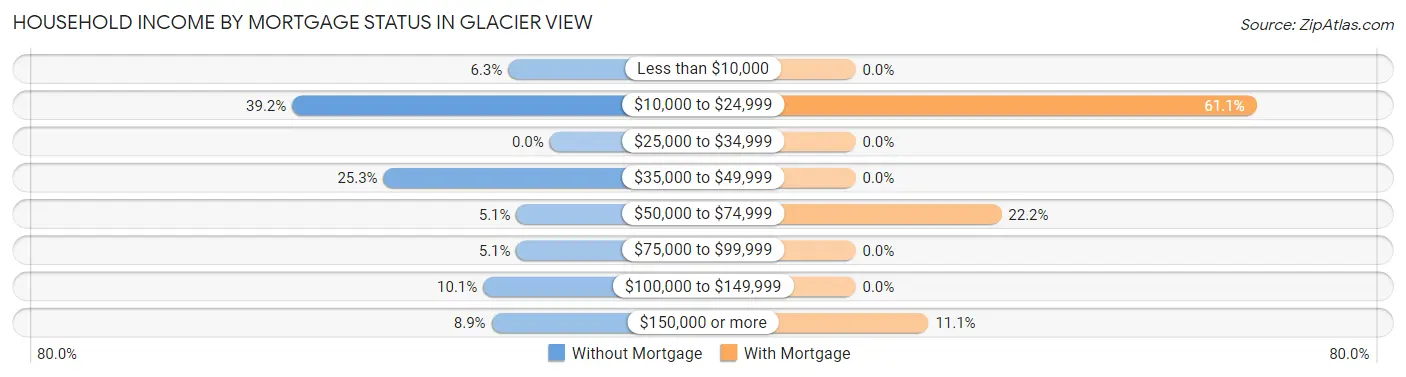
| Household Income | Without Mortgage | With Mortgage |
| Less than $10,000 | 5 (6.3%) | 0 (0.0%) |
| $10,000 to $24,999 | 31 (39.2%) | 11 (61.1%) |
| $25,000 to $34,999 | 0 (0.0%) | 0 (0.0%) |
| $35,000 to $49,999 | 20 (25.3%) | 0 (0.0%) |
| $50,000 to $74,999 | 4 (5.1%) | 4 (22.2%) |
| $75,000 to $99,999 | 4 (5.1%) | 0 (0.0%) |
| $100,000 to $149,999 | 8 (10.1%) | 0 (0.0%) |
| $150,000 or more | 7 (8.9%) | 2 (11.1%) |
| Total | 79 (100.0%) | 18 (100.0%) |
Property Value to Household Income Ratio in Glacier View
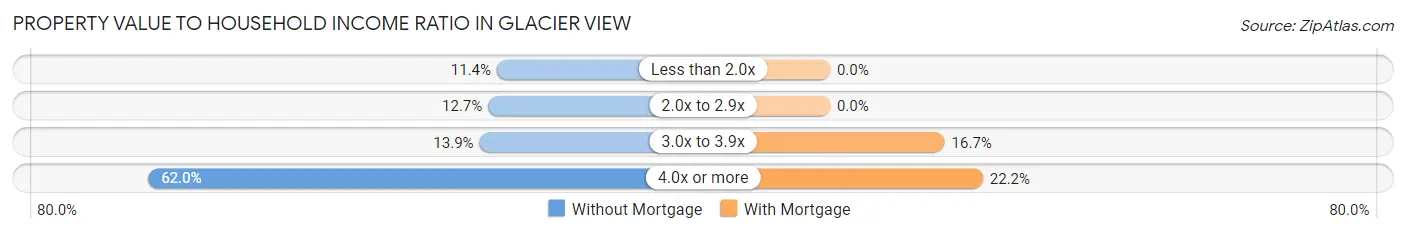
| Value-to-Income Ratio | Without Mortgage | With Mortgage |
| Less than 2.0x | 9 (11.4%) | 0 (0.0%) |
| 2.0x to 2.9x | 10 (12.7%) | 0 (0.0%) |
| 3.0x to 3.9x | 11 (13.9%) | 3 (16.7%) |
| 4.0x or more | 49 (62.0%) | 4 (22.2%) |
| Total | 79 (100.0%) | 18 (100.0%) |
Real Estate Taxes by Mortgage Status in Glacier View
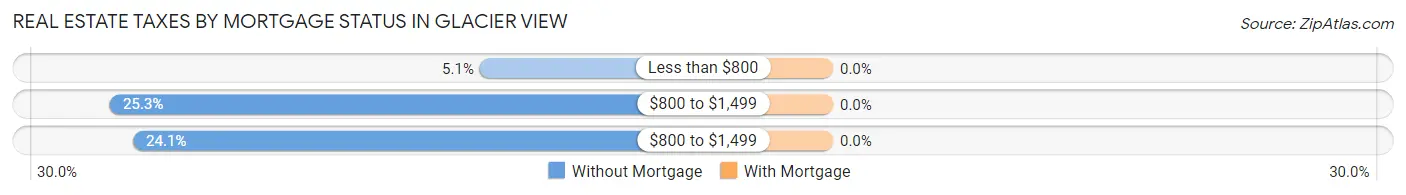
| Property Taxes | Without Mortgage | With Mortgage |
| Less than $800 | 4 (5.1%) | 0 (0.0%) |
| $800 to $1,499 | 20 (25.3%) | 0 (0.0%) |
| $800 to $1,499 | 19 (24.0%) | 0 (0.0%) |
| Total | 79 (100.0%) | 18 (100.0%) |
Health & Disability in Glacier View
Health Insurance Coverage by Age in Glacier View
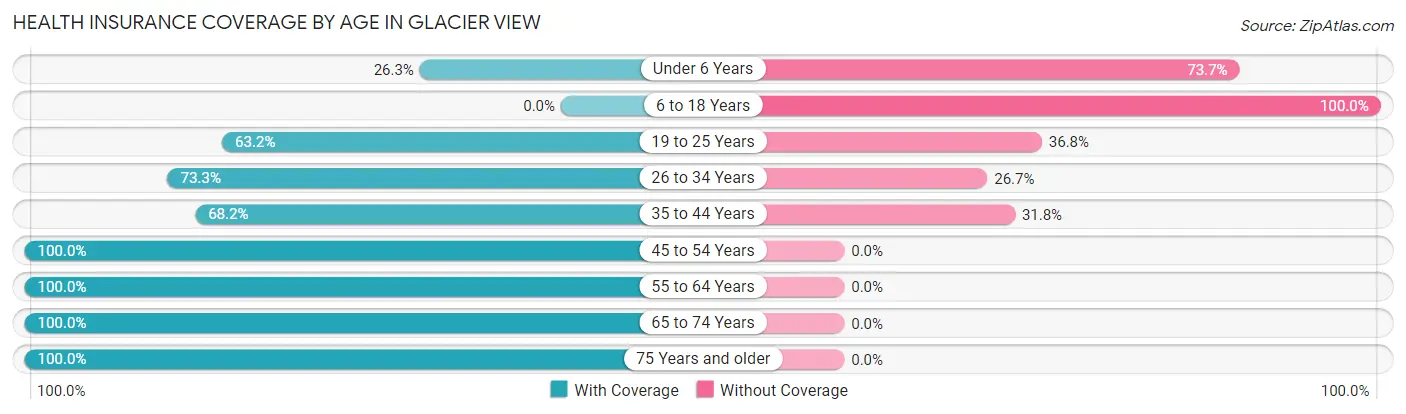
| Age Bracket | With Coverage | Without Coverage |
| Under 6 Years | 5 (26.3%) | 14 (73.7%) |
| 6 to 18 Years | 0 (0.0%) | 5 (100.0%) |
| 19 to 25 Years | 12 (63.2%) | 7 (36.8%) |
| 26 to 34 Years | 11 (73.3%) | 4 (26.7%) |
| 35 to 44 Years | 30 (68.2%) | 14 (31.8%) |
| 45 to 54 Years | 10 (100.0%) | 0 (0.0%) |
| 55 to 64 Years | 37 (100.0%) | 0 (0.0%) |
| 65 to 74 Years | 47 (100.0%) | 0 (0.0%) |
| 75 Years and older | 20 (100.0%) | 0 (0.0%) |
| Total | 172 (79.6%) | 44 (20.4%) |
Health Insurance Coverage by Citizenship Status in Glacier View
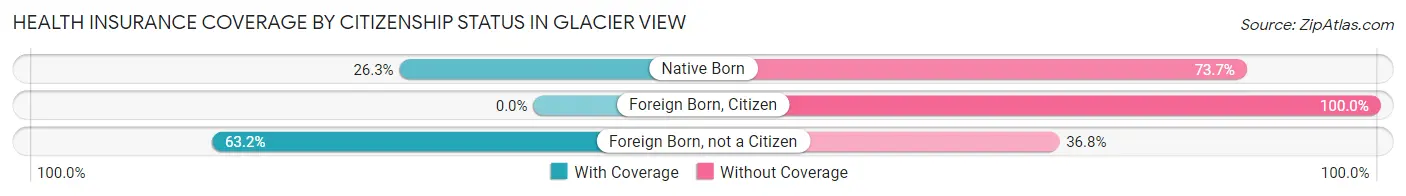
| Citizenship Status | With Coverage | Without Coverage |
| Native Born | 5 (26.3%) | 14 (73.7%) |
| Foreign Born, Citizen | 0 (0.0%) | 5 (100.0%) |
| Foreign Born, not a Citizen | 12 (63.2%) | 7 (36.8%) |
Health Insurance Coverage by Household Income in Glacier View
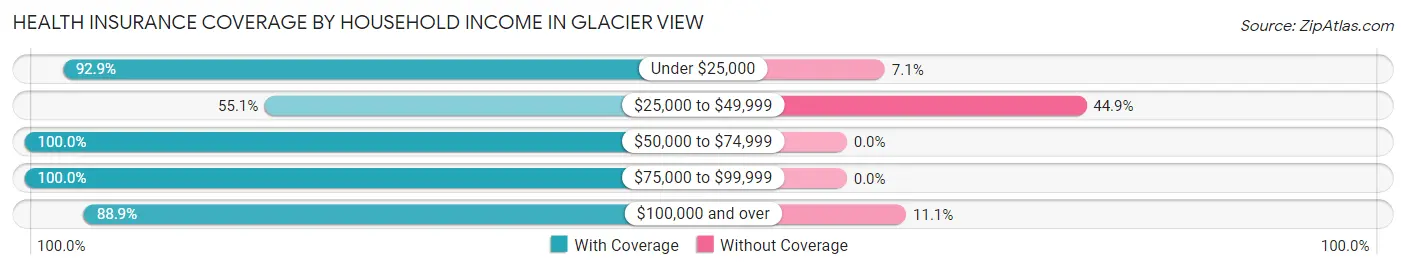
| Household Income | With Coverage | Without Coverage |
| Under $25,000 | 52 (92.9%) | 4 (7.1%) |
| $25,000 to $49,999 | 43 (55.1%) | 35 (44.9%) |
| $50,000 to $74,999 | 4 (100.0%) | 0 (0.0%) |
| $75,000 to $99,999 | 4 (100.0%) | 0 (0.0%) |
| $100,000 and over | 40 (88.9%) | 5 (11.1%) |
Public vs Private Health Insurance Coverage by Age in Glacier View
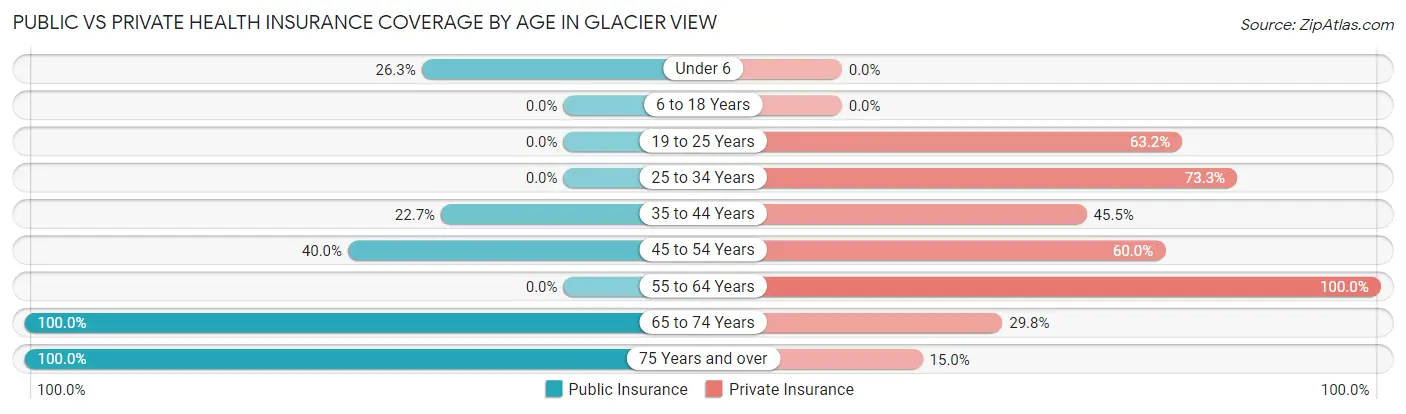
| Age Bracket | Public Insurance | Private Insurance |
| Under 6 | 5 (26.3%) | 0 (0.0%) |
| 6 to 18 Years | 0 (0.0%) | 0 (0.0%) |
| 19 to 25 Years | 0 (0.0%) | 12 (63.2%) |
| 25 to 34 Years | 0 (0.0%) | 11 (73.3%) |
| 35 to 44 Years | 10 (22.7%) | 20 (45.5%) |
| 45 to 54 Years | 4 (40.0%) | 6 (60.0%) |
| 55 to 64 Years | 0 (0.0%) | 37 (100.0%) |
| 65 to 74 Years | 47 (100.0%) | 14 (29.8%) |
| 75 Years and over | 20 (100.0%) | 3 (15.0%) |
| Total | 86 (39.8%) | 103 (47.7%) |
Disability Status by Sex by Age in Glacier View
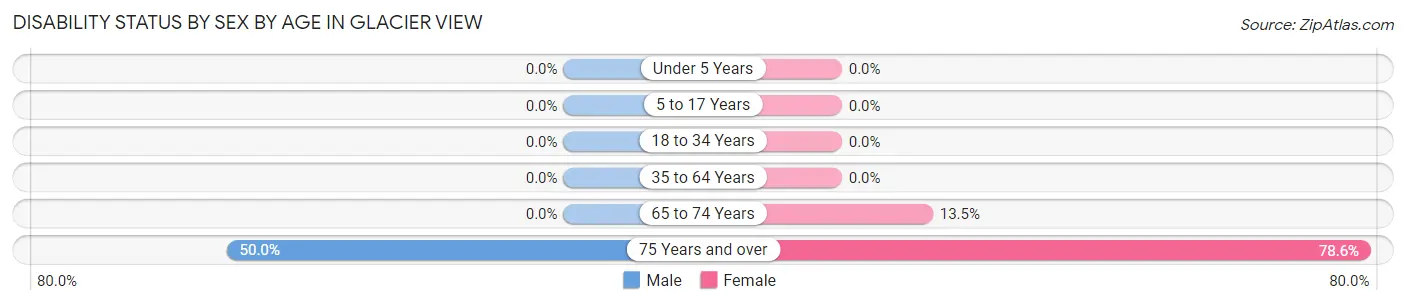
| Age Bracket | Male | Female |
| Under 5 Years | 0 (0.0%) | 0 (0.0%) |
| 5 to 17 Years | 0 (0.0%) | 0 (0.0%) |
| 18 to 34 Years | 0 (0.0%) | 0 (0.0%) |
| 35 to 64 Years | 0 (0.0%) | 0 (0.0%) |
| 65 to 74 Years | 0 (0.0%) | 5 (13.5%) |
| 75 Years and over | 3 (50.0%) | 11 (78.6%) |
Disability Class by Sex by Age in Glacier View
Disability Class: Hearing Difficulty
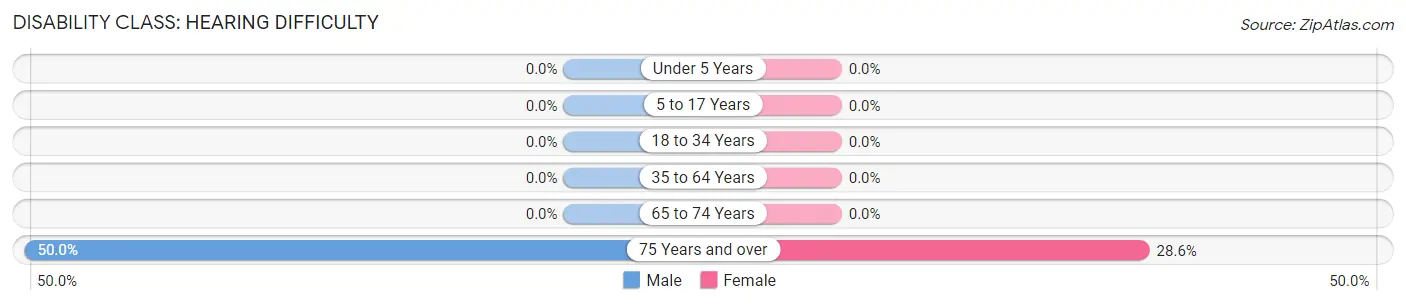
| Age Bracket | Male | Female |
| Under 5 Years | 0 (0.0%) | 0 (0.0%) |
| 5 to 17 Years | 0 (0.0%) | 0 (0.0%) |
| 18 to 34 Years | 0 (0.0%) | 0 (0.0%) |
| 35 to 64 Years | 0 (0.0%) | 0 (0.0%) |
| 65 to 74 Years | 0 (0.0%) | 0 (0.0%) |
| 75 Years and over | 3 (50.0%) | 4 (28.6%) |
Disability Class: Vision Difficulty
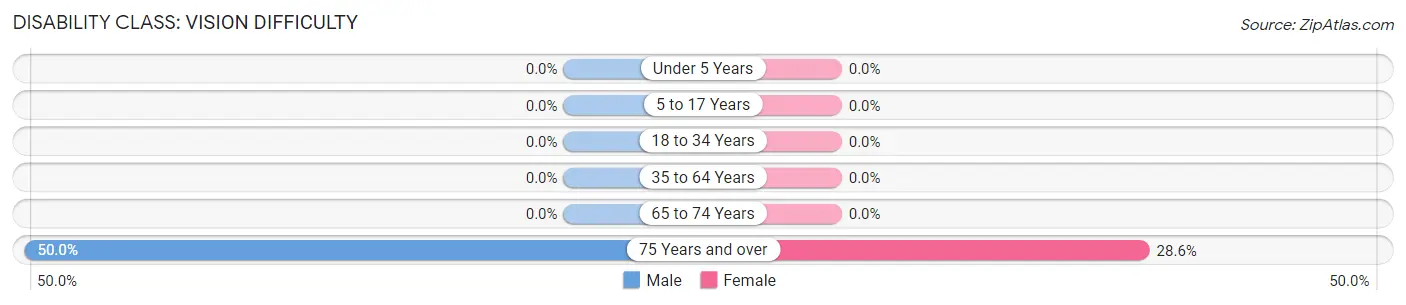
| Age Bracket | Male | Female |
| Under 5 Years | 0 (0.0%) | 0 (0.0%) |
| 5 to 17 Years | 0 (0.0%) | 0 (0.0%) |
| 18 to 34 Years | 0 (0.0%) | 0 (0.0%) |
| 35 to 64 Years | 0 (0.0%) | 0 (0.0%) |
| 65 to 74 Years | 0 (0.0%) | 0 (0.0%) |
| 75 Years and over | 3 (50.0%) | 4 (28.6%) |
Disability Class: Cognitive Difficulty
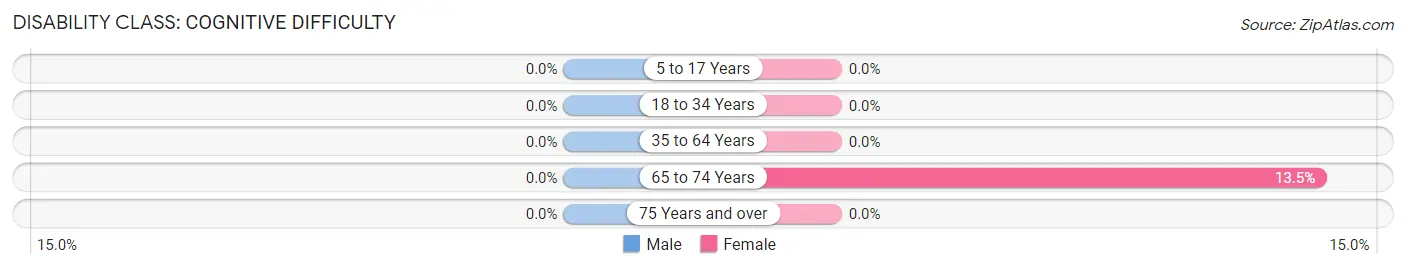
| Age Bracket | Male | Female |
| 5 to 17 Years | 0 (0.0%) | 0 (0.0%) |
| 18 to 34 Years | 0 (0.0%) | 0 (0.0%) |
| 35 to 64 Years | 0 (0.0%) | 0 (0.0%) |
| 65 to 74 Years | 0 (0.0%) | 5 (13.5%) |
| 75 Years and over | 0 (0.0%) | 0 (0.0%) |
Disability Class: Ambulatory Difficulty
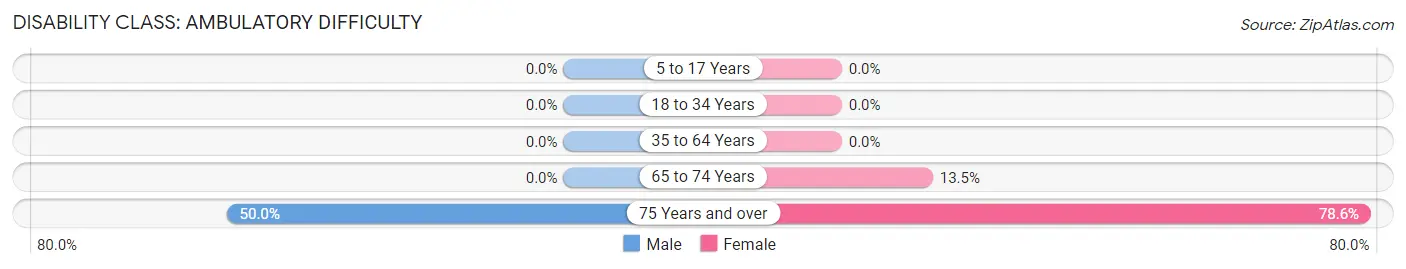
| Age Bracket | Male | Female |
| 5 to 17 Years | 0 (0.0%) | 0 (0.0%) |
| 18 to 34 Years | 0 (0.0%) | 0 (0.0%) |
| 35 to 64 Years | 0 (0.0%) | 0 (0.0%) |
| 65 to 74 Years | 0 (0.0%) | 5 (13.5%) |
| 75 Years and over | 3 (50.0%) | 11 (78.6%) |
Disability Class: Self-Care Difficulty
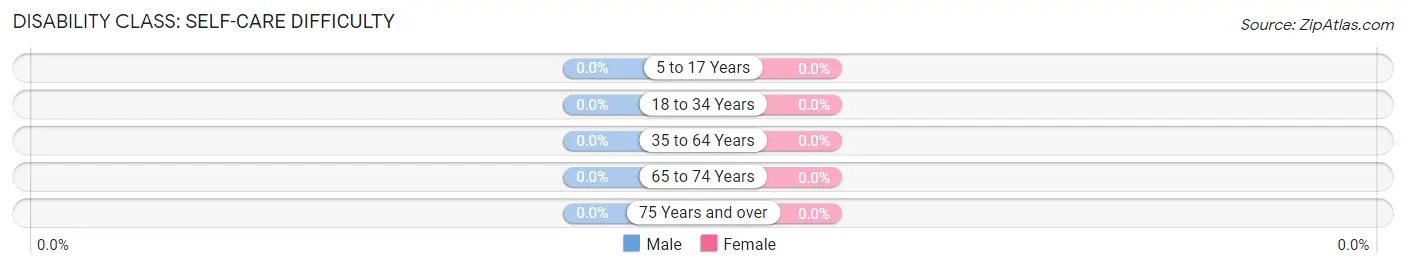
| Age Bracket | Male | Female |
| 5 to 17 Years | 0 (0.0%) | 0 (0.0%) |
| 18 to 34 Years | 0 (0.0%) | 0 (0.0%) |
| 35 to 64 Years | 0 (0.0%) | 0 (0.0%) |
| 65 to 74 Years | 0 (0.0%) | 0 (0.0%) |
| 75 Years and over | 0 (0.0%) | 0 (0.0%) |
Technology Access in Glacier View
Computing Device Access in Glacier View
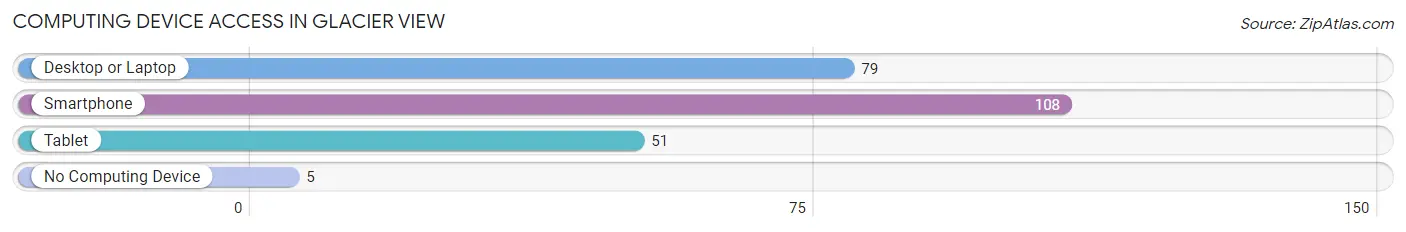
| Device Type | # Households | % Households |
| Desktop or Laptop | 79 | 63.7% |
| Smartphone | 108 | 87.1% |
| Tablet | 51 | 41.1% |
| No Computing Device | 5 | 4.0% |
| Total | 124 | 100.0% |
Internet Access in Glacier View
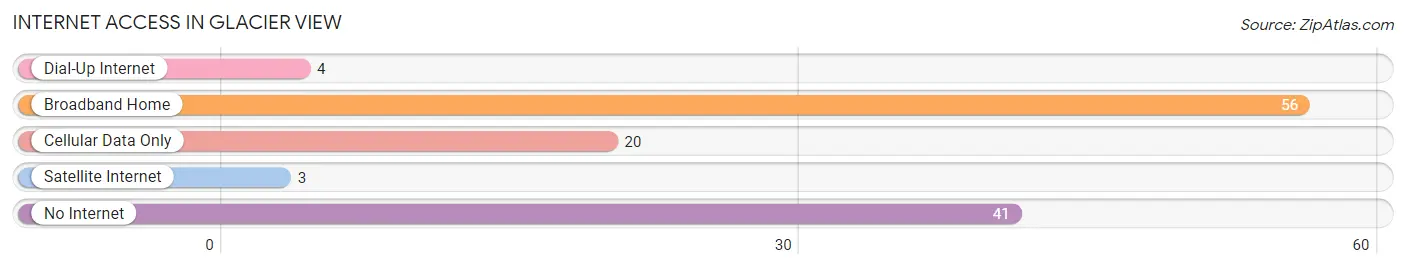
| Internet Type | # Households | % Households |
| Dial-Up Internet | 4 | 3.2% |
| Broadband Home | 56 | 45.2% |
| Cellular Data Only | 20 | 16.1% |
| Satellite Internet | 3 | 2.4% |
| No Internet | 41 | 33.1% |
| Total | 124 | 100.0% |
Glacier View Summary
Glacier View, Alaska is a small unincorporated community located in the Matanuska-Susitna Borough of Alaska. It is situated on the south side of the Matanuska River, approximately 40 miles northeast of Anchorage. The community is home to approximately 200 people and is a popular destination for outdoor recreation.
History
Glacier View was first settled in the early 1900s by homesteaders who were attracted to the area by its abundant natural resources. The first settlers were mostly of Scandinavian descent, and the community was originally known as “Scandinavian Hill.” In the 1920s, the community was renamed “Glacier View” due to its proximity to the Matanuska Glacier.
The community was largely isolated until the 1950s, when the Alaska Railroad was extended to the area. This allowed for easier access to Anchorage and other parts of the state. In the 1960s, the Alaska Native Claims Settlement Act (ANCSA) was passed, which allowed for the formation of Native Corporations in Alaska. The Matanuska-Susitna Native Corporation was formed in 1971, and Glacier View was included in its boundaries.
Geography
Glacier View is located in the Matanuska-Susitna Borough of Alaska, approximately 40 miles northeast of Anchorage. The community is situated on the south side of the Matanuska River, and is surrounded by mountains and glaciers. The area is known for its abundant wildlife, including moose, bear, and caribou.
The climate in Glacier View is generally mild, with temperatures ranging from the mid-30s in the winter to the mid-60s in the summer. The area receives an average of 40 inches of precipitation per year, with most of it falling in the form of snow.
Economy
The economy of Glacier View is largely based on tourism and outdoor recreation. The area is a popular destination for fishing, hunting, and other outdoor activities. The Matanuska-Susitna Native Corporation also provides employment opportunities for local residents.
Demographics
As of the 2010 census, the population of Glacier View was approximately 200 people. The racial makeup of the community was 95.5% White, 0.5% Native American, 0.5% Asian, and 3.5% from other races. The median household income was $50,000, and the median age was 44.
Conclusion
Glacier View, Alaska is a small unincorporated community located in the Matanuska-Susitna Borough of Alaska. It was first settled in the early 1900s by homesteaders, and was later included in the boundaries of the Matanuska-Susitna Native Corporation. The economy of Glacier View is largely based on tourism and outdoor recreation, and the population of the community is approximately 200 people.
Common Questions
What is Per Capita Income in Glacier View?
Per Capita income in Glacier View is $56,251.
What is the Median Household income in Glacier View?
Median Household Income in Glacier View is $31,875.
What is Inequality or Gini Index in Glacier View?
Inequality or Gini Index in Glacier View is 0.68.
What is the Total Population of Glacier View?
Total Population of Glacier View is 216.
What is the Total Male Population of Glacier View?
Total Male Population of Glacier View is 96.
What is the Total Female Population of Glacier View?
Total Female Population of Glacier View is 120.
What is the Ratio of Males per 100 Females in Glacier View?
There are 80.00 Males per 100 Females in Glacier View.
What is the Ratio of Females per 100 Males in Glacier View?
There are 125.00 Females per 100 Males in Glacier View.
What is the Median Population Age in Glacier View?
Median Population Age in Glacier View is 54.2 Years.
What is the Average Family Size in Glacier View
Average Family Size in Glacier View is 2.5 People.
What is the Average Household Size in Glacier View
Average Household Size in Glacier View is 1.5 People.
How Large is the Labor Force in Glacier View?
There are 99 People in the Labor Forcein in Glacier View.
What is the Percentage of People in the Labor Force in Glacier View?
50.3% of People are in the Labor Force in Glacier View.