Nenana, AK Map & Demographics
Nenana Map
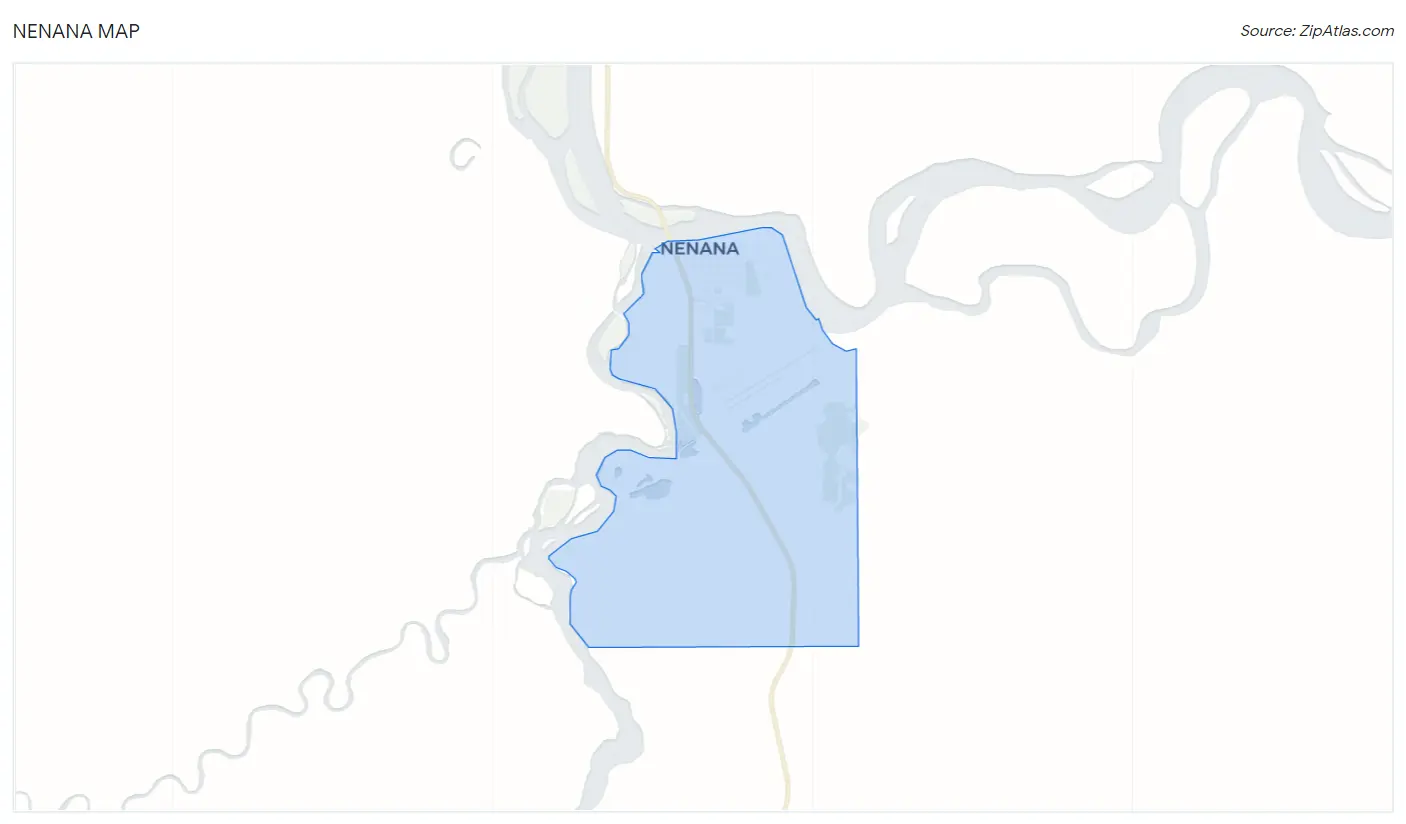
Nenana Overview
$26,386
PER CAPITA INCOME
$61,250
AVG FAMILY INCOME
$50,357
AVG HOUSEHOLD INCOME
23.3%
WAGE / INCOME GAP [ % ]
76.7¢/ $1
WAGE / INCOME GAP [ $ ]
0.47
INEQUALITY / GINI INDEX
508
TOTAL POPULATION
213
MALE POPULATION
295
FEMALE POPULATION
72.20
MALES / 100 FEMALES
138.50
FEMALES / 100 MALES
31.8
MEDIAN AGE
3.2
AVG FAMILY SIZE
2.5
AVG HOUSEHOLD SIZE
163
LABOR FORCE [ PEOPLE ]
50.8%
PERCENT IN LABOR FORCE
8.0%
UNEMPLOYMENT RATE
Nenana Zip Codes
Nenana Area Codes
Income in Nenana
Income Overview in Nenana
Per Capita Income in Nenana is $26,386, while median incomes of families and households are $61,250 and $50,357 respectively.
| Characteristic | Number | Measure |
| Per Capita Income | 508 | $26,386 |
| Median Family Income | 121 | $61,250 |
| Mean Family Income | 121 | $84,086 |
| Median Household Income | 202 | $50,357 |
| Mean Household Income | 202 | $67,726 |
| Income Deficit | 121 | $0 |
| Wage / Income Gap (%) | 508 | 23.33% |
| Wage / Income Gap ($) | 508 | 76.67¢ per $1 |
| Gini / Inequality Index | 508 | 0.47 |
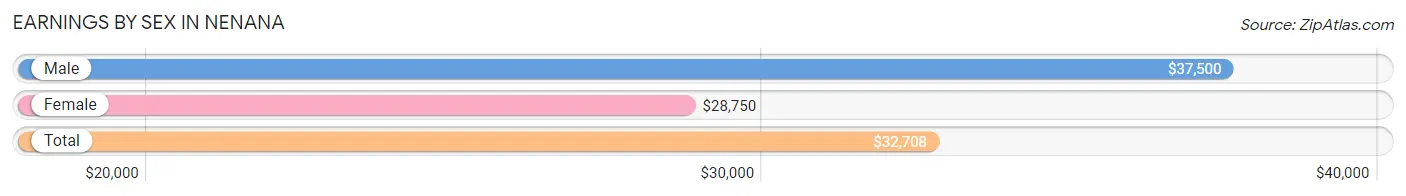
Earnings by Sex in Nenana
Average Earnings in Nenana are $32,708, $37,500 for men and $28,750 for women, a difference of 23.3%.
| Sex | Number | Average Earnings |
| Male | 116 (54.7%) | $37,500 |
| Female | 96 (45.3%) | $28,750 |
| Total | 212 (100.0%) | $32,708 |
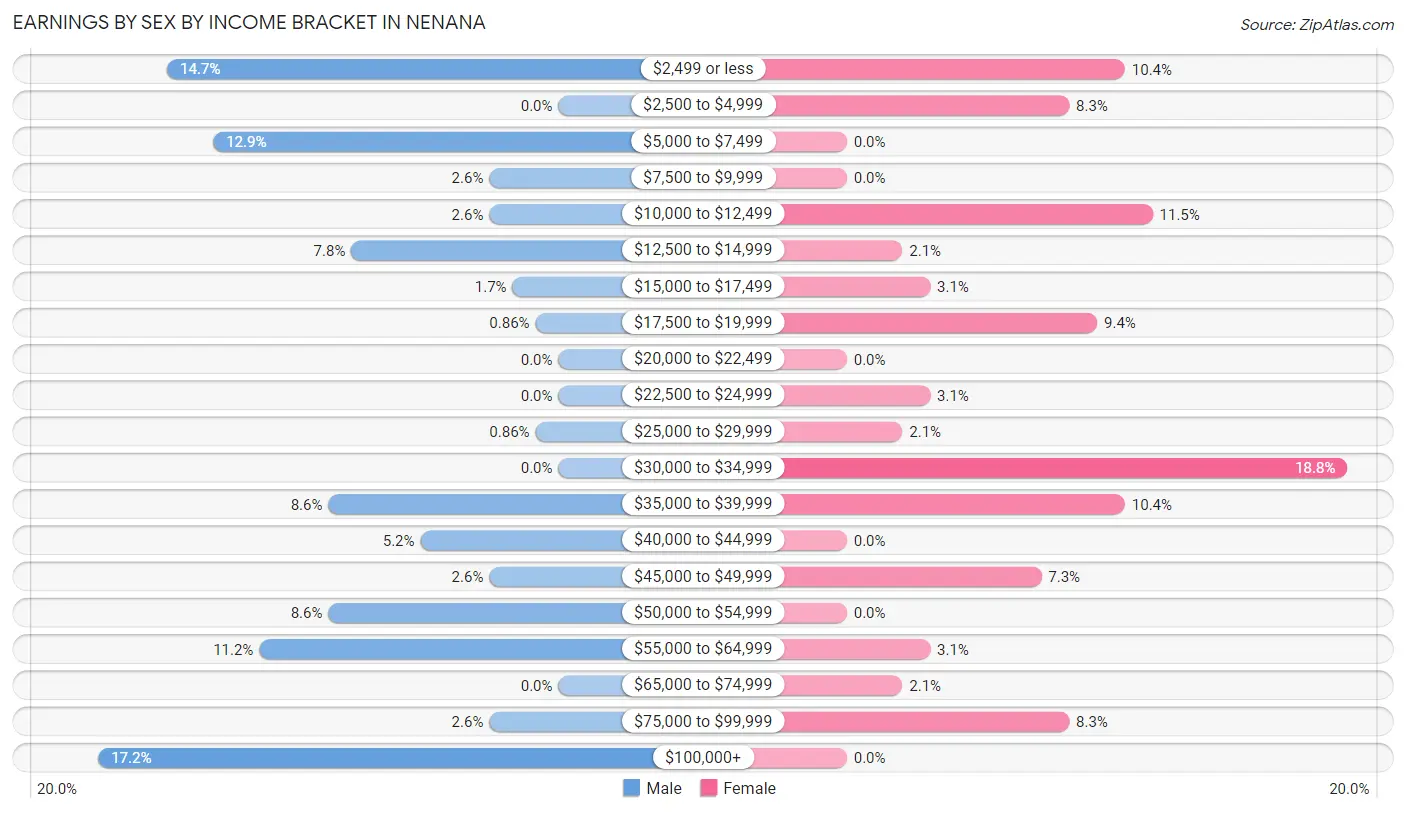
Earnings by Sex by Income Bracket in Nenana
The most common earnings brackets in Nenana are $100,000+ for men (20 | 17.2%) and $30,000 to $34,999 for women (18 | 18.8%).
| Income | Male | Female |
| $2,499 or less | 17 (14.7%) | 10 (10.4%) |
| $2,500 to $4,999 | 0 (0.0%) | 8 (8.3%) |
| $5,000 to $7,499 | 15 (12.9%) | 0 (0.0%) |
| $7,500 to $9,999 | 3 (2.6%) | 0 (0.0%) |
| $10,000 to $12,499 | 3 (2.6%) | 11 (11.5%) |
| $12,500 to $14,999 | 9 (7.8%) | 2 (2.1%) |
| $15,000 to $17,499 | 2 (1.7%) | 3 (3.1%) |
| $17,500 to $19,999 | 1 (0.9%) | 9 (9.4%) |
| $20,000 to $22,499 | 0 (0.0%) | 0 (0.0%) |
| $22,500 to $24,999 | 0 (0.0%) | 3 (3.1%) |
| $25,000 to $29,999 | 1 (0.9%) | 2 (2.1%) |
| $30,000 to $34,999 | 0 (0.0%) | 18 (18.8%) |
| $35,000 to $39,999 | 10 (8.6%) | 10 (10.4%) |
| $40,000 to $44,999 | 6 (5.2%) | 0 (0.0%) |
| $45,000 to $49,999 | 3 (2.6%) | 7 (7.3%) |
| $50,000 to $54,999 | 10 (8.6%) | 0 (0.0%) |
| $55,000 to $64,999 | 13 (11.2%) | 3 (3.1%) |
| $65,000 to $74,999 | 0 (0.0%) | 2 (2.1%) |
| $75,000 to $99,999 | 3 (2.6%) | 8 (8.3%) |
| $100,000+ | 20 (17.2%) | 0 (0.0%) |
| Total | 116 (100.0%) | 96 (100.0%) |
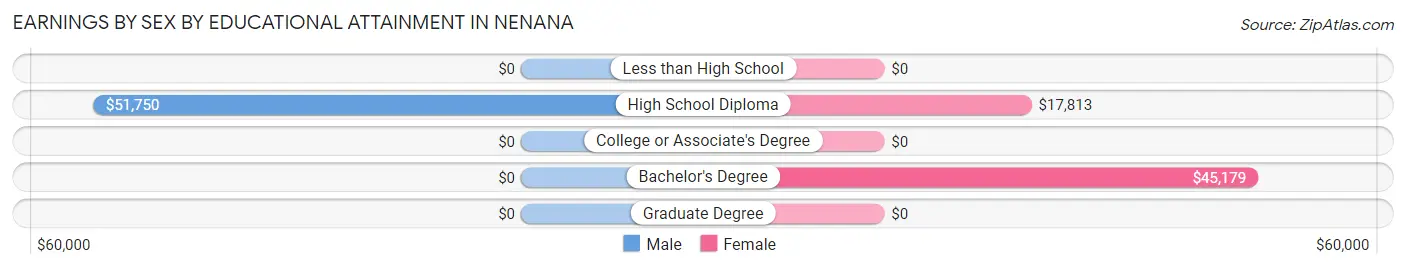
Earnings by Sex by Educational Attainment in Nenana
Average earnings in Nenana are $38,750 for men and $23,333 for women, a difference of 39.8%. Men with an educational attainment of high school diploma enjoy the highest average annual earnings of $51,750, while those with high school diploma education earn the least with $51,750. Women with an educational attainment of bachelor's degree earn the most with the average annual earnings of $45,179, while those with high school diploma education have the smallest earnings of $17,813.
| Educational Attainment | Male Income | Female Income |
| Less than High School | - | - |
| High School Diploma | $51,750 | $17,813 |
| College or Associate's Degree | - | - |
| Bachelor's Degree | - | - |
| Graduate Degree | - | - |
| Total | $38,750 | $23,333 |
Family Income in Nenana
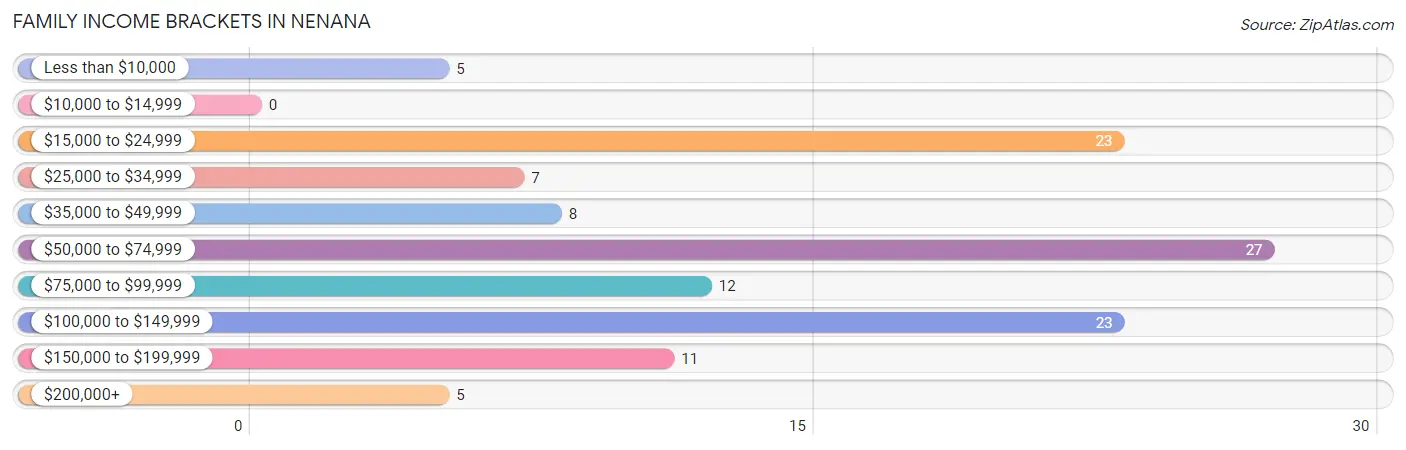
Family Income Brackets in Nenana
According to the Nenana family income data, there are 27 families falling into the $50,000 to $74,999 income range, which is the most common income bracket and makes up 22.3% of all families.
| Income Bracket | # Families | % Families |
| Less than $10,000 | 5 | 4.1% |
| $10,000 to $14,999 | 0 | 0.0% |
| $15,000 to $24,999 | 23 | 19.0% |
| $25,000 to $34,999 | 7 | 5.8% |
| $35,000 to $49,999 | 8 | 6.6% |
| $50,000 to $74,999 | 27 | 22.3% |
| $75,000 to $99,999 | 12 | 9.9% |
| $100,000 to $149,999 | 23 | 19.0% |
| $150,000 to $199,999 | 11 | 9.1% |
| $200,000+ | 5 | 4.1% |
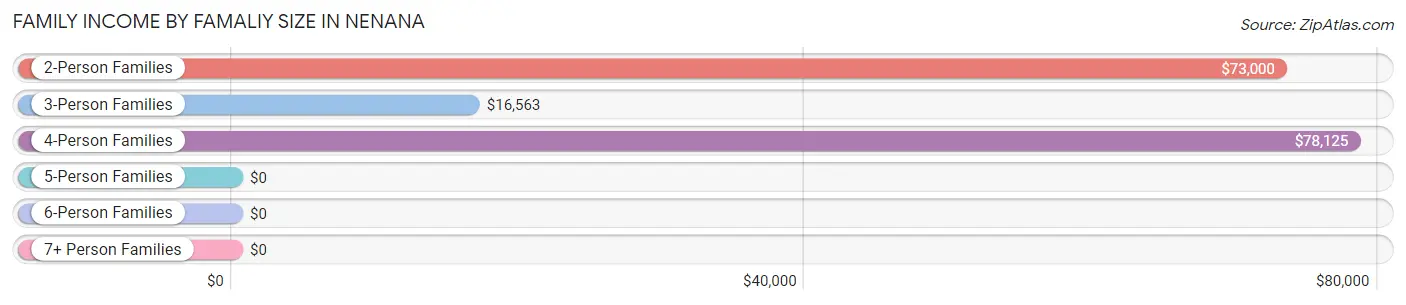
Family Income by Famaliy Size in Nenana
4-person families (35 | 28.9%) account for the highest median family income in Nenana with $78,125 per family, while 2-person families (56 | 46.3%) have the highest median income of $36,500 per family member.
| Income Bracket | # Families | Median Income |
| 2-Person Families | 56 (46.3%) | $73,000 |
| 3-Person Families | 25 (20.7%) | $16,563 |
| 4-Person Families | 35 (28.9%) | $78,125 |
| 5-Person Families | 5 (4.1%) | $0 |
| 6-Person Families | 0 (0.0%) | $0 |
| 7+ Person Families | 0 (0.0%) | $0 |
| Total | 121 (100.0%) | $61,250 |
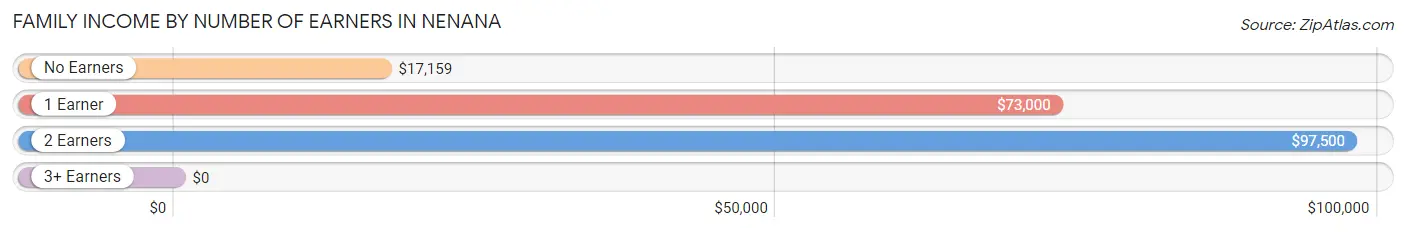
Family Income by Number of Earners in Nenana
| Number of Earners | # Families | Median Income |
| No Earners | 29 (24.0%) | $17,159 |
| 1 Earner | 42 (34.7%) | $73,000 |
| 2 Earners | 50 (41.3%) | $97,500 |
| 3+ Earners | 0 (0.0%) | $0 |
| Total | 121 (100.0%) | $61,250 |
Household Income in Nenana
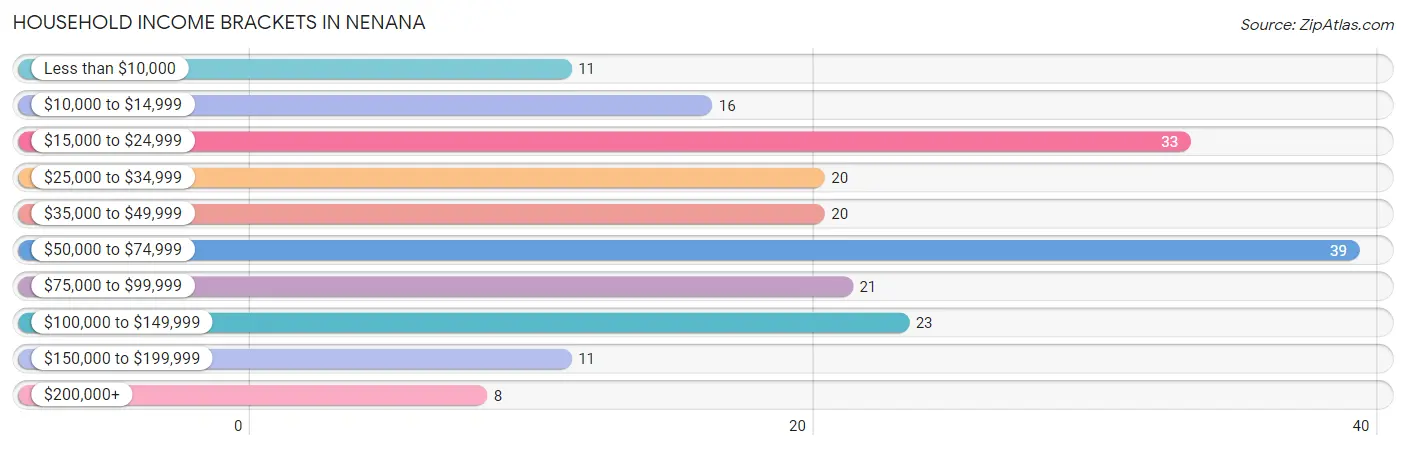
Household Income Brackets in Nenana
With 39 households falling in the category, the $50,000 to $74,999 income range is the most frequent in Nenana, accounting for 19.3% of all households. In contrast, only 8 households (4.0%) fall into the $200,000+ income bracket, making it the least populous group.
| Income Bracket | # Households | % Households |
| Less than $10,000 | 11 | 5.4% |
| $10,000 to $14,999 | 16 | 7.9% |
| $15,000 to $24,999 | 33 | 16.3% |
| $25,000 to $34,999 | 20 | 9.9% |
| $35,000 to $49,999 | 20 | 9.9% |
| $50,000 to $74,999 | 39 | 19.3% |
| $75,000 to $99,999 | 21 | 10.4% |
| $100,000 to $149,999 | 23 | 11.4% |
| $150,000 to $199,999 | 11 | 5.4% |
| $200,000+ | 8 | 4.0% |
Household Income by Householder Age in Nenana
The median household income in Nenana is $50,357, with the highest median household income of $68,750 found in the 45 to 64 years age bracket for the primary householder. A total of 48 households (23.8%) fall into this category. Meanwhile, the 15 to 24 years age bracket for the primary householder has the lowest median household income of $0, with 4 households (2.0%) in this group.
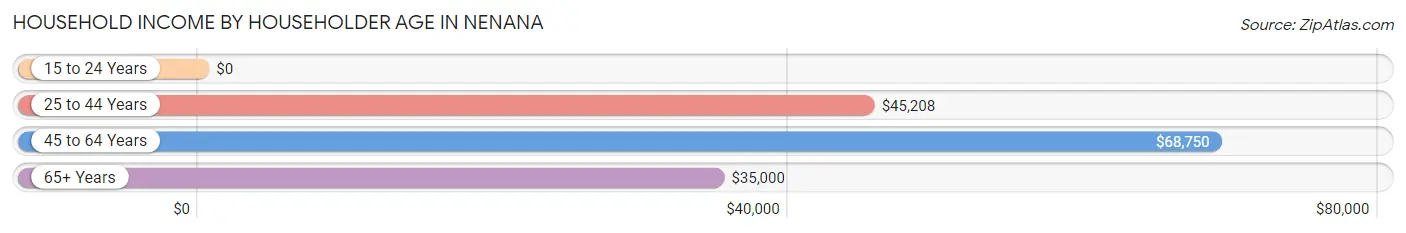
| Income Bracket | # Households | Median Income |
| 15 to 24 Years | 4 (2.0%) | $0 |
| 25 to 44 Years | 80 (39.6%) | $45,208 |
| 45 to 64 Years | 48 (23.8%) | $68,750 |
| 65+ Years | 70 (34.6%) | $35,000 |
| Total | 202 (100.0%) | $50,357 |
Poverty in Nenana
Income Below Poverty by Sex and Age in Nenana
With 19.3% poverty level for males and 28.3% for females among the residents of Nenana, 35 to 44 year old males and under 5 year old females are the most vulnerable to poverty, with 16 males (55.2%) and 44 females (88.0%) in their respective age groups living below the poverty level.
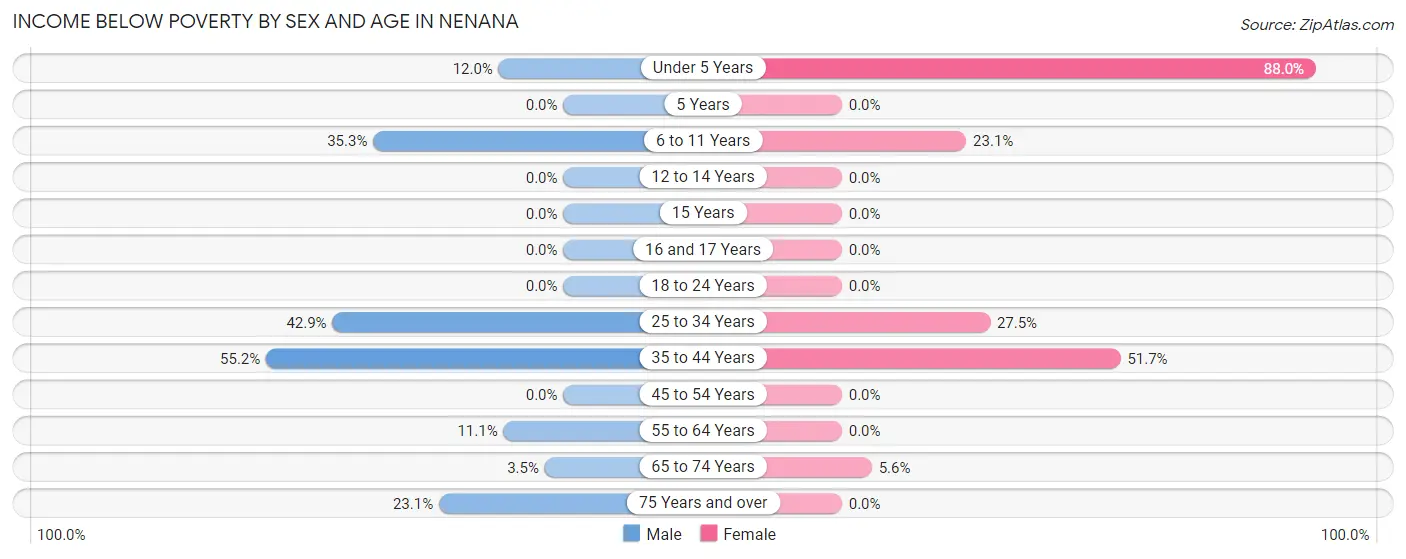
| Age Bracket | Male | Female |
| Under 5 Years | 3 (12.0%) | 44 (88.0%) |
| 5 Years | 0 (0.0%) | 0 (0.0%) |
| 6 to 11 Years | 6 (35.3%) | 9 (23.1%) |
| 12 to 14 Years | 0 (0.0%) | 0 (0.0%) |
| 15 Years | 0 (0.0%) | 0 (0.0%) |
| 16 and 17 Years | 0 (0.0%) | 0 (0.0%) |
| 18 to 24 Years | 0 (0.0%) | 0 (0.0%) |
| 25 to 34 Years | 9 (42.9%) | 11 (27.5%) |
| 35 to 44 Years | 16 (55.2%) | 15 (51.7%) |
| 45 to 54 Years | 0 (0.0%) | 0 (0.0%) |
| 55 to 64 Years | 3 (11.1%) | 0 (0.0%) |
| 65 to 74 Years | 1 (3.5%) | 2 (5.6%) |
| 75 Years and over | 3 (23.1%) | 0 (0.0%) |
| Total | 41 (19.3%) | 81 (28.3%) |
Income Above Poverty by Sex and Age in Nenana
According to the poverty statistics in Nenana, males aged 5 years and females aged 5 years are the age groups that are most secure financially, with 100.0% of males and 100.0% of females in these age groups living above the poverty line.
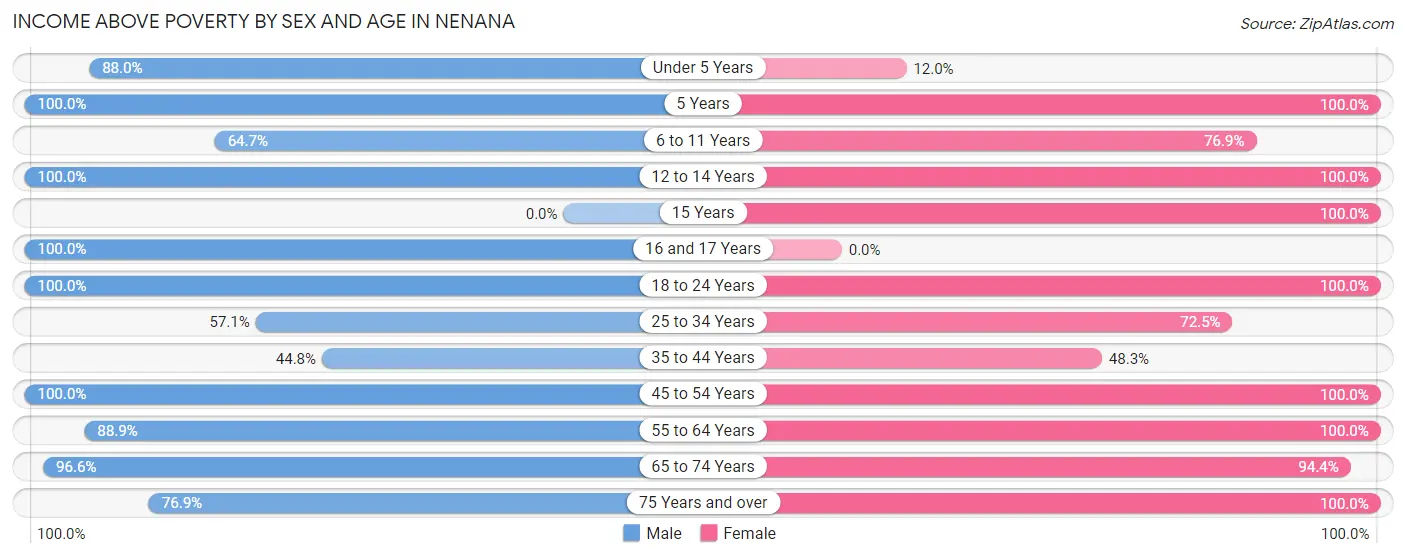
| Age Bracket | Male | Female |
| Under 5 Years | 22 (88.0%) | 6 (12.0%) |
| 5 Years | 5 (100.0%) | 12 (100.0%) |
| 6 to 11 Years | 11 (64.7%) | 30 (76.9%) |
| 12 to 14 Years | 10 (100.0%) | 3 (100.0%) |
| 15 Years | 0 (0.0%) | 17 (100.0%) |
| 16 and 17 Years | 7 (100.0%) | 0 (0.0%) |
| 18 to 24 Years | 4 (100.0%) | 8 (100.0%) |
| 25 to 34 Years | 12 (57.1%) | 29 (72.5%) |
| 35 to 44 Years | 13 (44.8%) | 14 (48.3%) |
| 45 to 54 Years | 26 (100.0%) | 16 (100.0%) |
| 55 to 64 Years | 24 (88.9%) | 21 (100.0%) |
| 65 to 74 Years | 28 (96.6%) | 34 (94.4%) |
| 75 Years and over | 10 (76.9%) | 15 (100.0%) |
| Total | 172 (80.7%) | 205 (71.7%) |
Income Below Poverty Among Married-Couple Families in Nenana
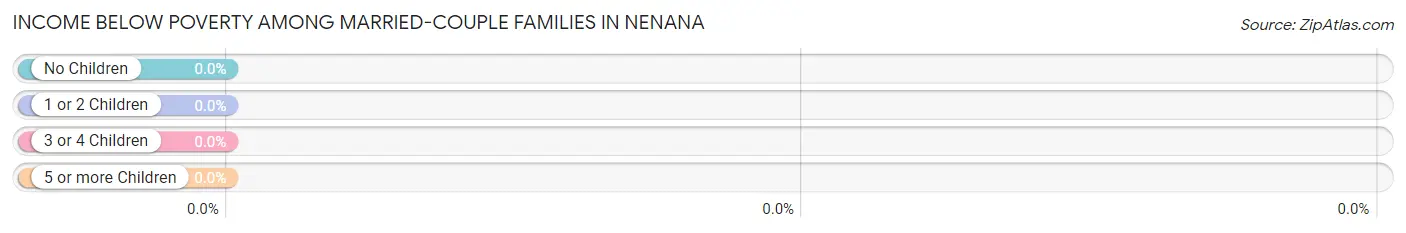
| Children | Above Poverty | Below Poverty |
| No Children | 44 (100.0%) | 0 (0.0%) |
| 1 or 2 Children | 13 (100.0%) | 0 (0.0%) |
| 3 or 4 Children | 5 (100.0%) | 0 (0.0%) |
| 5 or more Children | 0 (0.0%) | 0 (0.0%) |
| Total | 62 (100.0%) | 0 (0.0%) |
Income Below Poverty Among Single-Parent Households in Nenana
According to the poverty data in Nenana, 32.1% or 9 single-father households and 51.6% or 16 single-mother households are living below the poverty line. Among single-father households, those with 1 or 2 children have the highest poverty rate, with 9 households (45.0%) experiencing poverty. Likewise, among single-mother households, those with 1 or 2 children have the highest poverty rate, with 11 households (91.7%) falling below the poverty line.
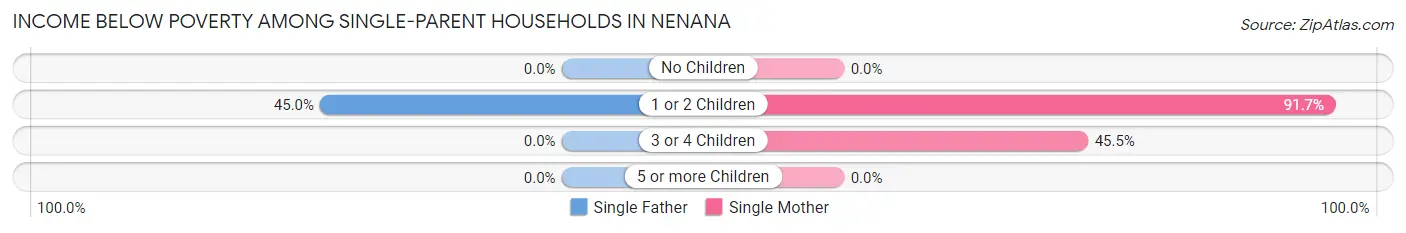
| Children | Single Father | Single Mother |
| No Children | 0 (0.0%) | 0 (0.0%) |
| 1 or 2 Children | 9 (45.0%) | 11 (91.7%) |
| 3 or 4 Children | 0 (0.0%) | 5 (45.5%) |
| 5 or more Children | 0 (0.0%) | 0 (0.0%) |
| Total | 9 (32.1%) | 16 (51.6%) |
Income Below Poverty Among Married-Couple vs Single-Parent Households in Nenana
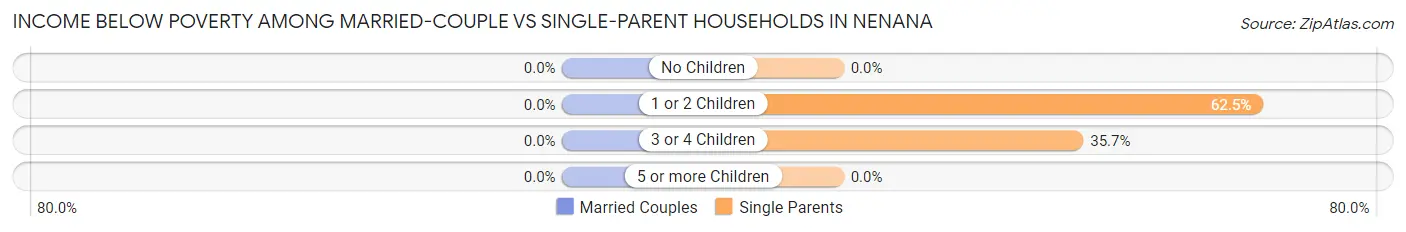
| Children | Married-Couple Families | Single-Parent Households |
| No Children | 0 (0.0%) | 0 (0.0%) |
| 1 or 2 Children | 0 (0.0%) | 20 (62.5%) |
| 3 or 4 Children | 0 (0.0%) | 5 (35.7%) |
| 5 or more Children | 0 (0.0%) | 0 (0.0%) |
| Total | 0 (0.0%) | 25 (42.4%) |
Race in Nenana
The most populous races in Nenana are White / Caucasian (273 | 53.7%), Native / Alaskan (182 | 35.8%), and Two or more Races (53 | 10.4%).
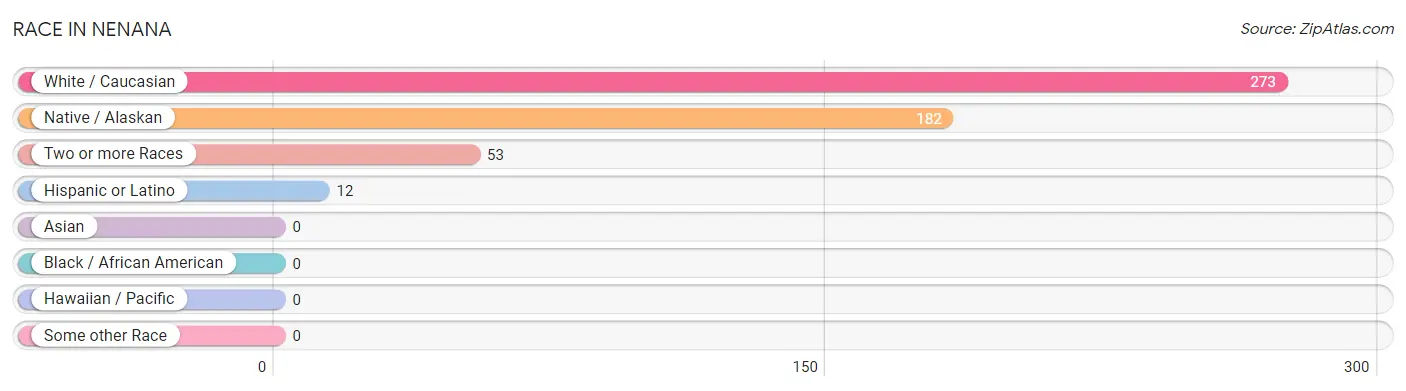
| Race | # Population | % Population |
| Asian | 0 | 0.0% |
| Black / African American | 0 | 0.0% |
| Hawaiian / Pacific | 0 | 0.0% |
| Hispanic or Latino | 12 | 2.4% |
| Native / Alaskan | 182 | 35.8% |
| White / Caucasian | 273 | 53.7% |
| Two or more Races | 53 | 10.4% |
| Some other Race | 0 | 0.0% |
| Total | 508 | 100.0% |
Ancestry in Nenana
The most populous ancestries reported in Nenana are Alaskan Athabascan (189 | 37.2%), German (112 | 22.1%), English (74 | 14.6%), Scottish (62 | 12.2%), and Alaska Native (31 | 6.1%), together accounting for 92.1% of all Nenana residents.
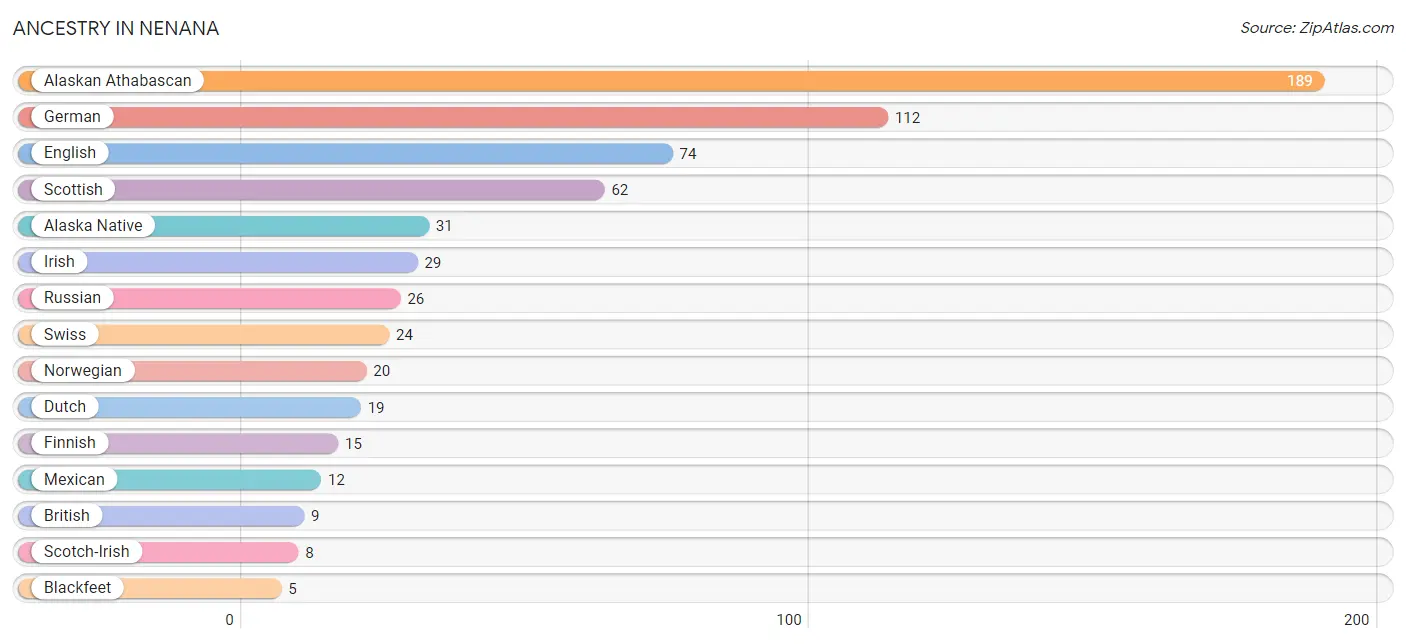
| Ancestry | # Population | % Population |
| Alaska Native | 31 | 6.1% |
| Alaskan Athabascan | 189 | 37.2% |
| American | 3 | 0.6% |
| Apache | 3 | 0.6% |
| Austrian | 1 | 0.2% |
| Blackfeet | 5 | 1.0% |
| British | 9 | 1.8% |
| Chickasaw | 5 | 1.0% |
| Czech | 3 | 0.6% |
| Dutch | 19 | 3.7% |
| English | 74 | 14.6% |
| European | 5 | 1.0% |
| Finnish | 15 | 2.9% |
| French | 4 | 0.8% |
| French Canadian | 3 | 0.6% |
| German | 112 | 22.1% |
| Inupiat | 5 | 1.0% |
| Irish | 29 | 5.7% |
| Italian | 5 | 1.0% |
| Mexican | 12 | 2.4% |
| Northern European | 1 | 0.2% |
| Norwegian | 20 | 3.9% |
| Russian | 26 | 5.1% |
| Scotch-Irish | 8 | 1.6% |
| Scottish | 62 | 12.2% |
| Swedish | 5 | 1.0% |
| Swiss | 24 | 4.7% |
| Welsh | 5 | 1.0% | View All 28 Rows |
Immigrants in Nenana

| Immigration Origin | # Population | % Population | View All 0 Rows |
Sex and Age in Nenana
Sex and Age in Nenana
The most populous age groups in Nenana are Under 5 Years (25 | 11.7%) for men and Under 5 Years (50 | 17.0%) for women.
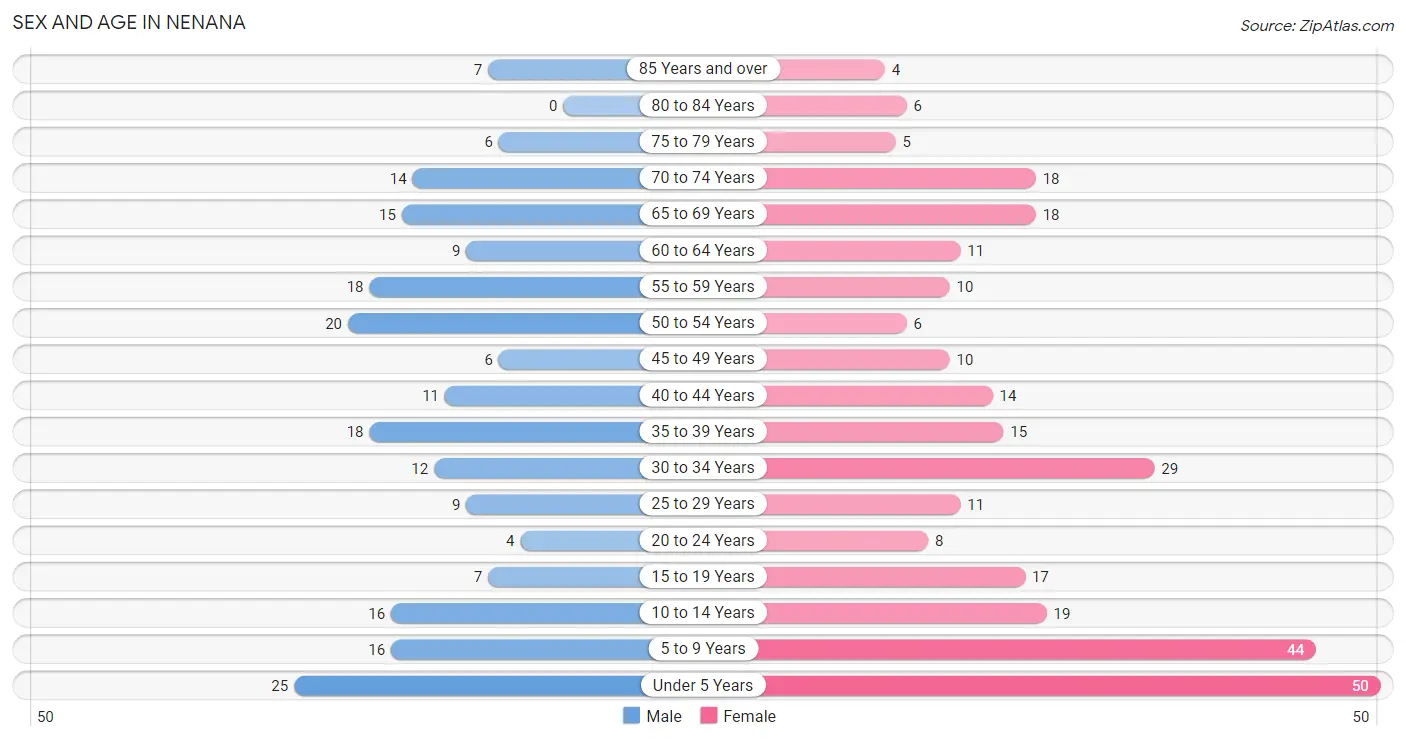
| Age Bracket | Male | Female |
| Under 5 Years | 25 (11.7%) | 50 (17.0%) |
| 5 to 9 Years | 16 (7.5%) | 44 (14.9%) |
| 10 to 14 Years | 16 (7.5%) | 19 (6.4%) |
| 15 to 19 Years | 7 (3.3%) | 17 (5.8%) |
| 20 to 24 Years | 4 (1.9%) | 8 (2.7%) |
| 25 to 29 Years | 9 (4.2%) | 11 (3.7%) |
| 30 to 34 Years | 12 (5.6%) | 29 (9.8%) |
| 35 to 39 Years | 18 (8.5%) | 15 (5.1%) |
| 40 to 44 Years | 11 (5.2%) | 14 (4.8%) |
| 45 to 49 Years | 6 (2.8%) | 10 (3.4%) |
| 50 to 54 Years | 20 (9.4%) | 6 (2.0%) |
| 55 to 59 Years | 18 (8.5%) | 10 (3.4%) |
| 60 to 64 Years | 9 (4.2%) | 11 (3.7%) |
| 65 to 69 Years | 15 (7.0%) | 18 (6.1%) |
| 70 to 74 Years | 14 (6.6%) | 18 (6.1%) |
| 75 to 79 Years | 6 (2.8%) | 5 (1.7%) |
| 80 to 84 Years | 0 (0.0%) | 6 (2.0%) |
| 85 Years and over | 7 (3.3%) | 4 (1.4%) |
| Total | 213 (100.0%) | 295 (100.0%) |
Families and Households in Nenana
Median Family Size in Nenana
The median family size in Nenana is 3.22 persons per family, with single female/mother families (31 | 25.6%) accounting for the largest median family size of 4.39 persons per family. On the other hand, married-couple families (62 | 51.2%) represent the smallest median family size with 2.76 persons per family.
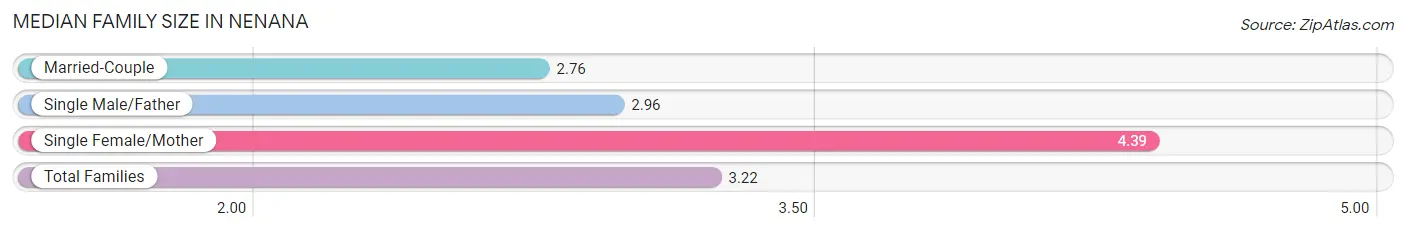
| Family Type | # Families | Family Size |
| Married-Couple | 62 (51.2%) | 2.76 |
| Single Male/Father | 28 (23.1%) | 2.96 |
| Single Female/Mother | 31 (25.6%) | 4.39 |
| Total Families | 121 (100.0%) | 3.22 |
Median Household Size in Nenana
The median household size in Nenana is 2.51 persons per household, with single female/mother households (31 | 15.3%) accounting for the largest median household size of 4.55 persons per household. non-family households (81 | 40.1%) represent the smallest median household size with 1.16 persons per household.
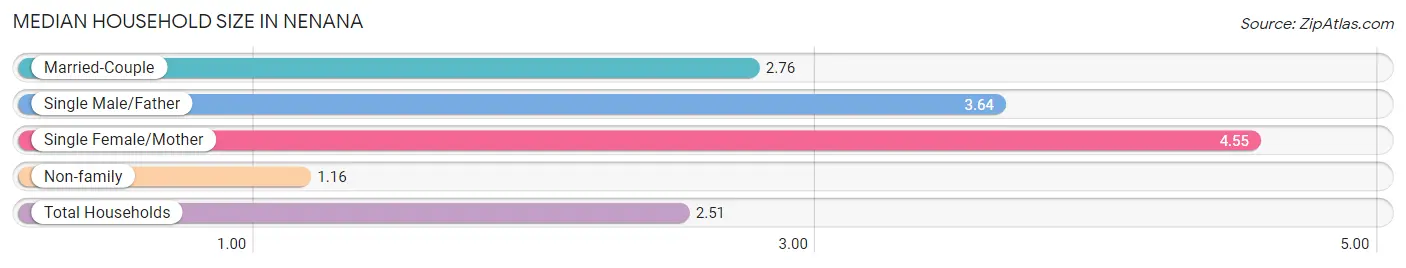
| Household Type | # Households | Household Size |
| Married-Couple | 62 (30.7%) | 2.76 |
| Single Male/Father | 28 (13.9%) | 3.64 |
| Single Female/Mother | 31 (15.3%) | 4.55 |
| Non-family | 81 (40.1%) | 1.16 |
| Total Households | 202 (100.0%) | 2.51 |
Household Size by Marriage Status in Nenana
Out of a total of 202 households in Nenana, 121 (59.9%) are family households, while 81 (40.1%) are nonfamily households. The most numerous type of family households are 2-person households, comprising 56, and the most common type of nonfamily households are 1-person households, comprising 71.
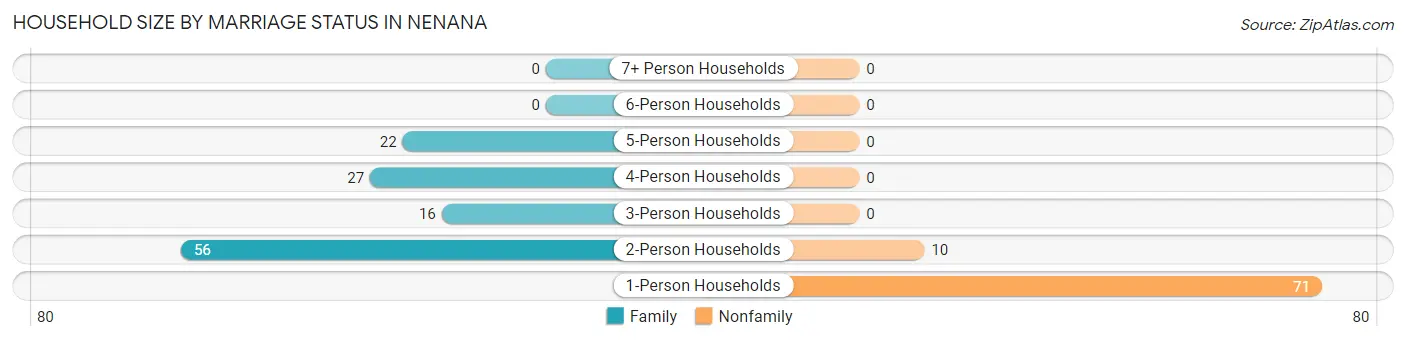
| Household Size | Family Households | Nonfamily Households |
| 1-Person Households | - | 71 (35.1%) |
| 2-Person Households | 56 (27.7%) | 10 (5.0%) |
| 3-Person Households | 16 (7.9%) | 0 (0.0%) |
| 4-Person Households | 27 (13.4%) | 0 (0.0%) |
| 5-Person Households | 22 (10.9%) | 0 (0.0%) |
| 6-Person Households | 0 (0.0%) | 0 (0.0%) |
| 7+ Person Households | 0 (0.0%) | 0 (0.0%) |
| Total | 121 (59.9%) | 81 (40.1%) |
Female Fertility in Nenana
Fertility by Age in Nenana
Average fertility rate in Nenana is 154.0 births per 1,000 women. Women in the age bracket of 35 to 50 years have the highest fertility rate with 282.0 births per 1,000 women. Women in the age bracket of 35 to 50 years acount for 68.8% of all women with births.
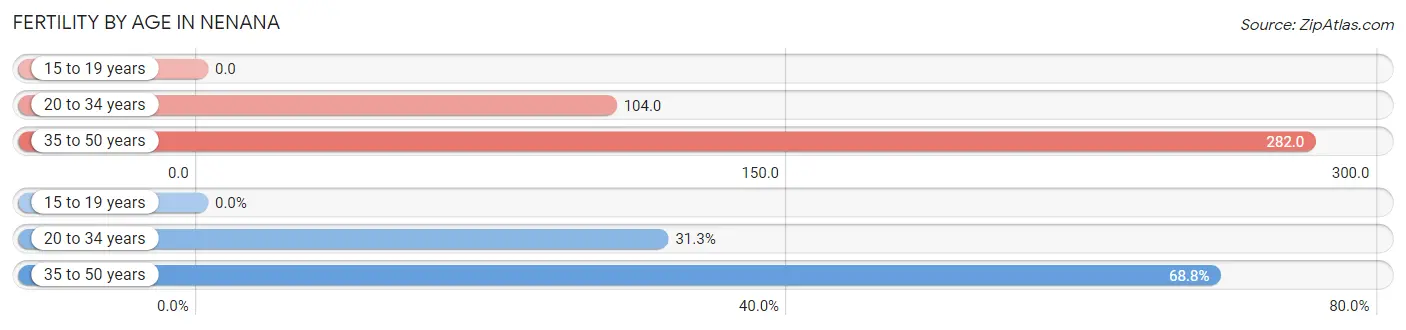
| Age Bracket | Women with Births | Births / 1,000 Women |
| 15 to 19 years | 0 (0.0%) | 0.0 |
| 20 to 34 years | 5 (31.2%) | 104.0 |
| 35 to 50 years | 11 (68.8%) | 282.0 |
| Total | 16 (100.0%) | 154.0 |
Fertility by Age by Marriage Status in Nenana
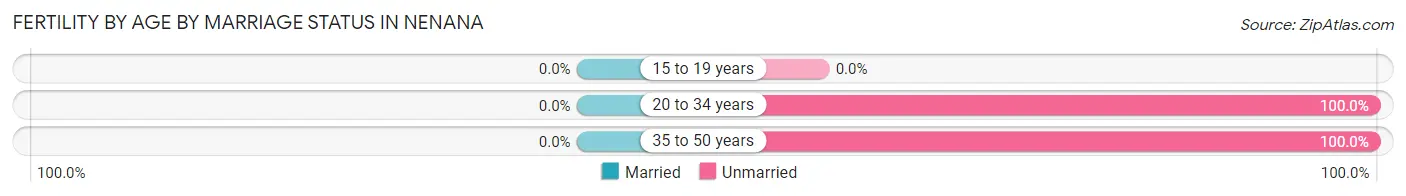
| Age Bracket | Married | Unmarried |
| 15 to 19 years | 0 (0.0%) | 0 (0.0%) |
| 20 to 34 years | 0 (0.0%) | 5 (100.0%) |
| 35 to 50 years | 0 (0.0%) | 11 (100.0%) |
| Total | 0 (0.0%) | 16 (100.0%) |
Fertility by Education in Nenana
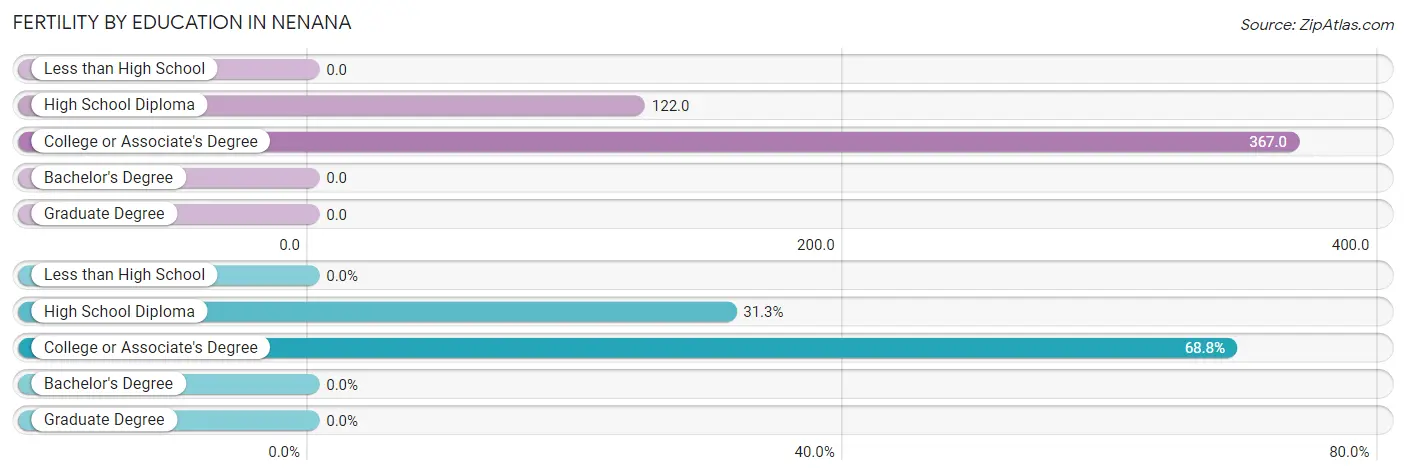
| Educational Attainment | Women with Births | Births / 1,000 Women |
| Less than High School | 0 (0.0%) | 0.0 |
| High School Diploma | 5 (31.2%) | 122.0 |
| College or Associate's Degree | 11 (68.8%) | 367.0 |
| Bachelor's Degree | 0 (0.0%) | 0.0 |
| Graduate Degree | 0 (0.0%) | 0.0 |
| Total | 16 (100.0%) | 154.0 |
Fertility by Education by Marriage Status in Nenana
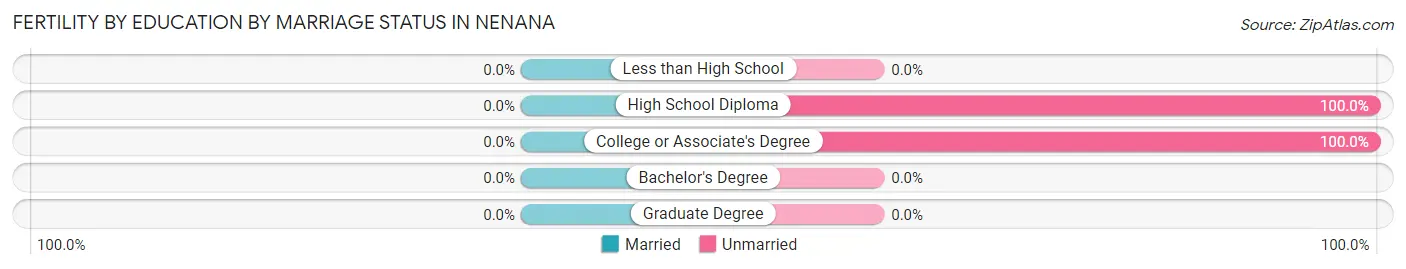
| Educational Attainment | Married | Unmarried |
| Less than High School | 0 (0.0%) | 0 (0.0%) |
| High School Diploma | 0 (0.0%) | 5 (100.0%) |
| College or Associate's Degree | 0 (0.0%) | 11 (100.0%) |
| Bachelor's Degree | 0 (0.0%) | 0 (0.0%) |
| Graduate Degree | 0 (0.0%) | 0 (0.0%) |
| Total | 0 (0.0%) | 16 (100.0%) |
Employment Characteristics in Nenana
Employment by Class of Employer in Nenana
Among the 138 employed individuals in Nenana, private company employees (46 | 33.3%), local government employees (32 | 23.2%), and state government employees (23 | 16.7%) make up the most common classes of employment.
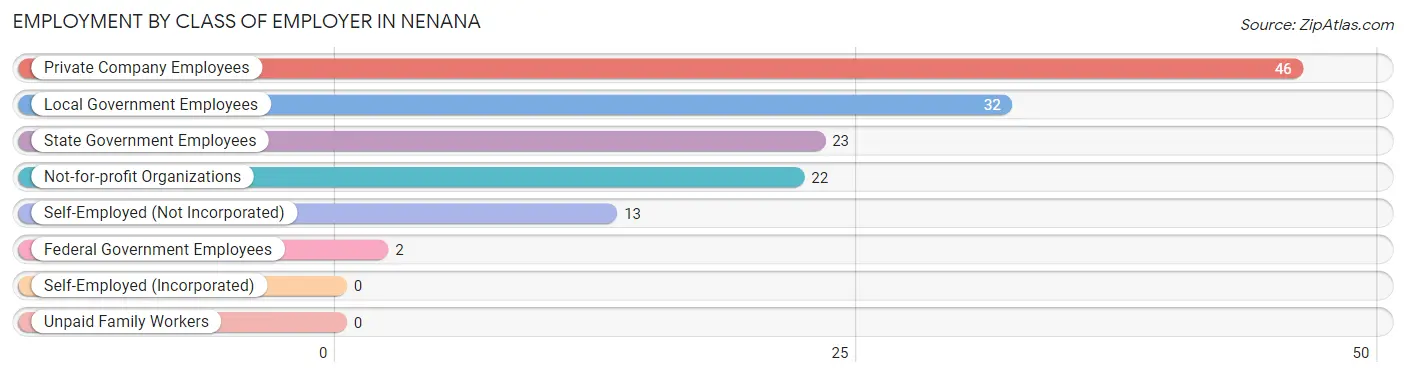
| Employer Class | # Employees | % Employees |
| Private Company Employees | 46 | 33.3% |
| Self-Employed (Incorporated) | 0 | 0.0% |
| Self-Employed (Not Incorporated) | 13 | 9.4% |
| Not-for-profit Organizations | 22 | 15.9% |
| Local Government Employees | 32 | 23.2% |
| State Government Employees | 23 | 16.7% |
| Federal Government Employees | 2 | 1.5% |
| Unpaid Family Workers | 0 | 0.0% |
| Total | 138 | 100.0% |
Employment Status by Age in Nenana
According to the labor force statistics for Nenana, out of the total population over 16 years of age (321), 50.8% or 163 individuals are in the labor force, with 8.0% or 13 of them unemployed. The age group with the highest labor force participation rate is 20 to 24 years, with 100.0% or 12 individuals in the labor force. Within the labor force, the 35 to 44 years age range has the highest percentage of unemployed individuals, with 19.4% or 7 of them being unemployed.
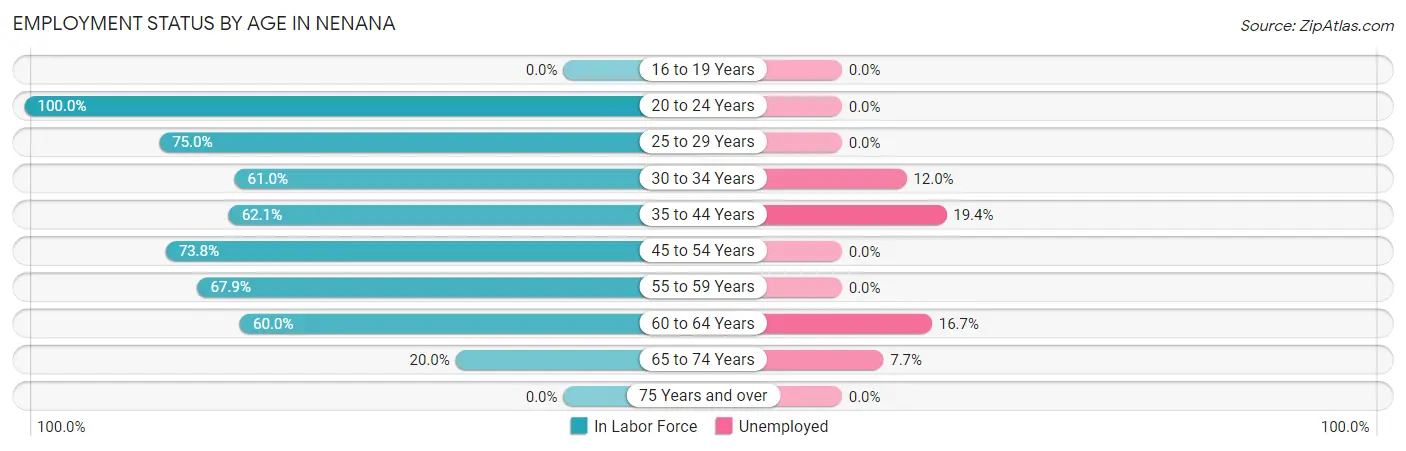
| Age Bracket | In Labor Force | Unemployed |
| 16 to 19 Years | 0 (0.0%) | 0 (0.0%) |
| 20 to 24 Years | 12 (100.0%) | 0 (0.0%) |
| 25 to 29 Years | 15 (75.0%) | 0 (0.0%) |
| 30 to 34 Years | 25 (61.0%) | 3 (12.0%) |
| 35 to 44 Years | 36 (62.1%) | 7 (19.4%) |
| 45 to 54 Years | 31 (73.8%) | 0 (0.0%) |
| 55 to 59 Years | 19 (67.9%) | 0 (0.0%) |
| 60 to 64 Years | 12 (60.0%) | 2 (16.7%) |
| 65 to 74 Years | 13 (20.0%) | 1 (7.7%) |
| 75 Years and over | 0 (0.0%) | 0 (0.0%) |
| Total | 163 (50.8%) | 13 (8.0%) |
Employment Status by Educational Attainment in Nenana
According to labor force statistics for Nenana, 66.0% of individuals (138) out of the total population between 25 and 64 years of age (209) are in the labor force, with 8.7% or 12 of them being unemployed. The group with the highest labor force participation rate are those with the educational attainment of college / associate degree, with 77.6% or 66 individuals in the labor force. Within the labor force, individuals with less than high school education have the highest percentage of unemployment, with 36.4% or 4 of them being unemployed.
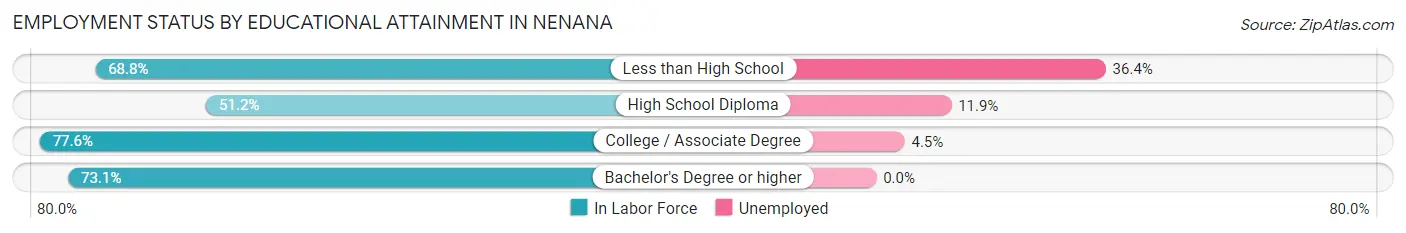
| Educational Attainment | In Labor Force | Unemployed |
| Less than High School | 11 (68.8%) | 6 (36.4%) |
| High School Diploma | 42 (51.2%) | 10 (11.9%) |
| College / Associate Degree | 66 (77.6%) | 4 (4.5%) |
| Bachelor's Degree or higher | 19 (73.1%) | 0 (0.0%) |
| Total | 138 (66.0%) | 18 (8.7%) |
Employment Occupations by Sex in Nenana
Management, Business, Science and Arts Occupations
The most common Management, Business, Science and Arts occupations in Nenana are Management (17 | 11.3%), Community & Social Service (17 | 11.3%), Education Instruction & Library (13 | 8.7%), Business & Financial (11 | 7.3%), and Education, Arts & Media (4 | 2.7%).
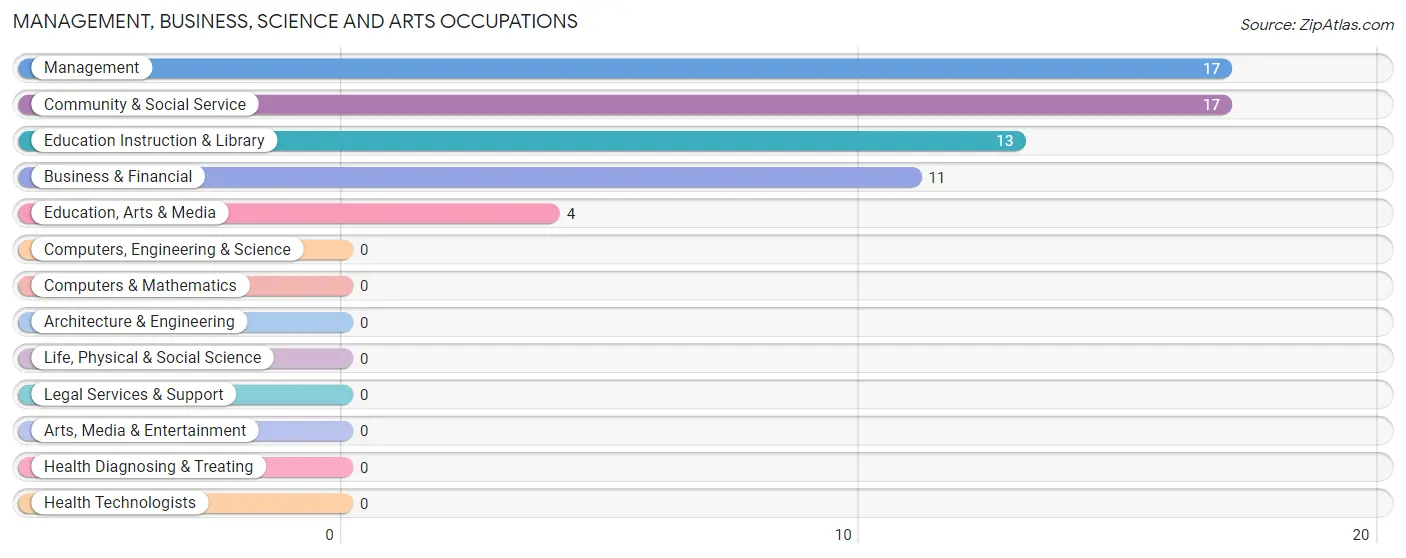
Management, Business, Science and Arts Occupations by Sex
Within the Management, Business, Science and Arts occupations in Nenana, the most male-oriented occupations are Education, Arts & Media (100.0%), Management (88.2%), and Community & Social Service (23.5%), while the most female-oriented occupations are Business & Financial (100.0%), Education Instruction & Library (100.0%), and Community & Social Service (76.5%).
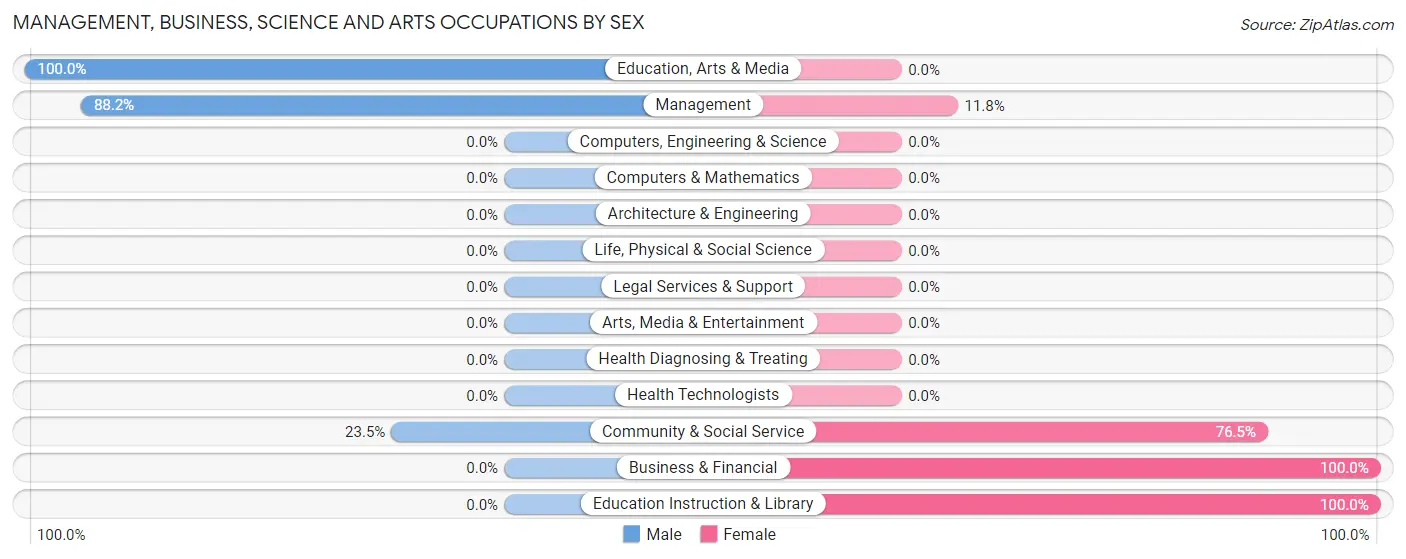
| Occupation | Male | Female |
| Management | 15 (88.2%) | 2 (11.8%) |
| Business & Financial | 0 (0.0%) | 11 (100.0%) |
| Computers, Engineering & Science | 0 (0.0%) | 0 (0.0%) |
| Computers & Mathematics | 0 (0.0%) | 0 (0.0%) |
| Architecture & Engineering | 0 (0.0%) | 0 (0.0%) |
| Life, Physical & Social Science | 0 (0.0%) | 0 (0.0%) |
| Community & Social Service | 4 (23.5%) | 13 (76.5%) |
| Education, Arts & Media | 4 (100.0%) | 0 (0.0%) |
| Legal Services & Support | 0 (0.0%) | 0 (0.0%) |
| Education Instruction & Library | 0 (0.0%) | 13 (100.0%) |
| Arts, Media & Entertainment | 0 (0.0%) | 0 (0.0%) |
| Health Diagnosing & Treating | 0 (0.0%) | 0 (0.0%) |
| Health Technologists | 0 (0.0%) | 0 (0.0%) |
| Total (Category) | 19 (42.2%) | 26 (57.8%) |
| Total (Overall) | 88 (58.7%) | 62 (41.3%) |
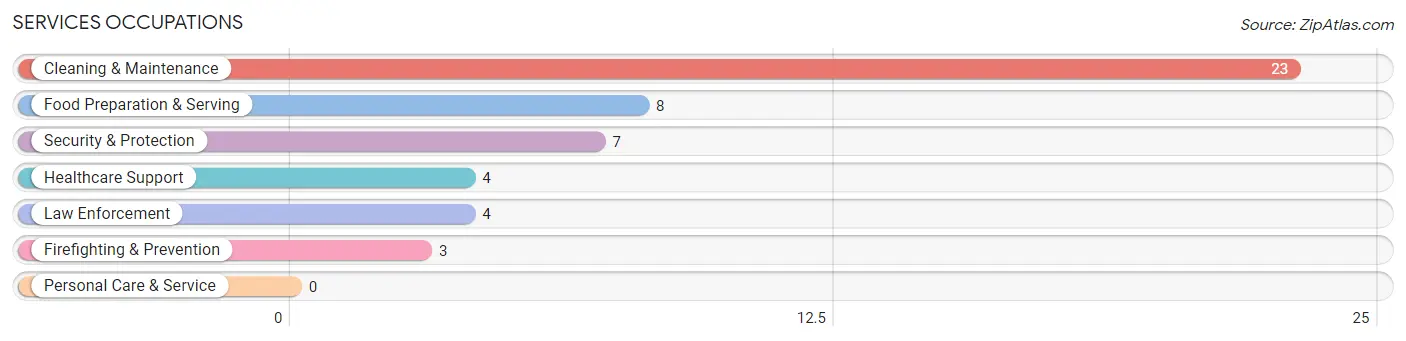
Services Occupations
The most common Services occupations in Nenana are Cleaning & Maintenance (23 | 15.3%), Food Preparation & Serving (8 | 5.3%), Security & Protection (7 | 4.7%), Healthcare Support (4 | 2.7%), and Law Enforcement (4 | 2.7%).
Services Occupations by Sex
Within the Services occupations in Nenana, the most male-oriented occupations are Security & Protection (100.0%), Firefighting & Prevention (100.0%), and Law Enforcement (100.0%), while the most female-oriented occupations are Healthcare Support (100.0%), Food Preparation & Serving (100.0%), and Cleaning & Maintenance (47.8%).
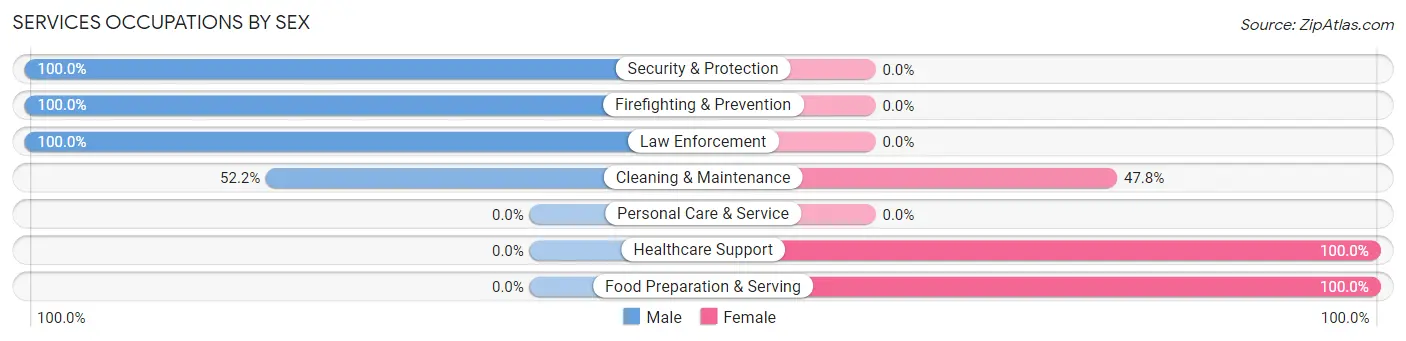
| Occupation | Male | Female |
| Healthcare Support | 0 (0.0%) | 4 (100.0%) |
| Security & Protection | 7 (100.0%) | 0 (0.0%) |
| Firefighting & Prevention | 3 (100.0%) | 0 (0.0%) |
| Law Enforcement | 4 (100.0%) | 0 (0.0%) |
| Food Preparation & Serving | 0 (0.0%) | 8 (100.0%) |
| Cleaning & Maintenance | 12 (52.2%) | 11 (47.8%) |
| Personal Care & Service | 0 (0.0%) | 0 (0.0%) |
| Total (Category) | 19 (45.2%) | 23 (54.8%) |
| Total (Overall) | 88 (58.7%) | 62 (41.3%) |
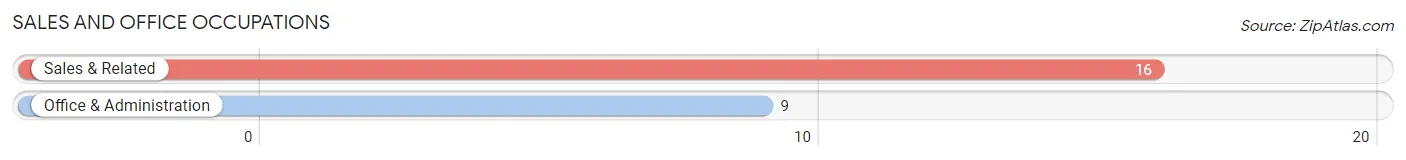
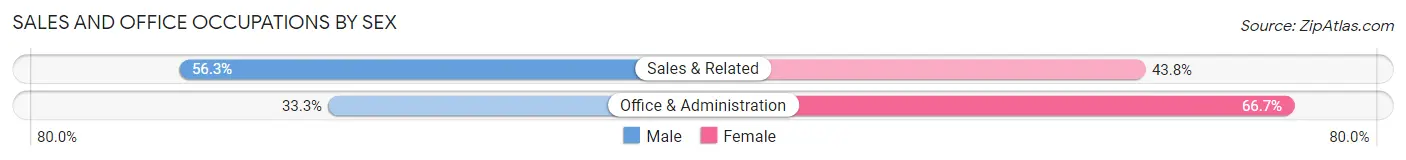
Sales and Office Occupations
The most common Sales and Office occupations in Nenana are Sales & Related (16 | 10.7%), and Office & Administration (9 | 6.0%).
Sales and Office Occupations by Sex
| Occupation | Male | Female |
| Sales & Related | 9 (56.2%) | 7 (43.8%) |
| Office & Administration | 3 (33.3%) | 6 (66.7%) |
| Total (Category) | 12 (48.0%) | 13 (52.0%) |
| Total (Overall) | 88 (58.7%) | 62 (41.3%) |
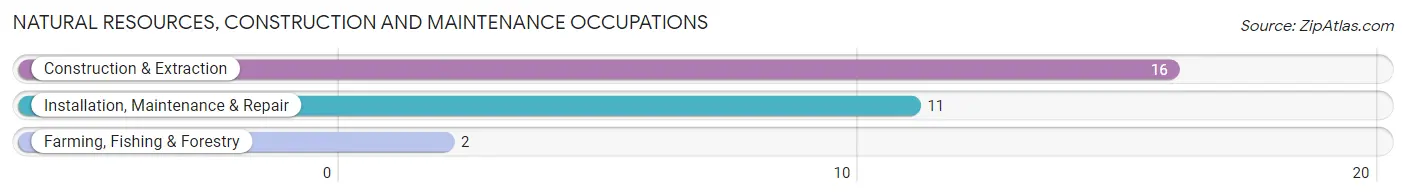
Natural Resources, Construction and Maintenance Occupations
The most common Natural Resources, Construction and Maintenance occupations in Nenana are Construction & Extraction (16 | 10.7%), Installation, Maintenance & Repair (11 | 7.3%), and Farming, Fishing & Forestry (2 | 1.3%).
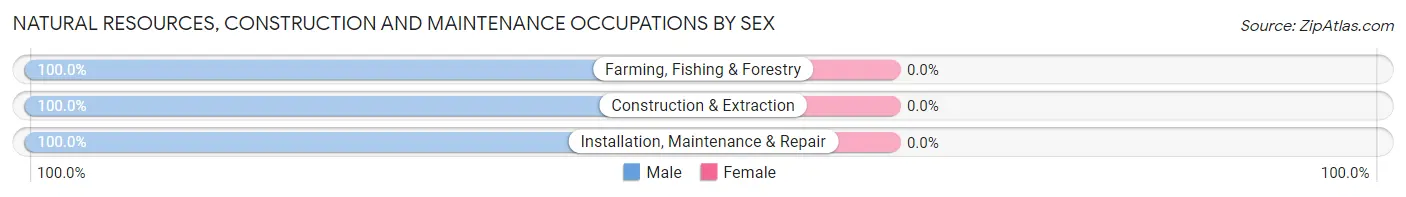
Natural Resources, Construction and Maintenance Occupations by Sex
| Occupation | Male | Female |
| Farming, Fishing & Forestry | 2 (100.0%) | 0 (0.0%) |
| Construction & Extraction | 16 (100.0%) | 0 (0.0%) |
| Installation, Maintenance & Repair | 11 (100.0%) | 0 (0.0%) |
| Total (Category) | 29 (100.0%) | 0 (0.0%) |
| Total (Overall) | 88 (58.7%) | 62 (41.3%) |
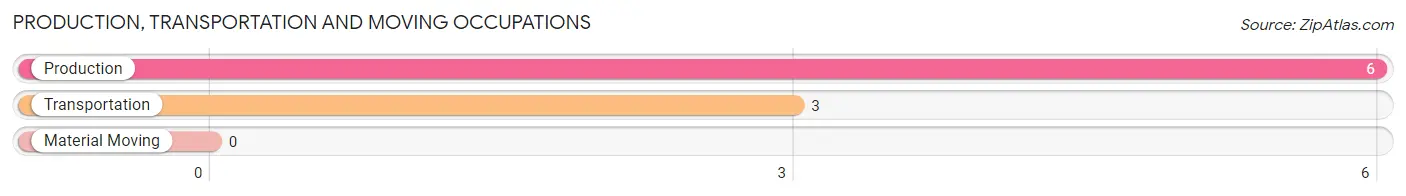
Production, Transportation and Moving Occupations
The most common Production, Transportation and Moving occupations in Nenana are Production (6 | 4.0%), and Transportation (3 | 2.0%).
Production, Transportation and Moving Occupations by Sex
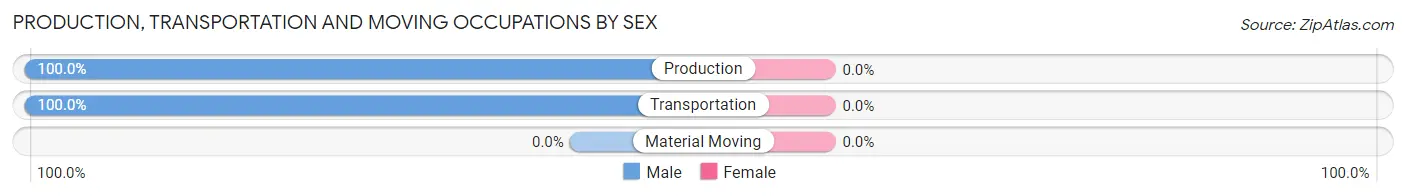
| Occupation | Male | Female |
| Production | 6 (100.0%) | 0 (0.0%) |
| Transportation | 3 (100.0%) | 0 (0.0%) |
| Material Moving | 0 (0.0%) | 0 (0.0%) |
| Total (Category) | 9 (100.0%) | 0 (0.0%) |
| Total (Overall) | 88 (58.7%) | 62 (41.3%) |
Employment Industries by Sex in Nenana
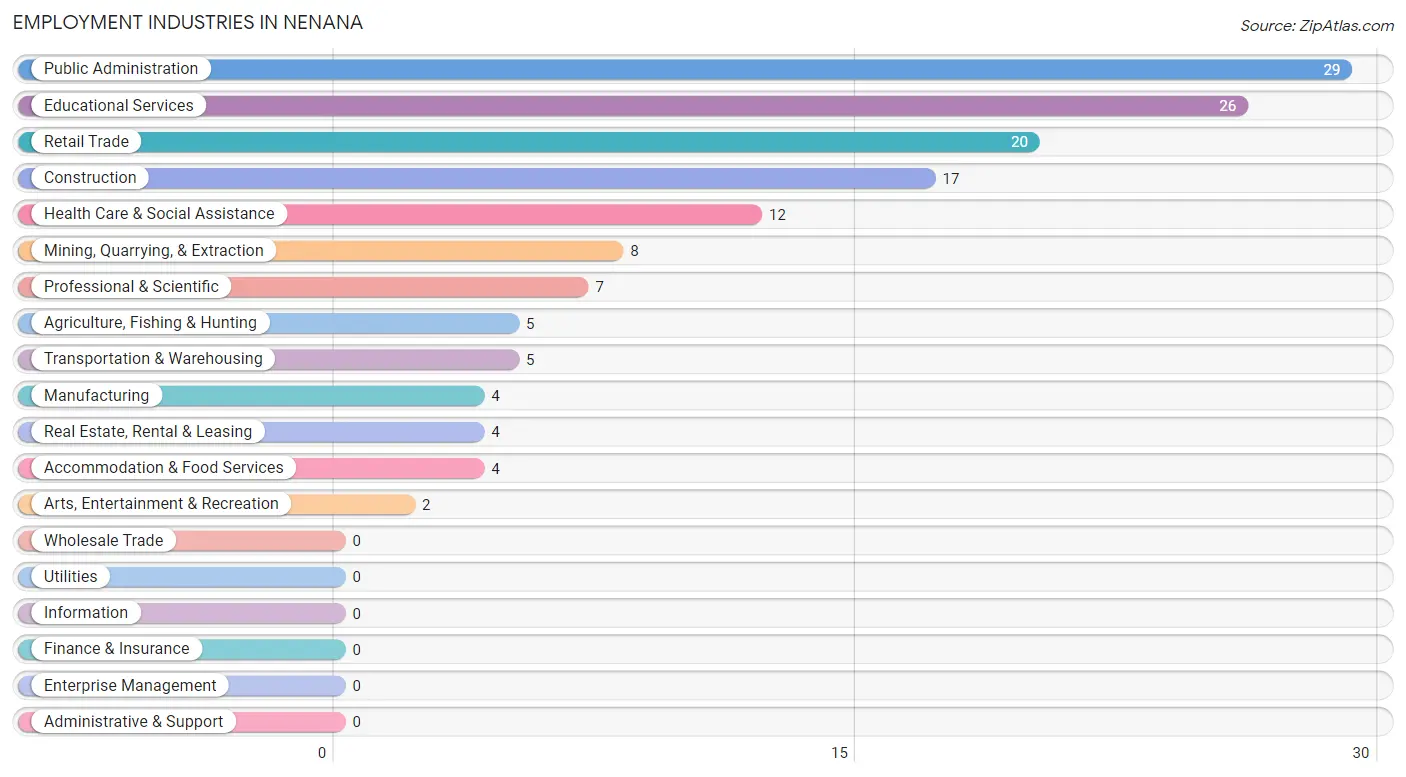
Employment Industries in Nenana
The major employment industries in Nenana include Public Administration (29 | 19.3%), Educational Services (26 | 17.3%), Retail Trade (20 | 13.3%), Construction (17 | 11.3%), and Health Care & Social Assistance (12 | 8.0%).
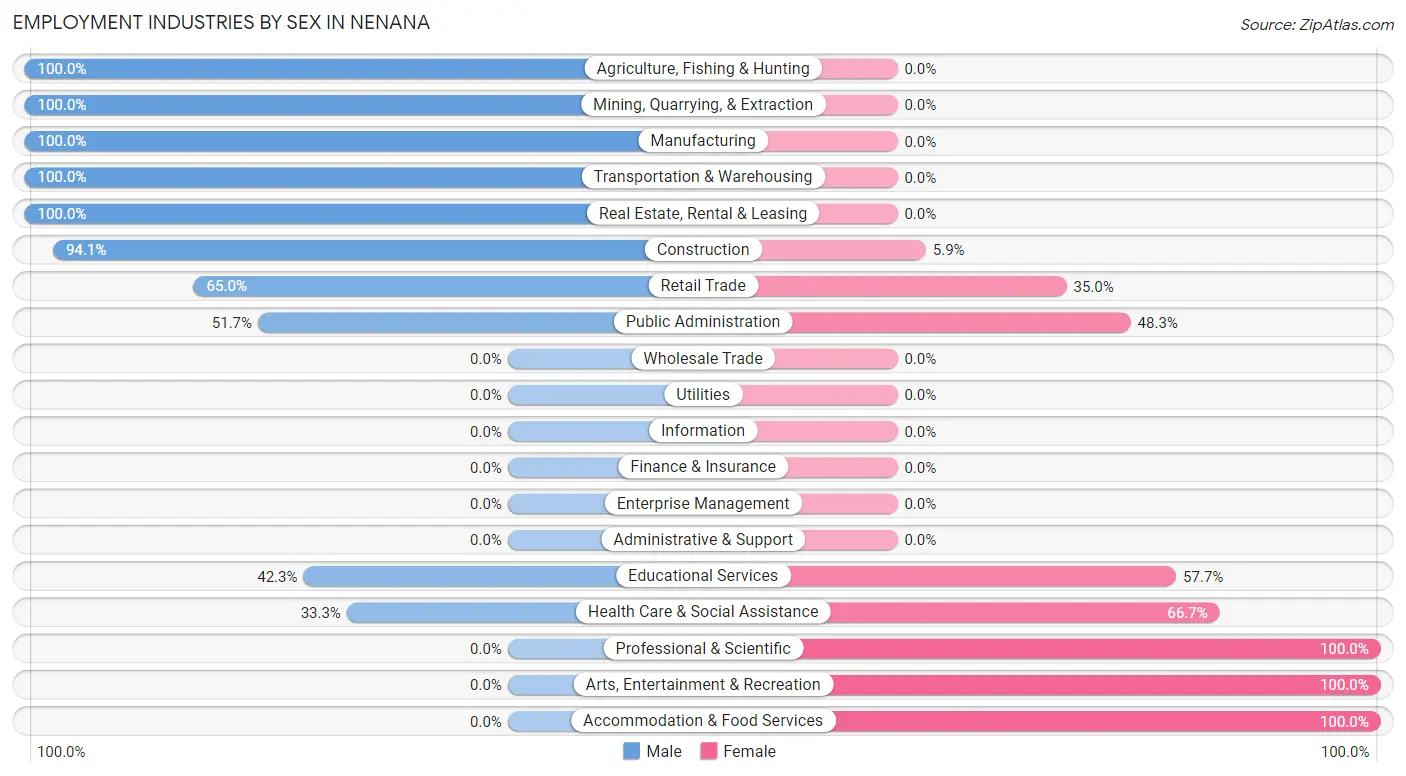
Employment Industries by Sex in Nenana
The Nenana industries that see more men than women are Agriculture, Fishing & Hunting (100.0%), Mining, Quarrying, & Extraction (100.0%), and Manufacturing (100.0%), whereas the industries that tend to have a higher number of women are Professional & Scientific (100.0%), Arts, Entertainment & Recreation (100.0%), and Accommodation & Food Services (100.0%).
| Industry | Male | Female |
| Agriculture, Fishing & Hunting | 5 (100.0%) | 0 (0.0%) |
| Mining, Quarrying, & Extraction | 8 (100.0%) | 0 (0.0%) |
| Construction | 16 (94.1%) | 1 (5.9%) |
| Manufacturing | 4 (100.0%) | 0 (0.0%) |
| Wholesale Trade | 0 (0.0%) | 0 (0.0%) |
| Retail Trade | 13 (65.0%) | 7 (35.0%) |
| Transportation & Warehousing | 5 (100.0%) | 0 (0.0%) |
| Utilities | 0 (0.0%) | 0 (0.0%) |
| Information | 0 (0.0%) | 0 (0.0%) |
| Finance & Insurance | 0 (0.0%) | 0 (0.0%) |
| Real Estate, Rental & Leasing | 4 (100.0%) | 0 (0.0%) |
| Professional & Scientific | 0 (0.0%) | 7 (100.0%) |
| Enterprise Management | 0 (0.0%) | 0 (0.0%) |
| Administrative & Support | 0 (0.0%) | 0 (0.0%) |
| Educational Services | 11 (42.3%) | 15 (57.7%) |
| Health Care & Social Assistance | 4 (33.3%) | 8 (66.7%) |
| Arts, Entertainment & Recreation | 0 (0.0%) | 2 (100.0%) |
| Accommodation & Food Services | 0 (0.0%) | 4 (100.0%) |
| Public Administration | 15 (51.7%) | 14 (48.3%) |
| Total | 88 (58.7%) | 62 (41.3%) |
Education in Nenana
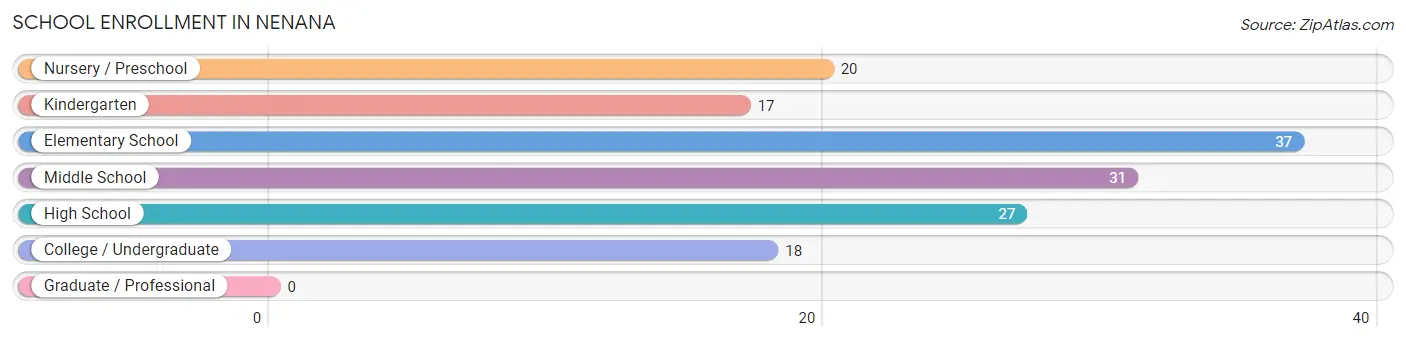
School Enrollment in Nenana
The most common levels of schooling among the 150 students in Nenana are elementary school (37 | 24.7%), middle school (31 | 20.7%), and high school (27 | 18.0%).
| School Level | # Students | % Students |
| Nursery / Preschool | 20 | 13.3% |
| Kindergarten | 17 | 11.3% |
| Elementary School | 37 | 24.7% |
| Middle School | 31 | 20.7% |
| High School | 27 | 18.0% |
| College / Undergraduate | 18 | 12.0% |
| Graduate / Professional | 0 | 0.0% |
| Total | 150 | 100.0% |
School Enrollment by Age by Funding Source in Nenana
Out of a total of 150 students who are enrolled in schools in Nenana, 14 (9.3%) attend a private institution, while the remaining 136 (90.7%) are enrolled in public schools. The age group of 25 to 34 year olds has the highest likelihood of being enrolled in private schools, with 3 (50.0% in the age bracket) enrolled. Conversely, the age group of 3 to 4 year olds has the lowest likelihood of being enrolled in a private school, with 20 (100.0% in the age bracket) attending a public institution.
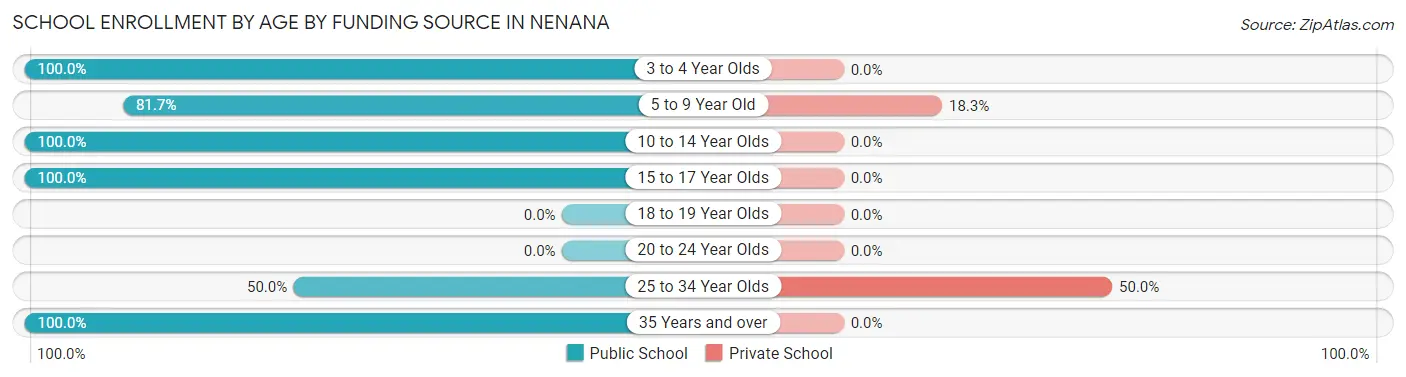
| Age Bracket | Public School | Private School |
| 3 to 4 Year Olds | 20 (100.0%) | 0 (0.0%) |
| 5 to 9 Year Old | 49 (81.7%) | 11 (18.3%) |
| 10 to 14 Year Olds | 28 (100.0%) | 0 (0.0%) |
| 15 to 17 Year Olds | 24 (100.0%) | 0 (0.0%) |
| 18 to 19 Year Olds | 0 (0.0%) | 0 (0.0%) |
| 20 to 24 Year Olds | 0 (0.0%) | 0 (0.0%) |
| 25 to 34 Year Olds | 3 (50.0%) | 3 (50.0%) |
| 35 Years and over | 12 (100.0%) | 0 (0.0%) |
| Total | 136 (90.7%) | 14 (9.3%) |
Educational Attainment by Field of Study in Nenana
Arts & humanities (12 | 33.3%), business (8 | 22.2%), education (6 | 16.7%), science & technology (3 | 8.3%), and liberal arts & history (3 | 8.3%) are the most common fields of study among 36 individuals in Nenana who have obtained a bachelor's degree or higher.
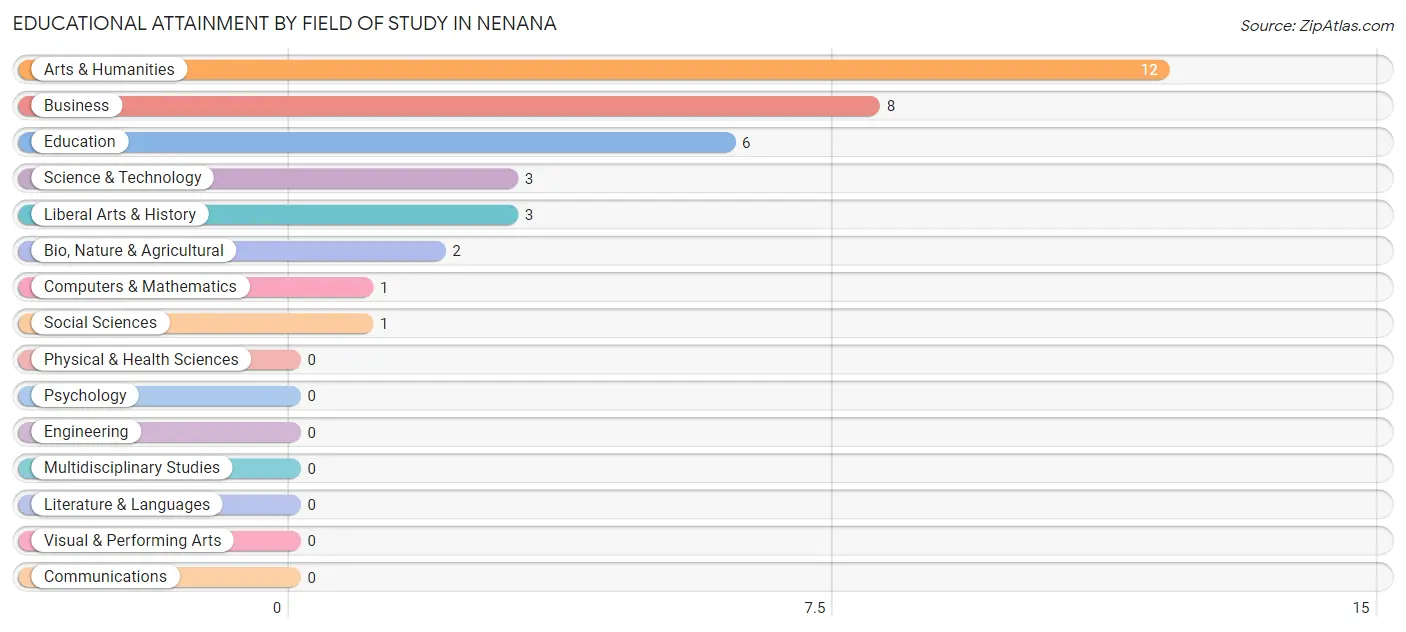
| Field of Study | # Graduates | % Graduates |
| Computers & Mathematics | 1 | 2.8% |
| Bio, Nature & Agricultural | 2 | 5.6% |
| Physical & Health Sciences | 0 | 0.0% |
| Psychology | 0 | 0.0% |
| Social Sciences | 1 | 2.8% |
| Engineering | 0 | 0.0% |
| Multidisciplinary Studies | 0 | 0.0% |
| Science & Technology | 3 | 8.3% |
| Business | 8 | 22.2% |
| Education | 6 | 16.7% |
| Literature & Languages | 0 | 0.0% |
| Liberal Arts & History | 3 | 8.3% |
| Visual & Performing Arts | 0 | 0.0% |
| Communications | 0 | 0.0% |
| Arts & Humanities | 12 | 33.3% |
| Total | 36 | 100.0% |
Transportation & Commute in Nenana
Vehicle Availability by Sex in Nenana
The most prevalent vehicle ownership categories in Nenana are males with 2 vehicles (29, accounting for 38.2%) and females with 2 vehicles (44, making up 46.8%).
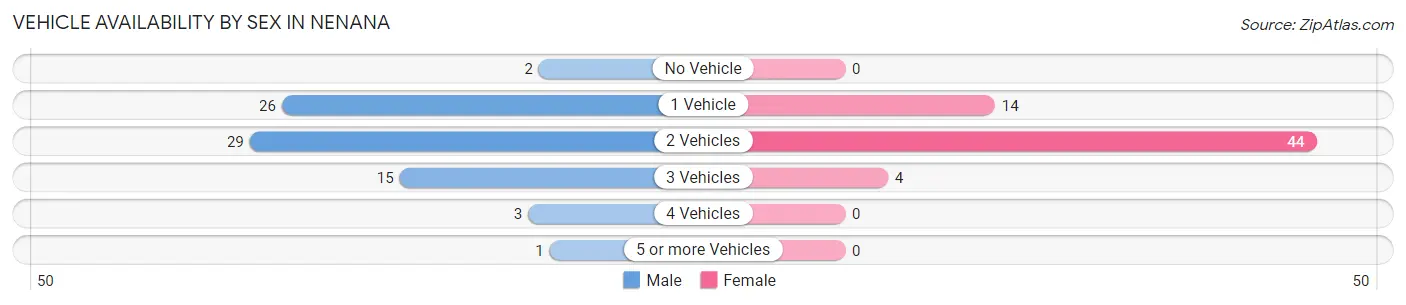
| Vehicles Available | Male | Female |
| No Vehicle | 2 (2.6%) | 0 (0.0%) |
| 1 Vehicle | 26 (34.2%) | 14 (22.6%) |
| 2 Vehicles | 29 (38.2%) | 44 (71.0%) |
| 3 Vehicles | 15 (19.7%) | 4 (6.5%) |
| 4 Vehicles | 3 (4.0%) | 0 (0.0%) |
| 5 or more Vehicles | 1 (1.3%) | 0 (0.0%) |
| Total | 76 (100.0%) | 62 (100.0%) |
Commute Time in Nenana
The most frequently occuring commute durations in Nenana are less than 5 minutes (44 commuters, 32.6%), 10 to 14 minutes (35 commuters, 25.9%), and 5 to 9 minutes (26 commuters, 19.3%).
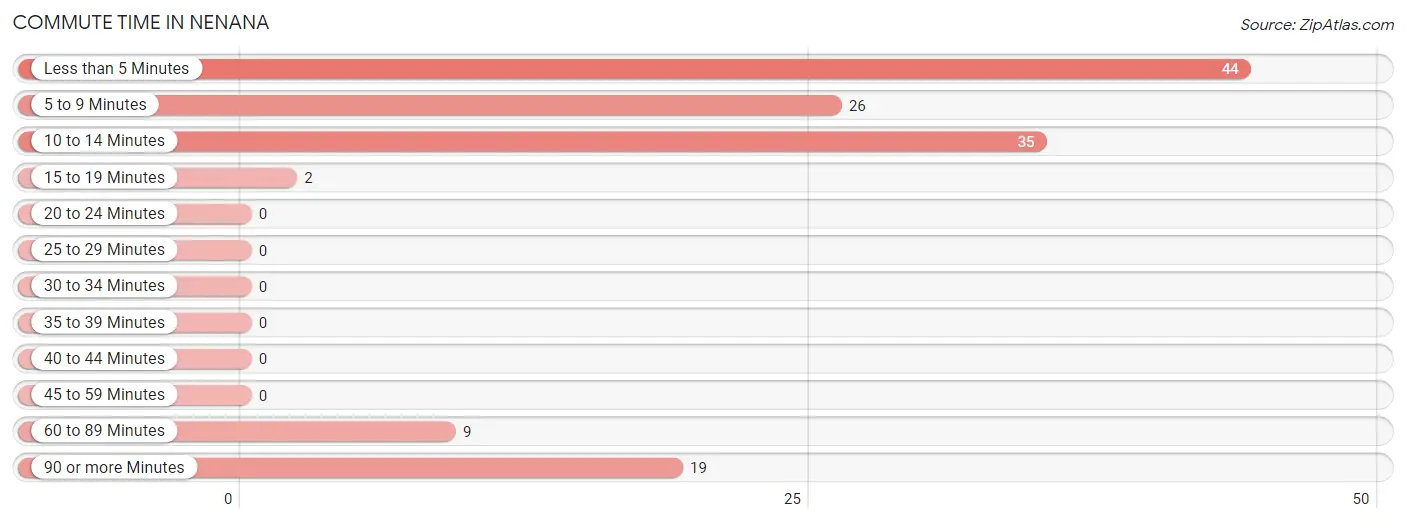
| Commute Time | # Commuters | % Commuters |
| Less than 5 Minutes | 44 | 32.6% |
| 5 to 9 Minutes | 26 | 19.3% |
| 10 to 14 Minutes | 35 | 25.9% |
| 15 to 19 Minutes | 2 | 1.5% |
| 20 to 24 Minutes | 0 | 0.0% |
| 25 to 29 Minutes | 0 | 0.0% |
| 30 to 34 Minutes | 0 | 0.0% |
| 35 to 39 Minutes | 0 | 0.0% |
| 40 to 44 Minutes | 0 | 0.0% |
| 45 to 59 Minutes | 0 | 0.0% |
| 60 to 89 Minutes | 9 | 6.7% |
| 90 or more Minutes | 19 | 14.1% |
Commute Time by Sex in Nenana
The most common commute times in Nenana are less than 5 minutes (24 commuters, 31.6%) for males and less than 5 minutes (20 commuters, 33.9%) for females.
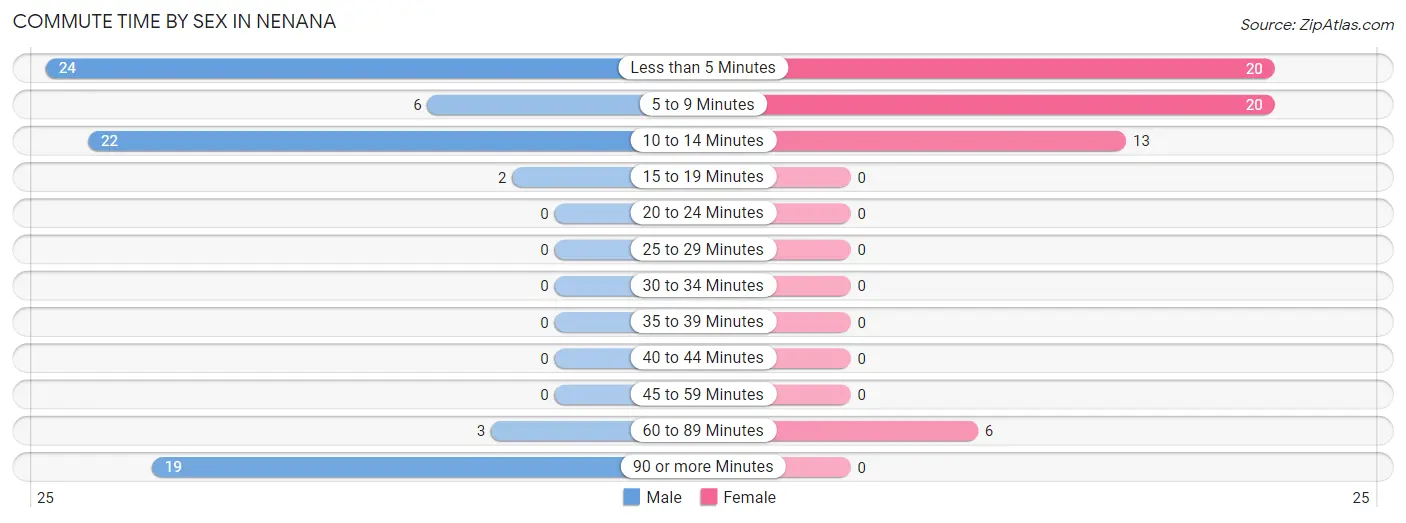
| Commute Time | Male | Female |
| Less than 5 Minutes | 24 (31.6%) | 20 (33.9%) |
| 5 to 9 Minutes | 6 (7.9%) | 20 (33.9%) |
| 10 to 14 Minutes | 22 (28.9%) | 13 (22.0%) |
| 15 to 19 Minutes | 2 (2.6%) | 0 (0.0%) |
| 20 to 24 Minutes | 0 (0.0%) | 0 (0.0%) |
| 25 to 29 Minutes | 0 (0.0%) | 0 (0.0%) |
| 30 to 34 Minutes | 0 (0.0%) | 0 (0.0%) |
| 35 to 39 Minutes | 0 (0.0%) | 0 (0.0%) |
| 40 to 44 Minutes | 0 (0.0%) | 0 (0.0%) |
| 45 to 59 Minutes | 0 (0.0%) | 0 (0.0%) |
| 60 to 89 Minutes | 3 (4.0%) | 6 (10.2%) |
| 90 or more Minutes | 19 (25.0%) | 0 (0.0%) |
Time of Departure to Work by Sex in Nenana
The most frequent times of departure to work in Nenana are 7:00 AM to 7:29 AM (21, 27.6%) for males and 8:00 AM to 8:29 AM (25, 42.4%) for females.
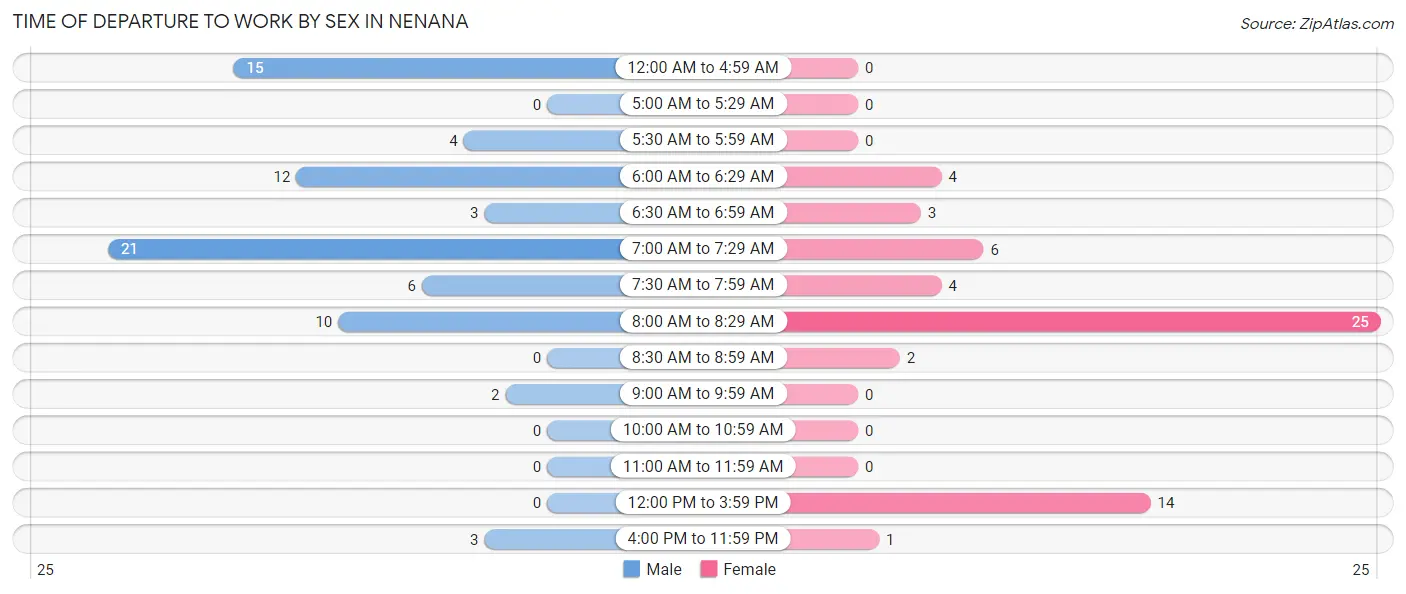
| Time of Departure | Male | Female |
| 12:00 AM to 4:59 AM | 15 (19.7%) | 0 (0.0%) |
| 5:00 AM to 5:29 AM | 0 (0.0%) | 0 (0.0%) |
| 5:30 AM to 5:59 AM | 4 (5.3%) | 0 (0.0%) |
| 6:00 AM to 6:29 AM | 12 (15.8%) | 4 (6.8%) |
| 6:30 AM to 6:59 AM | 3 (4.0%) | 3 (5.1%) |
| 7:00 AM to 7:29 AM | 21 (27.6%) | 6 (10.2%) |
| 7:30 AM to 7:59 AM | 6 (7.9%) | 4 (6.8%) |
| 8:00 AM to 8:29 AM | 10 (13.2%) | 25 (42.4%) |
| 8:30 AM to 8:59 AM | 0 (0.0%) | 2 (3.4%) |
| 9:00 AM to 9:59 AM | 2 (2.6%) | 0 (0.0%) |
| 10:00 AM to 10:59 AM | 0 (0.0%) | 0 (0.0%) |
| 11:00 AM to 11:59 AM | 0 (0.0%) | 0 (0.0%) |
| 12:00 PM to 3:59 PM | 0 (0.0%) | 14 (23.7%) |
| 4:00 PM to 11:59 PM | 3 (4.0%) | 1 (1.7%) |
| Total | 76 (100.0%) | 59 (100.0%) |
Housing Occupancy in Nenana
Occupancy by Ownership in Nenana
Of the total 202 dwellings in Nenana, owner-occupied units account for 138 (68.3%), while renter-occupied units make up 64 (31.7%).
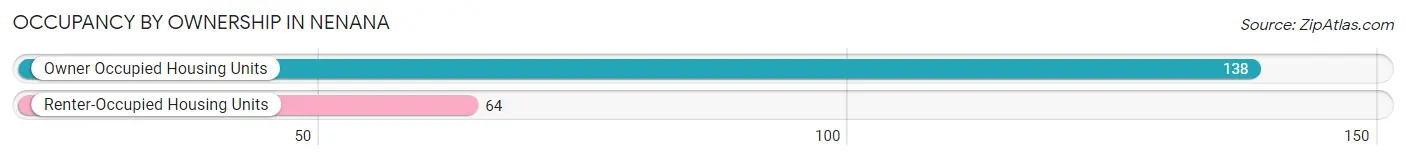
| Occupancy | # Housing Units | % Housing Units |
| Owner Occupied Housing Units | 138 | 68.3% |
| Renter-Occupied Housing Units | 64 | 31.7% |
| Total Occupied Housing Units | 202 | 100.0% |
Occupancy by Household Size in Nenana
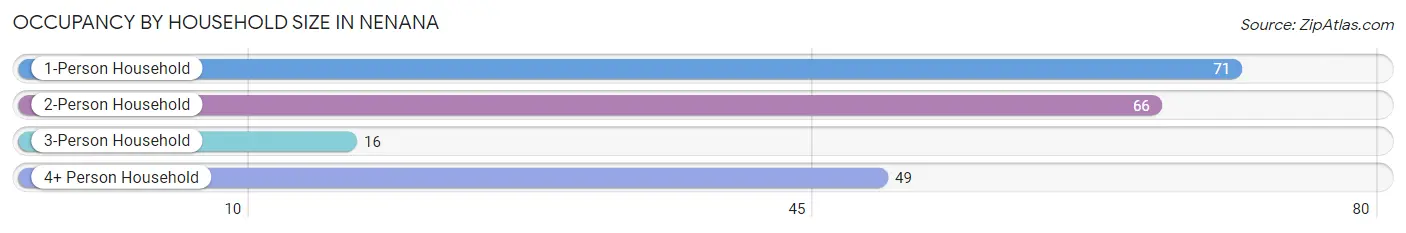
| Household Size | # Housing Units | % Housing Units |
| 1-Person Household | 71 | 35.1% |
| 2-Person Household | 66 | 32.7% |
| 3-Person Household | 16 | 7.9% |
| 4+ Person Household | 49 | 24.3% |
| Total Housing Units | 202 | 100.0% |
Occupancy by Ownership by Household Size in Nenana
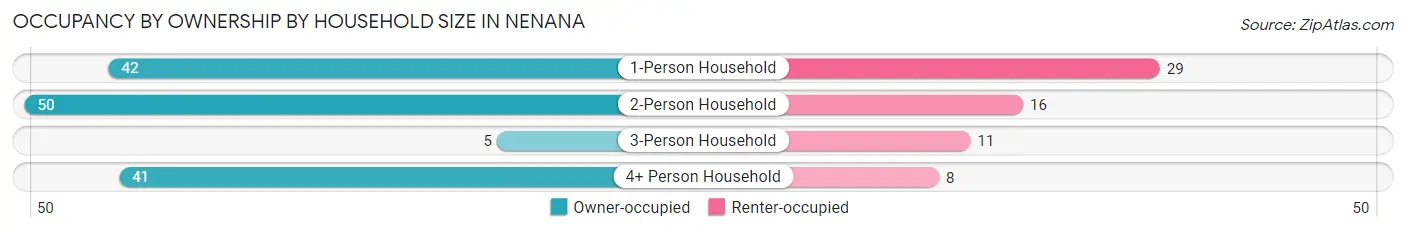
| Household Size | Owner-occupied | Renter-occupied |
| 1-Person Household | 42 (59.2%) | 29 (40.8%) |
| 2-Person Household | 50 (75.8%) | 16 (24.2%) |
| 3-Person Household | 5 (31.2%) | 11 (68.8%) |
| 4+ Person Household | 41 (83.7%) | 8 (16.3%) |
| Total Housing Units | 138 (68.3%) | 64 (31.7%) |
Occupancy by Educational Attainment in Nenana
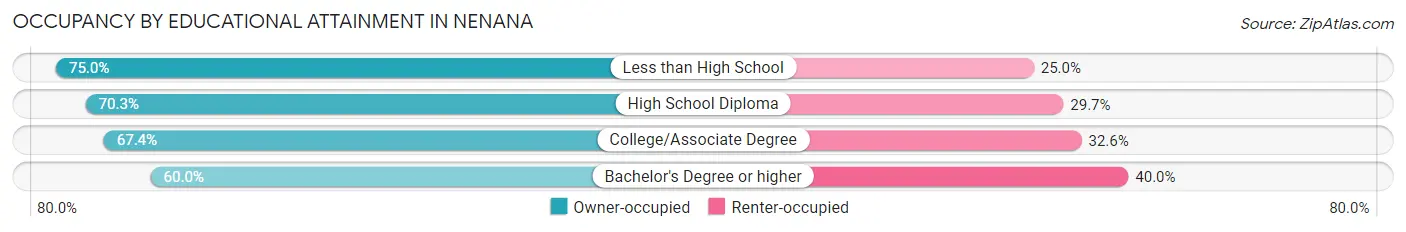
| Household Size | Owner-occupied | Renter-occupied |
| Less than High School | 18 (75.0%) | 6 (25.0%) |
| High School Diploma | 45 (70.3%) | 19 (29.7%) |
| College/Associate Degree | 60 (67.4%) | 29 (32.6%) |
| Bachelor's Degree or higher | 15 (60.0%) | 10 (40.0%) |
Occupancy by Age of Householder in Nenana
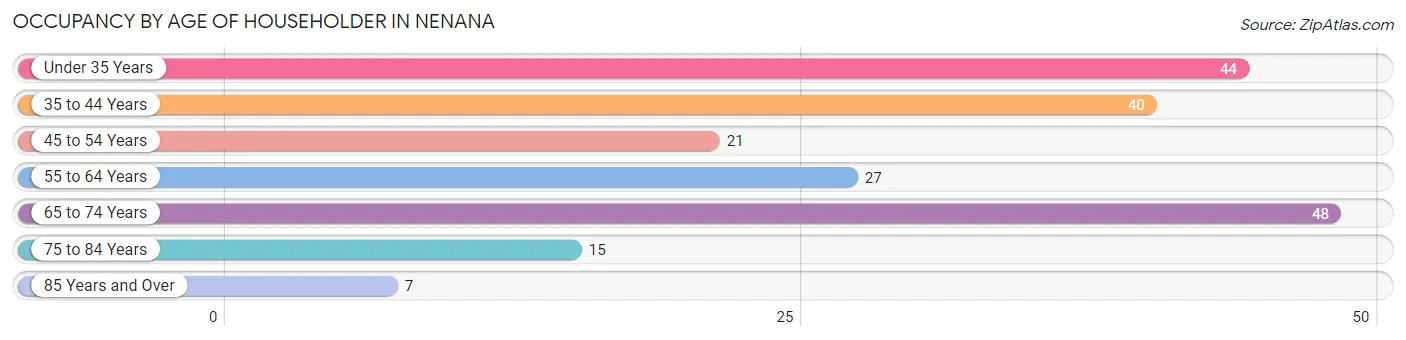
| Age Bracket | # Households | % Households |
| Under 35 Years | 44 | 21.8% |
| 35 to 44 Years | 40 | 19.8% |
| 45 to 54 Years | 21 | 10.4% |
| 55 to 64 Years | 27 | 13.4% |
| 65 to 74 Years | 48 | 23.8% |
| 75 to 84 Years | 15 | 7.4% |
| 85 Years and Over | 7 | 3.5% |
| Total | 202 | 100.0% |
Housing Finances in Nenana
Median Income by Occupancy in Nenana
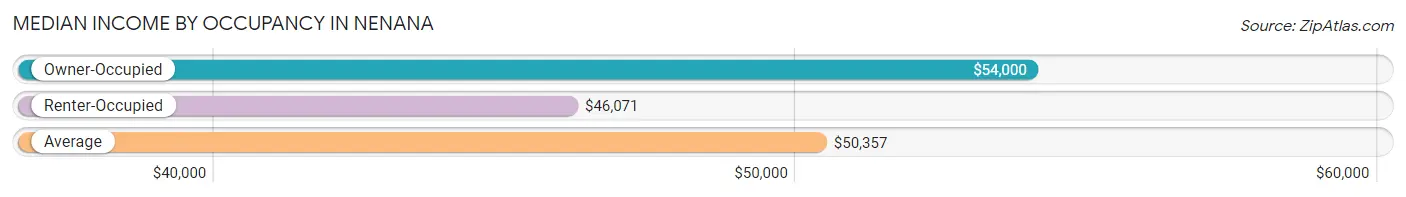
| Occupancy Type | # Households | Median Income |
| Owner-Occupied | 138 (68.3%) | $54,000 |
| Renter-Occupied | 64 (31.7%) | $46,071 |
| Average | 202 (100.0%) | $50,357 |
Occupancy by Householder Income Bracket in Nenana
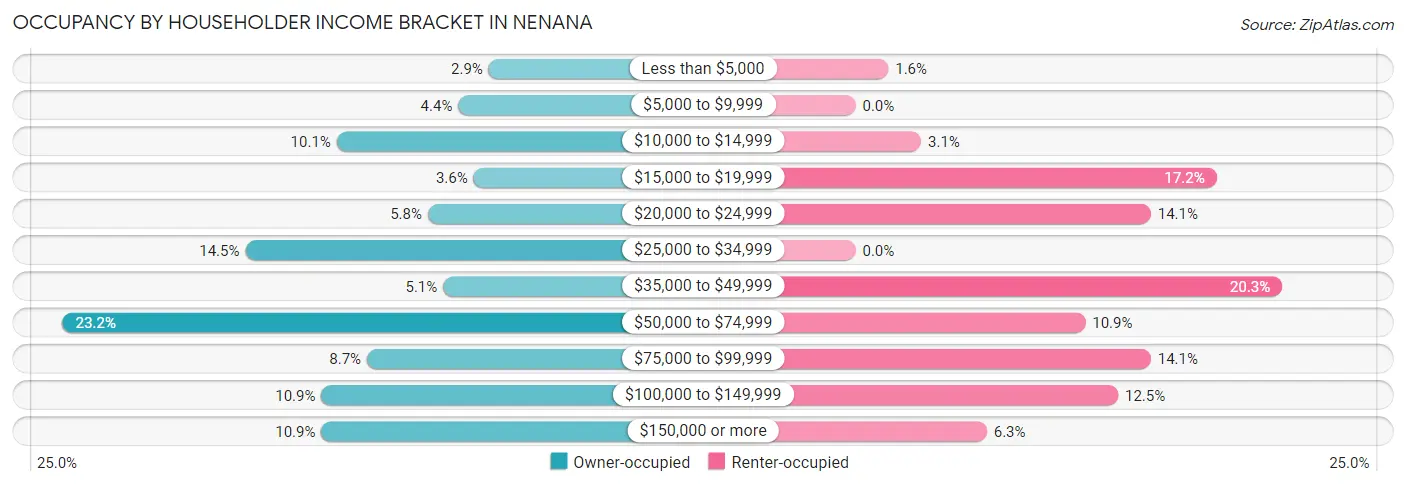
| Income Bracket | Owner-occupied | Renter-occupied |
| Less than $5,000 | 4 (2.9%) | 1 (1.6%) |
| $5,000 to $9,999 | 6 (4.3%) | 0 (0.0%) |
| $10,000 to $14,999 | 14 (10.1%) | 2 (3.1%) |
| $15,000 to $19,999 | 5 (3.6%) | 11 (17.2%) |
| $20,000 to $24,999 | 8 (5.8%) | 9 (14.1%) |
| $25,000 to $34,999 | 20 (14.5%) | 0 (0.0%) |
| $35,000 to $49,999 | 7 (5.1%) | 13 (20.3%) |
| $50,000 to $74,999 | 32 (23.2%) | 7 (10.9%) |
| $75,000 to $99,999 | 12 (8.7%) | 9 (14.1%) |
| $100,000 to $149,999 | 15 (10.9%) | 8 (12.5%) |
| $150,000 or more | 15 (10.9%) | 4 (6.2%) |
| Total | 138 (100.0%) | 64 (100.0%) |
Monthly Housing Cost Tiers in Nenana
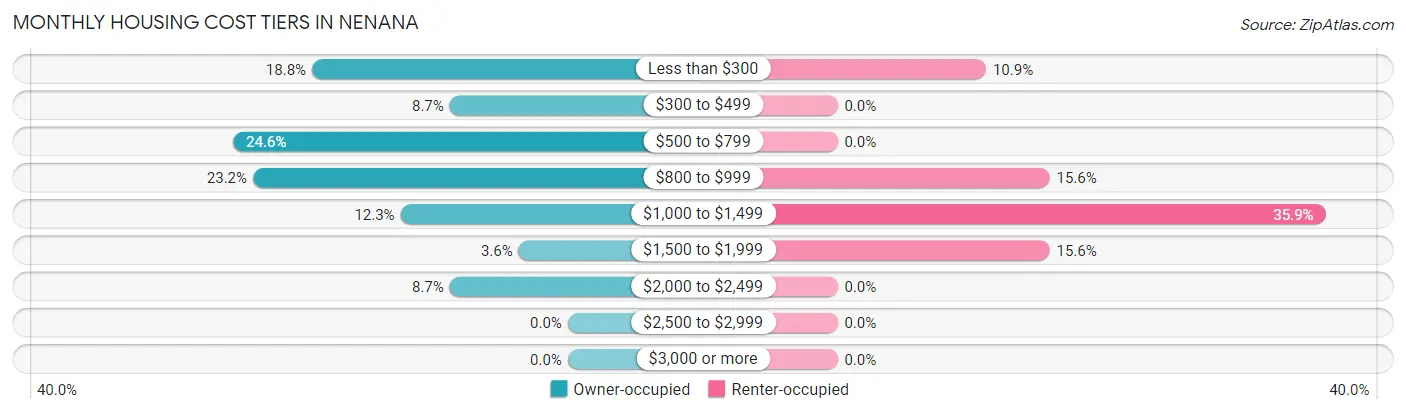
| Monthly Cost | Owner-occupied | Renter-occupied |
| Less than $300 | 26 (18.8%) | 7 (10.9%) |
| $300 to $499 | 12 (8.7%) | 0 (0.0%) |
| $500 to $799 | 34 (24.6%) | 0 (0.0%) |
| $800 to $999 | 32 (23.2%) | 10 (15.6%) |
| $1,000 to $1,499 | 17 (12.3%) | 23 (35.9%) |
| $1,500 to $1,999 | 5 (3.6%) | 10 (15.6%) |
| $2,000 to $2,499 | 12 (8.7%) | 0 (0.0%) |
| $2,500 to $2,999 | 0 (0.0%) | 0 (0.0%) |
| $3,000 or more | 0 (0.0%) | 0 (0.0%) |
| Total | 138 (100.0%) | 64 (100.0%) |
Physical Housing Characteristics in Nenana
Housing Structures in Nenana
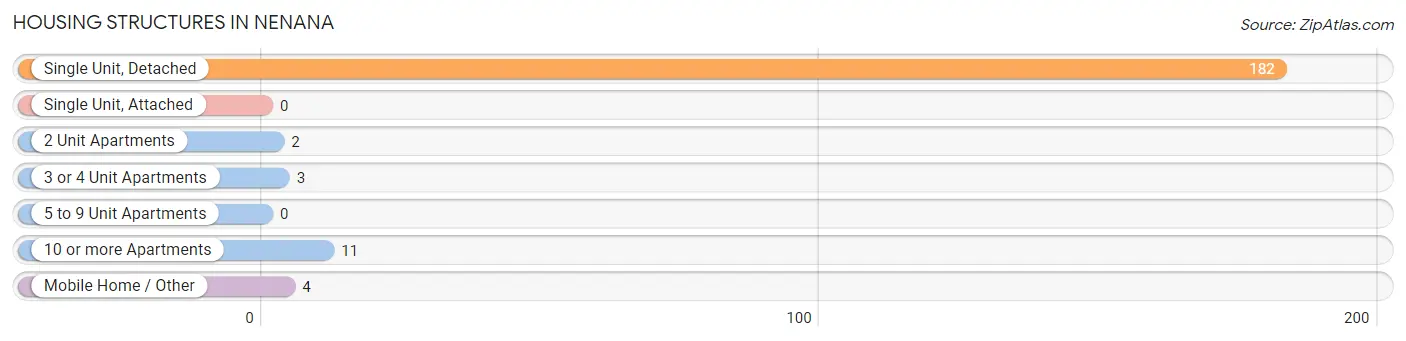
| Structure Type | # Housing Units | % Housing Units |
| Single Unit, Detached | 182 | 90.1% |
| Single Unit, Attached | 0 | 0.0% |
| 2 Unit Apartments | 2 | 1.0% |
| 3 or 4 Unit Apartments | 3 | 1.5% |
| 5 to 9 Unit Apartments | 0 | 0.0% |
| 10 or more Apartments | 11 | 5.4% |
| Mobile Home / Other | 4 | 2.0% |
| Total | 202 | 100.0% |
Housing Structures by Occupancy in Nenana
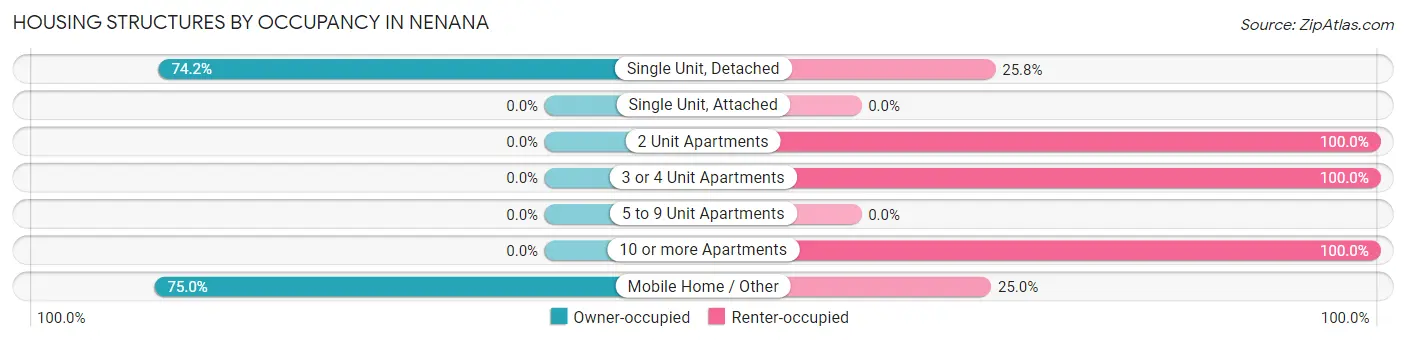
| Structure Type | Owner-occupied | Renter-occupied |
| Single Unit, Detached | 135 (74.2%) | 47 (25.8%) |
| Single Unit, Attached | 0 (0.0%) | 0 (0.0%) |
| 2 Unit Apartments | 0 (0.0%) | 2 (100.0%) |
| 3 or 4 Unit Apartments | 0 (0.0%) | 3 (100.0%) |
| 5 to 9 Unit Apartments | 0 (0.0%) | 0 (0.0%) |
| 10 or more Apartments | 0 (0.0%) | 11 (100.0%) |
| Mobile Home / Other | 3 (75.0%) | 1 (25.0%) |
| Total | 138 (68.3%) | 64 (31.7%) |
Housing Structures by Number of Rooms in Nenana
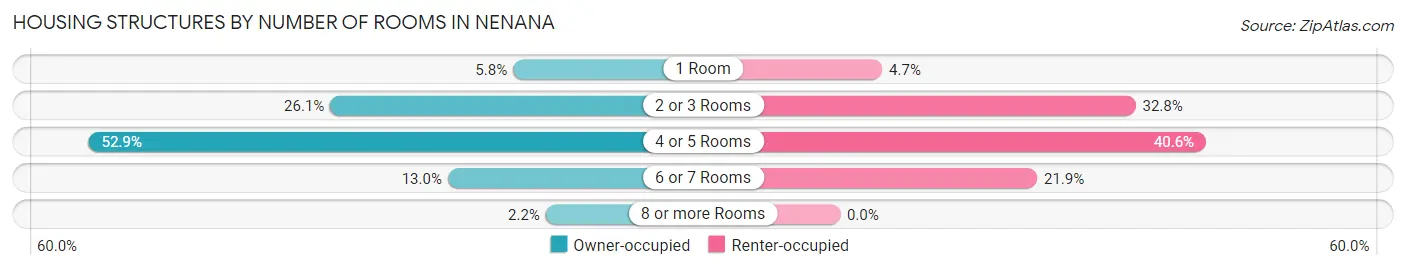
| Number of Rooms | Owner-occupied | Renter-occupied |
| 1 Room | 8 (5.8%) | 3 (4.7%) |
| 2 or 3 Rooms | 36 (26.1%) | 21 (32.8%) |
| 4 or 5 Rooms | 73 (52.9%) | 26 (40.6%) |
| 6 or 7 Rooms | 18 (13.0%) | 14 (21.9%) |
| 8 or more Rooms | 3 (2.2%) | 0 (0.0%) |
| Total | 138 (100.0%) | 64 (100.0%) |
Housing Structure by Heating Type in Nenana
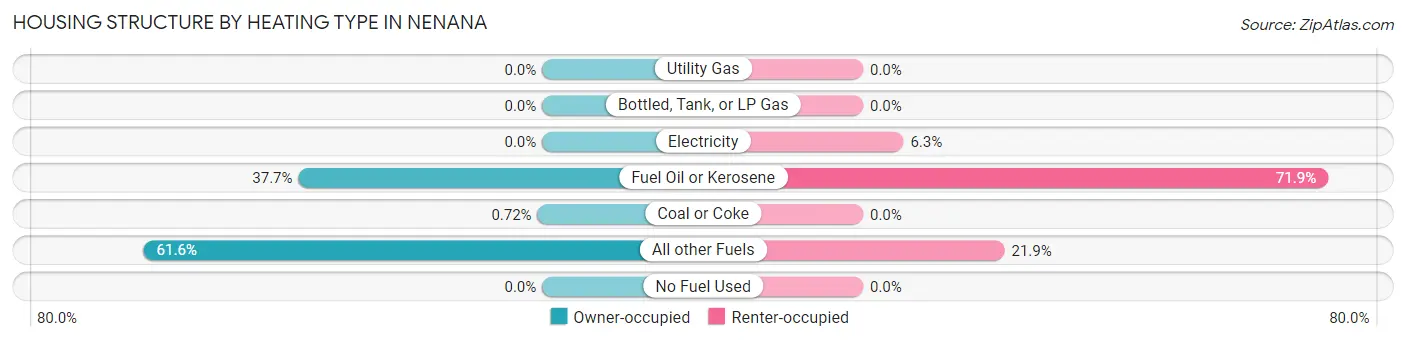
| Heating Type | Owner-occupied | Renter-occupied |
| Utility Gas | 0 (0.0%) | 0 (0.0%) |
| Bottled, Tank, or LP Gas | 0 (0.0%) | 0 (0.0%) |
| Electricity | 0 (0.0%) | 4 (6.2%) |
| Fuel Oil or Kerosene | 52 (37.7%) | 46 (71.9%) |
| Coal or Coke | 1 (0.7%) | 0 (0.0%) |
| All other Fuels | 85 (61.6%) | 14 (21.9%) |
| No Fuel Used | 0 (0.0%) | 0 (0.0%) |
| Total | 138 (100.0%) | 64 (100.0%) |
Household Vehicle Usage in Nenana
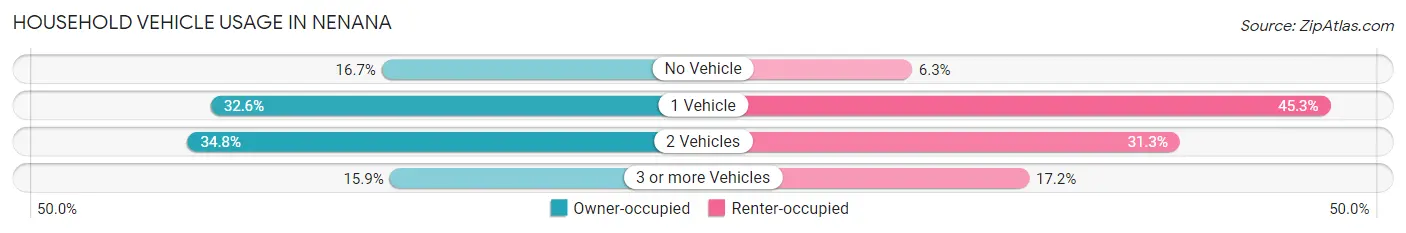
| Vehicles per Household | Owner-occupied | Renter-occupied |
| No Vehicle | 23 (16.7%) | 4 (6.2%) |
| 1 Vehicle | 45 (32.6%) | 29 (45.3%) |
| 2 Vehicles | 48 (34.8%) | 20 (31.2%) |
| 3 or more Vehicles | 22 (15.9%) | 11 (17.2%) |
| Total | 138 (100.0%) | 64 (100.0%) |
Real Estate & Mortgages in Nenana
Real Estate and Mortgage Overview in Nenana
| Characteristic | Without Mortgage | With Mortgage |
| Housing Units | 77 | 61 |
| Median Property Value | $94,500 | $145,800 |
| Median Household Income | $59,219 | $8 |
| Monthly Housing Costs | $515 | $0 |
| Real Estate Taxes | $850 | $23 |
Property Value by Mortgage Status in Nenana
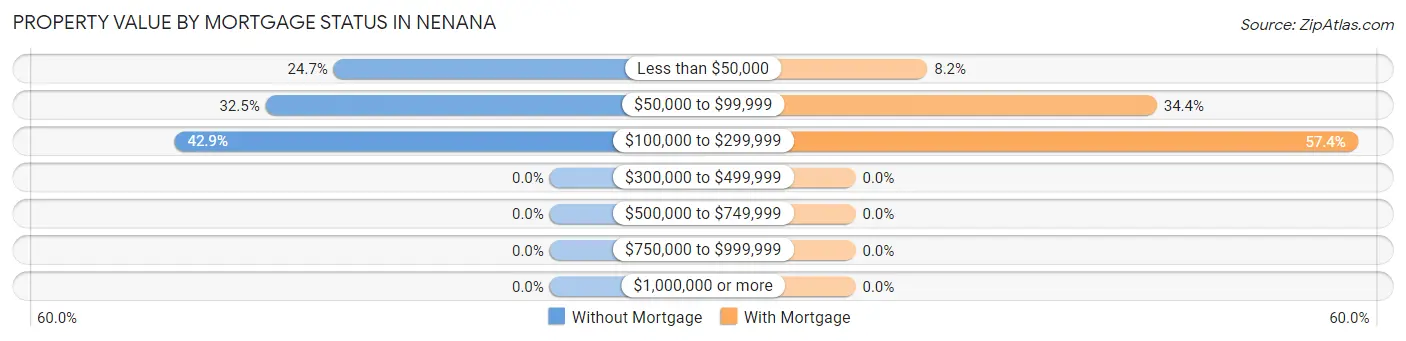
| Property Value | Without Mortgage | With Mortgage |
| Less than $50,000 | 19 (24.7%) | 5 (8.2%) |
| $50,000 to $99,999 | 25 (32.5%) | 21 (34.4%) |
| $100,000 to $299,999 | 33 (42.9%) | 35 (57.4%) |
| $300,000 to $499,999 | 0 (0.0%) | 0 (0.0%) |
| $500,000 to $749,999 | 0 (0.0%) | 0 (0.0%) |
| $750,000 to $999,999 | 0 (0.0%) | 0 (0.0%) |
| $1,000,000 or more | 0 (0.0%) | 0 (0.0%) |
| Total | 77 (100.0%) | 61 (100.0%) |
Household Income by Mortgage Status in Nenana
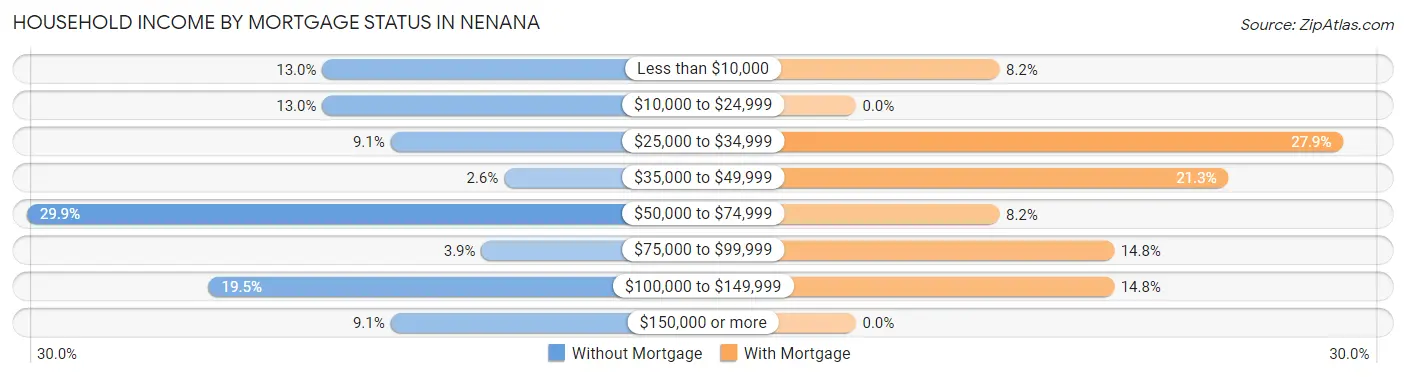
| Household Income | Without Mortgage | With Mortgage |
| Less than $10,000 | 10 (13.0%) | 5 (8.2%) |
| $10,000 to $24,999 | 10 (13.0%) | 0 (0.0%) |
| $25,000 to $34,999 | 7 (9.1%) | 17 (27.9%) |
| $35,000 to $49,999 | 2 (2.6%) | 13 (21.3%) |
| $50,000 to $74,999 | 23 (29.9%) | 5 (8.2%) |
| $75,000 to $99,999 | 3 (3.9%) | 9 (14.7%) |
| $100,000 to $149,999 | 15 (19.5%) | 9 (14.7%) |
| $150,000 or more | 7 (9.1%) | 0 (0.0%) |
| Total | 77 (100.0%) | 61 (100.0%) |
Property Value to Household Income Ratio in Nenana
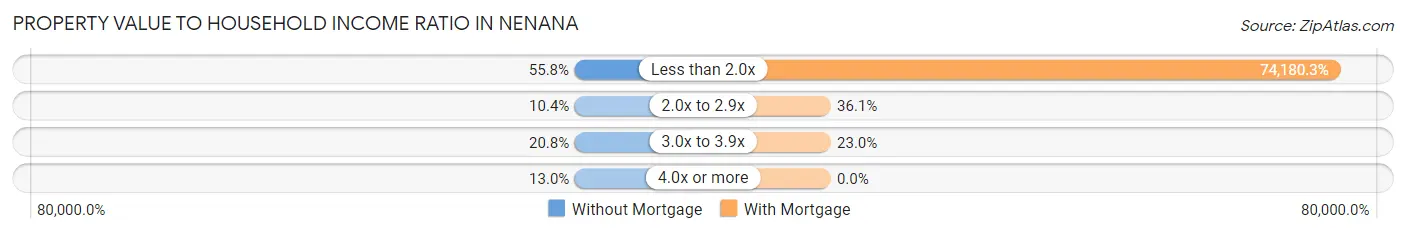
| Value-to-Income Ratio | Without Mortgage | With Mortgage |
| Less than 2.0x | 43 (55.8%) | 45,250 (74,180.3%) |
| 2.0x to 2.9x | 8 (10.4%) | 22 (36.1%) |
| 3.0x to 3.9x | 16 (20.8%) | 14 (23.0%) |
| 4.0x or more | 10 (13.0%) | 0 (0.0%) |
| Total | 77 (100.0%) | 61 (100.0%) |
Real Estate Taxes by Mortgage Status in Nenana
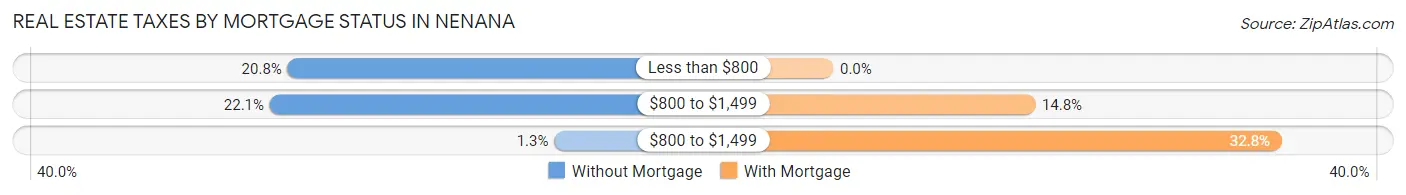
| Property Taxes | Without Mortgage | With Mortgage |
| Less than $800 | 16 (20.8%) | 0 (0.0%) |
| $800 to $1,499 | 17 (22.1%) | 9 (14.7%) |
| $800 to $1,499 | 1 (1.3%) | 20 (32.8%) |
| Total | 77 (100.0%) | 61 (100.0%) |
Health & Disability in Nenana
Health Insurance Coverage by Age in Nenana
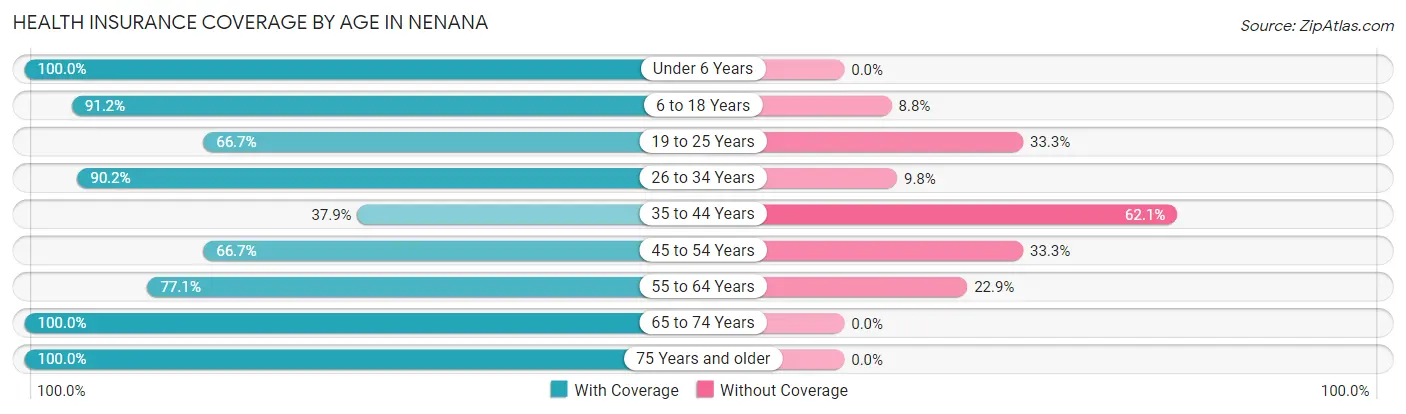
| Age Bracket | With Coverage | Without Coverage |
| Under 6 Years | 92 (100.0%) | 0 (0.0%) |
| 6 to 18 Years | 93 (91.2%) | 9 (8.8%) |
| 19 to 25 Years | 8 (66.7%) | 4 (33.3%) |
| 26 to 34 Years | 55 (90.2%) | 6 (9.8%) |
| 35 to 44 Years | 22 (37.9%) | 36 (62.1%) |
| 45 to 54 Years | 28 (66.7%) | 14 (33.3%) |
| 55 to 64 Years | 37 (77.1%) | 11 (22.9%) |
| 65 to 74 Years | 65 (100.0%) | 0 (0.0%) |
| 75 Years and older | 28 (100.0%) | 0 (0.0%) |
| Total | 428 (84.3%) | 80 (15.8%) |
Health Insurance Coverage by Citizenship Status in Nenana
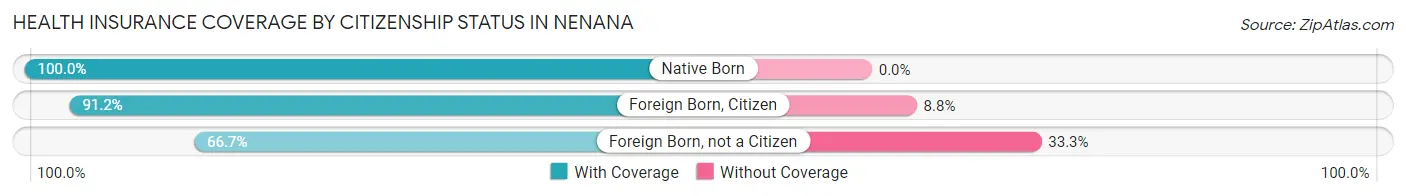
| Citizenship Status | With Coverage | Without Coverage |
| Native Born | 92 (100.0%) | 0 (0.0%) |
| Foreign Born, Citizen | 93 (91.2%) | 9 (8.8%) |
| Foreign Born, not a Citizen | 8 (66.7%) | 4 (33.3%) |
Health Insurance Coverage by Household Income in Nenana
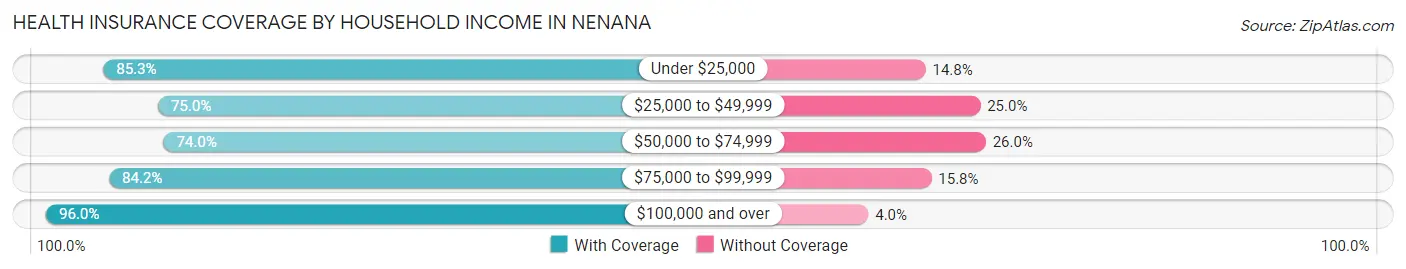
| Household Income | With Coverage | Without Coverage |
| Under $25,000 | 104 (85.3%) | 18 (14.7%) |
| $25,000 to $49,999 | 66 (75.0%) | 22 (25.0%) |
| $50,000 to $74,999 | 54 (74.0%) | 19 (26.0%) |
| $75,000 to $99,999 | 85 (84.2%) | 16 (15.8%) |
| $100,000 and over | 119 (96.0%) | 5 (4.0%) |
Public vs Private Health Insurance Coverage by Age in Nenana
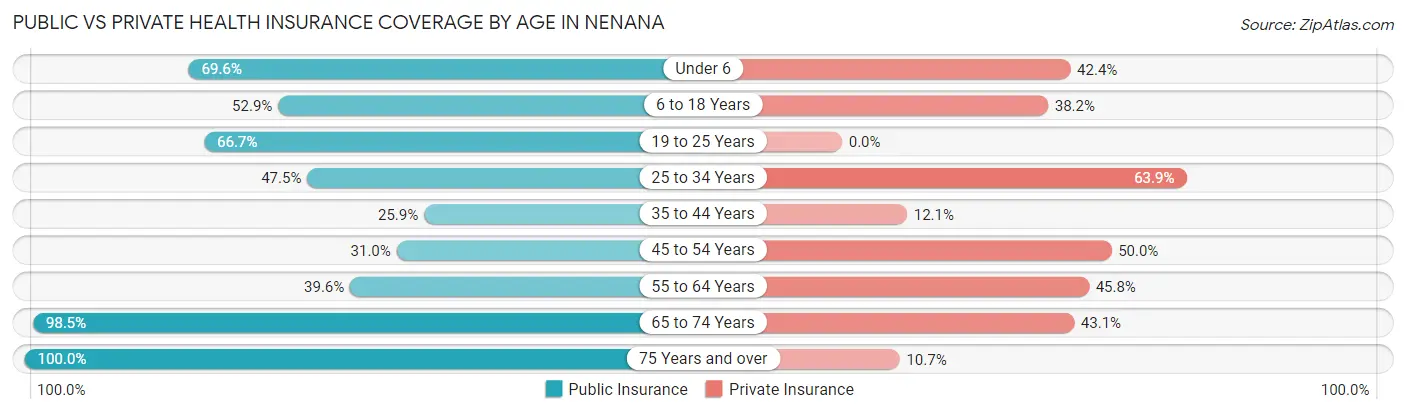
| Age Bracket | Public Insurance | Private Insurance |
| Under 6 | 64 (69.6%) | 39 (42.4%) |
| 6 to 18 Years | 54 (52.9%) | 39 (38.2%) |
| 19 to 25 Years | 8 (66.7%) | 0 (0.0%) |
| 25 to 34 Years | 29 (47.5%) | 39 (63.9%) |
| 35 to 44 Years | 15 (25.9%) | 7 (12.1%) |
| 45 to 54 Years | 13 (30.9%) | 21 (50.0%) |
| 55 to 64 Years | 19 (39.6%) | 22 (45.8%) |
| 65 to 74 Years | 64 (98.5%) | 28 (43.1%) |
| 75 Years and over | 28 (100.0%) | 3 (10.7%) |
| Total | 294 (57.9%) | 198 (39.0%) |
Disability Status by Sex by Age in Nenana
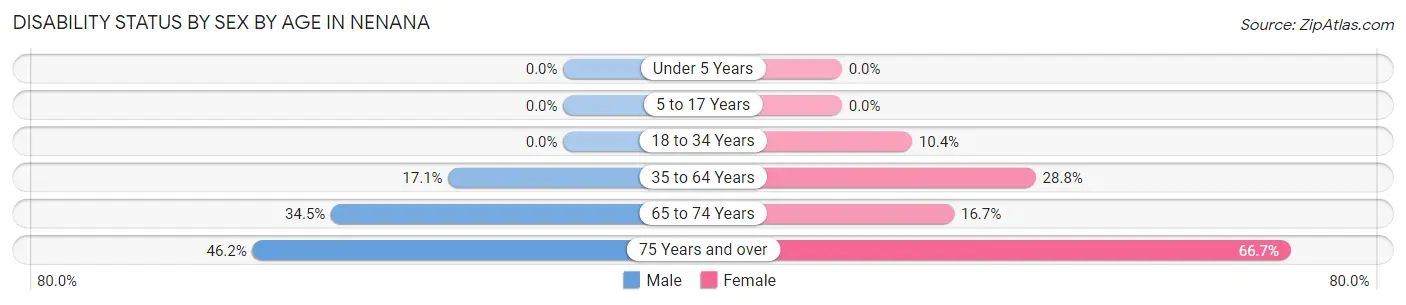
| Age Bracket | Male | Female |
| Under 5 Years | 0 (0.0%) | 0 (0.0%) |
| 5 to 17 Years | 0 (0.0%) | 0 (0.0%) |
| 18 to 34 Years | 0 (0.0%) | 5 (10.4%) |
| 35 to 64 Years | 14 (17.1%) | 19 (28.8%) |
| 65 to 74 Years | 10 (34.5%) | 6 (16.7%) |
| 75 Years and over | 6 (46.2%) | 10 (66.7%) |
Disability Class by Sex by Age in Nenana
Disability Class: Hearing Difficulty
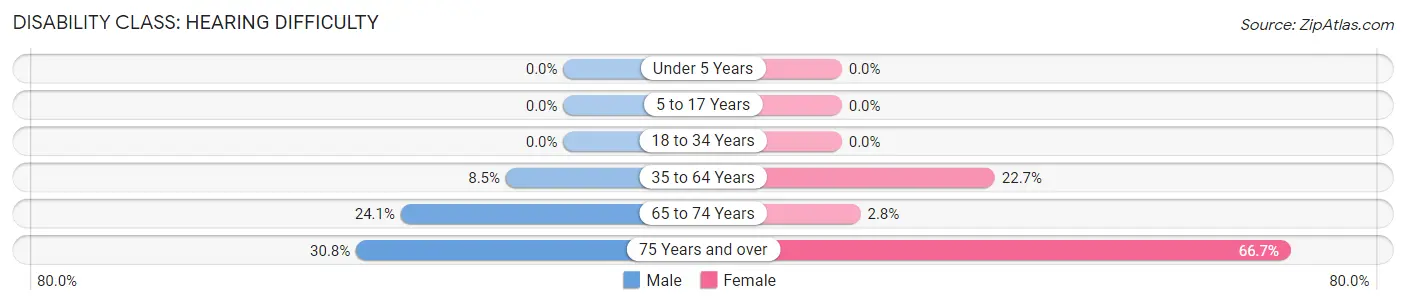
| Age Bracket | Male | Female |
| Under 5 Years | 0 (0.0%) | 0 (0.0%) |
| 5 to 17 Years | 0 (0.0%) | 0 (0.0%) |
| 18 to 34 Years | 0 (0.0%) | 0 (0.0%) |
| 35 to 64 Years | 7 (8.5%) | 15 (22.7%) |
| 65 to 74 Years | 7 (24.1%) | 1 (2.8%) |
| 75 Years and over | 4 (30.8%) | 10 (66.7%) |
Disability Class: Vision Difficulty
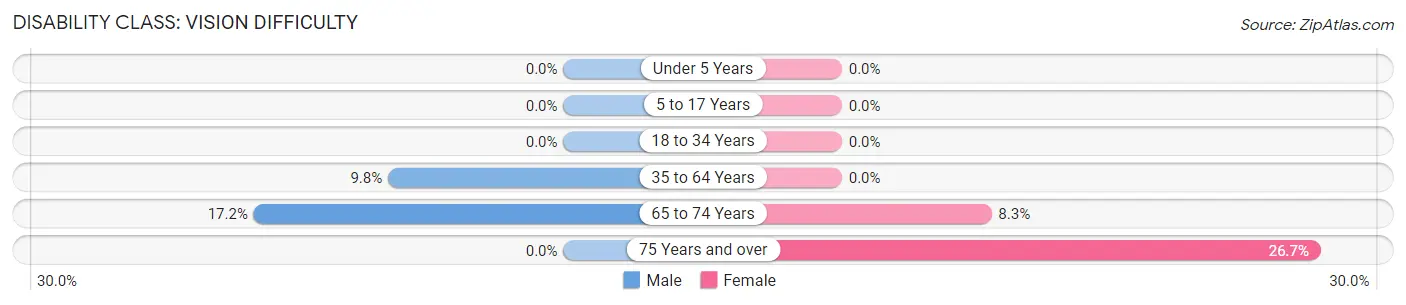
| Age Bracket | Male | Female |
| Under 5 Years | 0 (0.0%) | 0 (0.0%) |
| 5 to 17 Years | 0 (0.0%) | 0 (0.0%) |
| 18 to 34 Years | 0 (0.0%) | 0 (0.0%) |
| 35 to 64 Years | 8 (9.8%) | 0 (0.0%) |
| 65 to 74 Years | 5 (17.2%) | 3 (8.3%) |
| 75 Years and over | 0 (0.0%) | 4 (26.7%) |
Disability Class: Cognitive Difficulty
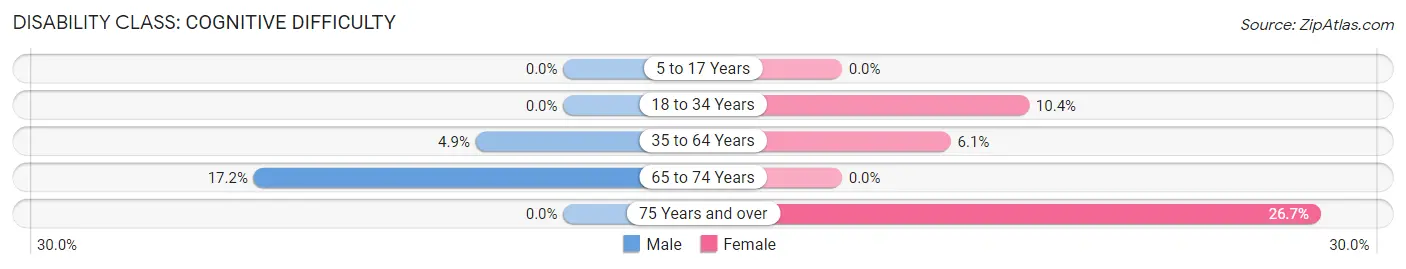
| Age Bracket | Male | Female |
| 5 to 17 Years | 0 (0.0%) | 0 (0.0%) |
| 18 to 34 Years | 0 (0.0%) | 5 (10.4%) |
| 35 to 64 Years | 4 (4.9%) | 4 (6.1%) |
| 65 to 74 Years | 5 (17.2%) | 0 (0.0%) |
| 75 Years and over | 0 (0.0%) | 4 (26.7%) |
Disability Class: Ambulatory Difficulty
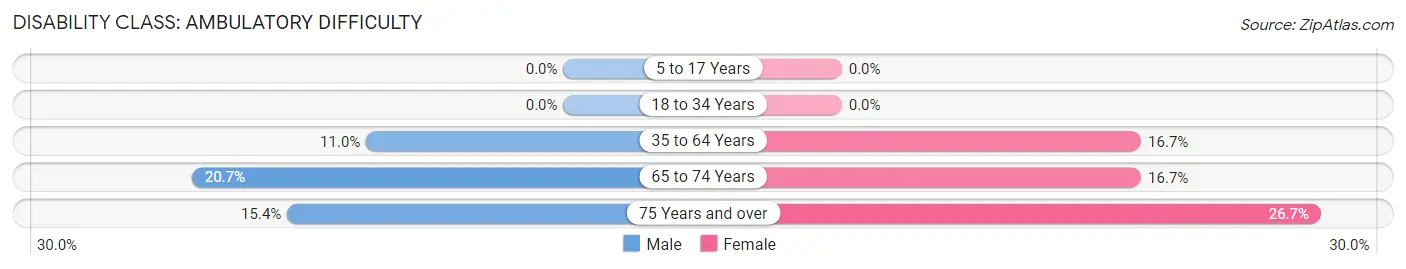
| Age Bracket | Male | Female |
| 5 to 17 Years | 0 (0.0%) | 0 (0.0%) |
| 18 to 34 Years | 0 (0.0%) | 0 (0.0%) |
| 35 to 64 Years | 9 (11.0%) | 11 (16.7%) |
| 65 to 74 Years | 6 (20.7%) | 6 (16.7%) |
| 75 Years and over | 2 (15.4%) | 4 (26.7%) |
Disability Class: Self-Care Difficulty
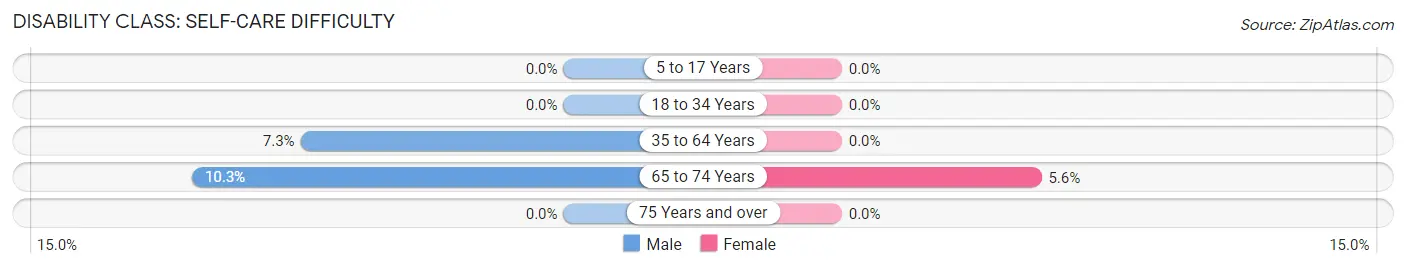
| Age Bracket | Male | Female |
| 5 to 17 Years | 0 (0.0%) | 0 (0.0%) |
| 18 to 34 Years | 0 (0.0%) | 0 (0.0%) |
| 35 to 64 Years | 6 (7.3%) | 0 (0.0%) |
| 65 to 74 Years | 3 (10.3%) | 2 (5.6%) |
| 75 Years and over | 0 (0.0%) | 0 (0.0%) |
Technology Access in Nenana
Computing Device Access in Nenana
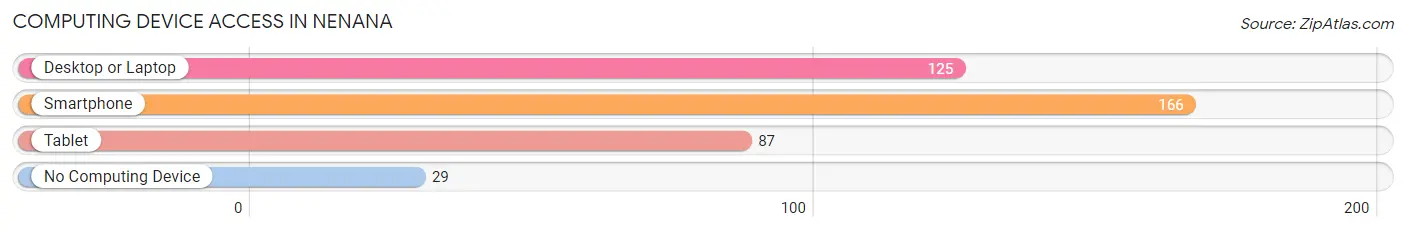
| Device Type | # Households | % Households |
| Desktop or Laptop | 125 | 61.9% |
| Smartphone | 166 | 82.2% |
| Tablet | 87 | 43.1% |
| No Computing Device | 29 | 14.4% |
| Total | 202 | 100.0% |
Internet Access in Nenana
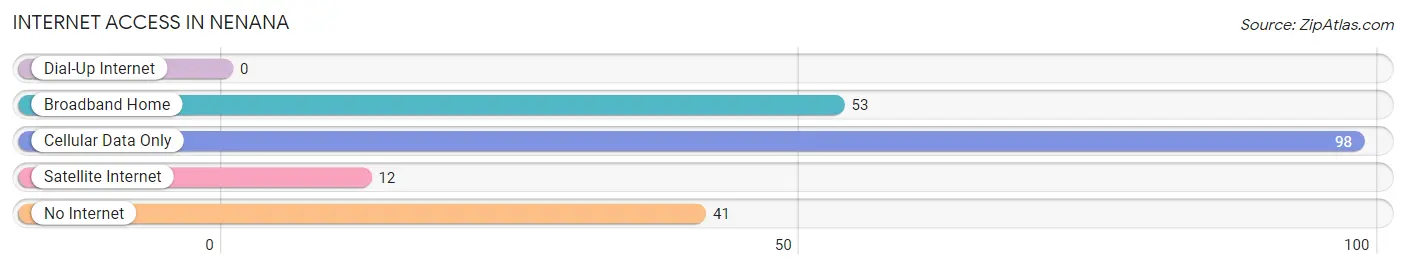
| Internet Type | # Households | % Households |
| Dial-Up Internet | 0 | 0.0% |
| Broadband Home | 53 | 26.2% |
| Cellular Data Only | 98 | 48.5% |
| Satellite Internet | 12 | 5.9% |
| No Internet | 41 | 20.3% |
| Total | 202 | 100.0% |
Nenana Summary
Nenana, Alaska is a small city located in the interior of the state, approximately 75 miles southwest of Fairbanks. It is situated on the Tanana River, and is the gateway to the Alaska Range and Denali National Park. The city has a population of about 400 people, and is the home of the Nenana Native Association.
History
The area around Nenana has been inhabited by the Athabascan people for thousands of years. The first Europeans to visit the area were Russian fur traders in the late 18th century. In 1901, the Alaska Central Railroad was built through the area, and the town of Nenana was established in 1903. The town was named after the nearby Nenana River, which was named by the local Athabascan people.
The town quickly grew, and by 1910 it had a population of over 500 people. The railroad brought in many new settlers, and the town became a major trading center for the region. In 1917, the Alaska Railroad was completed, connecting Nenana to Fairbanks and Anchorage.
In the 1920s, Nenana became a popular tourist destination, and the town was home to several hotels and restaurants. The town also became a popular stop for travelers on the Alaska Railroad.
In the 1950s, the Alaska Native Claims Settlement Act was passed, and the Nenana Native Association was formed. The Nenana Native Association is a federally recognized tribe, and is the largest landowner in the area.
Geography
Nenana is located in the interior of Alaska, approximately 75 miles southwest of Fairbanks. The city is situated on the Tanana River, and is the gateway to the Alaska Range and Denali National Park. The city is surrounded by mountains, and is located in a valley. The climate in Nenana is subarctic, with cold winters and mild summers.
Economy
The economy of Nenana is largely based on tourism and the service industry. The city is a popular stop for travelers on the Alaska Railroad, and is home to several hotels and restaurants. The Nenana Native Association is the largest landowner in the area, and is involved in various economic activities, including tourism, fishing, and timber harvesting.
Demographics
As of the 2010 census, the population of Nenana was 393 people. The racial makeup of the city was 95.2% Native American, 2.3% White, 0.3% Asian, and 2.2% from other races. The median household income was $37,500, and the median family income was $41,250. The per capita income was $17,857. The unemployment rate was 8.3%.
Conclusion
Nenana, Alaska is a small city located in the interior of the state, approximately 75 miles southwest of Fairbanks. It is situated on the Tanana River, and is the gateway to the Alaska Range and Denali National Park. The city has a population of about 400 people, and is the home of the Nenana Native Association. The economy of Nenana is largely based on tourism and the service industry, and the Nenana Native Association is the largest landowner in the area. The racial makeup of the city is 95.2% Native American, 2.3% White, 0.3% Asian, and 2.2% from other races. The median household income was $37,500, and the median family income was $41,250. The per capita income was $17,857. The unemployment rate was 8.3%.
Common Questions
What is Per Capita Income in Nenana?
Per Capita income in Nenana is $26,386.
What is the Median Family Income in Nenana?
Median Family Income in Nenana is $61,250.
What is the Median Household income in Nenana?
Median Household Income in Nenana is $50,357.
What is Income or Wage Gap in Nenana?
Income or Wage Gap in Nenana is 23.3%.
Women in Nenana earn 76.7 cents for every dollar earned by a man.
What is Inequality or Gini Index in Nenana?
Inequality or Gini Index in Nenana is 0.47.
What is the Total Population of Nenana?
Total Population of Nenana is 508.
What is the Total Male Population of Nenana?
Total Male Population of Nenana is 213.
What is the Total Female Population of Nenana?
Total Female Population of Nenana is 295.
What is the Ratio of Males per 100 Females in Nenana?
There are 72.20 Males per 100 Females in Nenana.
What is the Ratio of Females per 100 Males in Nenana?
There are 138.50 Females per 100 Males in Nenana.
What is the Median Population Age in Nenana?
Median Population Age in Nenana is 31.8 Years.
What is the Average Family Size in Nenana
Average Family Size in Nenana is 3.2 People.
What is the Average Household Size in Nenana
Average Household Size in Nenana is 2.5 People.
How Large is the Labor Force in Nenana?
There are 163 People in the Labor Forcein in Nenana.
What is the Percentage of People in the Labor Force in Nenana?
50.8% of People are in the Labor Force in Nenana.
What is the Unemployment Rate in Nenana?
Unemployment Rate in Nenana is 8.0%.