Oscarville, AK Map & Demographics
Oscarville Map
Oscarville Overview
$16,528
PER CAPITA INCOME
$111,250
AVG FAMILY INCOME
0.37
INEQUALITY / GINI INDEX
88
TOTAL POPULATION
43
MALE POPULATION
45
FEMALE POPULATION
95.56
MALES / 100 FEMALES
104.65
FEMALES / 100 MALES
20.5
MEDIAN AGE
5.3
AVG FAMILY SIZE
4.4
AVG HOUSEHOLD SIZE
34
LABOR FORCE [ PEOPLE ]
58.6%
PERCENT IN LABOR FORCE
35.3%
UNEMPLOYMENT RATE
Income in Oscarville
Income Overview in Oscarville
| Characteristic | Number | Measure |
| Per Capita Income | 88 | $16,528 |
| Median Family Income | 14 | $111,250 |
| Mean Family Income | 14 | $89,221 |
| Median Household Income | 20 | $0 |
| Mean Household Income | 20 | $74,415 |
| Income Deficit | 14 | $0 |
| Wage / Income Gap (%) | 88 | 0.00% |
| Wage / Income Gap ($) | 88 | 100.00¢ per $1 |
| Gini / Inequality Index | 88 | 0.37 |
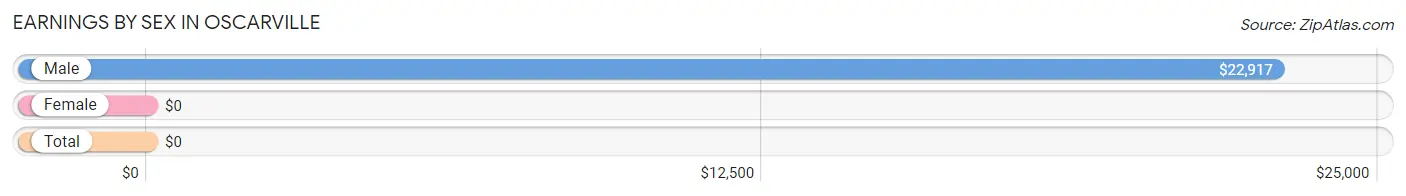
Earnings by Sex in Oscarville
| Sex | Number | Average Earnings |
| Male | 23 (67.6%) | $22,917 |
| Female | 11 (32.4%) | $0 |
| Total | 34 (100.0%) | $0 |
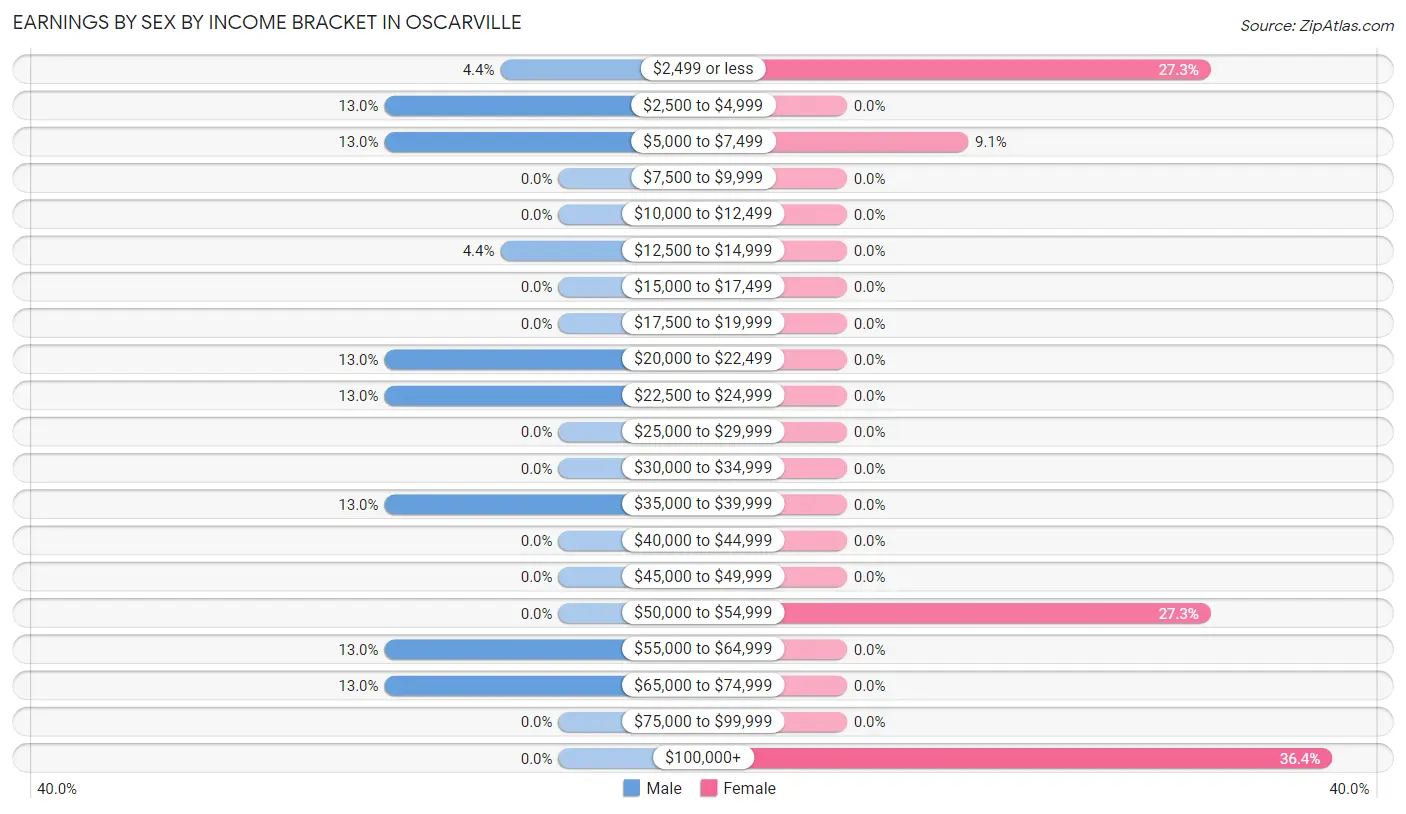
Earnings by Sex by Income Bracket in Oscarville
The most common earnings brackets in Oscarville are $2,500 to $4,999 for men (3 | 13.0%) and $100,000+ for women (4 | 36.4%).
| Income | Male | Female |
| $2,499 or less | 1 (4.3%) | 3 (27.3%) |
| $2,500 to $4,999 | 3 (13.0%) | 0 (0.0%) |
| $5,000 to $7,499 | 3 (13.0%) | 1 (9.1%) |
| $7,500 to $9,999 | 0 (0.0%) | 0 (0.0%) |
| $10,000 to $12,499 | 0 (0.0%) | 0 (0.0%) |
| $12,500 to $14,999 | 1 (4.3%) | 0 (0.0%) |
| $15,000 to $17,499 | 0 (0.0%) | 0 (0.0%) |
| $17,500 to $19,999 | 0 (0.0%) | 0 (0.0%) |
| $20,000 to $22,499 | 3 (13.0%) | 0 (0.0%) |
| $22,500 to $24,999 | 3 (13.0%) | 0 (0.0%) |
| $25,000 to $29,999 | 0 (0.0%) | 0 (0.0%) |
| $30,000 to $34,999 | 0 (0.0%) | 0 (0.0%) |
| $35,000 to $39,999 | 3 (13.0%) | 0 (0.0%) |
| $40,000 to $44,999 | 0 (0.0%) | 0 (0.0%) |
| $45,000 to $49,999 | 0 (0.0%) | 0 (0.0%) |
| $50,000 to $54,999 | 0 (0.0%) | 3 (27.3%) |
| $55,000 to $64,999 | 3 (13.0%) | 0 (0.0%) |
| $65,000 to $74,999 | 3 (13.0%) | 0 (0.0%) |
| $75,000 to $99,999 | 0 (0.0%) | 0 (0.0%) |
| $100,000+ | 0 (0.0%) | 4 (36.4%) |
| Total | 23 (100.0%) | 11 (100.0%) |
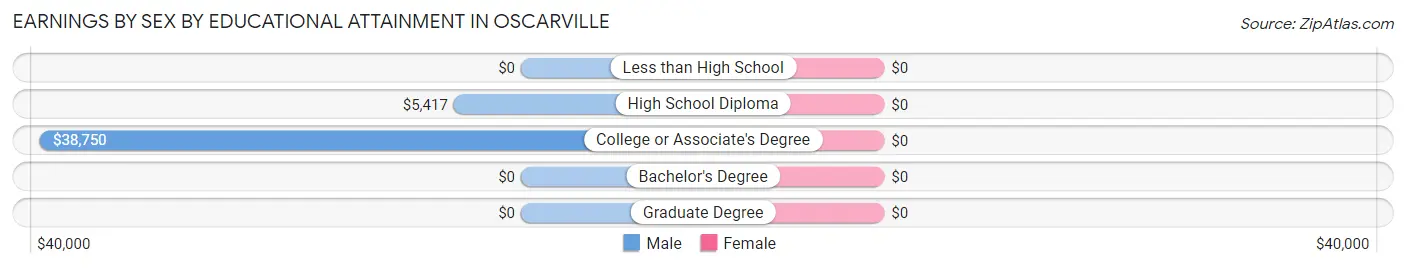
Earnings by Sex by Educational Attainment in Oscarville
| Educational Attainment | Male Income | Female Income |
| Less than High School | - | - |
| High School Diploma | $5,417 | $0 |
| College or Associate's Degree | $38,750 | $0 |
| Bachelor's Degree | - | - |
| Graduate Degree | - | - |
| Total | $22,083 | $0 |
Family Income in Oscarville
Family Income Brackets in Oscarville
According to the Oscarville family income data, there are 7 families falling into the $100,000 to $149,999 income range, which is the most common income bracket and makes up 50.0% of all families.
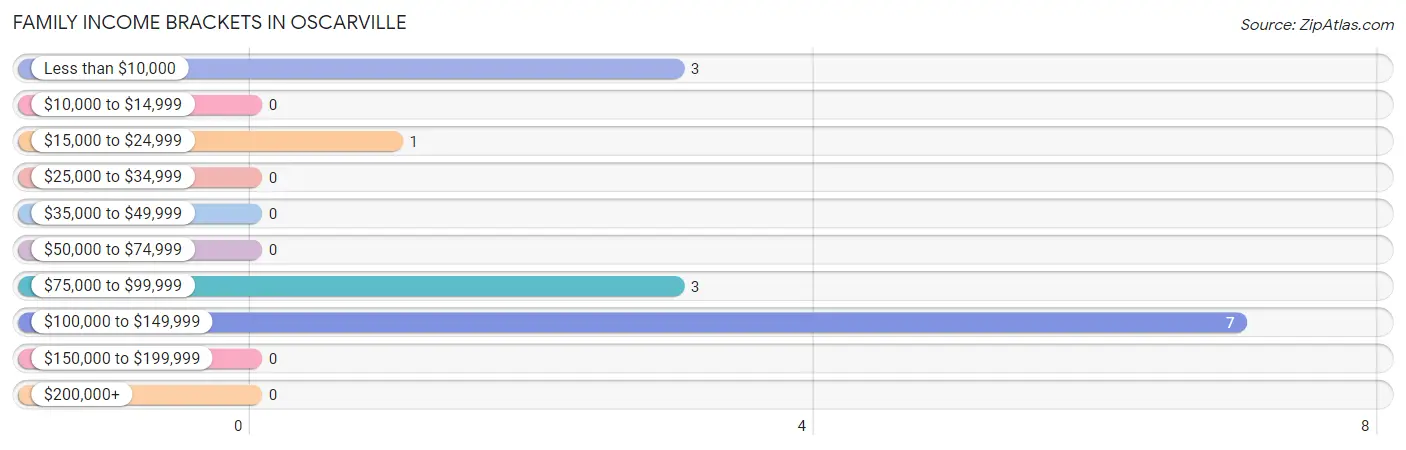
| Income Bracket | # Families | % Families |
| Less than $10,000 | 3 | 21.4% |
| $10,000 to $14,999 | 0 | 0.0% |
| $15,000 to $24,999 | 1 | 7.1% |
| $25,000 to $34,999 | 0 | 0.0% |
| $35,000 to $49,999 | 0 | 0.0% |
| $50,000 to $74,999 | 0 | 0.0% |
| $75,000 to $99,999 | 3 | 21.4% |
| $100,000 to $149,999 | 7 | 50.0% |
| $150,000 to $199,999 | 0 | 0.0% |
| $200,000+ | 0 | 0.0% |
Family Income by Famaliy Size in Oscarville
7+ person families (10 | 71.4%) account for the highest median family income in Oscarville with $124,167 per family, while 7+ person families (10 | 71.4%) have the highest median income of $17,738 per family member.
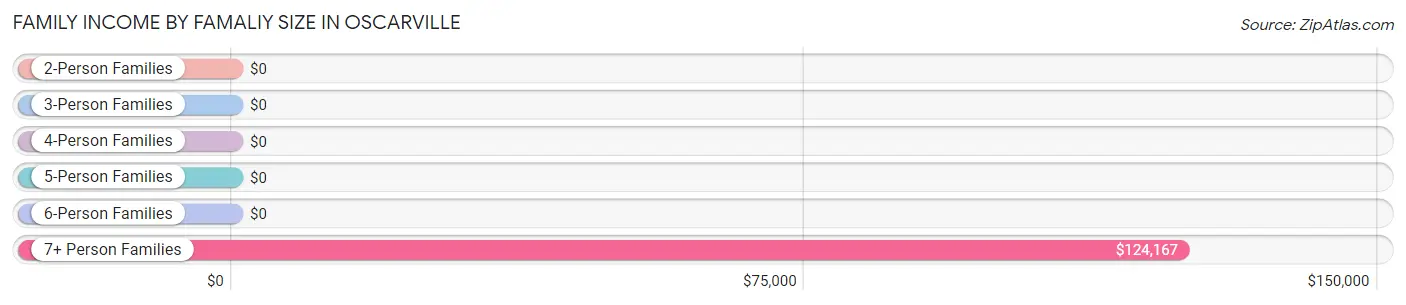
| Income Bracket | # Families | Median Income |
| 2-Person Families | 1 (7.1%) | $0 |
| 3-Person Families | 3 (21.4%) | $0 |
| 4-Person Families | 0 (0.0%) | $0 |
| 5-Person Families | 0 (0.0%) | $0 |
| 6-Person Families | 0 (0.0%) | $0 |
| 7+ Person Families | 10 (71.4%) | $124,167 |
| Total | 14 (100.0%) | $111,250 |
Family Income by Number of Earners in Oscarville
| Number of Earners | # Families | Median Income |
| No Earners | 0 (0.0%) | $0 |
| 1 Earner | 4 (28.6%) | $0 |
| 2 Earners | 7 (50.0%) | $0 |
| 3+ Earners | 3 (21.4%) | $0 |
| Total | 14 (100.0%) | $111,250 |
Household Income in Oscarville
Household Income Brackets in Oscarville
With 10 households falling in the category, the $100,000 to $149,999 income range is the most frequent in Oscarville, accounting for 50.0% of all households.
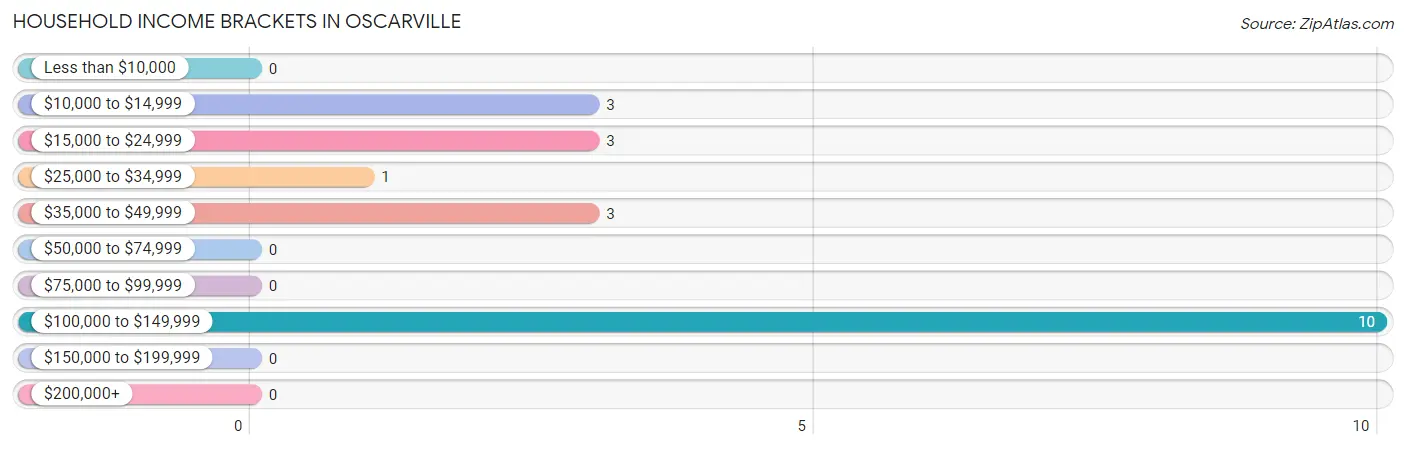
| Income Bracket | # Households | % Households |
| Less than $10,000 | 0 | 0.0% |
| $10,000 to $14,999 | 3 | 15.0% |
| $15,000 to $24,999 | 3 | 15.0% |
| $25,000 to $34,999 | 1 | 5.0% |
| $35,000 to $49,999 | 3 | 15.0% |
| $50,000 to $74,999 | 0 | 0.0% |
| $75,000 to $99,999 | 0 | 0.0% |
| $100,000 to $149,999 | 10 | 50.0% |
| $150,000 to $199,999 | 0 | 0.0% |
| $200,000+ | 0 | 0.0% |
Household Income by Householder Age in Oscarville
The median household income in Oscarville is $0, with the highest median household income of $123,750 found in the 25 to 44 years age bracket for the primary householder. A total of 11 households (55.0%) fall into this category.
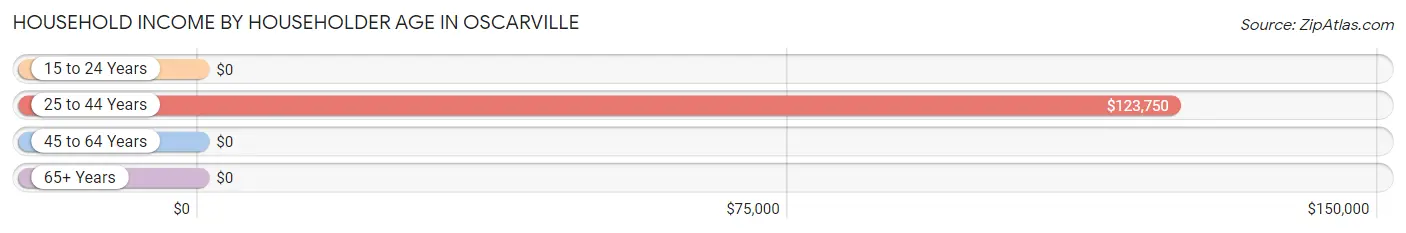
| Income Bracket | # Households | Median Income |
| 15 to 24 Years | 0 (0.0%) | $0 |
| 25 to 44 Years | 11 (55.0%) | $123,750 |
| 45 to 64 Years | 6 (30.0%) | $0 |
| 65+ Years | 3 (15.0%) | $0 |
| Total | 20 (100.0%) | $0 |
Poverty in Oscarville
Income Below Poverty by Sex and Age in Oscarville
With 11.6% poverty level for males and 33.3% for females among the residents of Oscarville, 25 to 34 year old males and 6 to 11 year old females are the most vulnerable to poverty, with 4 males (57.1%) and 3 females (100.0%) in their respective age groups living below the poverty level.
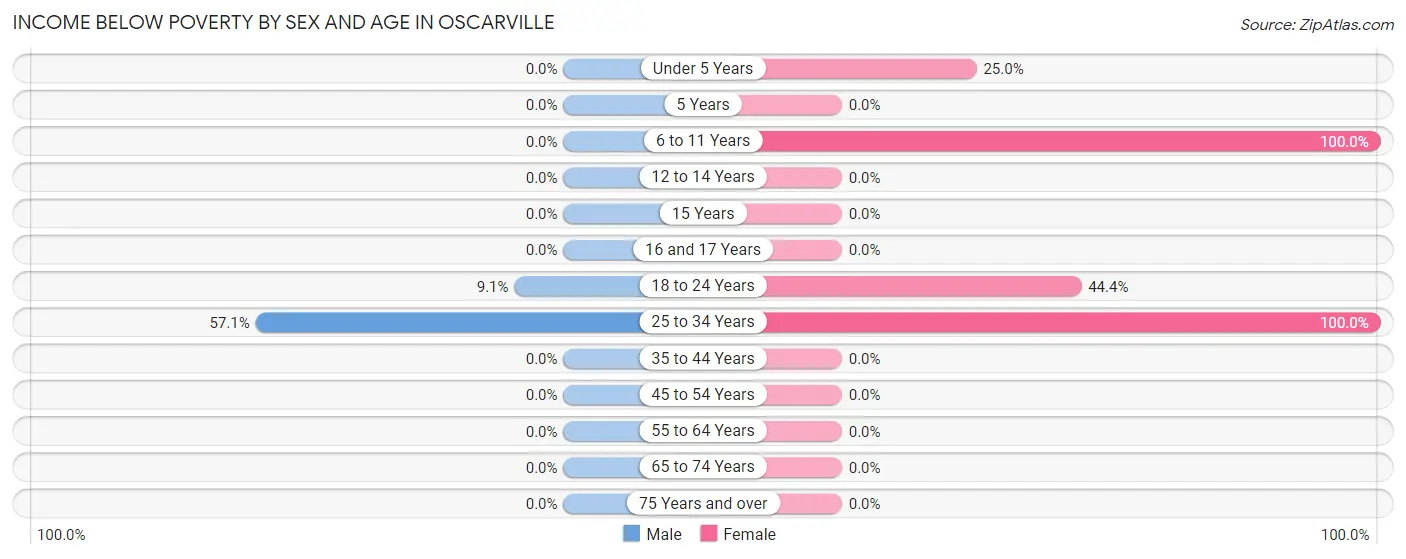
| Age Bracket | Male | Female |
| Under 5 Years | 0 (0.0%) | 2 (25.0%) |
| 5 Years | 0 (0.0%) | 0 (0.0%) |
| 6 to 11 Years | 0 (0.0%) | 3 (100.0%) |
| 12 to 14 Years | 0 (0.0%) | 0 (0.0%) |
| 15 Years | 0 (0.0%) | 0 (0.0%) |
| 16 and 17 Years | 0 (0.0%) | 0 (0.0%) |
| 18 to 24 Years | 1 (9.1%) | 4 (44.4%) |
| 25 to 34 Years | 4 (57.1%) | 6 (100.0%) |
| 35 to 44 Years | 0 (0.0%) | 0 (0.0%) |
| 45 to 54 Years | 0 (0.0%) | 0 (0.0%) |
| 55 to 64 Years | 0 (0.0%) | 0 (0.0%) |
| 65 to 74 Years | 0 (0.0%) | 0 (0.0%) |
| 75 Years and over | 0 (0.0%) | 0 (0.0%) |
| Total | 5 (11.6%) | 15 (33.3%) |
Income Above Poverty by Sex and Age in Oscarville
According to the poverty statistics in Oscarville, males aged under 5 years and females aged 5 years are the age groups that are most secure financially, with 100.0% of males and 100.0% of females in these age groups living above the poverty line.
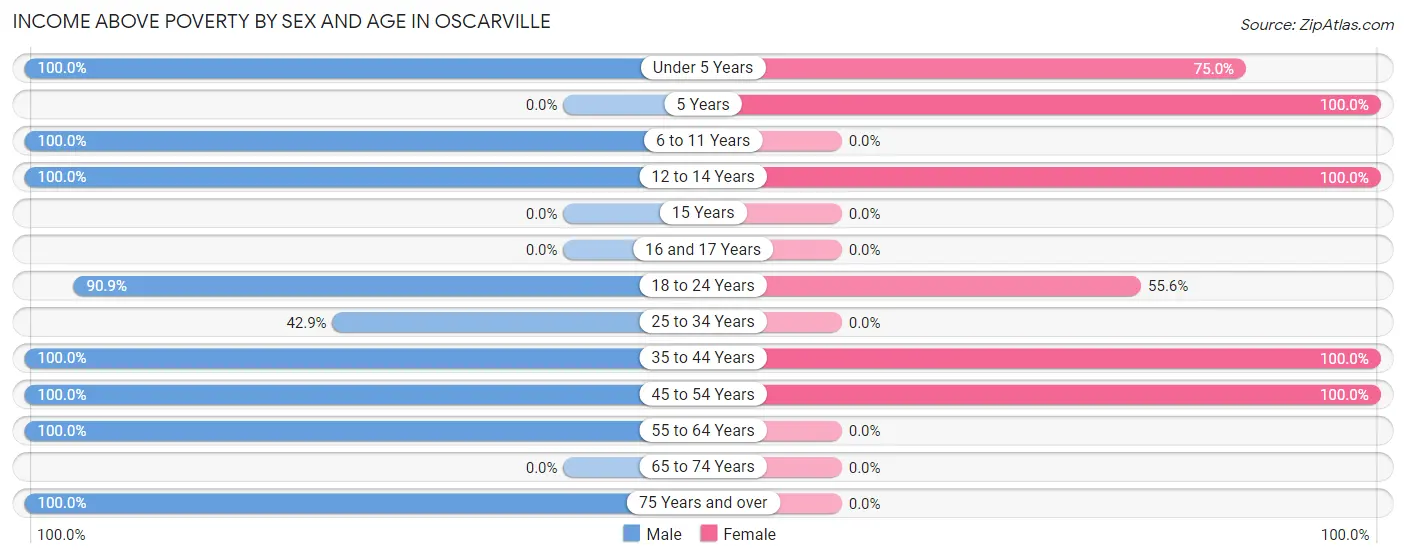
| Age Bracket | Male | Female |
| Under 5 Years | 6 (100.0%) | 6 (75.0%) |
| 5 Years | 0 (0.0%) | 6 (100.0%) |
| 6 to 11 Years | 2 (100.0%) | 0 (0.0%) |
| 12 to 14 Years | 2 (100.0%) | 3 (100.0%) |
| 15 Years | 0 (0.0%) | 0 (0.0%) |
| 16 and 17 Years | 0 (0.0%) | 0 (0.0%) |
| 18 to 24 Years | 10 (90.9%) | 5 (55.6%) |
| 25 to 34 Years | 3 (42.9%) | 0 (0.0%) |
| 35 to 44 Years | 6 (100.0%) | 7 (100.0%) |
| 45 to 54 Years | 3 (100.0%) | 3 (100.0%) |
| 55 to 64 Years | 3 (100.0%) | 0 (0.0%) |
| 65 to 74 Years | 0 (0.0%) | 0 (0.0%) |
| 75 Years and over | 3 (100.0%) | 0 (0.0%) |
| Total | 38 (88.4%) | 30 (66.7%) |
Income Below Poverty Among Married-Couple Families in Oscarville
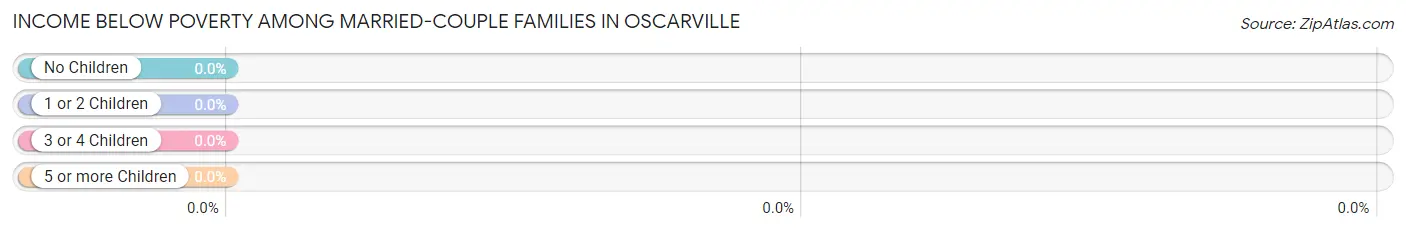
| Children | Above Poverty | Below Poverty |
| No Children | 0 (0.0%) | 0 (0.0%) |
| 1 or 2 Children | 3 (100.0%) | 0 (0.0%) |
| 3 or 4 Children | 4 (100.0%) | 0 (0.0%) |
| 5 or more Children | 3 (100.0%) | 0 (0.0%) |
| Total | 10 (100.0%) | 0 (0.0%) |
Income Below Poverty Among Single-Parent Households in Oscarville
According to the poverty data in Oscarville, 100.0% or 1 single-father households and 100.0% or 3 single-mother households are living below the poverty line. Among single-father households, those with 1 or 2 children have the highest poverty rate, with 1 households (100.0%) experiencing poverty. Likewise, among single-mother households, those with 1 or 2 children have the highest poverty rate, with 3 households (100.0%) falling below the poverty line.
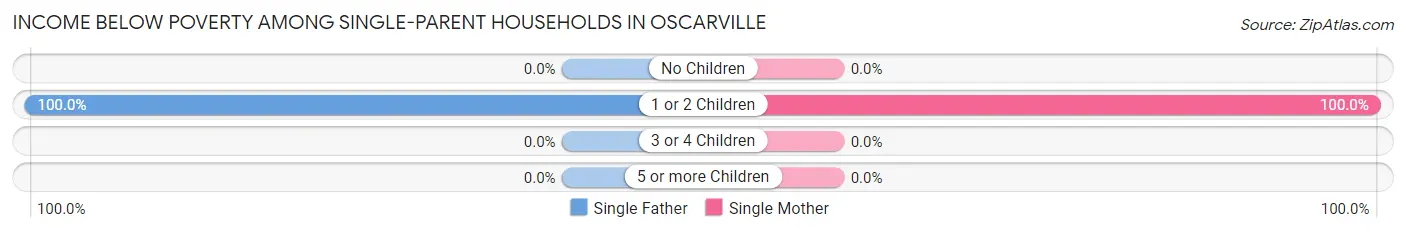
| Children | Single Father | Single Mother |
| No Children | 0 (0.0%) | 0 (0.0%) |
| 1 or 2 Children | 1 (100.0%) | 3 (100.0%) |
| 3 or 4 Children | 0 (0.0%) | 0 (0.0%) |
| 5 or more Children | 0 (0.0%) | 0 (0.0%) |
| Total | 1 (100.0%) | 3 (100.0%) |
Income Below Poverty Among Married-Couple vs Single-Parent Households in Oscarville
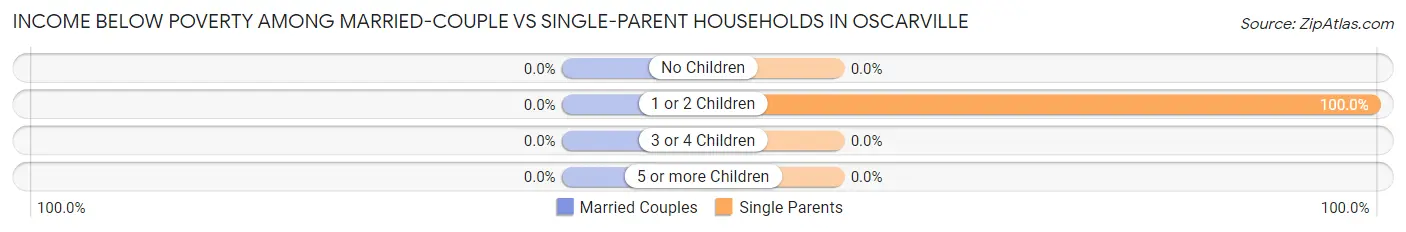
| Children | Married-Couple Families | Single-Parent Households |
| No Children | 0 (0.0%) | 0 (0.0%) |
| 1 or 2 Children | 0 (0.0%) | 4 (100.0%) |
| 3 or 4 Children | 0 (0.0%) | 0 (0.0%) |
| 5 or more Children | 0 (0.0%) | 0 (0.0%) |
| Total | 0 (0.0%) | 4 (100.0%) |
Race in Oscarville
The most populous races in Oscarville are Native / Alaskan (87 | 98.9%), and White / Caucasian (1 | 1.1%).
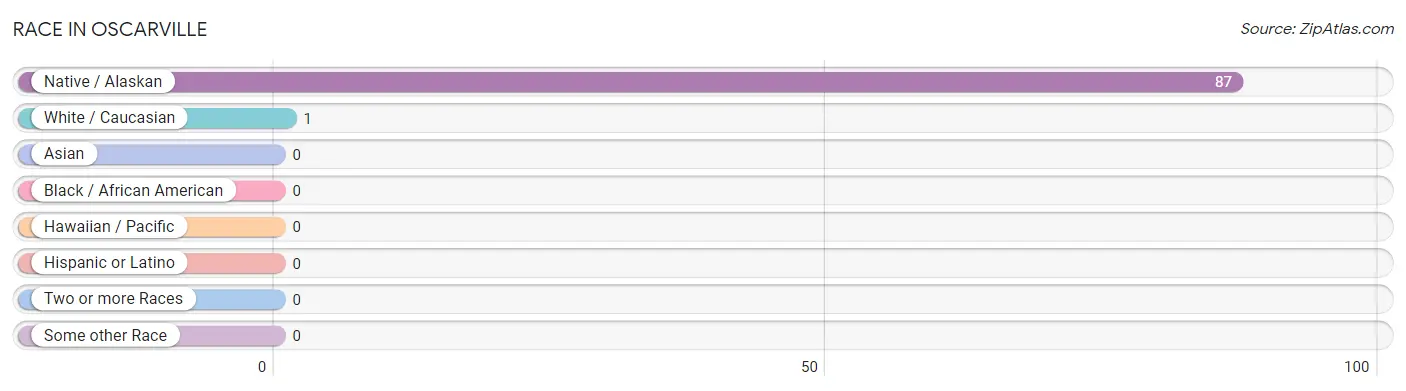
| Race | # Population | % Population |
| Asian | 0 | 0.0% |
| Black / African American | 0 | 0.0% |
| Hawaiian / Pacific | 0 | 0.0% |
| Hispanic or Latino | 0 | 0.0% |
| Native / Alaskan | 87 | 98.9% |
| White / Caucasian | 1 | 1.1% |
| Two or more Races | 0 | 0.0% |
| Some other Race | 0 | 0.0% |
| Total | 88 | 100.0% |
Ancestry in Oscarville
The most populous ancestries reported in Oscarville are Yup'ik (81 | 92.0%), Alaska Native (3 | 3.4%), Inupiat (3 | 3.4%), and European (1 | 1.1%), together accounting for 100.0% of all Oscarville residents.
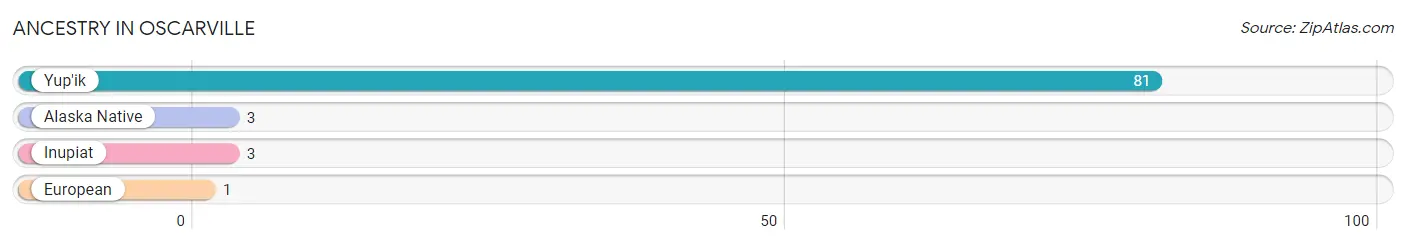
| Ancestry | # Population | % Population |
| Alaska Native | 3 | 3.4% |
| European | 1 | 1.1% |
| Inupiat | 3 | 3.4% |
| Yup'ik | 81 | 92.0% | View All 4 Rows |
Immigrants in Oscarville

| Immigration Origin | # Population | % Population | View All 0 Rows |
Sex and Age in Oscarville
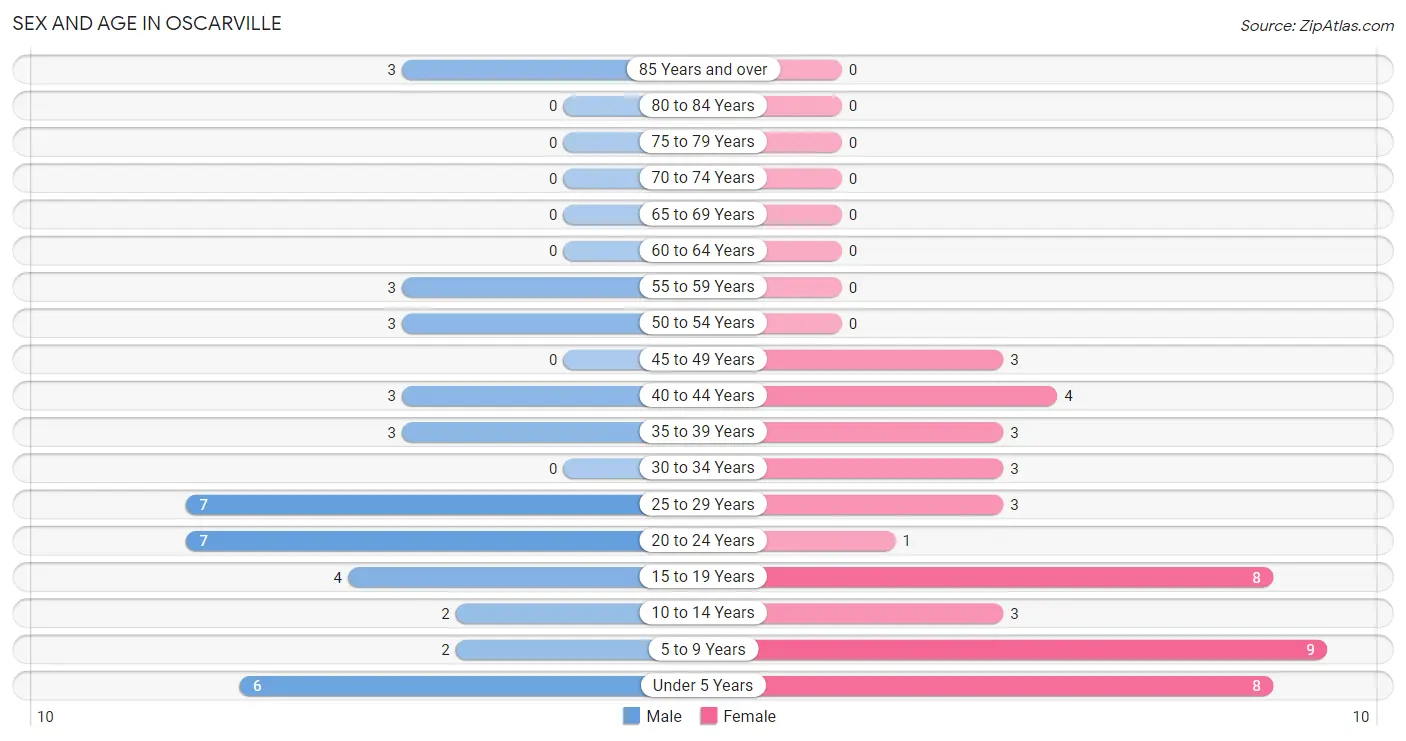
Sex and Age in Oscarville
The most populous age groups in Oscarville are 20 to 24 Years (7 | 16.3%) for men and 5 to 9 Years (9 | 20.0%) for women.
| Age Bracket | Male | Female |
| Under 5 Years | 6 (14.0%) | 8 (17.8%) |
| 5 to 9 Years | 2 (4.6%) | 9 (20.0%) |
| 10 to 14 Years | 2 (4.6%) | 3 (6.7%) |
| 15 to 19 Years | 4 (9.3%) | 8 (17.8%) |
| 20 to 24 Years | 7 (16.3%) | 1 (2.2%) |
| 25 to 29 Years | 7 (16.3%) | 3 (6.7%) |
| 30 to 34 Years | 0 (0.0%) | 3 (6.7%) |
| 35 to 39 Years | 3 (7.0%) | 3 (6.7%) |
| 40 to 44 Years | 3 (7.0%) | 4 (8.9%) |
| 45 to 49 Years | 0 (0.0%) | 3 (6.7%) |
| 50 to 54 Years | 3 (7.0%) | 0 (0.0%) |
| 55 to 59 Years | 3 (7.0%) | 0 (0.0%) |
| 60 to 64 Years | 0 (0.0%) | 0 (0.0%) |
| 65 to 69 Years | 0 (0.0%) | 0 (0.0%) |
| 70 to 74 Years | 0 (0.0%) | 0 (0.0%) |
| 75 to 79 Years | 0 (0.0%) | 0 (0.0%) |
| 80 to 84 Years | 0 (0.0%) | 0 (0.0%) |
| 85 Years and over | 3 (7.0%) | 0 (0.0%) |
| Total | 43 (100.0%) | 45 (100.0%) |
Families and Households in Oscarville
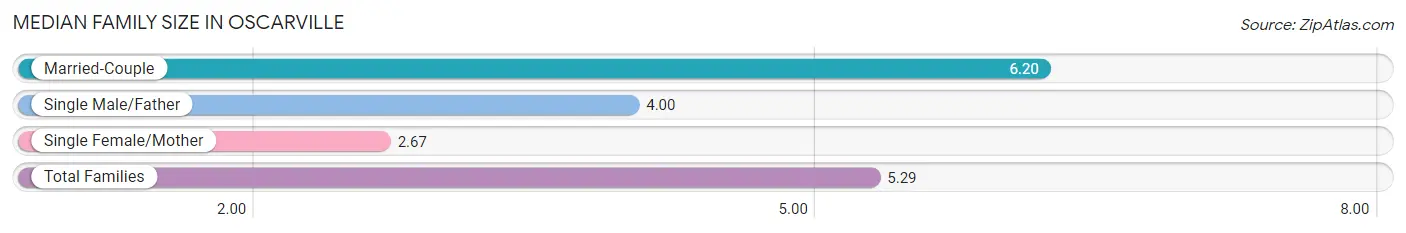
Median Family Size in Oscarville
The median family size in Oscarville is 5.29 persons per family, with married-couple families (10 | 71.4%) accounting for the largest median family size of 6.2 persons per family. On the other hand, single female/mother families (3 | 21.4%) represent the smallest median family size with 2.67 persons per family.
| Family Type | # Families | Family Size |
| Married-Couple | 10 (71.4%) | 6.20 |
| Single Male/Father | 1 (7.1%) | 4.00 |
| Single Female/Mother | 3 (21.4%) | 2.67 |
| Total Families | 14 (100.0%) | 5.29 |
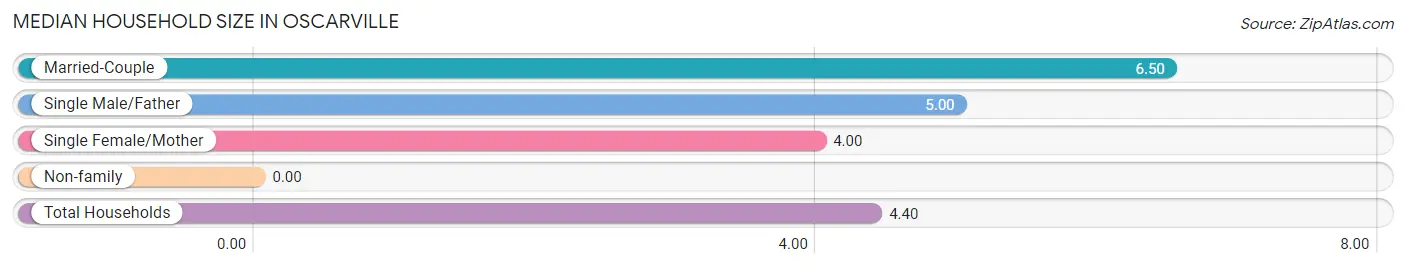
Median Household Size in Oscarville
| Household Type | # Households | Household Size |
| Married-Couple | 10 (50.0%) | 6.50 |
| Single Male/Father | 1 (5.0%) | 5.00 |
| Single Female/Mother | 3 (15.0%) | 4.00 |
| Non-family | 6 (30.0%) | - |
| Total Households | 20 (100.0%) | 4.40 |
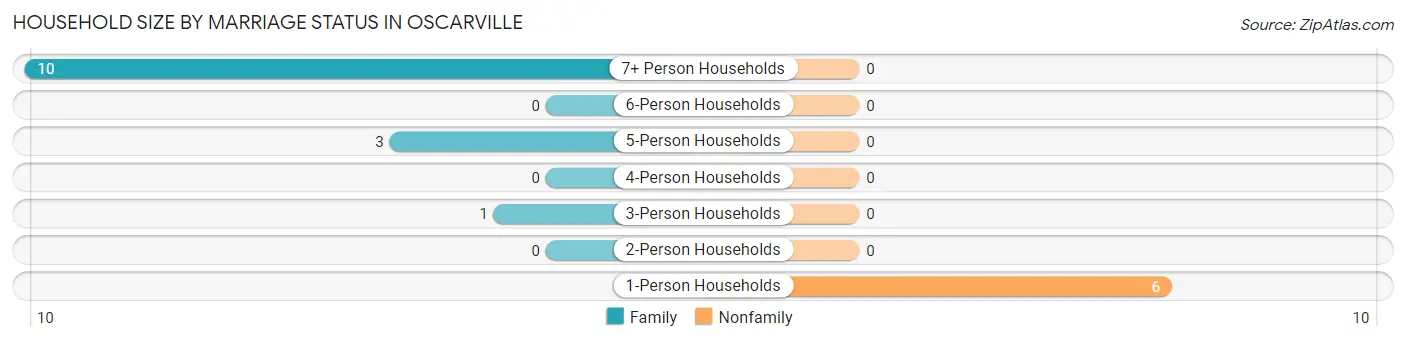
Household Size by Marriage Status in Oscarville
Out of a total of 20 households in Oscarville, 14 (70.0%) are family households, while 6 (30.0%) are nonfamily households. The most numerous type of family households are 7+ person households, comprising 10, and the most common type of nonfamily households are 1-person households, comprising 6.
| Household Size | Family Households | Nonfamily Households |
| 1-Person Households | - | 6 (30.0%) |
| 2-Person Households | 0 (0.0%) | 0 (0.0%) |
| 3-Person Households | 1 (5.0%) | 0 (0.0%) |
| 4-Person Households | 0 (0.0%) | 0 (0.0%) |
| 5-Person Households | 3 (15.0%) | 0 (0.0%) |
| 6-Person Households | 0 (0.0%) | 0 (0.0%) |
| 7+ Person Households | 10 (50.0%) | 0 (0.0%) |
| Total | 14 (70.0%) | 6 (30.0%) |
Female Fertility in Oscarville
Fertility by Age in Oscarville
Average fertility rate in Oscarville is 120.0 births per 1,000 women. Women in the age bracket of 35 to 50 years have the highest fertility rate with 300.0 births per 1,000 women. Women in the age bracket of 35 to 50 years acount for 100.0% of all women with births.
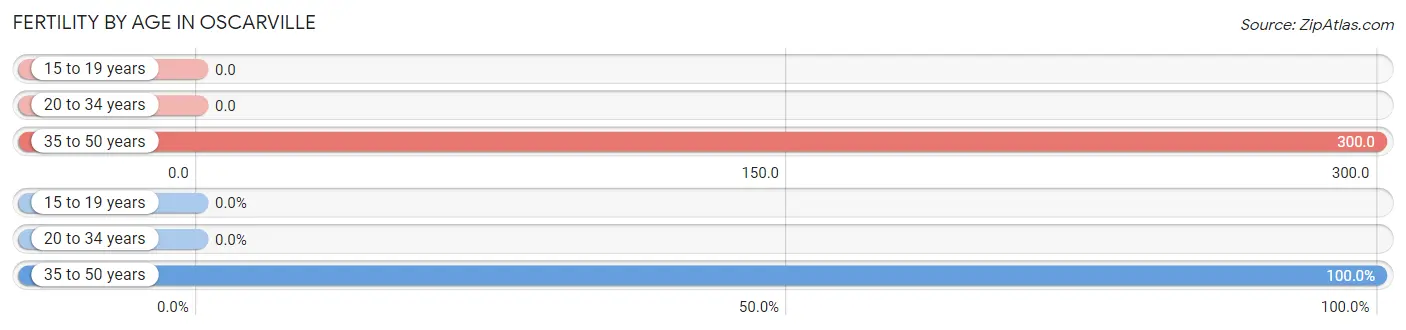
| Age Bracket | Women with Births | Births / 1,000 Women |
| 15 to 19 years | 0 (0.0%) | 0.0 |
| 20 to 34 years | 0 (0.0%) | 0.0 |
| 35 to 50 years | 3 (100.0%) | 300.0 |
| Total | 3 (100.0%) | 120.0 |
Fertility by Age by Marriage Status in Oscarville
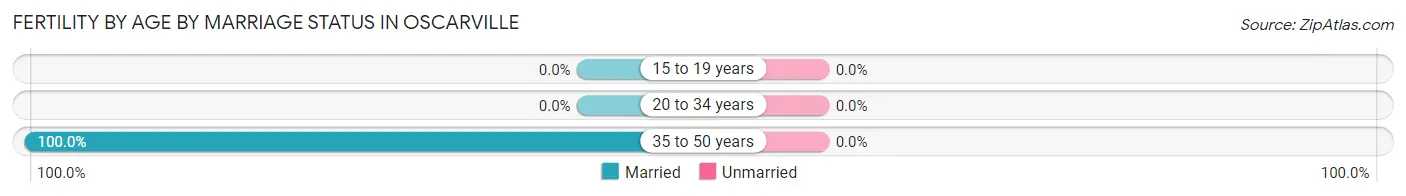
| Age Bracket | Married | Unmarried |
| 15 to 19 years | 0 (0.0%) | 0 (0.0%) |
| 20 to 34 years | 0 (0.0%) | 0 (0.0%) |
| 35 to 50 years | 3 (100.0%) | 0 (0.0%) |
| Total | 3 (100.0%) | 0 (0.0%) |
Fertility by Education in Oscarville
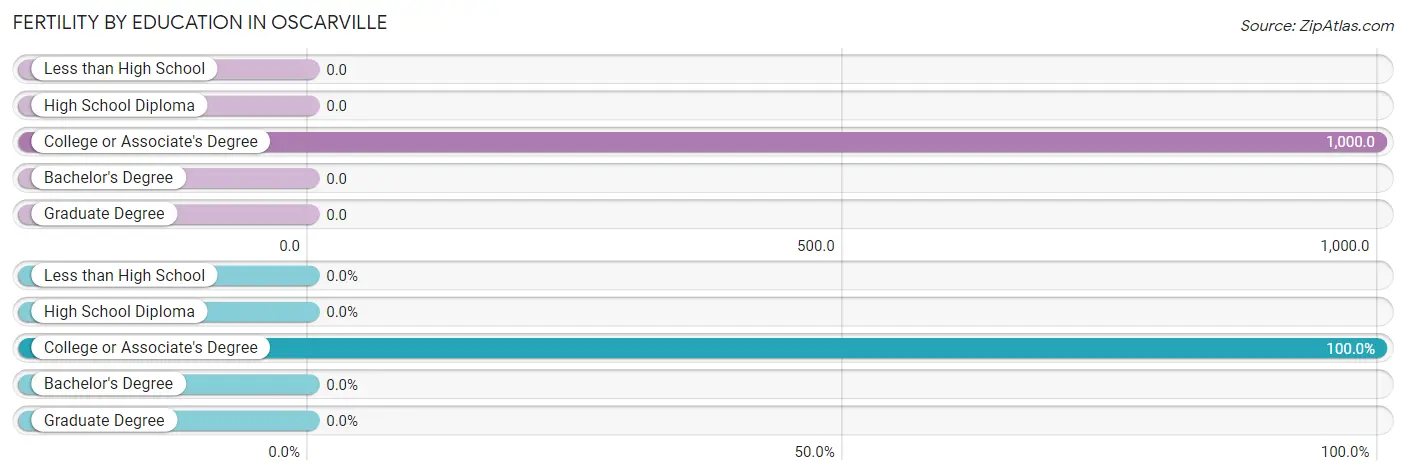
| Educational Attainment | Women with Births | Births / 1,000 Women |
| Less than High School | 0 (0.0%) | 0.0 |
| High School Diploma | 0 (0.0%) | 0.0 |
| College or Associate's Degree | 3 (100.0%) | 1,000.0 |
| Bachelor's Degree | 0 (0.0%) | 0.0 |
| Graduate Degree | 0 (0.0%) | 0.0 |
| Total | 3 (100.0%) | 120.0 |
Fertility by Education by Marriage Status in Oscarville
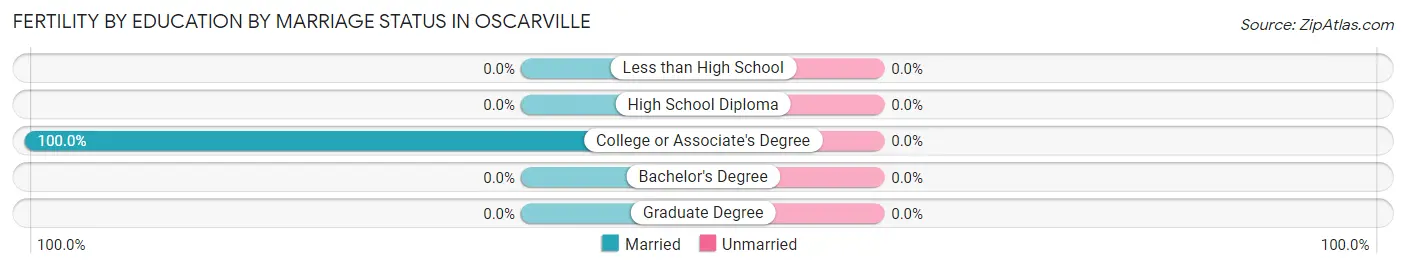
| Educational Attainment | Married | Unmarried |
| Less than High School | 0 (0.0%) | 0 (0.0%) |
| High School Diploma | 0 (0.0%) | 0 (0.0%) |
| College or Associate's Degree | 3 (100.0%) | 0 (0.0%) |
| Bachelor's Degree | 0 (0.0%) | 0 (0.0%) |
| Graduate Degree | 0 (0.0%) | 0 (0.0%) |
| Total | 3 (100.0%) | 0 (0.0%) |
Employment Characteristics in Oscarville
Employment by Class of Employer in Oscarville
Among the 22 employed individuals in Oscarville, local government employees (10 | 45.5%), not-for-profit organizations (7 | 31.8%), and federal government employees (3 | 13.6%) make up the most common classes of employment.
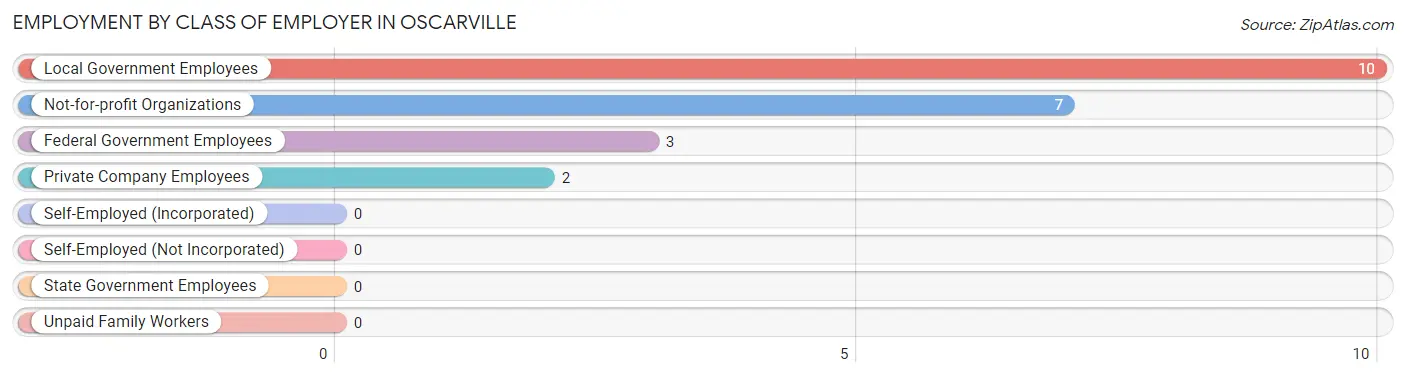
| Employer Class | # Employees | % Employees |
| Private Company Employees | 2 | 9.1% |
| Self-Employed (Incorporated) | 0 | 0.0% |
| Self-Employed (Not Incorporated) | 0 | 0.0% |
| Not-for-profit Organizations | 7 | 31.8% |
| Local Government Employees | 10 | 45.5% |
| State Government Employees | 0 | 0.0% |
| Federal Government Employees | 3 | 13.6% |
| Unpaid Family Workers | 0 | 0.0% |
| Total | 22 | 100.0% |
Employment Status by Age in Oscarville
According to the labor force statistics for Oscarville, out of the total population over 16 years of age (58), 58.6% or 34 individuals are in the labor force, with 35.3% or 12 of them unemployed. The age group with the highest labor force participation rate is 25 to 29 years, with 100.0% or 10 individuals in the labor force. Within the labor force, the 30 to 34 years age range has the highest percentage of unemployed individuals, with 100.0% or 3 of them being unemployed.
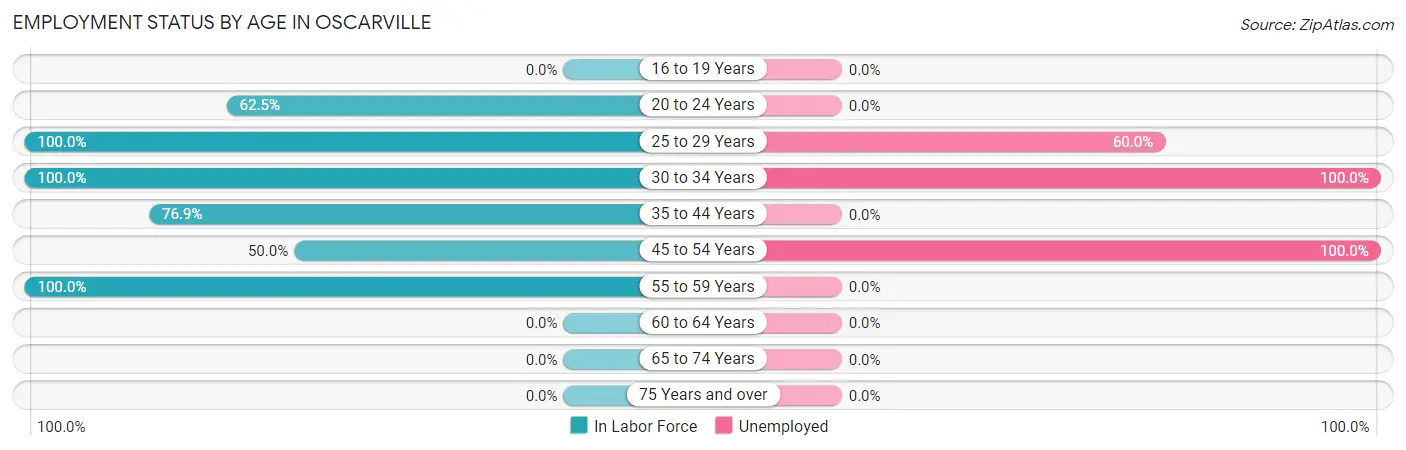
| Age Bracket | In Labor Force | Unemployed |
| 16 to 19 Years | 0 (0.0%) | 0 (0.0%) |
| 20 to 24 Years | 5 (62.5%) | 0 (0.0%) |
| 25 to 29 Years | 10 (100.0%) | 6 (60.0%) |
| 30 to 34 Years | 3 (100.0%) | 3 (100.0%) |
| 35 to 44 Years | 10 (76.9%) | 0 (0.0%) |
| 45 to 54 Years | 3 (50.0%) | 3 (100.0%) |
| 55 to 59 Years | 3 (100.0%) | 0 (0.0%) |
| 60 to 64 Years | 0 (0.0%) | 0 (0.0%) |
| 65 to 74 Years | 0 (0.0%) | 0 (0.0%) |
| 75 Years and over | 0 (0.0%) | 0 (0.0%) |
| Total | 34 (58.6%) | 12 (35.3%) |
Employment Status by Educational Attainment in Oscarville
According to labor force statistics for Oscarville, 82.9% of individuals (29) out of the total population between 25 and 64 years of age (35) are in the labor force, with 41.4% or 12 of them being unemployed. The group with the highest labor force participation rate are those with the educational attainment of high school diploma, with 100.0% or 13 individuals in the labor force. Within the labor force, individuals with less than high school education have the highest percentage of unemployment, with 100.0% or 3 of them being unemployed.
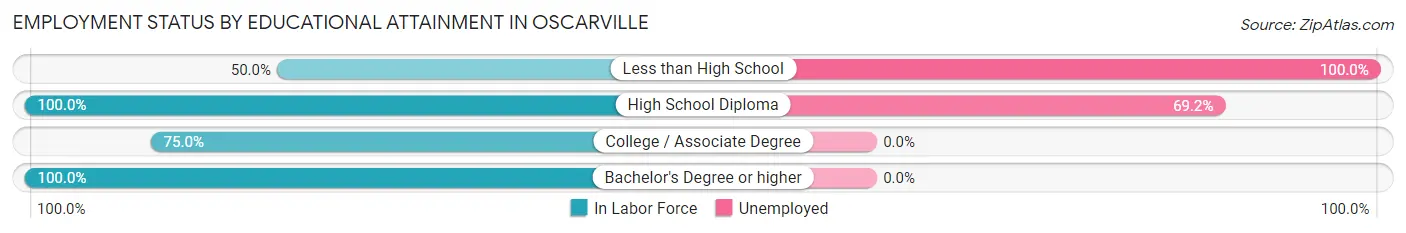
| Educational Attainment | In Labor Force | Unemployed |
| Less than High School | 3 (50.0%) | 6 (100.0%) |
| High School Diploma | 13 (100.0%) | 9 (69.2%) |
| College / Associate Degree | 9 (75.0%) | 0 (0.0%) |
| Bachelor's Degree or higher | 4 (100.0%) | 0 (0.0%) |
| Total | 29 (82.9%) | 14 (41.4%) |
Employment Occupations by Sex in Oscarville
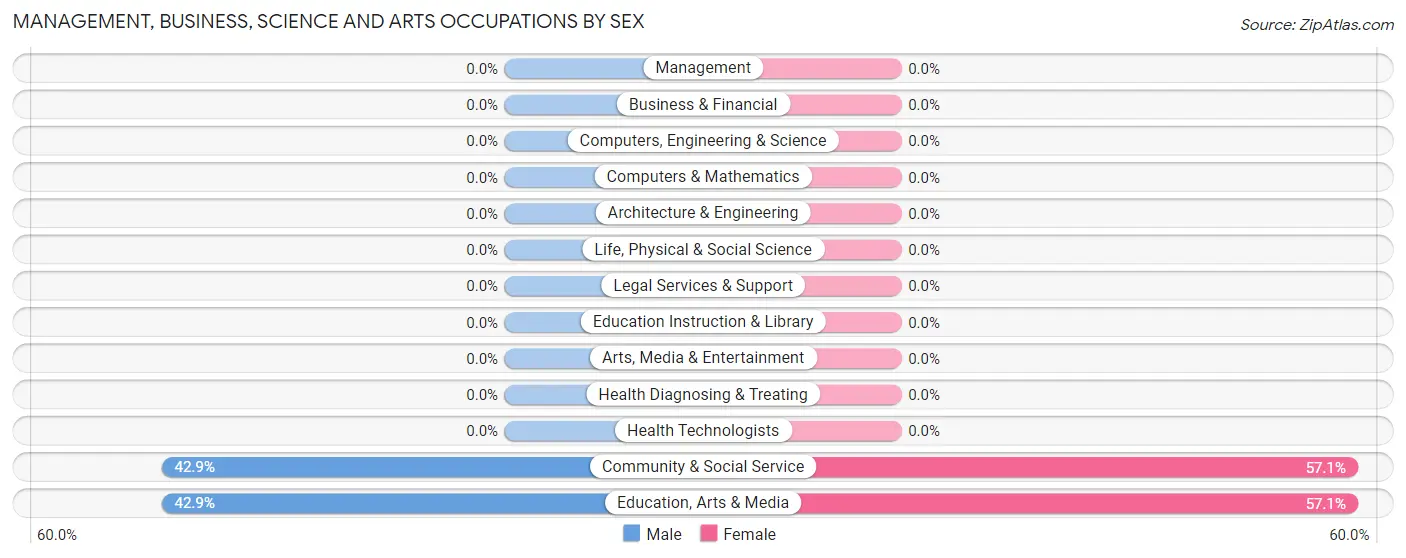
Management, Business, Science and Arts Occupations
The most common Management, Business, Science and Arts occupations in Oscarville are Community & Social Service (7 | 31.8%), and Education, Arts & Media (7 | 31.8%).
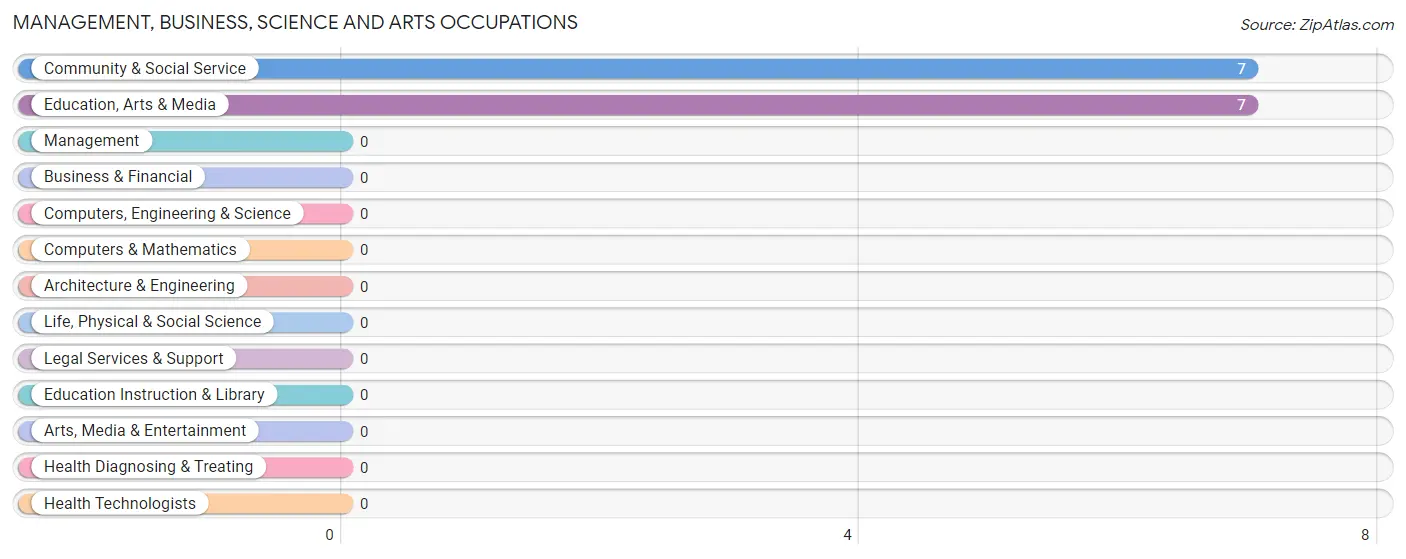
Management, Business, Science and Arts Occupations by Sex
Within the Management, Business, Science and Arts occupations in Oscarville, the most male-oriented occupations are Community & Social Service (42.9%), and Education, Arts & Media (42.9%), while the most female-oriented occupations are Community & Social Service (57.1%), and Education, Arts & Media (57.1%).
| Occupation | Male | Female |
| Management | 0 (0.0%) | 0 (0.0%) |
| Business & Financial | 0 (0.0%) | 0 (0.0%) |
| Computers, Engineering & Science | 0 (0.0%) | 0 (0.0%) |
| Computers & Mathematics | 0 (0.0%) | 0 (0.0%) |
| Architecture & Engineering | 0 (0.0%) | 0 (0.0%) |
| Life, Physical & Social Science | 0 (0.0%) | 0 (0.0%) |
| Community & Social Service | 3 (42.9%) | 4 (57.1%) |
| Education, Arts & Media | 3 (42.9%) | 4 (57.1%) |
| Legal Services & Support | 0 (0.0%) | 0 (0.0%) |
| Education Instruction & Library | 0 (0.0%) | 0 (0.0%) |
| Arts, Media & Entertainment | 0 (0.0%) | 0 (0.0%) |
| Health Diagnosing & Treating | 0 (0.0%) | 0 (0.0%) |
| Health Technologists | 0 (0.0%) | 0 (0.0%) |
| Total (Category) | 3 (42.9%) | 4 (57.1%) |
| Total (Overall) | 14 (63.6%) | 8 (36.4%) |
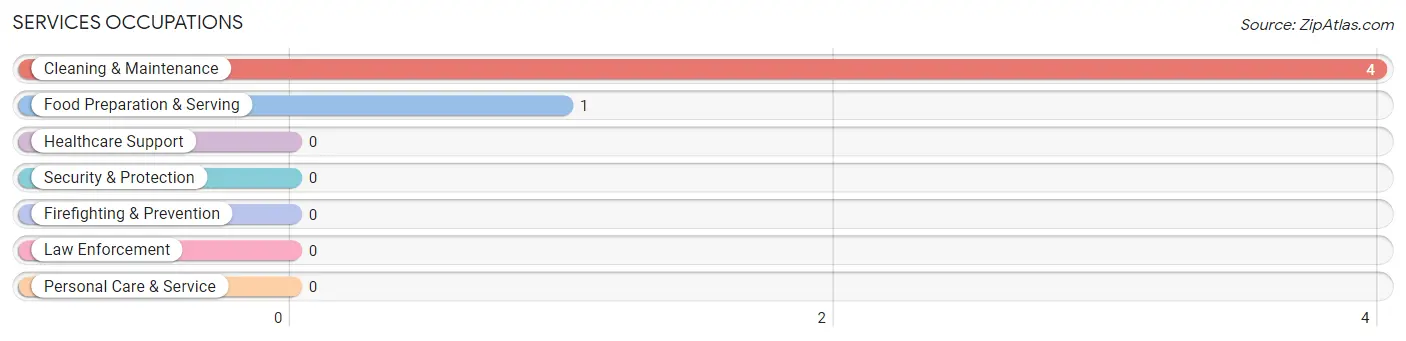
Services Occupations
The most common Services occupations in Oscarville are Cleaning & Maintenance (4 | 18.2%), and Food Preparation & Serving (1 | 4.5%).
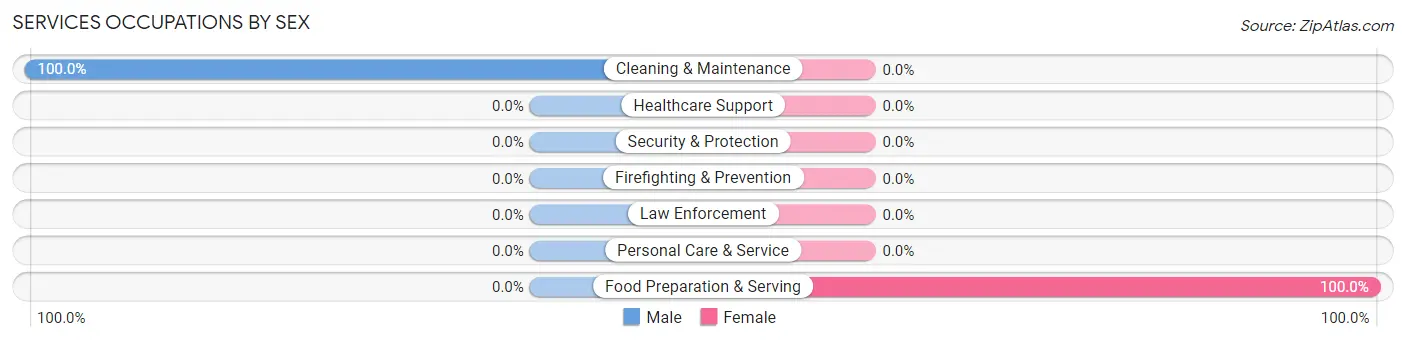
Services Occupations by Sex
| Occupation | Male | Female |
| Healthcare Support | 0 (0.0%) | 0 (0.0%) |
| Security & Protection | 0 (0.0%) | 0 (0.0%) |
| Firefighting & Prevention | 0 (0.0%) | 0 (0.0%) |
| Law Enforcement | 0 (0.0%) | 0 (0.0%) |
| Food Preparation & Serving | 0 (0.0%) | 1 (100.0%) |
| Cleaning & Maintenance | 4 (100.0%) | 0 (0.0%) |
| Personal Care & Service | 0 (0.0%) | 0 (0.0%) |
| Total (Category) | 4 (80.0%) | 1 (20.0%) |
| Total (Overall) | 14 (63.6%) | 8 (36.4%) |
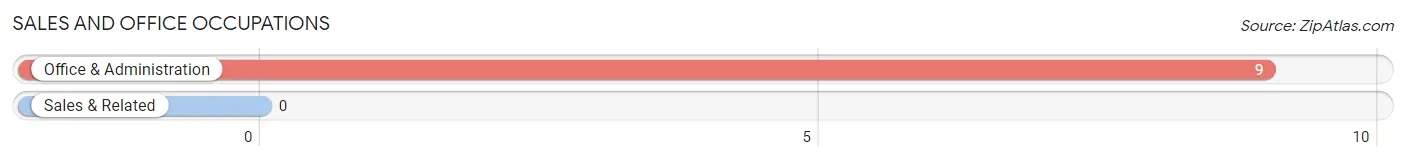
Sales and Office Occupations
The most common Sales and Office occupations in Oscarville are , and Office & Administration (9 | 40.9%).
Sales and Office Occupations by Sex

| Occupation | Male | Female |
| Sales & Related | 0 (0.0%) | 0 (0.0%) |
| Office & Administration | 6 (66.7%) | 3 (33.3%) |
| Total (Category) | 6 (66.7%) | 3 (33.3%) |
| Total (Overall) | 14 (63.6%) | 8 (36.4%) |
Natural Resources, Construction and Maintenance Occupations

Natural Resources, Construction and Maintenance Occupations by Sex
| Occupation | Male | Female |
| Farming, Fishing & Forestry | 0 (0.0%) | 0 (0.0%) |
| Construction & Extraction | 0 (0.0%) | 0 (0.0%) |
| Installation, Maintenance & Repair | 0 (0.0%) | 0 (0.0%) |
| Total (Category) | 0 (0.0%) | 0 (0.0%) |
| Total (Overall) | 14 (63.6%) | 8 (36.4%) |
Production, Transportation and Moving Occupations
The most common Production, Transportation and Moving occupations in Oscarville are , and Material Moving (1 | 4.5%).
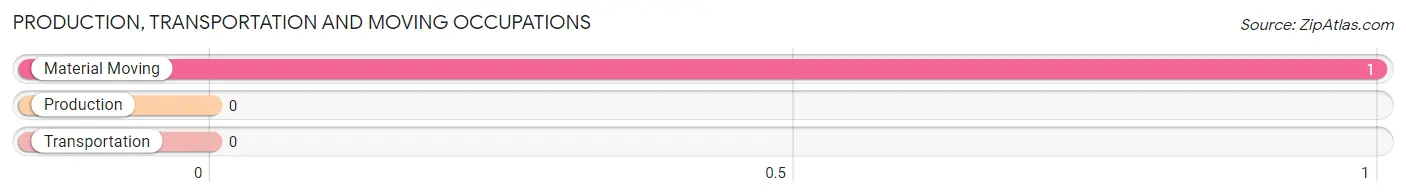
Production, Transportation and Moving Occupations by Sex
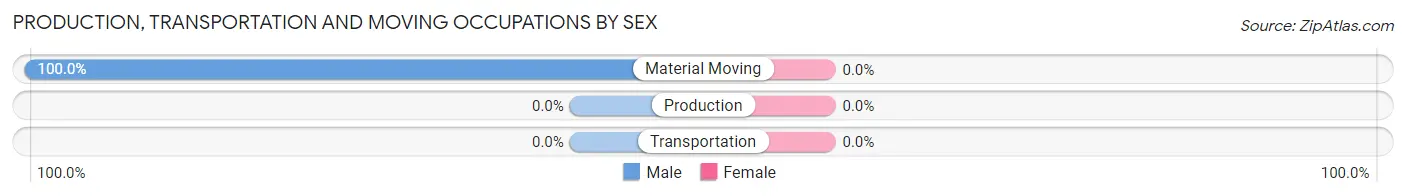
| Occupation | Male | Female |
| Production | 0 (0.0%) | 0 (0.0%) |
| Transportation | 0 (0.0%) | 0 (0.0%) |
| Material Moving | 1 (100.0%) | 0 (0.0%) |
| Total (Category) | 1 (100.0%) | 0 (0.0%) |
| Total (Overall) | 14 (63.6%) | 8 (36.4%) |
Employment Industries by Sex in Oscarville
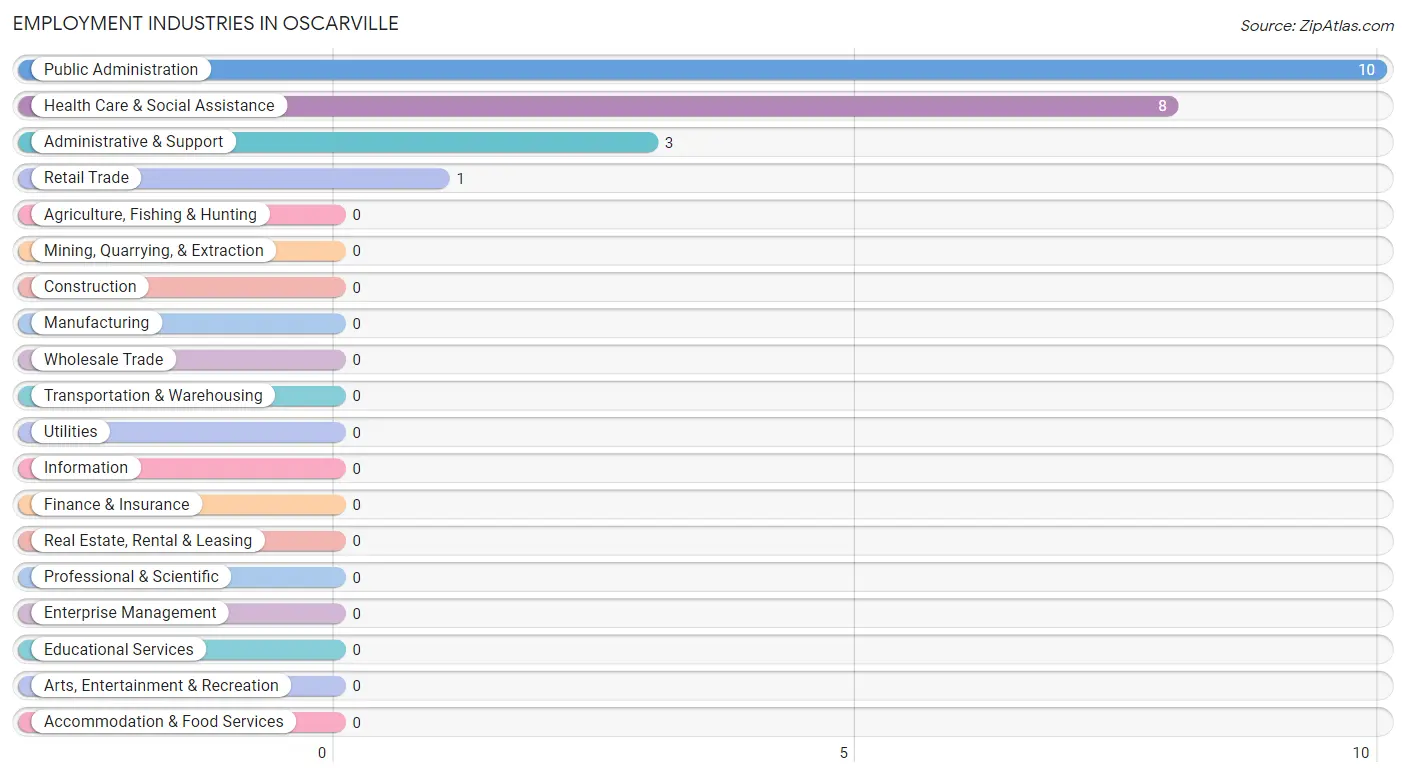
Employment Industries in Oscarville
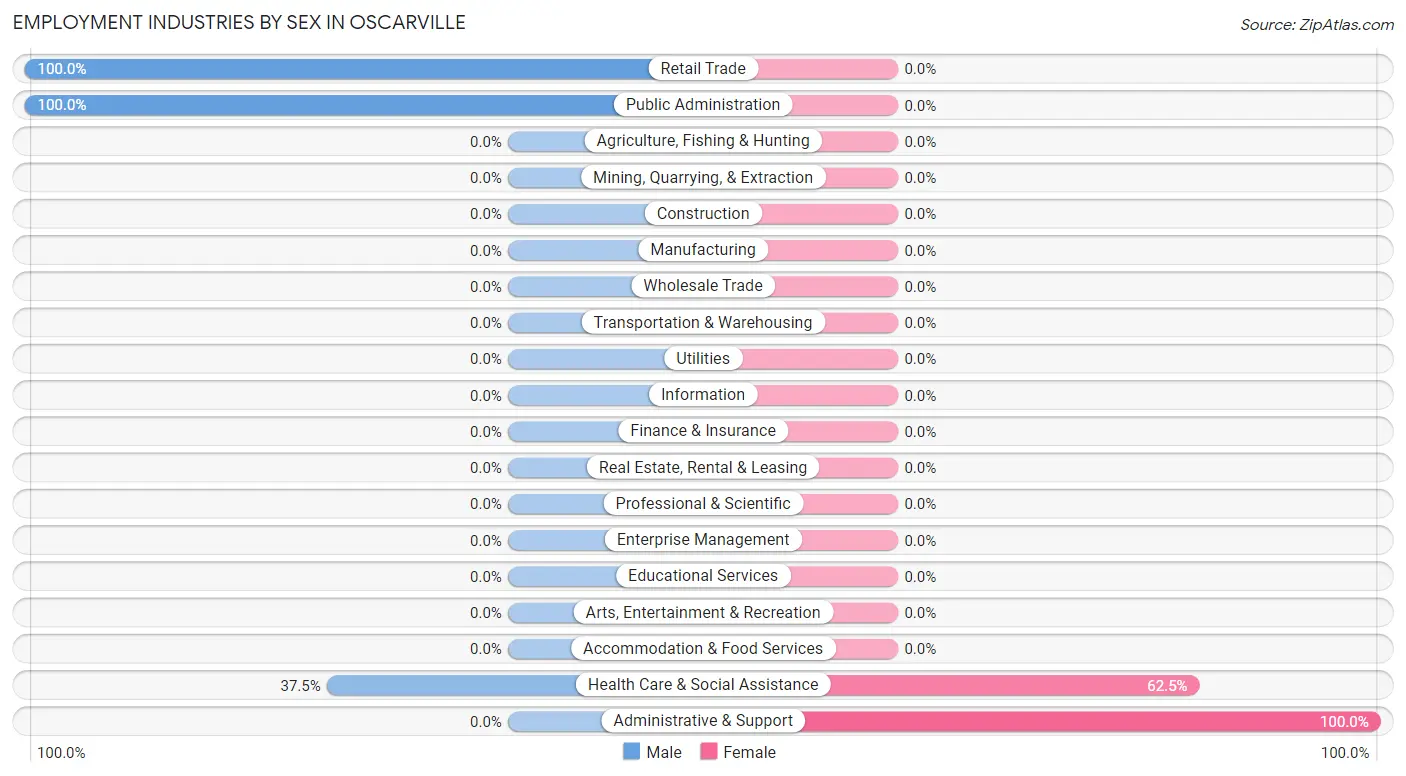
The major employment industries in Oscarville include Public Administration (10 | 45.5%), Health Care & Social Assistance (8 | 36.4%), Administrative & Support (3 | 13.6%), and Retail Trade (1 | 4.5%).
Employment Industries by Sex in Oscarville
The Oscarville industries that see more men than women are Retail Trade (100.0%), Public Administration (100.0%), and Health Care & Social Assistance (37.5%), whereas the industries that tend to have a higher number of women are Administrative & Support (100.0%), and Health Care & Social Assistance (62.5%).
| Industry | Male | Female |
| Agriculture, Fishing & Hunting | 0 (0.0%) | 0 (0.0%) |
| Mining, Quarrying, & Extraction | 0 (0.0%) | 0 (0.0%) |
| Construction | 0 (0.0%) | 0 (0.0%) |
| Manufacturing | 0 (0.0%) | 0 (0.0%) |
| Wholesale Trade | 0 (0.0%) | 0 (0.0%) |
| Retail Trade | 1 (100.0%) | 0 (0.0%) |
| Transportation & Warehousing | 0 (0.0%) | 0 (0.0%) |
| Utilities | 0 (0.0%) | 0 (0.0%) |
| Information | 0 (0.0%) | 0 (0.0%) |
| Finance & Insurance | 0 (0.0%) | 0 (0.0%) |
| Real Estate, Rental & Leasing | 0 (0.0%) | 0 (0.0%) |
| Professional & Scientific | 0 (0.0%) | 0 (0.0%) |
| Enterprise Management | 0 (0.0%) | 0 (0.0%) |
| Administrative & Support | 0 (0.0%) | 3 (100.0%) |
| Educational Services | 0 (0.0%) | 0 (0.0%) |
| Health Care & Social Assistance | 3 (37.5%) | 5 (62.5%) |
| Arts, Entertainment & Recreation | 0 (0.0%) | 0 (0.0%) |
| Accommodation & Food Services | 0 (0.0%) | 0 (0.0%) |
| Public Administration | 10 (100.0%) | 0 (0.0%) |
| Total | 14 (63.6%) | 8 (36.4%) |
Education in Oscarville
School Enrollment in Oscarville
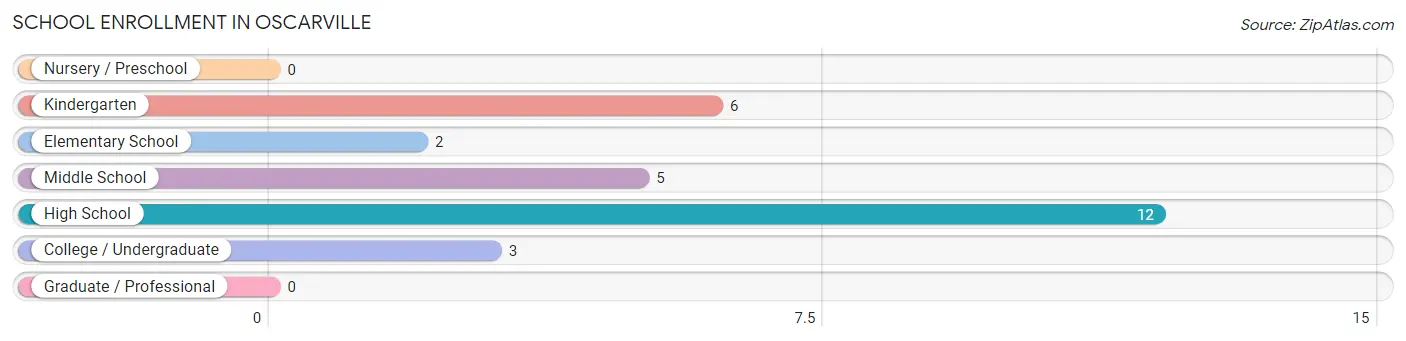
The most common levels of schooling among the 28 students in Oscarville are high school (12 | 42.9%), kindergarten (6 | 21.4%), and middle school (5 | 17.9%).
| School Level | # Students | % Students |
| Nursery / Preschool | 0 | 0.0% |
| Kindergarten | 6 | 21.4% |
| Elementary School | 2 | 7.1% |
| Middle School | 5 | 17.9% |
| High School | 12 | 42.9% |
| College / Undergraduate | 3 | 10.7% |
| Graduate / Professional | 0 | 0.0% |
| Total | 28 | 100.0% |
School Enrollment by Age by Funding Source in Oscarville
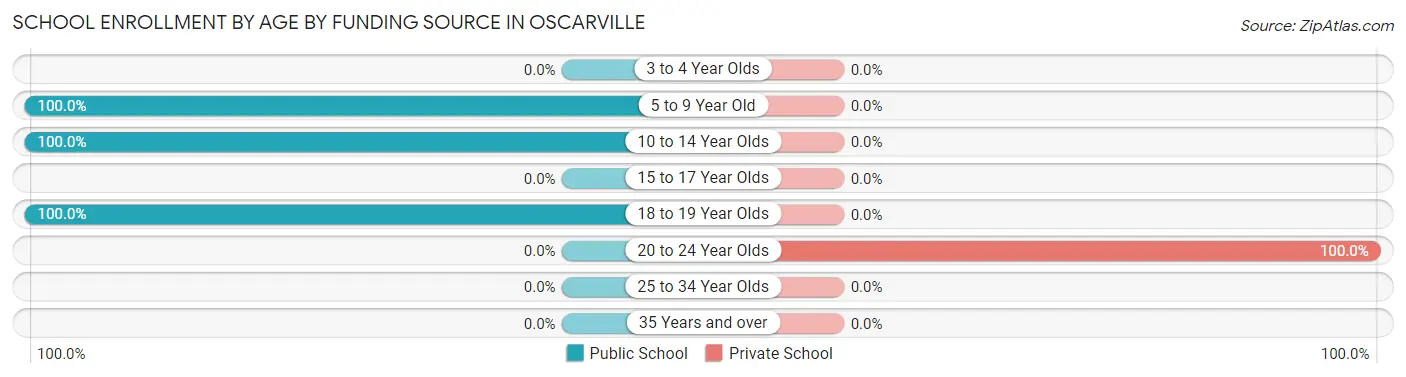
Out of a total of 28 students who are enrolled in schools in Oscarville, 3 (10.7%) attend a private institution, while the remaining 25 (89.3%) are enrolled in public schools. The age group of 20 to 24 year olds has the highest likelihood of being enrolled in private schools, with 3 (100.0% in the age bracket) enrolled. Conversely, the age group of 5 to 9 year old has the lowest likelihood of being enrolled in a private school, with 8 (100.0% in the age bracket) attending a public institution.
| Age Bracket | Public School | Private School |
| 3 to 4 Year Olds | 0 (0.0%) | 0 (0.0%) |
| 5 to 9 Year Old | 8 (100.0%) | 0 (0.0%) |
| 10 to 14 Year Olds | 5 (100.0%) | 0 (0.0%) |
| 15 to 17 Year Olds | 0 (0.0%) | 0 (0.0%) |
| 18 to 19 Year Olds | 12 (100.0%) | 0 (0.0%) |
| 20 to 24 Year Olds | 0 (0.0%) | 3 (100.0%) |
| 25 to 34 Year Olds | 0 (0.0%) | 0 (0.0%) |
| 35 Years and over | 0 (0.0%) | 0 (0.0%) |
| Total | 25 (89.3%) | 3 (10.7%) |
Educational Attainment by Field of Study in Oscarville
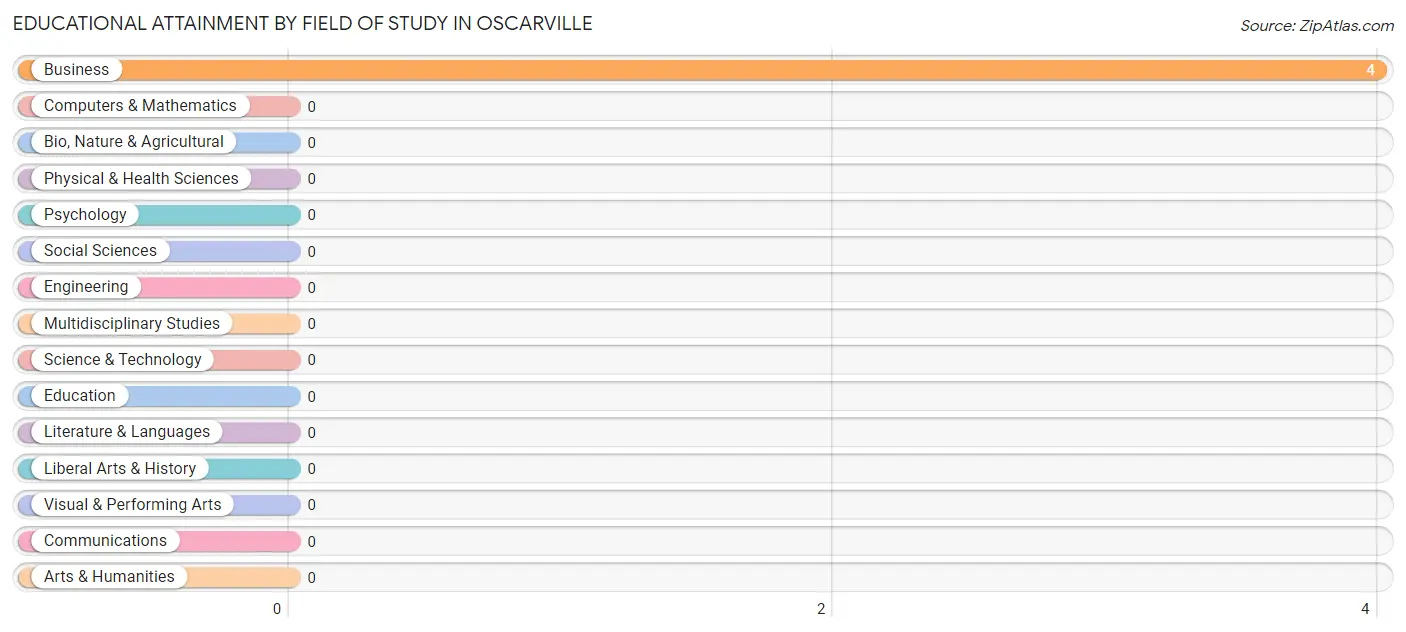
, and business (4 | 100.0%) are the most common fields of study among 4 individuals in Oscarville who have obtained a bachelor's degree or higher.
| Field of Study | # Graduates | % Graduates |
| Computers & Mathematics | 0 | 0.0% |
| Bio, Nature & Agricultural | 0 | 0.0% |
| Physical & Health Sciences | 0 | 0.0% |
| Psychology | 0 | 0.0% |
| Social Sciences | 0 | 0.0% |
| Engineering | 0 | 0.0% |
| Multidisciplinary Studies | 0 | 0.0% |
| Science & Technology | 0 | 0.0% |
| Business | 4 | 100.0% |
| Education | 0 | 0.0% |
| Literature & Languages | 0 | 0.0% |
| Liberal Arts & History | 0 | 0.0% |
| Visual & Performing Arts | 0 | 0.0% |
| Communications | 0 | 0.0% |
| Arts & Humanities | 0 | 0.0% |
| Total | 4 | 100.0% |
Transportation & Commute in Oscarville
Vehicle Availability by Sex in Oscarville
The most prevalent vehicle ownership categories in Oscarville are males with no vehicle (11, accounting for 78.6%) and females with no vehicle (5, making up 137.5%).
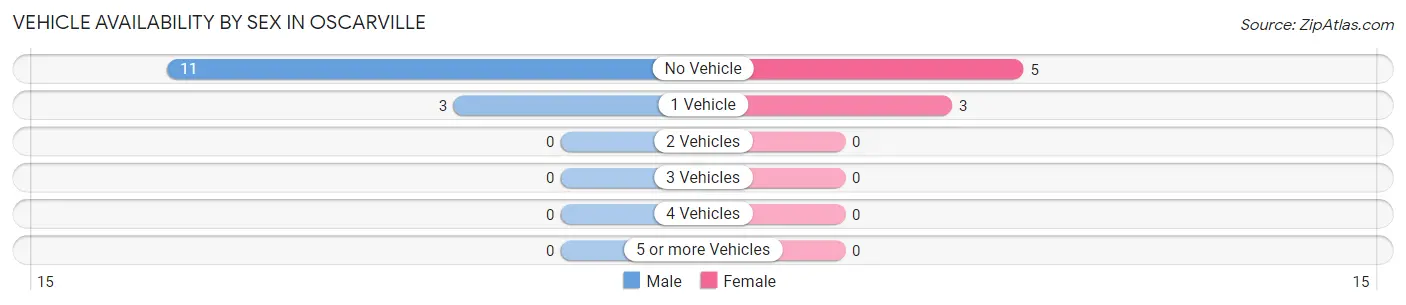
| Vehicles Available | Male | Female |
| No Vehicle | 11 (78.6%) | 5 (62.5%) |
| 1 Vehicle | 3 (21.4%) | 3 (37.5%) |
| 2 Vehicles | 0 (0.0%) | 0 (0.0%) |
| 3 Vehicles | 0 (0.0%) | 0 (0.0%) |
| 4 Vehicles | 0 (0.0%) | 0 (0.0%) |
| 5 or more Vehicles | 0 (0.0%) | 0 (0.0%) |
| Total | 14 (100.0%) | 8 (100.0%) |
Commute Time in Oscarville
The most frequently occuring commute durations in Oscarville are less than 5 minutes (13 commuters, 61.9%), 5 to 9 minutes (6 commuters, 28.6%), and 25 to 29 minutes (1 commuters, 4.8%).
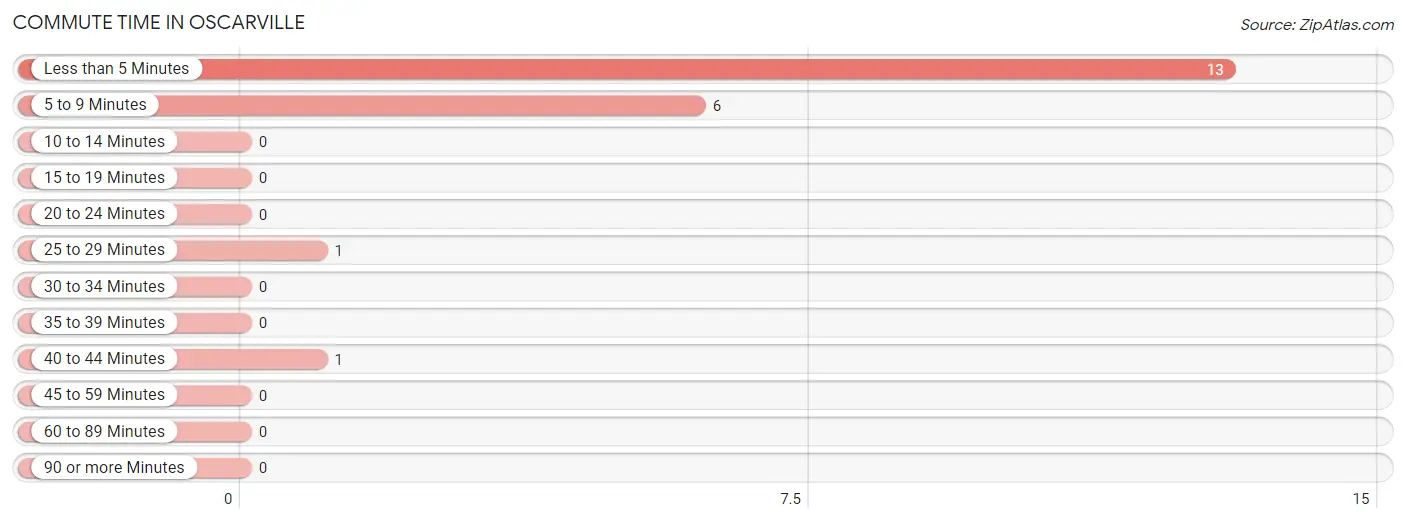
| Commute Time | # Commuters | % Commuters |
| Less than 5 Minutes | 13 | 61.9% |
| 5 to 9 Minutes | 6 | 28.6% |
| 10 to 14 Minutes | 0 | 0.0% |
| 15 to 19 Minutes | 0 | 0.0% |
| 20 to 24 Minutes | 0 | 0.0% |
| 25 to 29 Minutes | 1 | 4.8% |
| 30 to 34 Minutes | 0 | 0.0% |
| 35 to 39 Minutes | 0 | 0.0% |
| 40 to 44 Minutes | 1 | 4.8% |
| 45 to 59 Minutes | 0 | 0.0% |
| 60 to 89 Minutes | 0 | 0.0% |
| 90 or more Minutes | 0 | 0.0% |
Commute Time by Sex in Oscarville
The most common commute times in Oscarville are less than 5 minutes (6 commuters, 46.2%) for males and less than 5 minutes (7 commuters, 87.5%) for females.
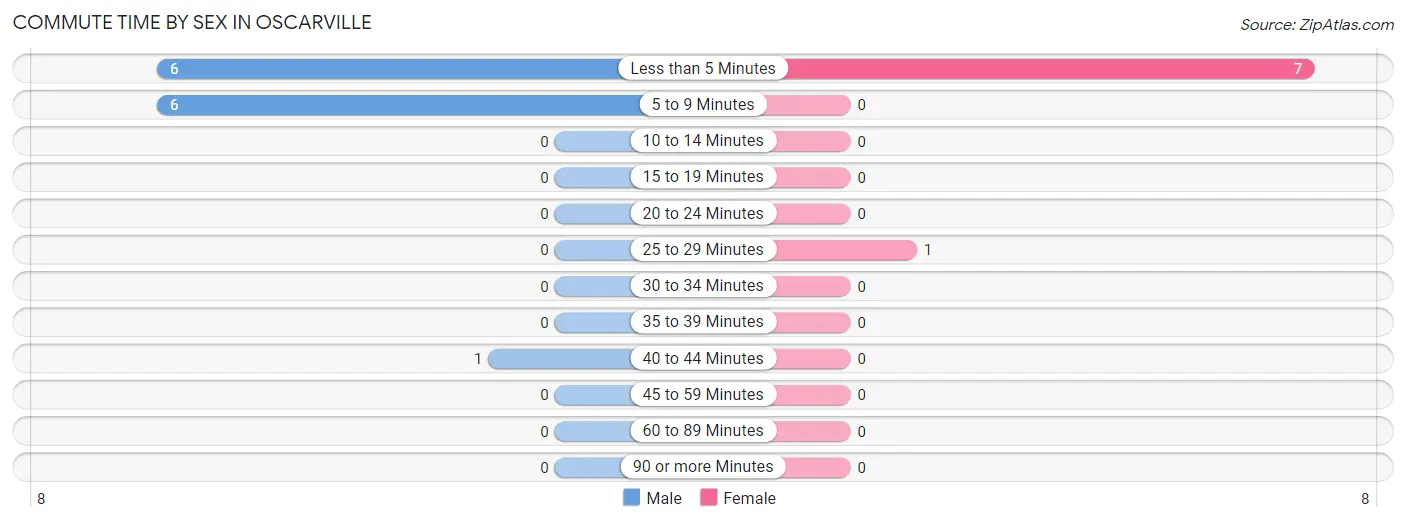
| Commute Time | Male | Female |
| Less than 5 Minutes | 6 (46.2%) | 7 (87.5%) |
| 5 to 9 Minutes | 6 (46.2%) | 0 (0.0%) |
| 10 to 14 Minutes | 0 (0.0%) | 0 (0.0%) |
| 15 to 19 Minutes | 0 (0.0%) | 0 (0.0%) |
| 20 to 24 Minutes | 0 (0.0%) | 0 (0.0%) |
| 25 to 29 Minutes | 0 (0.0%) | 1 (12.5%) |
| 30 to 34 Minutes | 0 (0.0%) | 0 (0.0%) |
| 35 to 39 Minutes | 0 (0.0%) | 0 (0.0%) |
| 40 to 44 Minutes | 1 (7.7%) | 0 (0.0%) |
| 45 to 59 Minutes | 0 (0.0%) | 0 (0.0%) |
| 60 to 89 Minutes | 0 (0.0%) | 0 (0.0%) |
| 90 or more Minutes | 0 (0.0%) | 0 (0.0%) |
Time of Departure to Work by Sex in Oscarville
The most frequent times of departure to work in Oscarville are 7:30 AM to 7:59 AM (6, 46.2%) for males and 8:00 AM to 8:29 AM (4, 50.0%) for females.
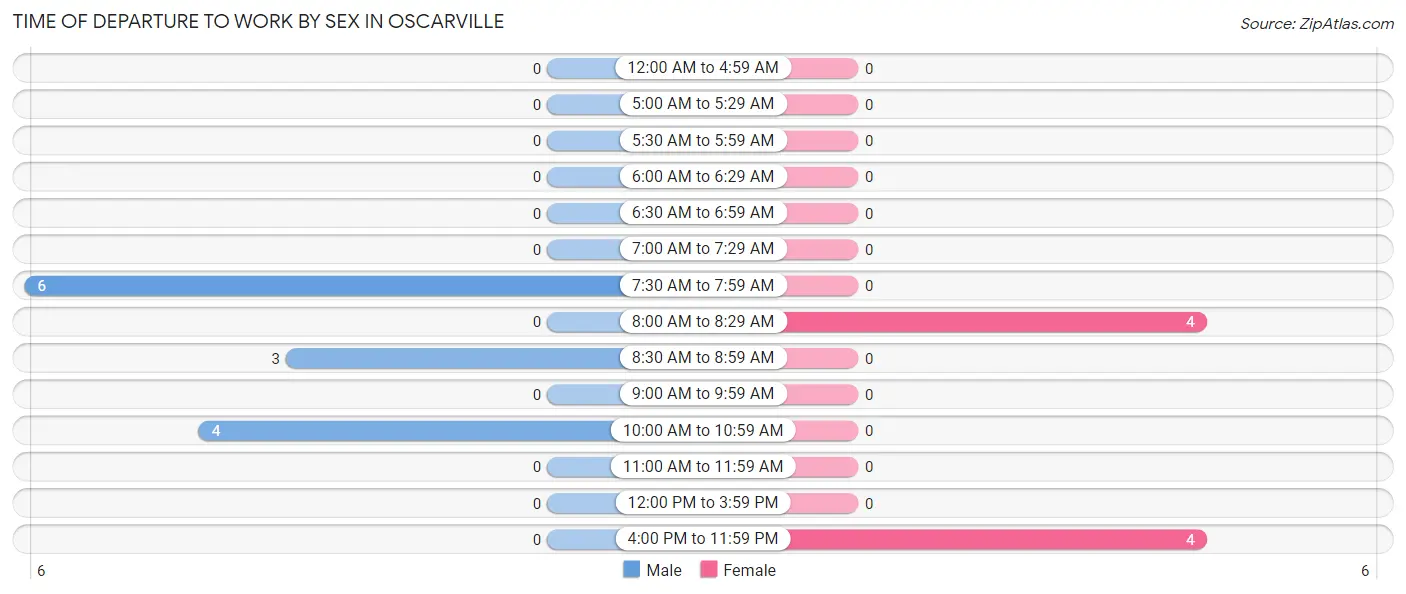
| Time of Departure | Male | Female |
| 12:00 AM to 4:59 AM | 0 (0.0%) | 0 (0.0%) |
| 5:00 AM to 5:29 AM | 0 (0.0%) | 0 (0.0%) |
| 5:30 AM to 5:59 AM | 0 (0.0%) | 0 (0.0%) |
| 6:00 AM to 6:29 AM | 0 (0.0%) | 0 (0.0%) |
| 6:30 AM to 6:59 AM | 0 (0.0%) | 0 (0.0%) |
| 7:00 AM to 7:29 AM | 0 (0.0%) | 0 (0.0%) |
| 7:30 AM to 7:59 AM | 6 (46.2%) | 0 (0.0%) |
| 8:00 AM to 8:29 AM | 0 (0.0%) | 4 (50.0%) |
| 8:30 AM to 8:59 AM | 3 (23.1%) | 0 (0.0%) |
| 9:00 AM to 9:59 AM | 0 (0.0%) | 0 (0.0%) |
| 10:00 AM to 10:59 AM | 4 (30.8%) | 0 (0.0%) |
| 11:00 AM to 11:59 AM | 0 (0.0%) | 0 (0.0%) |
| 12:00 PM to 3:59 PM | 0 (0.0%) | 0 (0.0%) |
| 4:00 PM to 11:59 PM | 0 (0.0%) | 4 (50.0%) |
| Total | 13 (100.0%) | 8 (100.0%) |
Housing Occupancy in Oscarville
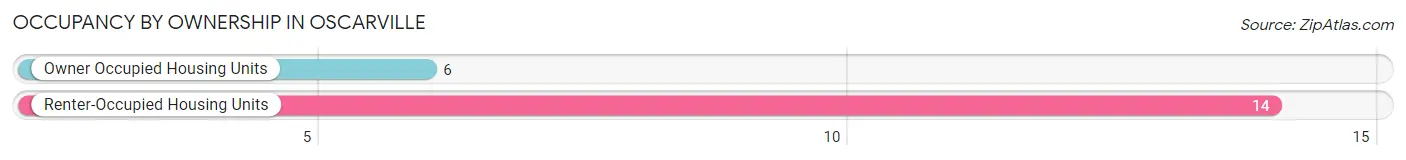
Occupancy by Ownership in Oscarville
Of the total 20 dwellings in Oscarville, owner-occupied units account for 6 (30.0%), while renter-occupied units make up 14 (70.0%).
| Occupancy | # Housing Units | % Housing Units |
| Owner Occupied Housing Units | 6 | 30.0% |
| Renter-Occupied Housing Units | 14 | 70.0% |
| Total Occupied Housing Units | 20 | 100.0% |
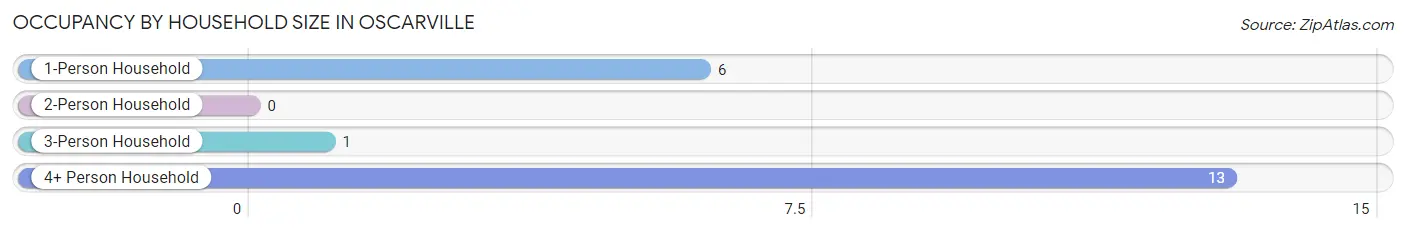
Occupancy by Household Size in Oscarville
| Household Size | # Housing Units | % Housing Units |
| 1-Person Household | 6 | 30.0% |
| 2-Person Household | 0 | 0.0% |
| 3-Person Household | 1 | 5.0% |
| 4+ Person Household | 13 | 65.0% |
| Total Housing Units | 20 | 100.0% |
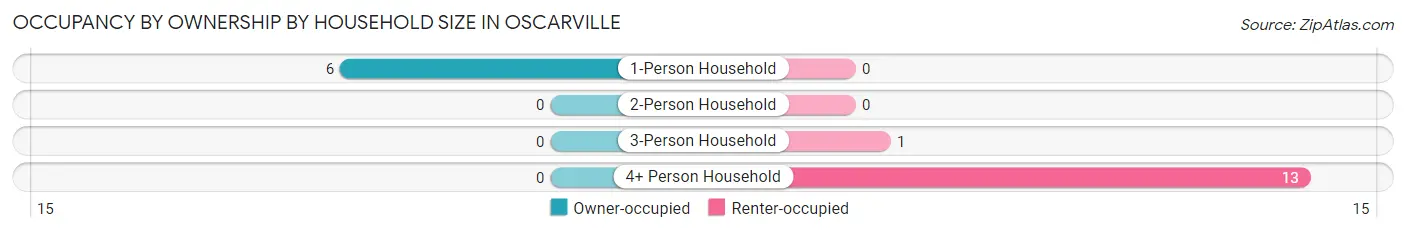
Occupancy by Ownership by Household Size in Oscarville
| Household Size | Owner-occupied | Renter-occupied |
| 1-Person Household | 6 (100.0%) | 0 (0.0%) |
| 2-Person Household | 0 (0.0%) | 0 (0.0%) |
| 3-Person Household | 0 (0.0%) | 1 (100.0%) |
| 4+ Person Household | 0 (0.0%) | 13 (100.0%) |
| Total Housing Units | 6 (30.0%) | 14 (70.0%) |
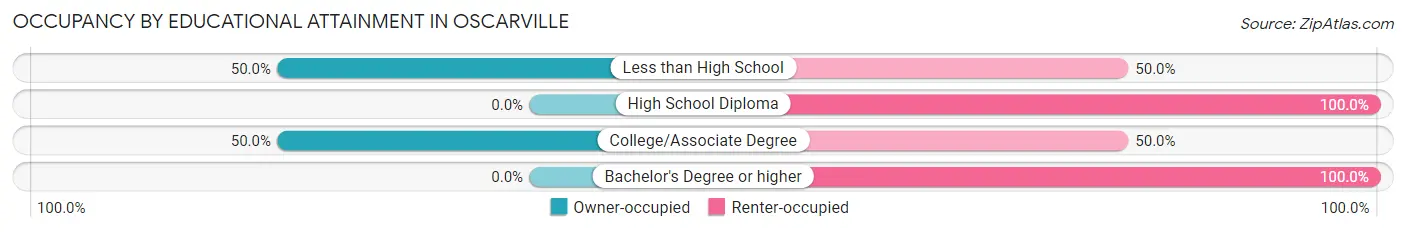
Occupancy by Educational Attainment in Oscarville
| Household Size | Owner-occupied | Renter-occupied |
| Less than High School | 3 (50.0%) | 3 (50.0%) |
| High School Diploma | 0 (0.0%) | 4 (100.0%) |
| College/Associate Degree | 3 (50.0%) | 3 (50.0%) |
| Bachelor's Degree or higher | 0 (0.0%) | 4 (100.0%) |
Occupancy by Age of Householder in Oscarville
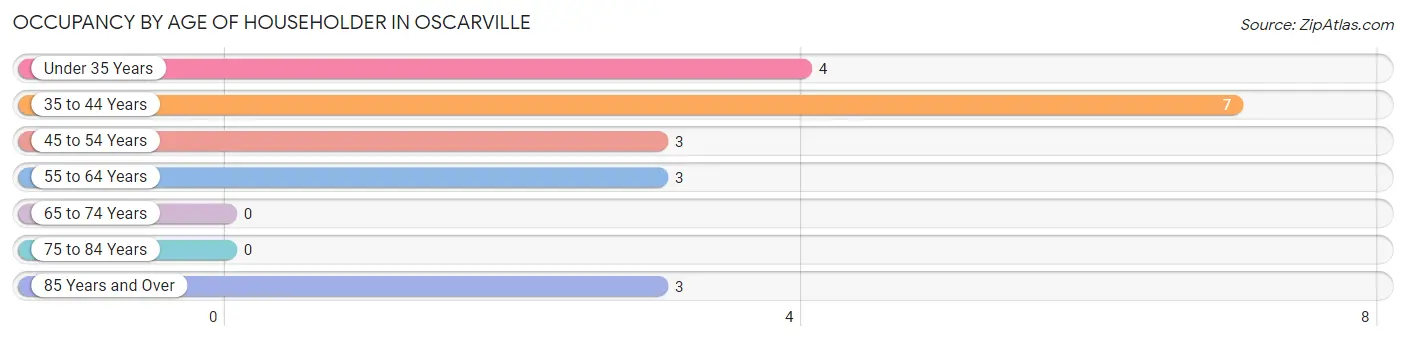
| Age Bracket | # Households | % Households |
| Under 35 Years | 4 | 20.0% |
| 35 to 44 Years | 7 | 35.0% |
| 45 to 54 Years | 3 | 15.0% |
| 55 to 64 Years | 3 | 15.0% |
| 65 to 74 Years | 0 | 0.0% |
| 75 to 84 Years | 0 | 0.0% |
| 85 Years and Over | 3 | 15.0% |
| Total | 20 | 100.0% |
Housing Finances in Oscarville
Median Income by Occupancy in Oscarville
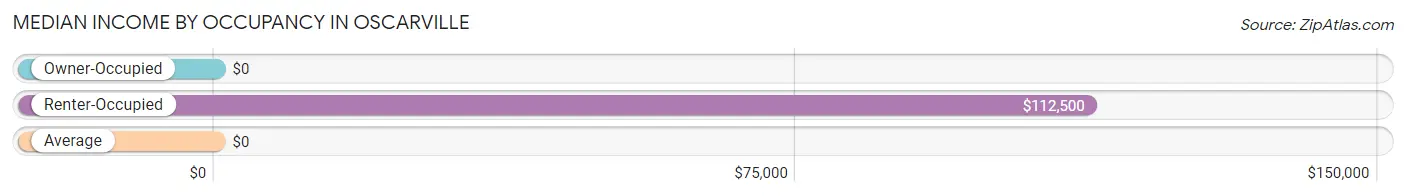
| Occupancy Type | # Households | Median Income |
| Owner-Occupied | 6 (30.0%) | $0 |
| Renter-Occupied | 14 (70.0%) | $112,500 |
| Average | 20 (100.0%) | $0 |
Occupancy by Householder Income Bracket in Oscarville
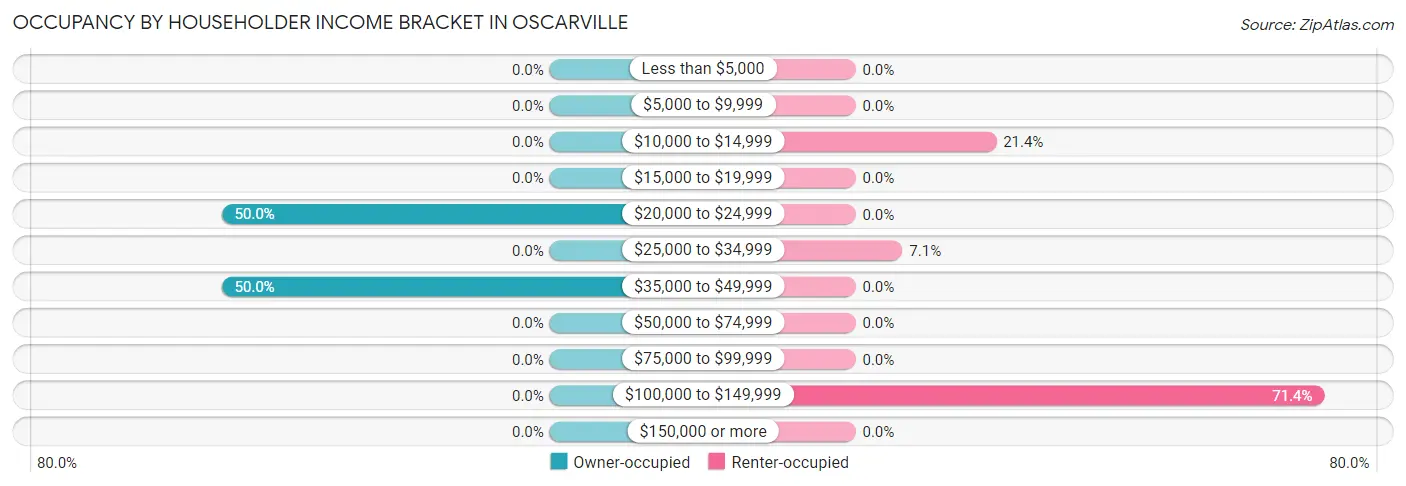
| Income Bracket | Owner-occupied | Renter-occupied |
| Less than $5,000 | 0 (0.0%) | 0 (0.0%) |
| $5,000 to $9,999 | 0 (0.0%) | 0 (0.0%) |
| $10,000 to $14,999 | 0 (0.0%) | 3 (21.4%) |
| $15,000 to $19,999 | 0 (0.0%) | 0 (0.0%) |
| $20,000 to $24,999 | 3 (50.0%) | 0 (0.0%) |
| $25,000 to $34,999 | 0 (0.0%) | 1 (7.1%) |
| $35,000 to $49,999 | 3 (50.0%) | 0 (0.0%) |
| $50,000 to $74,999 | 0 (0.0%) | 0 (0.0%) |
| $75,000 to $99,999 | 0 (0.0%) | 0 (0.0%) |
| $100,000 to $149,999 | 0 (0.0%) | 10 (71.4%) |
| $150,000 or more | 0 (0.0%) | 0 (0.0%) |
| Total | 6 (100.0%) | 14 (100.0%) |
Monthly Housing Cost Tiers in Oscarville
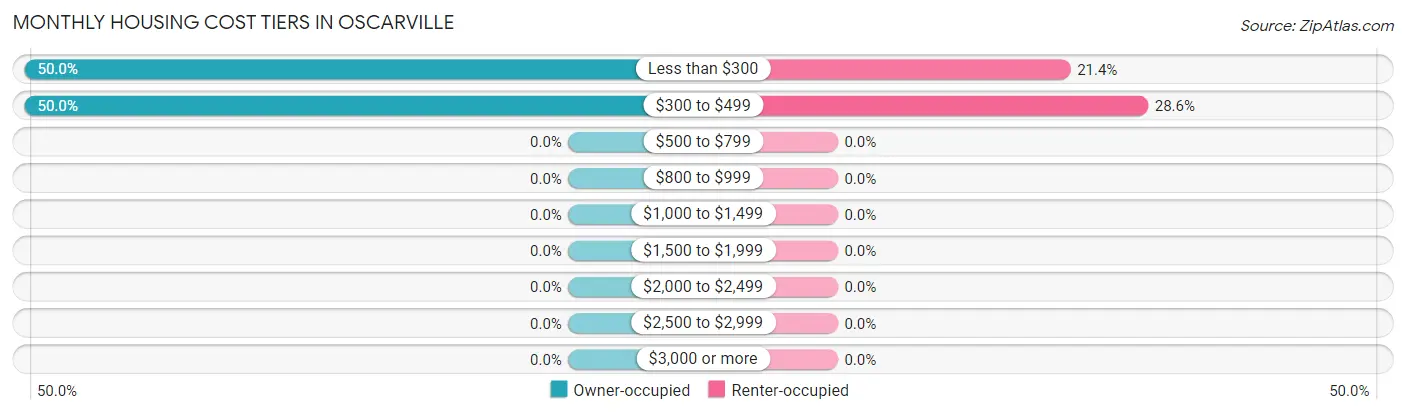
| Monthly Cost | Owner-occupied | Renter-occupied |
| Less than $300 | 3 (50.0%) | 3 (21.4%) |
| $300 to $499 | 3 (50.0%) | 4 (28.6%) |
| $500 to $799 | 0 (0.0%) | 0 (0.0%) |
| $800 to $999 | 0 (0.0%) | 0 (0.0%) |
| $1,000 to $1,499 | 0 (0.0%) | 0 (0.0%) |
| $1,500 to $1,999 | 0 (0.0%) | 0 (0.0%) |
| $2,000 to $2,499 | 0 (0.0%) | 0 (0.0%) |
| $2,500 to $2,999 | 0 (0.0%) | 0 (0.0%) |
| $3,000 or more | 0 (0.0%) | 0 (0.0%) |
| Total | 6 (100.0%) | 14 (100.0%) |
Physical Housing Characteristics in Oscarville
Housing Structures in Oscarville
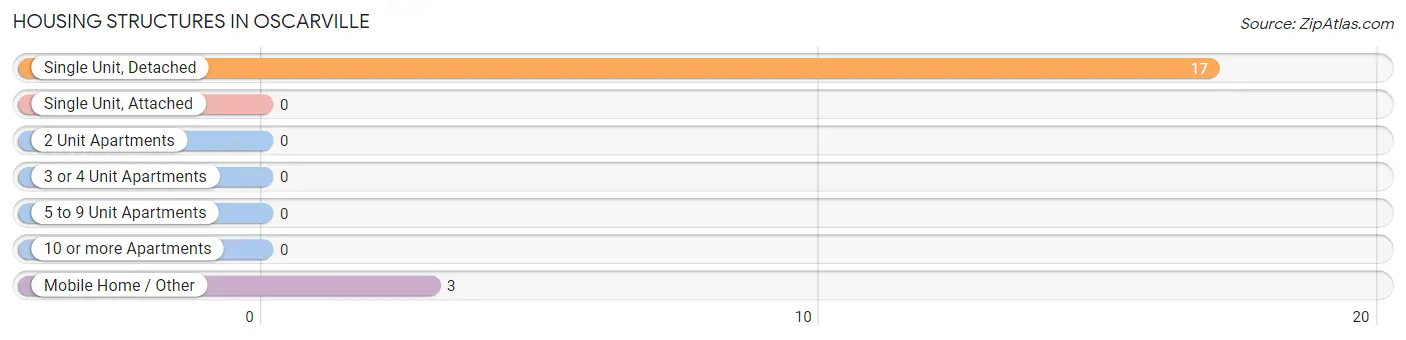
| Structure Type | # Housing Units | % Housing Units |
| Single Unit, Detached | 17 | 85.0% |
| Single Unit, Attached | 0 | 0.0% |
| 2 Unit Apartments | 0 | 0.0% |
| 3 or 4 Unit Apartments | 0 | 0.0% |
| 5 to 9 Unit Apartments | 0 | 0.0% |
| 10 or more Apartments | 0 | 0.0% |
| Mobile Home / Other | 3 | 15.0% |
| Total | 20 | 100.0% |
Housing Structures by Occupancy in Oscarville
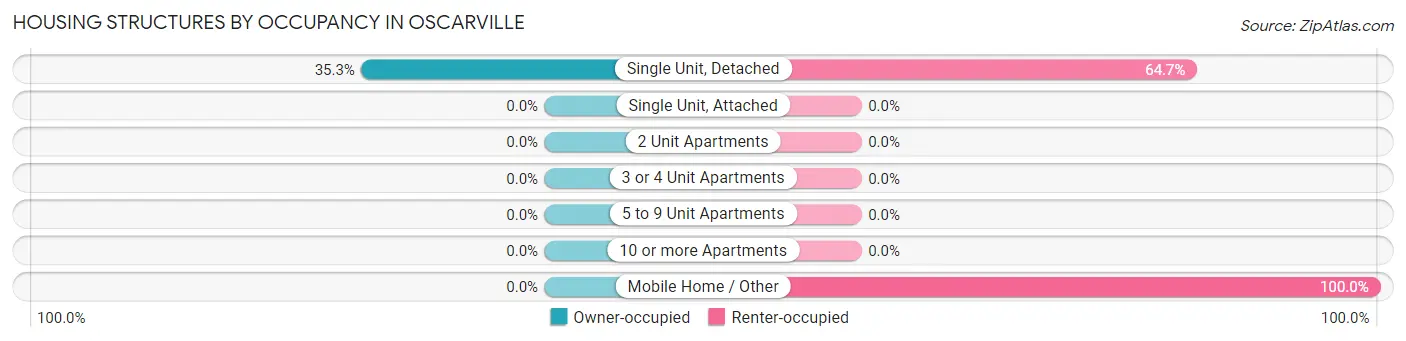
| Structure Type | Owner-occupied | Renter-occupied |
| Single Unit, Detached | 6 (35.3%) | 11 (64.7%) |
| Single Unit, Attached | 0 (0.0%) | 0 (0.0%) |
| 2 Unit Apartments | 0 (0.0%) | 0 (0.0%) |
| 3 or 4 Unit Apartments | 0 (0.0%) | 0 (0.0%) |
| 5 to 9 Unit Apartments | 0 (0.0%) | 0 (0.0%) |
| 10 or more Apartments | 0 (0.0%) | 0 (0.0%) |
| Mobile Home / Other | 0 (0.0%) | 3 (100.0%) |
| Total | 6 (30.0%) | 14 (70.0%) |
Housing Structures by Number of Rooms in Oscarville
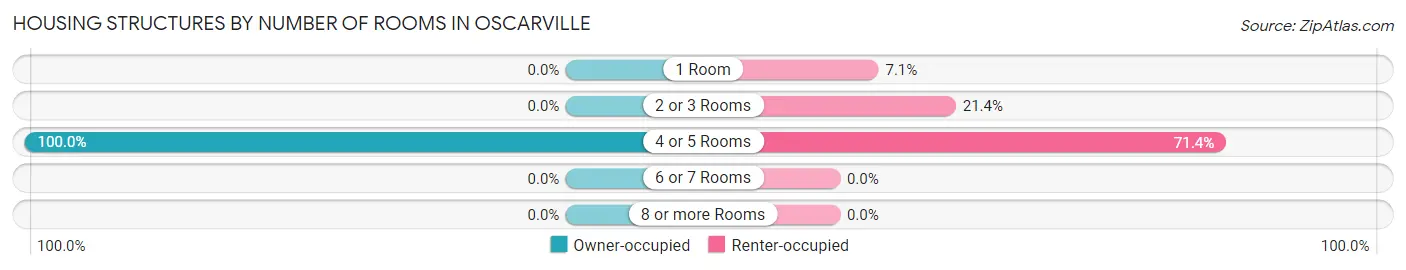
| Number of Rooms | Owner-occupied | Renter-occupied |
| 1 Room | 0 (0.0%) | 1 (7.1%) |
| 2 or 3 Rooms | 0 (0.0%) | 3 (21.4%) |
| 4 or 5 Rooms | 6 (100.0%) | 10 (71.4%) |
| 6 or 7 Rooms | 0 (0.0%) | 0 (0.0%) |
| 8 or more Rooms | 0 (0.0%) | 0 (0.0%) |
| Total | 6 (100.0%) | 14 (100.0%) |
Housing Structure by Heating Type in Oscarville
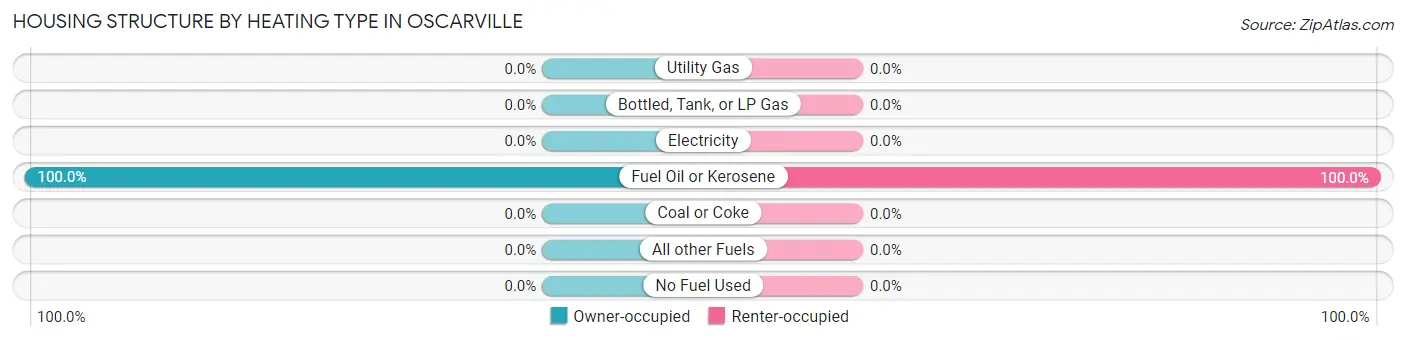
| Heating Type | Owner-occupied | Renter-occupied |
| Utility Gas | 0 (0.0%) | 0 (0.0%) |
| Bottled, Tank, or LP Gas | 0 (0.0%) | 0 (0.0%) |
| Electricity | 0 (0.0%) | 0 (0.0%) |
| Fuel Oil or Kerosene | 6 (100.0%) | 14 (100.0%) |
| Coal or Coke | 0 (0.0%) | 0 (0.0%) |
| All other Fuels | 0 (0.0%) | 0 (0.0%) |
| No Fuel Used | 0 (0.0%) | 0 (0.0%) |
| Total | 6 (100.0%) | 14 (100.0%) |
Household Vehicle Usage in Oscarville
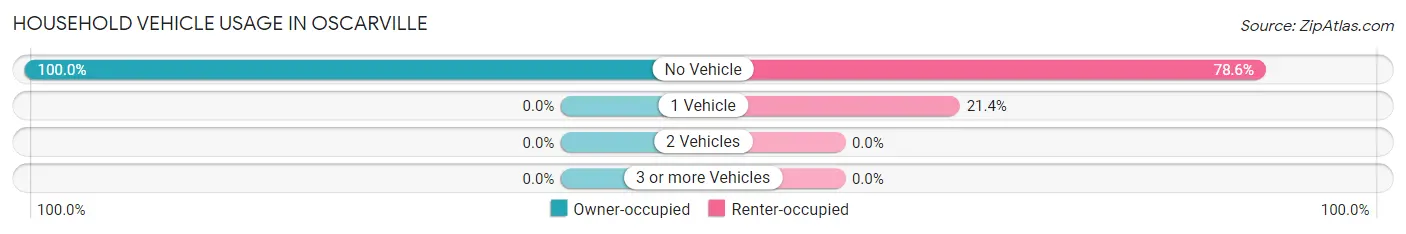
| Vehicles per Household | Owner-occupied | Renter-occupied |
| No Vehicle | 6 (100.0%) | 11 (78.6%) |
| 1 Vehicle | 0 (0.0%) | 3 (21.4%) |
| 2 Vehicles | 0 (0.0%) | 0 (0.0%) |
| 3 or more Vehicles | 0 (0.0%) | 0 (0.0%) |
| Total | 6 (100.0%) | 14 (100.0%) |
Real Estate & Mortgages in Oscarville
Real Estate and Mortgage Overview in Oscarville
| Characteristic | Without Mortgage | With Mortgage |
| Housing Units | 6 | 0 |
| Median Property Value | - | - |
| Median Household Income | - | - |
| Monthly Housing Costs | - | - |
| Real Estate Taxes | - | - |
Property Value by Mortgage Status in Oscarville
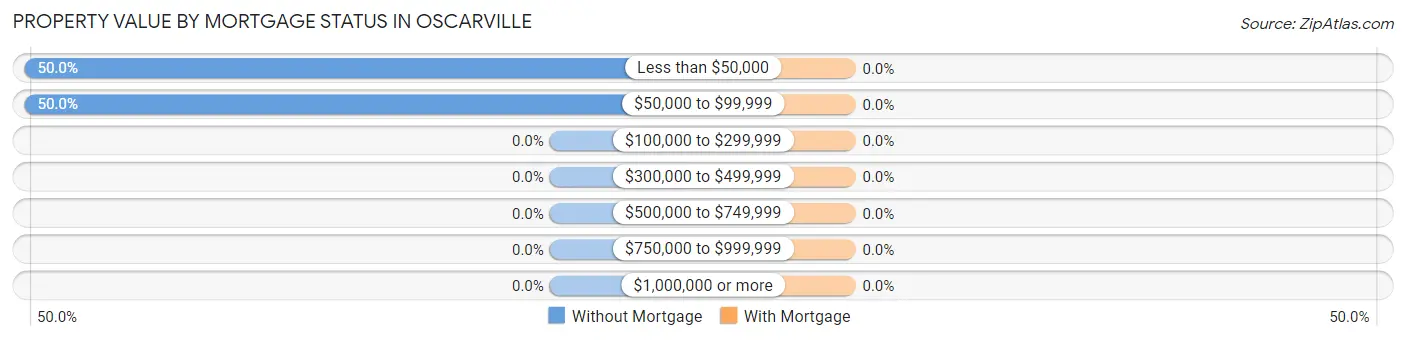
| Property Value | Without Mortgage | With Mortgage |
| Less than $50,000 | 3 (50.0%) | 0 (0.0%) |
| $50,000 to $99,999 | 3 (50.0%) | 0 (0.0%) |
| $100,000 to $299,999 | 0 (0.0%) | 0 (0.0%) |
| $300,000 to $499,999 | 0 (0.0%) | 0 (0.0%) |
| $500,000 to $749,999 | 0 (0.0%) | 0 (0.0%) |
| $750,000 to $999,999 | 0 (0.0%) | 0 (0.0%) |
| $1,000,000 or more | 0 (0.0%) | 0 (0.0%) |
| Total | 6 (100.0%) | 0 (0.0%) |
Household Income by Mortgage Status in Oscarville
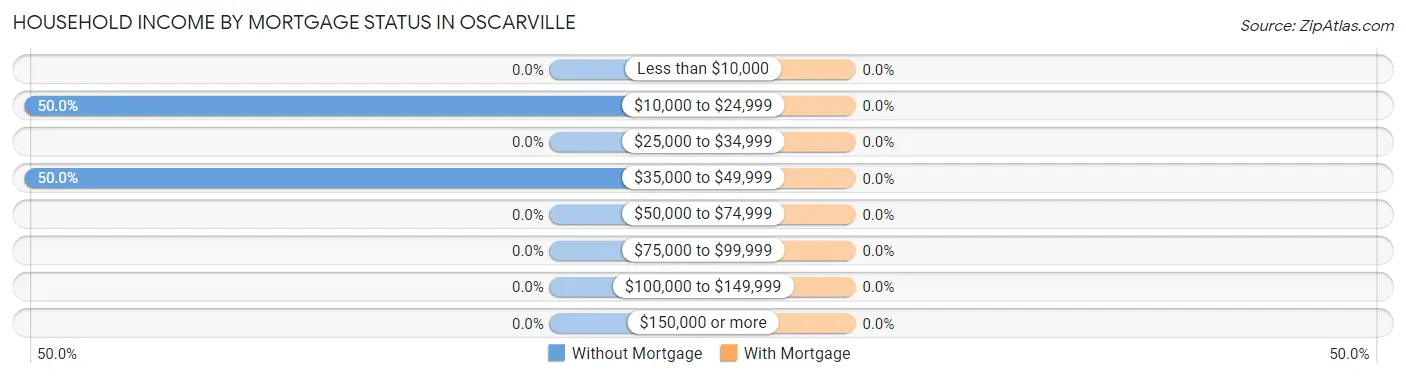
| Household Income | Without Mortgage | With Mortgage |
| Less than $10,000 | 0 (0.0%) | 0 (0.0%) |
| $10,000 to $24,999 | 3 (50.0%) | 0 (0.0%) |
| $25,000 to $34,999 | 0 (0.0%) | 0 (0.0%) |
| $35,000 to $49,999 | 3 (50.0%) | 0 (0.0%) |
| $50,000 to $74,999 | 0 (0.0%) | 0 (0.0%) |
| $75,000 to $99,999 | 0 (0.0%) | 0 (0.0%) |
| $100,000 to $149,999 | 0 (0.0%) | 0 (0.0%) |
| $150,000 or more | 0 (0.0%) | 0 (0.0%) |
| Total | 6 (100.0%) | 0 (0.0%) |
Property Value to Household Income Ratio in Oscarville
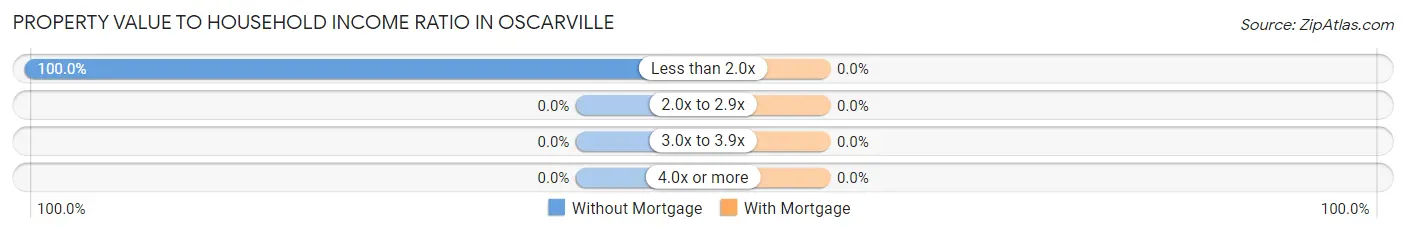
| Value-to-Income Ratio | Without Mortgage | With Mortgage |
| Less than 2.0x | 6 (100.0%) | 0 (0.0%) |
| 2.0x to 2.9x | 0 (0.0%) | 0 (0.0%) |
| 3.0x to 3.9x | 0 (0.0%) | 0 (0.0%) |
| 4.0x or more | 0 (0.0%) | 0 (0.0%) |
| Total | 6 (100.0%) | 0 (0.0%) |
Real Estate Taxes by Mortgage Status in Oscarville
| Property Taxes | Without Mortgage | With Mortgage |
| Less than $800 | 0 (0.0%) | 0 (0.0%) |
| $800 to $1,499 | 0 (0.0%) | 0 (0.0%) |
| $800 to $1,499 | 0 (0.0%) | 0 (0.0%) |
| Total | 6 (100.0%) | 0 (0.0%) |
Health & Disability in Oscarville
Health Insurance Coverage by Age in Oscarville
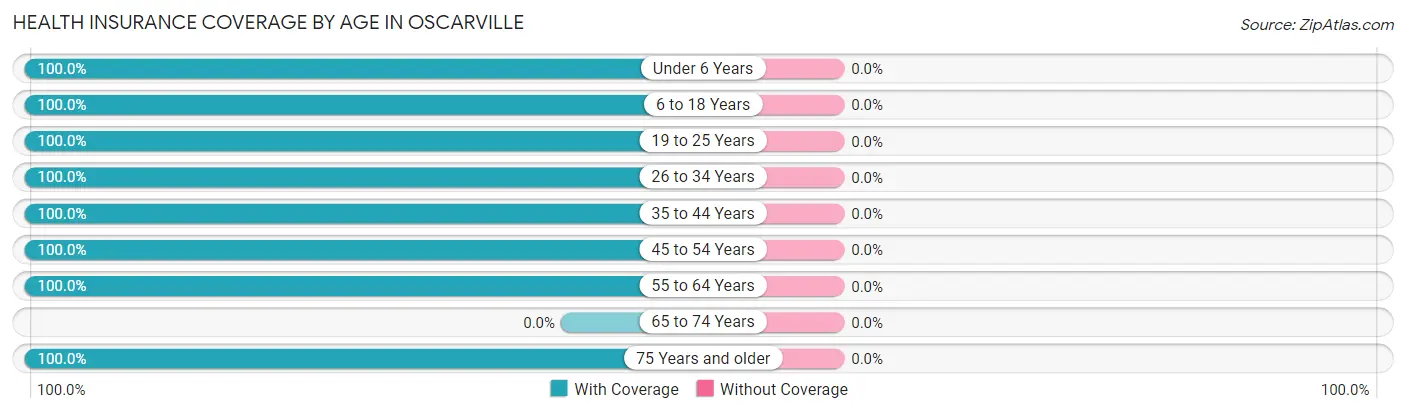
| Age Bracket | With Coverage | Without Coverage |
| Under 6 Years | 20 (100.0%) | 0 (0.0%) |
| 6 to 18 Years | 15 (100.0%) | 0 (0.0%) |
| 19 to 25 Years | 21 (100.0%) | 0 (0.0%) |
| 26 to 34 Years | 7 (100.0%) | 0 (0.0%) |
| 35 to 44 Years | 13 (100.0%) | 0 (0.0%) |
| 45 to 54 Years | 6 (100.0%) | 0 (0.0%) |
| 55 to 64 Years | 3 (100.0%) | 0 (0.0%) |
| 65 to 74 Years | 0 (0.0%) | 0 (0.0%) |
| 75 Years and older | 3 (100.0%) | 0 (0.0%) |
| Total | 88 (100.0%) | 0 (0.0%) |
Health Insurance Coverage by Citizenship Status in Oscarville

| Citizenship Status | With Coverage | Without Coverage |
| Native Born | 20 (100.0%) | 0 (0.0%) |
| Foreign Born, Citizen | 15 (100.0%) | 0 (0.0%) |
| Foreign Born, not a Citizen | 21 (100.0%) | 0 (0.0%) |
Health Insurance Coverage by Household Income in Oscarville
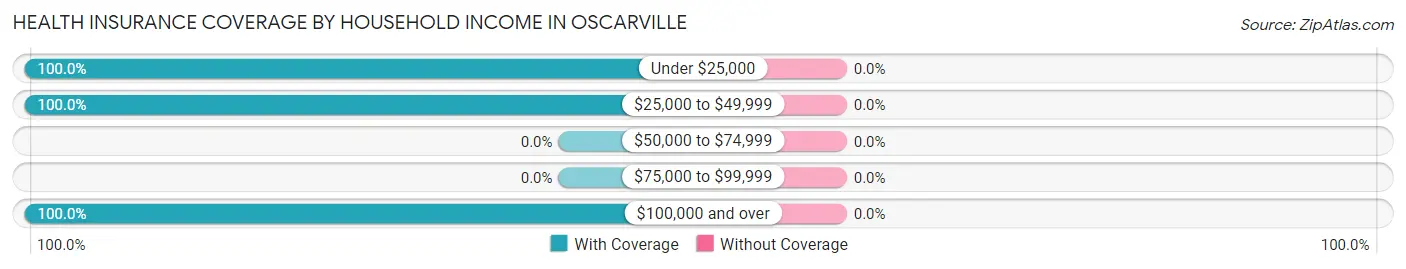
| Household Income | With Coverage | Without Coverage |
| Under $25,000 | 15 (100.0%) | 0 (0.0%) |
| $25,000 to $49,999 | 8 (100.0%) | 0 (0.0%) |
| $50,000 to $74,999 | 0 (0.0%) | 0 (0.0%) |
| $75,000 to $99,999 | 0 (0.0%) | 0 (0.0%) |
| $100,000 and over | 65 (100.0%) | 0 (0.0%) |
Public vs Private Health Insurance Coverage by Age in Oscarville
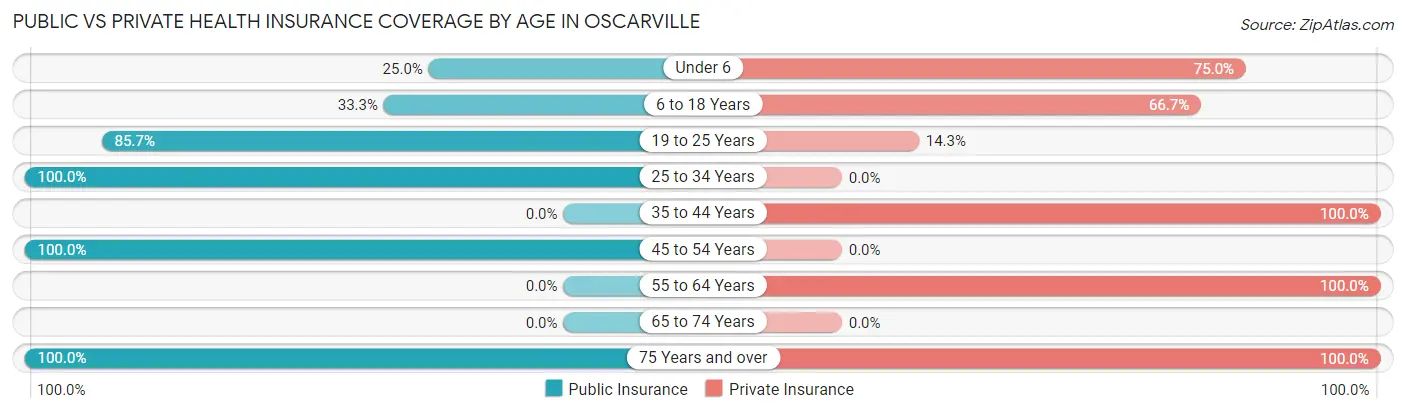
| Age Bracket | Public Insurance | Private Insurance |
| Under 6 | 5 (25.0%) | 15 (75.0%) |
| 6 to 18 Years | 5 (33.3%) | 10 (66.7%) |
| 19 to 25 Years | 18 (85.7%) | 3 (14.3%) |
| 25 to 34 Years | 7 (100.0%) | 0 (0.0%) |
| 35 to 44 Years | 0 (0.0%) | 13 (100.0%) |
| 45 to 54 Years | 6 (100.0%) | 0 (0.0%) |
| 55 to 64 Years | 0 (0.0%) | 3 (100.0%) |
| 65 to 74 Years | 0 (0.0%) | 0 (0.0%) |
| 75 Years and over | 3 (100.0%) | 3 (100.0%) |
| Total | 44 (50.0%) | 47 (53.4%) |
Disability Status by Sex by Age in Oscarville
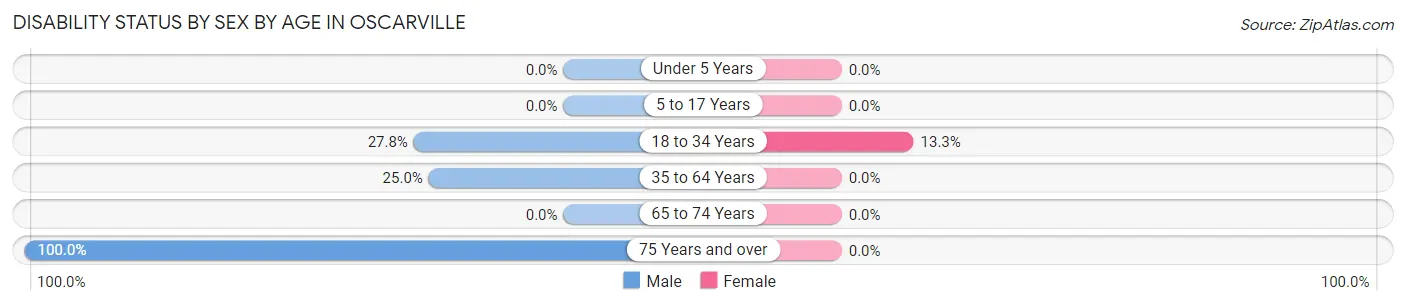
| Age Bracket | Male | Female |
| Under 5 Years | 0 (0.0%) | 0 (0.0%) |
| 5 to 17 Years | 0 (0.0%) | 0 (0.0%) |
| 18 to 34 Years | 5 (27.8%) | 2 (13.3%) |
| 35 to 64 Years | 3 (25.0%) | 0 (0.0%) |
| 65 to 74 Years | 0 (0.0%) | 0 (0.0%) |
| 75 Years and over | 3 (100.0%) | 0 (0.0%) |
Disability Class by Sex by Age in Oscarville
Disability Class: Hearing Difficulty
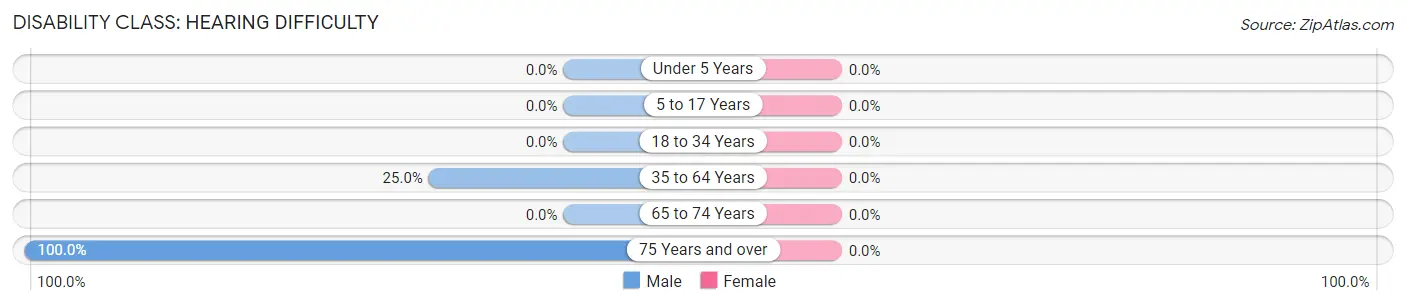
| Age Bracket | Male | Female |
| Under 5 Years | 0 (0.0%) | 0 (0.0%) |
| 5 to 17 Years | 0 (0.0%) | 0 (0.0%) |
| 18 to 34 Years | 0 (0.0%) | 0 (0.0%) |
| 35 to 64 Years | 3 (25.0%) | 0 (0.0%) |
| 65 to 74 Years | 0 (0.0%) | 0 (0.0%) |
| 75 Years and over | 3 (100.0%) | 0 (0.0%) |
Disability Class: Vision Difficulty
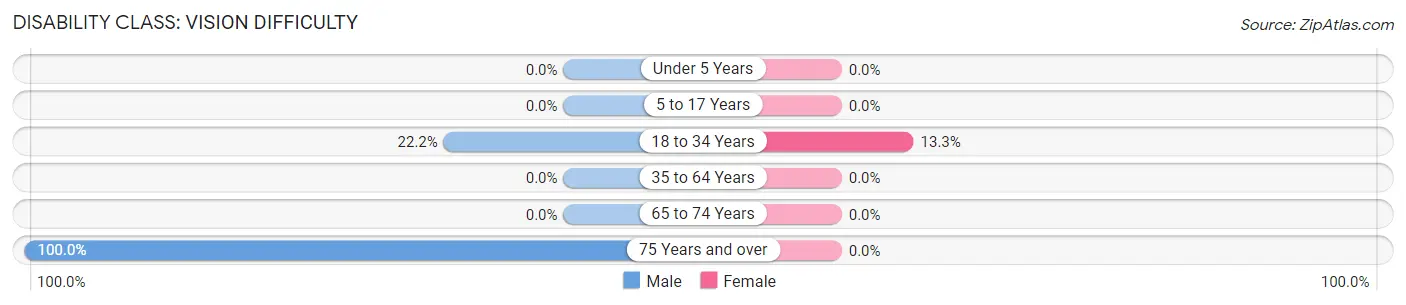
| Age Bracket | Male | Female |
| Under 5 Years | 0 (0.0%) | 0 (0.0%) |
| 5 to 17 Years | 0 (0.0%) | 0 (0.0%) |
| 18 to 34 Years | 4 (22.2%) | 2 (13.3%) |
| 35 to 64 Years | 0 (0.0%) | 0 (0.0%) |
| 65 to 74 Years | 0 (0.0%) | 0 (0.0%) |
| 75 Years and over | 3 (100.0%) | 0 (0.0%) |
Disability Class: Cognitive Difficulty

| Age Bracket | Male | Female |
| 5 to 17 Years | 0 (0.0%) | 0 (0.0%) |
| 18 to 34 Years | 1 (5.6%) | 0 (0.0%) |
| 35 to 64 Years | 0 (0.0%) | 0 (0.0%) |
| 65 to 74 Years | 0 (0.0%) | 0 (0.0%) |
| 75 Years and over | 3 (100.0%) | 0 (0.0%) |
Disability Class: Ambulatory Difficulty

| Age Bracket | Male | Female |
| 5 to 17 Years | 0 (0.0%) | 0 (0.0%) |
| 18 to 34 Years | 0 (0.0%) | 0 (0.0%) |
| 35 to 64 Years | 0 (0.0%) | 0 (0.0%) |
| 65 to 74 Years | 0 (0.0%) | 0 (0.0%) |
| 75 Years and over | 3 (100.0%) | 0 (0.0%) |
Disability Class: Self-Care Difficulty

| Age Bracket | Male | Female |
| 5 to 17 Years | 0 (0.0%) | 0 (0.0%) |
| 18 to 34 Years | 0 (0.0%) | 0 (0.0%) |
| 35 to 64 Years | 0 (0.0%) | 0 (0.0%) |
| 65 to 74 Years | 0 (0.0%) | 0 (0.0%) |
| 75 Years and over | 3 (100.0%) | 0 (0.0%) |
Technology Access in Oscarville
Computing Device Access in Oscarville
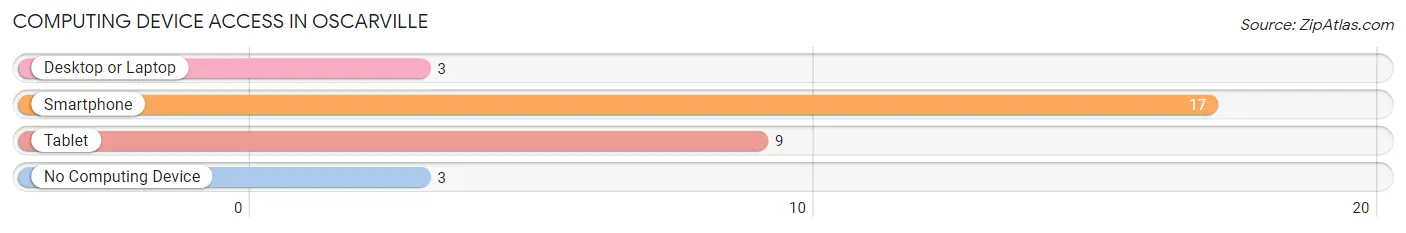
| Device Type | # Households | % Households |
| Desktop or Laptop | 3 | 15.0% |
| Smartphone | 17 | 85.0% |
| Tablet | 9 | 45.0% |
| No Computing Device | 3 | 15.0% |
| Total | 20 | 100.0% |
Internet Access in Oscarville
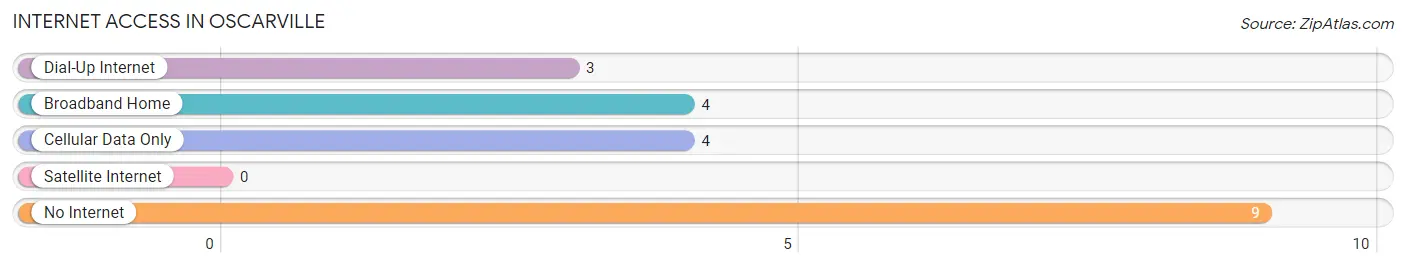
| Internet Type | # Households | % Households |
| Dial-Up Internet | 3 | 15.0% |
| Broadband Home | 4 | 20.0% |
| Cellular Data Only | 4 | 20.0% |
| Satellite Internet | 0 | 0.0% |
| No Internet | 9 | 45.0% |
| Total | 20 | 100.0% |
Oscarville Summary
Oscarville is a small unincorporated community located in the Bethel Census Area of Alaska. It is situated on the north bank of the Kuskokwim River, approximately 25 miles east of Bethel. The population of Oscarville was estimated to be around 200 people in 2020.
History
Oscarville was originally established in the late 1800s as a trading post for the Yup'ik people of the area. The trading post was named after Oscar K. Johnson, a Swedish-American trader who had settled in the area. In the early 1900s, the trading post was replaced by a general store and post office. The post office was closed in the 1950s, but the store remained open until the early 2000s.
In the late 1950s, the Alaska Native Claims Settlement Act (ANCSA) was passed, which allowed for the formation of Native Corporations in Alaska. The Kuskokwim Corporation was formed in the Bethel area, and Oscarville was included in its boundaries. The Kuskokwim Corporation has since been involved in various economic development projects in the area, including the construction of a fish processing plant in Oscarville.
Geography
Oscarville is located in the Bethel Census Area of Alaska, on the north bank of the Kuskokwim River. The community is situated approximately 25 miles east of Bethel, and is accessible by air and boat. The terrain in the area is mostly flat, with some rolling hills. The climate is subarctic, with cold winters and mild summers.
Economy
The economy of Oscarville is largely based on subsistence activities, such as fishing, hunting, and gathering. The Kuskokwim Corporation has been involved in various economic development projects in the area, including the construction of a fish processing plant in Oscarville. The plant processes salmon, whitefish, and other fish species for local consumption and export.
The Kuskokwim Corporation also operates a store in Oscarville, which sells groceries, fuel, and other supplies. The store is the only retail outlet in the community.
Demographics
The population of Oscarville was estimated to be around 200 people in 2020. The majority of the population is Alaska Native, primarily Yup'ik. The median age of the population is 25 years old, and the median household income is $25,000. The unemployment rate is high, at around 20%.
Conclusion
Oscarville is a small unincorporated community located in the Bethel Census Area of Alaska. It was originally established in the late 1800s as a trading post for the Yup'ik people of the area. The economy of Oscarville is largely based on subsistence activities, such as fishing, hunting, and gathering. The population of Oscarville was estimated to be around 200 people in 2020, and the majority of the population is Alaska Native, primarily Yup'ik. The Kuskokwim Corporation has been involved in various economic development projects in the area, including the construction of a fish processing plant in Oscarville.
Common Questions
What is Per Capita Income in Oscarville?
Per Capita income in Oscarville is $16,528.
What is the Median Family Income in Oscarville?
Median Family Income in Oscarville is $111,250.
What is Inequality or Gini Index in Oscarville?
Inequality or Gini Index in Oscarville is 0.37.
What is the Total Population of Oscarville?
Total Population of Oscarville is 88.
What is the Total Male Population of Oscarville?
Total Male Population of Oscarville is 43.
What is the Total Female Population of Oscarville?
Total Female Population of Oscarville is 45.
What is the Ratio of Males per 100 Females in Oscarville?
There are 95.56 Males per 100 Females in Oscarville.
What is the Ratio of Females per 100 Males in Oscarville?
There are 104.65 Females per 100 Males in Oscarville.
What is the Median Population Age in Oscarville?
Median Population Age in Oscarville is 20.5 Years.
What is the Average Family Size in Oscarville
Average Family Size in Oscarville is 5.3 People.
What is the Average Household Size in Oscarville
Average Household Size in Oscarville is 4.4 People.
How Large is the Labor Force in Oscarville?
There are 34 People in the Labor Forcein in Oscarville.
What is the Percentage of People in the Labor Force in Oscarville?
58.6% of People are in the Labor Force in Oscarville.
What is the Unemployment Rate in Oscarville?
Unemployment Rate in Oscarville is 35.3%.