St Mary s, AK Map & Demographics
St Mary s Map
St Mary s Overview
$16,421
PER CAPITA INCOME
$43,077
AVG FAMILY INCOME
$43,750
AVG HOUSEHOLD INCOME
9.5%
WAGE / INCOME GAP [ % ]
90.5¢/ $1
WAGE / INCOME GAP [ $ ]
0.44
INEQUALITY / GINI INDEX
992
TOTAL POPULATION
502
MALE POPULATION
490
FEMALE POPULATION
102.45
MALES / 100 FEMALES
97.61
FEMALES / 100 MALES
24.6
MEDIAN AGE
4.1
AVG FAMILY SIZE
3.8
AVG HOUSEHOLD SIZE
425
LABOR FORCE [ PEOPLE ]
64.4%
PERCENT IN LABOR FORCE
22.0%
UNEMPLOYMENT RATE
Income in St Mary s
Income Overview in St Mary s
Per Capita Income in St Mary s is $16,421, while median incomes of families and households are $43,077 and $43,750 respectively.
| Characteristic | Number | Measure |
| Per Capita Income | 992 | $16,421 |
| Median Family Income | 206 | $43,077 |
| Mean Family Income | 206 | $66,230 |
| Median Household Income | 264 | $43,750 |
| Mean Household Income | 264 | $64,008 |
| Income Deficit | 206 | $0 |
| Wage / Income Gap (%) | 992 | 9.50% |
| Wage / Income Gap ($) | 992 | 90.50¢ per $1 |
| Gini / Inequality Index | 992 | 0.44 |
Earnings by Sex in St Mary s
Average Earnings in St Mary s are $22,875, $24,375 for men and $22,059 for women, a difference of 9.5%.
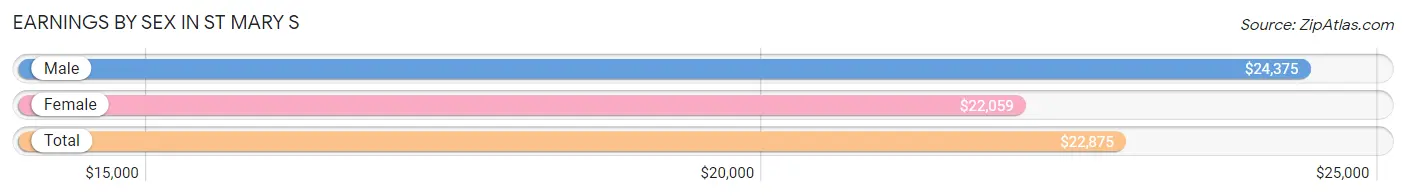
| Sex | Number | Average Earnings |
| Male | 252 (57.0%) | $24,375 |
| Female | 190 (43.0%) | $22,059 |
| Total | 442 (100.0%) | $22,875 |
Earnings by Sex by Income Bracket in St Mary s
The most common earnings brackets in St Mary s are $2,499 or less for men (33 | 13.1%) and $30,000 to $34,999 for women (21 | 11.1%).
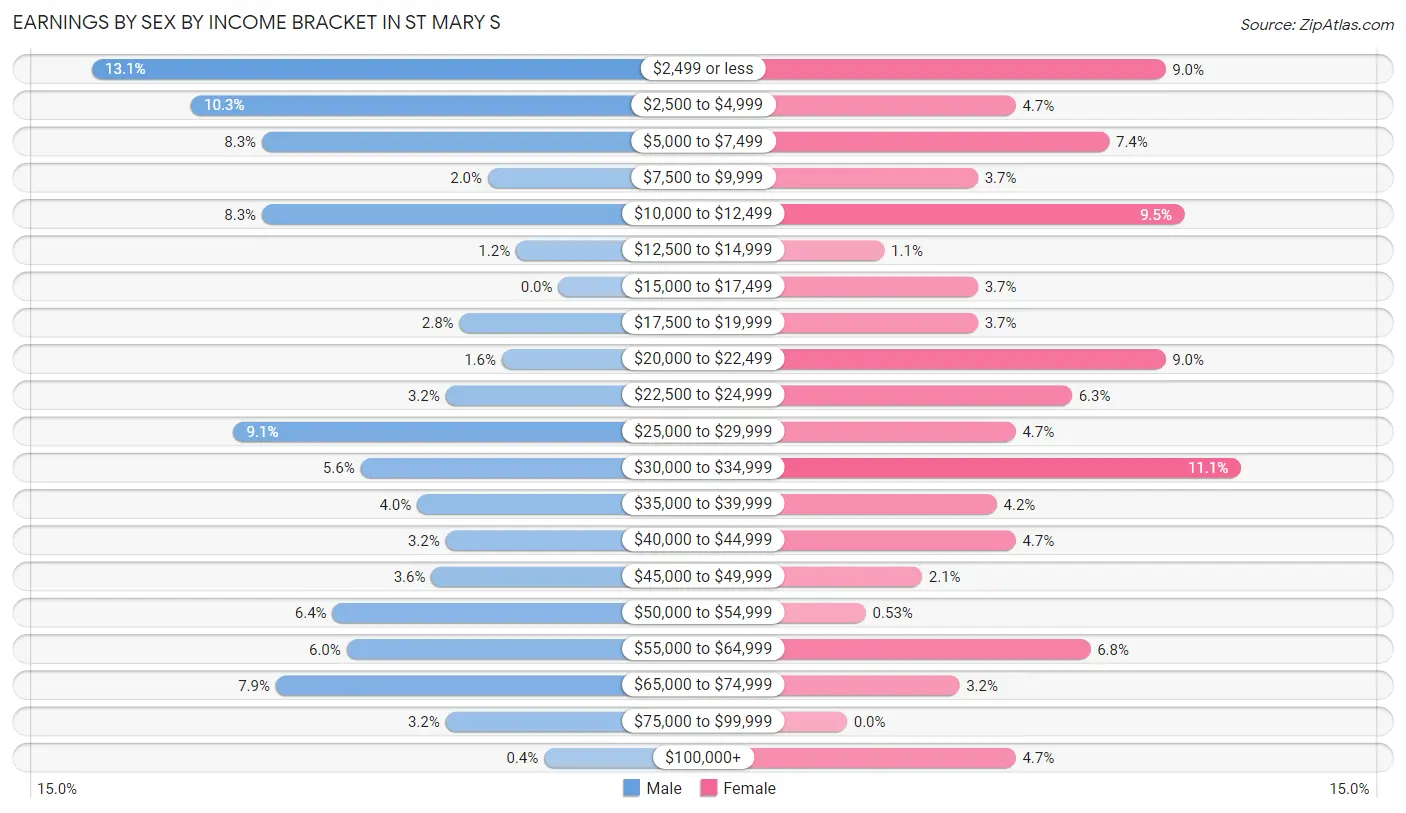
| Income | Male | Female |
| $2,499 or less | 33 (13.1%) | 17 (8.9%) |
| $2,500 to $4,999 | 26 (10.3%) | 9 (4.7%) |
| $5,000 to $7,499 | 21 (8.3%) | 14 (7.4%) |
| $7,500 to $9,999 | 5 (2.0%) | 7 (3.7%) |
| $10,000 to $12,499 | 21 (8.3%) | 18 (9.5%) |
| $12,500 to $14,999 | 3 (1.2%) | 2 (1.1%) |
| $15,000 to $17,499 | 0 (0.0%) | 7 (3.7%) |
| $17,500 to $19,999 | 7 (2.8%) | 7 (3.7%) |
| $20,000 to $22,499 | 4 (1.6%) | 17 (8.9%) |
| $22,500 to $24,999 | 8 (3.2%) | 12 (6.3%) |
| $25,000 to $29,999 | 23 (9.1%) | 9 (4.7%) |
| $30,000 to $34,999 | 14 (5.6%) | 21 (11.1%) |
| $35,000 to $39,999 | 10 (4.0%) | 8 (4.2%) |
| $40,000 to $44,999 | 8 (3.2%) | 9 (4.7%) |
| $45,000 to $49,999 | 9 (3.6%) | 4 (2.1%) |
| $50,000 to $54,999 | 16 (6.4%) | 1 (0.5%) |
| $55,000 to $64,999 | 15 (5.9%) | 13 (6.8%) |
| $65,000 to $74,999 | 20 (7.9%) | 6 (3.2%) |
| $75,000 to $99,999 | 8 (3.2%) | 0 (0.0%) |
| $100,000+ | 1 (0.4%) | 9 (4.7%) |
| Total | 252 (100.0%) | 190 (100.0%) |
Earnings by Sex by Educational Attainment in St Mary s
Average earnings in St Mary s are $30,089 for men and $26,250 for women, a difference of 12.8%. Men with an educational attainment of college or associate's degree enjoy the highest average annual earnings of $46,250, while those with high school diploma education earn the least with $27,083. Women with an educational attainment of less than high school earn the most with the average annual earnings of $32,083, while those with high school diploma education have the smallest earnings of $22,344.
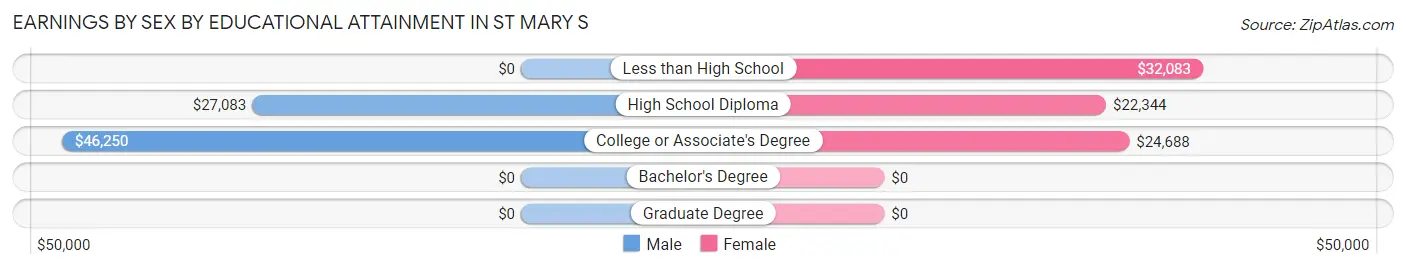
| Educational Attainment | Male Income | Female Income |
| Less than High School | - | - |
| High School Diploma | $27,083 | $22,344 |
| College or Associate's Degree | $46,250 | $24,688 |
| Bachelor's Degree | - | - |
| Graduate Degree | - | - |
| Total | $30,089 | $26,250 |
Family Income in St Mary s
Family Income Brackets in St Mary s
According to the St Mary s family income data, there are 51 families falling into the $35,000 to $49,999 income range, which is the most common income bracket and makes up 24.8% of all families. Conversely, the $150,000 to $199,999 income bracket is the least frequent group with only 3 families (1.5%) belonging to this category.
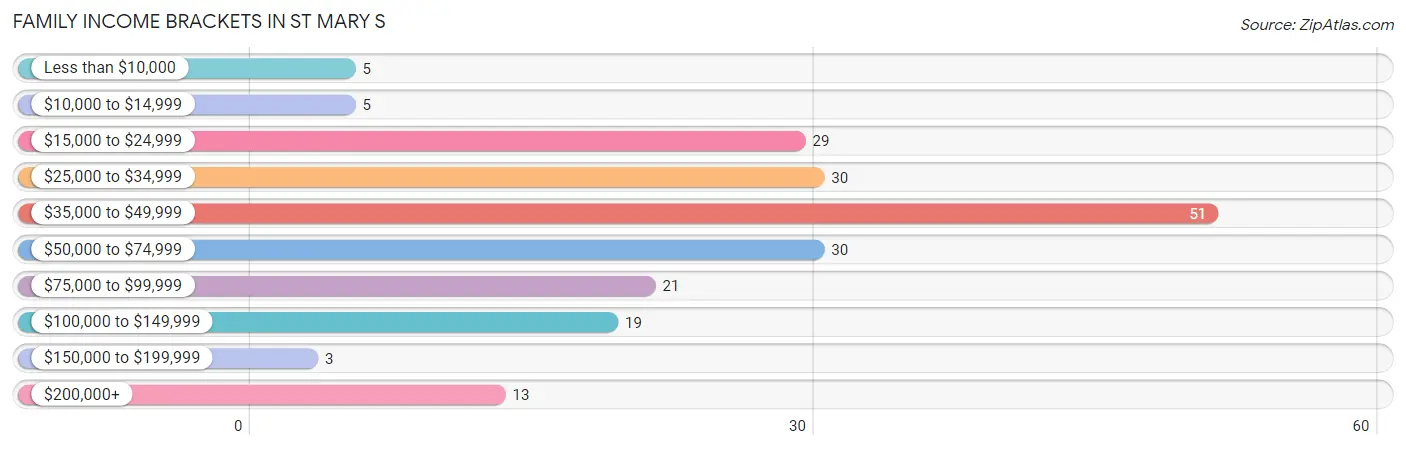
| Income Bracket | # Families | % Families |
| Less than $10,000 | 5 | 2.4% |
| $10,000 to $14,999 | 5 | 2.4% |
| $15,000 to $24,999 | 29 | 14.1% |
| $25,000 to $34,999 | 30 | 14.6% |
| $35,000 to $49,999 | 51 | 24.8% |
| $50,000 to $74,999 | 30 | 14.6% |
| $75,000 to $99,999 | 21 | 10.2% |
| $100,000 to $149,999 | 19 | 9.2% |
| $150,000 to $199,999 | 3 | 1.5% |
| $200,000+ | 13 | 6.3% |
Family Income by Famaliy Size in St Mary s
6-person families (32 | 15.5%) account for the highest median family income in St Mary s with $75,000 per family, while 2-person families (32 | 15.5%) have the highest median income of $20,000 per family member.
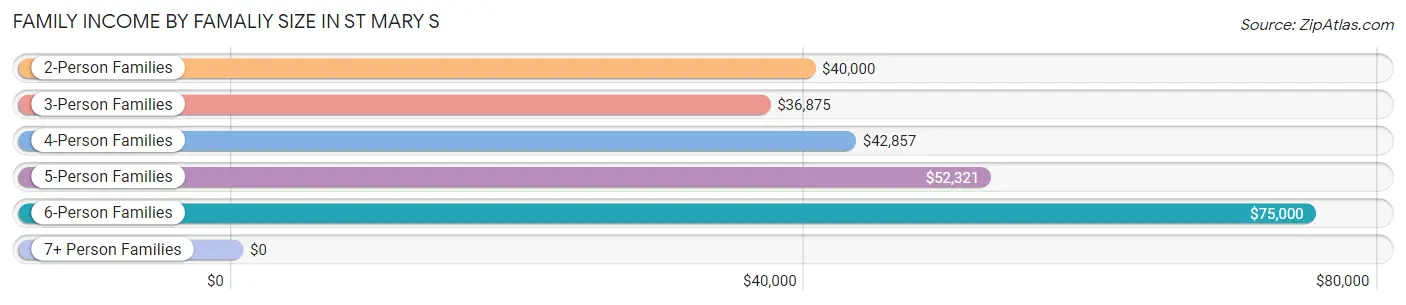
| Income Bracket | # Families | Median Income |
| 2-Person Families | 32 (15.5%) | $40,000 |
| 3-Person Families | 29 (14.1%) | $36,875 |
| 4-Person Families | 40 (19.4%) | $42,857 |
| 5-Person Families | 67 (32.5%) | $52,321 |
| 6-Person Families | 32 (15.5%) | $75,000 |
| 7+ Person Families | 6 (2.9%) | $0 |
| Total | 206 (100.0%) | $43,077 |
Family Income by Number of Earners in St Mary s
The median family income in St Mary s is $43,077, with families comprising 3+ earners (31) having the highest median family income of $127,708, while families with no earners (17) have the lowest median family income of $19,688, accounting for 15.0% and 8.3% of families, respectively.
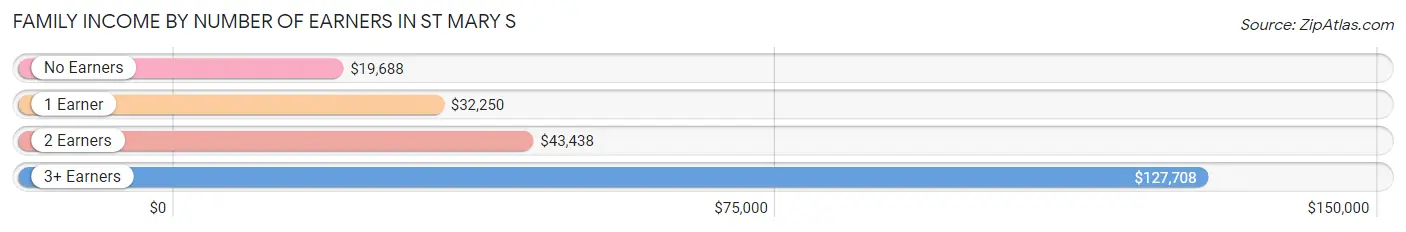
| Number of Earners | # Families | Median Income |
| No Earners | 17 (8.3%) | $19,688 |
| 1 Earner | 75 (36.4%) | $32,250 |
| 2 Earners | 83 (40.3%) | $43,438 |
| 3+ Earners | 31 (15.0%) | $127,708 |
| Total | 206 (100.0%) | $43,077 |
Household Income in St Mary s
Household Income Brackets in St Mary s
With 49 households falling in the category, the $35,000 to $49,999 income range is the most frequent in St Mary s, accounting for 18.6% of all households. In contrast, only 3 households (1.1%) fall into the $150,000 to $199,999 income bracket, making it the least populous group.
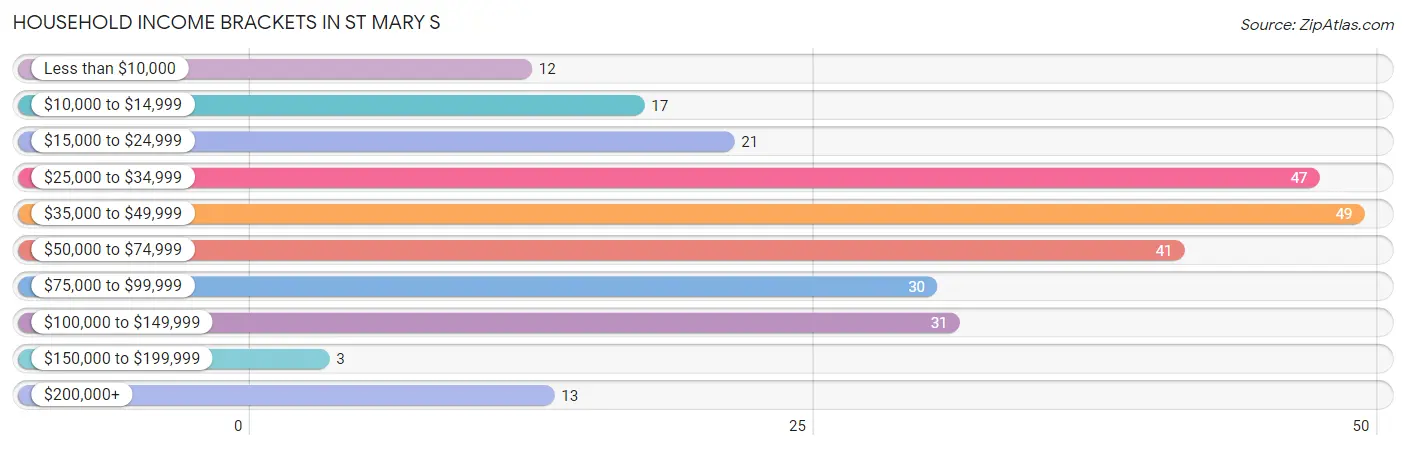
| Income Bracket | # Households | % Households |
| Less than $10,000 | 12 | 4.5% |
| $10,000 to $14,999 | 17 | 6.4% |
| $15,000 to $24,999 | 21 | 8.0% |
| $25,000 to $34,999 | 47 | 17.8% |
| $35,000 to $49,999 | 49 | 18.6% |
| $50,000 to $74,999 | 41 | 15.5% |
| $75,000 to $99,999 | 30 | 11.4% |
| $100,000 to $149,999 | 31 | 11.7% |
| $150,000 to $199,999 | 3 | 1.1% |
| $200,000+ | 13 | 4.9% |
Household Income by Householder Age in St Mary s
The median household income in St Mary s is $43,750, with the highest median household income of $51,607 found in the 25 to 44 years age bracket for the primary householder. A total of 87 households (33.0%) fall into this category. Meanwhile, the 15 to 24 years age bracket for the primary householder has the lowest median household income of $0, with 9 households (3.4%) in this group.
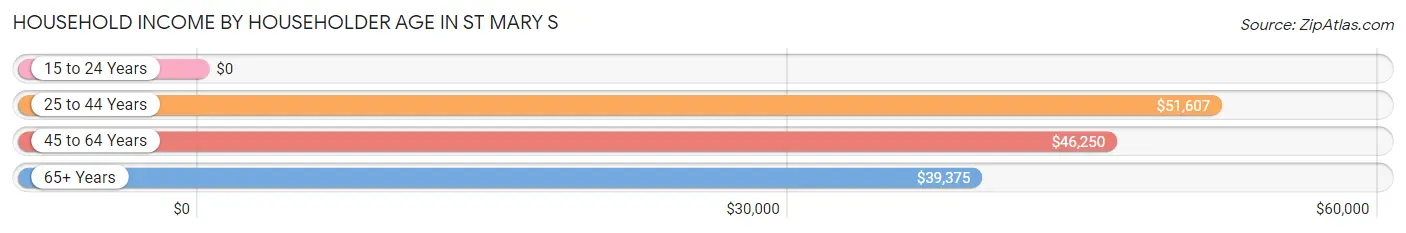
| Income Bracket | # Households | Median Income |
| 15 to 24 Years | 9 (3.4%) | $0 |
| 25 to 44 Years | 87 (33.0%) | $51,607 |
| 45 to 64 Years | 113 (42.8%) | $46,250 |
| 65+ Years | 55 (20.8%) | $39,375 |
| Total | 264 (100.0%) | $43,750 |
Poverty in St Mary s
Income Below Poverty by Sex and Age in St Mary s
With 29.1% poverty level for males and 28.2% for females among the residents of St Mary s, 65 to 74 year old males and 12 to 14 year old females are the most vulnerable to poverty, with 9 males (56.2%) and 14 females (53.8%) in their respective age groups living below the poverty level.
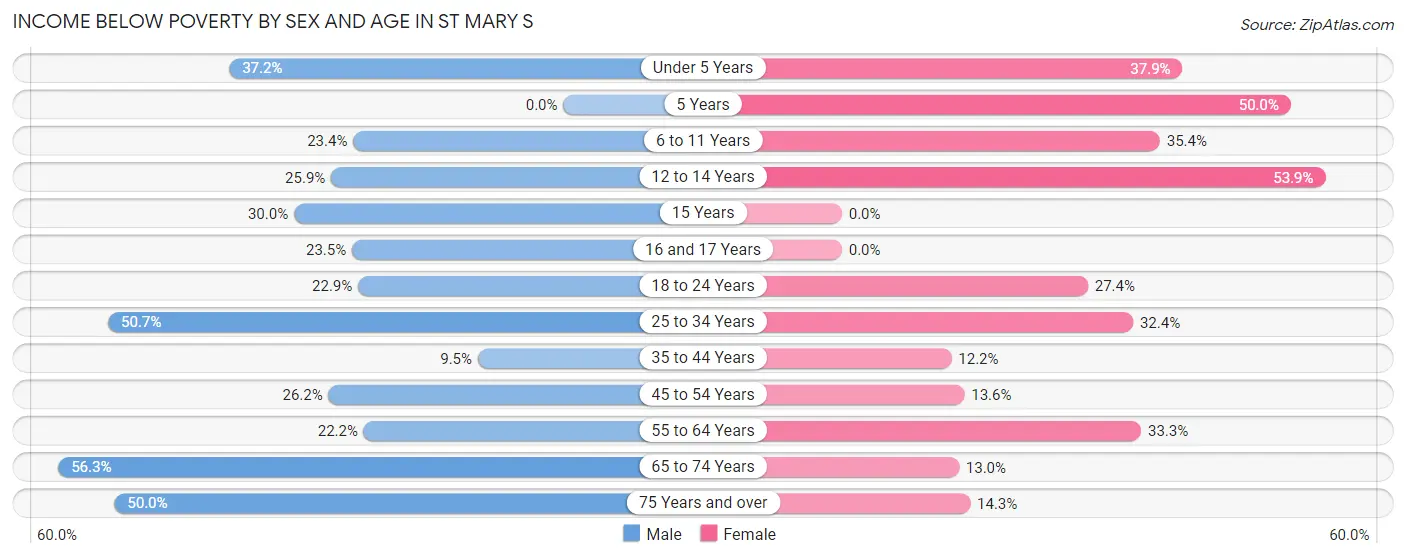
| Age Bracket | Male | Female |
| Under 5 Years | 16 (37.2%) | 33 (37.9%) |
| 5 Years | 0 (0.0%) | 4 (50.0%) |
| 6 to 11 Years | 11 (23.4%) | 17 (35.4%) |
| 12 to 14 Years | 15 (25.9%) | 14 (53.8%) |
| 15 Years | 3 (30.0%) | 0 (0.0%) |
| 16 and 17 Years | 4 (23.5%) | 0 (0.0%) |
| 18 to 24 Years | 16 (22.9%) | 20 (27.4%) |
| 25 to 34 Years | 36 (50.7%) | 24 (32.4%) |
| 35 to 44 Years | 4 (9.5%) | 5 (12.2%) |
| 45 to 54 Years | 17 (26.2%) | 6 (13.6%) |
| 55 to 64 Years | 12 (22.2%) | 9 (33.3%) |
| 65 to 74 Years | 9 (56.2%) | 3 (13.0%) |
| 75 Years and over | 3 (50.0%) | 3 (14.3%) |
| Total | 146 (29.1%) | 138 (28.2%) |
Income Above Poverty by Sex and Age in St Mary s
According to the poverty statistics in St Mary s, males aged 5 years and females aged 15 years are the age groups that are most secure financially, with 100.0% of males and 100.0% of females in these age groups living above the poverty line.
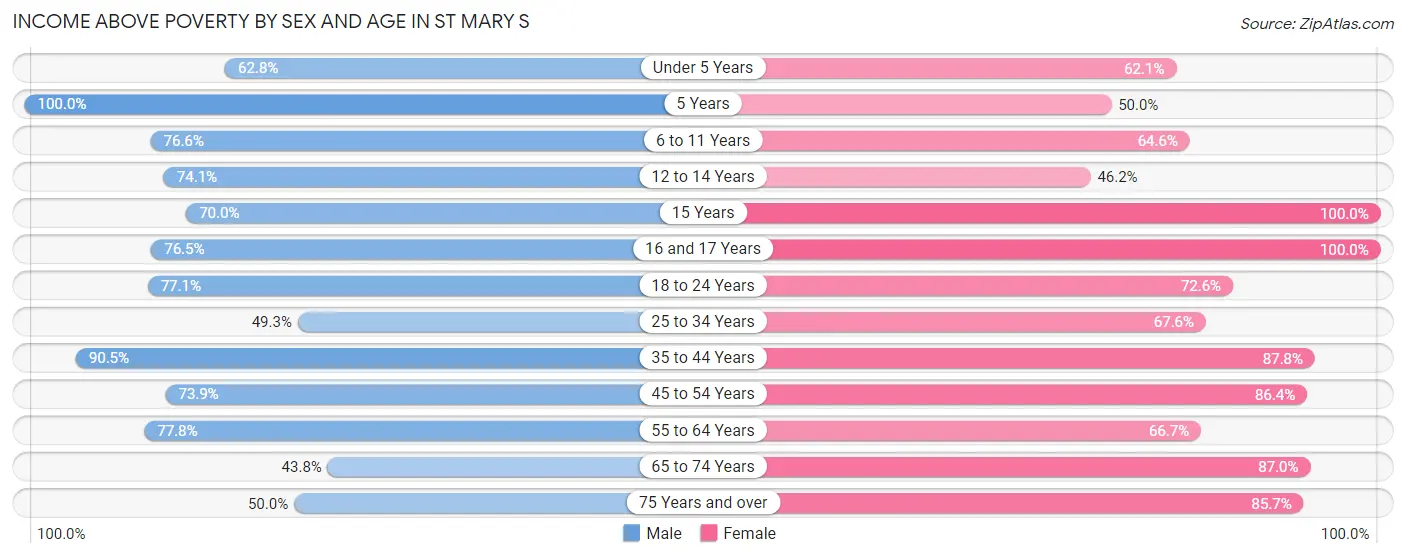
| Age Bracket | Male | Female |
| Under 5 Years | 27 (62.8%) | 54 (62.1%) |
| 5 Years | 3 (100.0%) | 4 (50.0%) |
| 6 to 11 Years | 36 (76.6%) | 31 (64.6%) |
| 12 to 14 Years | 43 (74.1%) | 12 (46.2%) |
| 15 Years | 7 (70.0%) | 2 (100.0%) |
| 16 and 17 Years | 13 (76.5%) | 16 (100.0%) |
| 18 to 24 Years | 54 (77.1%) | 53 (72.6%) |
| 25 to 34 Years | 35 (49.3%) | 50 (67.6%) |
| 35 to 44 Years | 38 (90.5%) | 36 (87.8%) |
| 45 to 54 Years | 48 (73.9%) | 38 (86.4%) |
| 55 to 64 Years | 42 (77.8%) | 18 (66.7%) |
| 65 to 74 Years | 7 (43.8%) | 20 (87.0%) |
| 75 Years and over | 3 (50.0%) | 18 (85.7%) |
| Total | 356 (70.9%) | 352 (71.8%) |
Income Below Poverty Among Married-Couple Families in St Mary s
The poverty statistics for married-couple families in St Mary s show that 19.1% or 20 of the total 105 families live below the poverty line. Families with 1 or 2 children have the highest poverty rate of 21.8%, comprising of 12 families. On the other hand, families with no children have the lowest poverty rate of 7.7%, which includes 1 families.
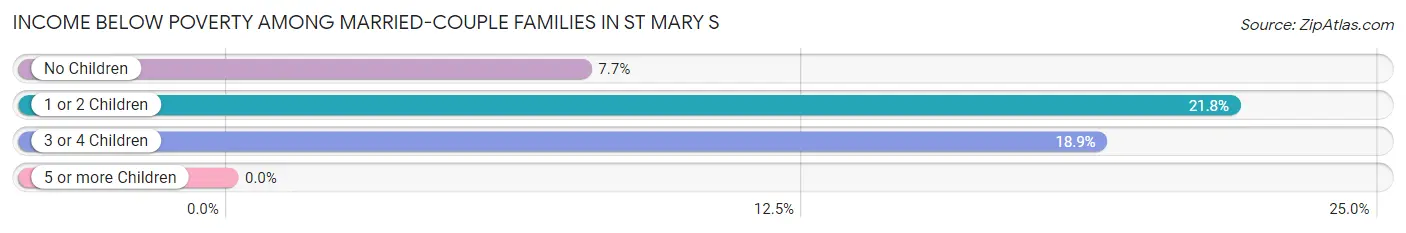
| Children | Above Poverty | Below Poverty |
| No Children | 12 (92.3%) | 1 (7.7%) |
| 1 or 2 Children | 43 (78.2%) | 12 (21.8%) |
| 3 or 4 Children | 30 (81.1%) | 7 (18.9%) |
| 5 or more Children | 0 (0.0%) | 0 (0.0%) |
| Total | 85 (80.9%) | 20 (19.1%) |
Income Below Poverty Among Single-Parent Households in St Mary s
According to the poverty data in St Mary s, 48.4% or 15 single-father households and 10.0% or 7 single-mother households are living below the poverty line. Among single-father households, those with 1 or 2 children have the highest poverty rate, with 3 households (100.0%) experiencing poverty. Likewise, among single-mother households, those with 3 or 4 children have the highest poverty rate, with 5 households (29.4%) falling below the poverty line.
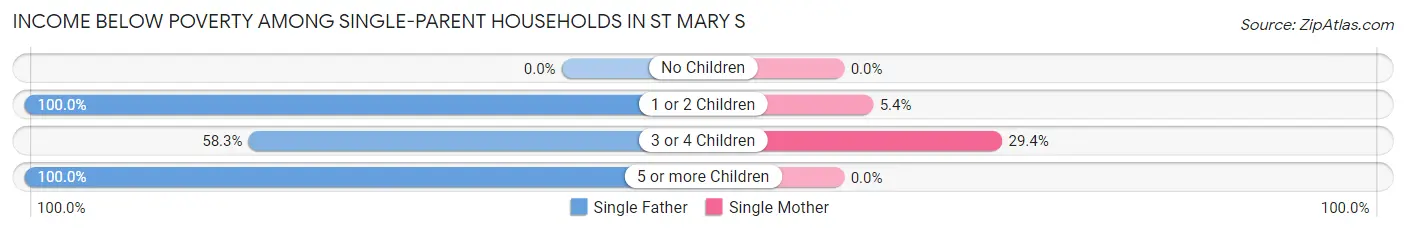
| Children | Single Father | Single Mother |
| No Children | 0 (0.0%) | 0 (0.0%) |
| 1 or 2 Children | 3 (100.0%) | 2 (5.4%) |
| 3 or 4 Children | 7 (58.3%) | 5 (29.4%) |
| 5 or more Children | 5 (100.0%) | 0 (0.0%) |
| Total | 15 (48.4%) | 7 (10.0%) |
Income Below Poverty Among Married-Couple vs Single-Parent Households in St Mary s
The poverty data for St Mary s shows that 20 of the married-couple family households (19.1%) and 22 of the single-parent households (21.8%) are living below the poverty level. Within the married-couple family households, those with 1 or 2 children have the highest poverty rate, with 12 households (21.8%) falling below the poverty line. Among the single-parent households, those with 5 or more children have the highest poverty rate, with 5 household (100.0%) living below poverty.
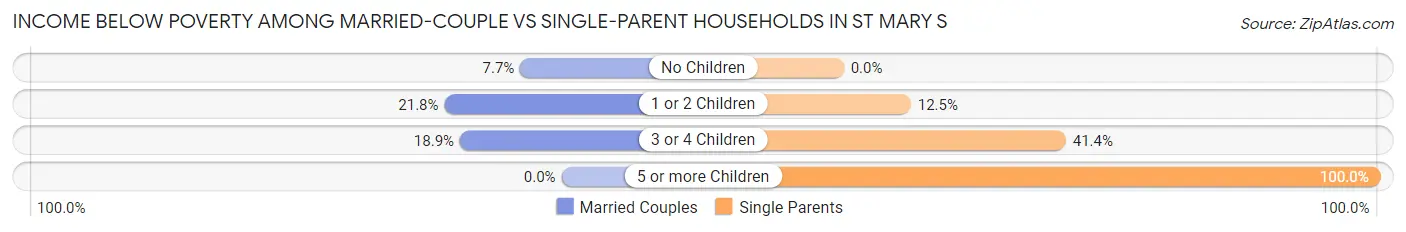
| Children | Married-Couple Families | Single-Parent Households |
| No Children | 1 (7.7%) | 0 (0.0%) |
| 1 or 2 Children | 12 (21.8%) | 5 (12.5%) |
| 3 or 4 Children | 7 (18.9%) | 12 (41.4%) |
| 5 or more Children | 0 (0.0%) | 5 (100.0%) |
| Total | 20 (19.1%) | 22 (21.8%) |
Race in St Mary s
The most populous races in St Mary s are Native / Alaskan (914 | 92.1%), Two or more Races (52 | 5.2%), and White / Caucasian (16 | 1.6%).
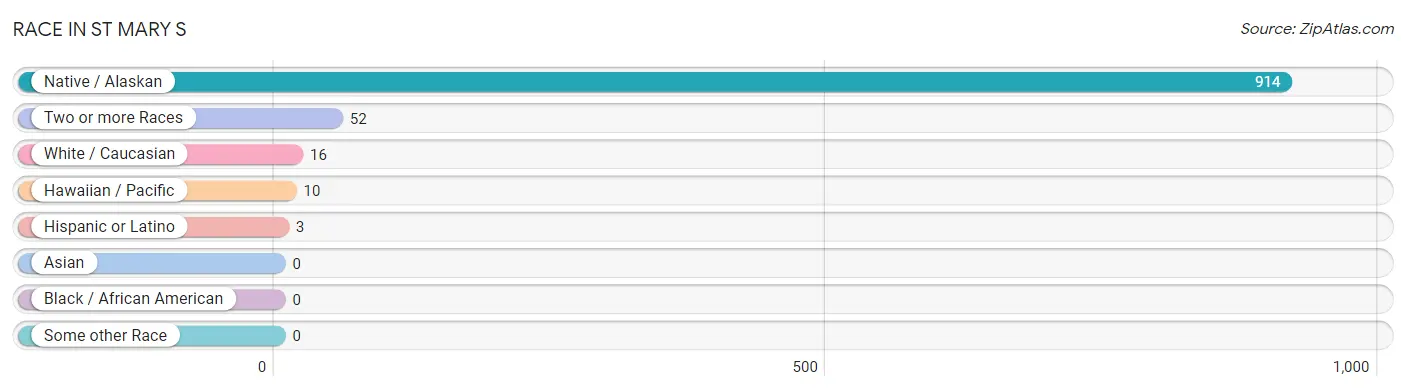
| Race | # Population | % Population |
| Asian | 0 | 0.0% |
| Black / African American | 0 | 0.0% |
| Hawaiian / Pacific | 10 | 1.0% |
| Hispanic or Latino | 3 | 0.3% |
| Native / Alaskan | 914 | 92.1% |
| White / Caucasian | 16 | 1.6% |
| Two or more Races | 52 | 5.2% |
| Some other Race | 0 | 0.0% |
| Total | 992 | 100.0% |
Ancestry in St Mary s
The most populous ancestries reported in St Mary s are Yup'ik (856 | 86.3%), Alaska Native (62 | 6.2%), Cherokee (24 | 2.4%), Inupiat (20 | 2.0%), and Creek (19 | 1.9%), together accounting for 98.9% of all St Mary s residents.
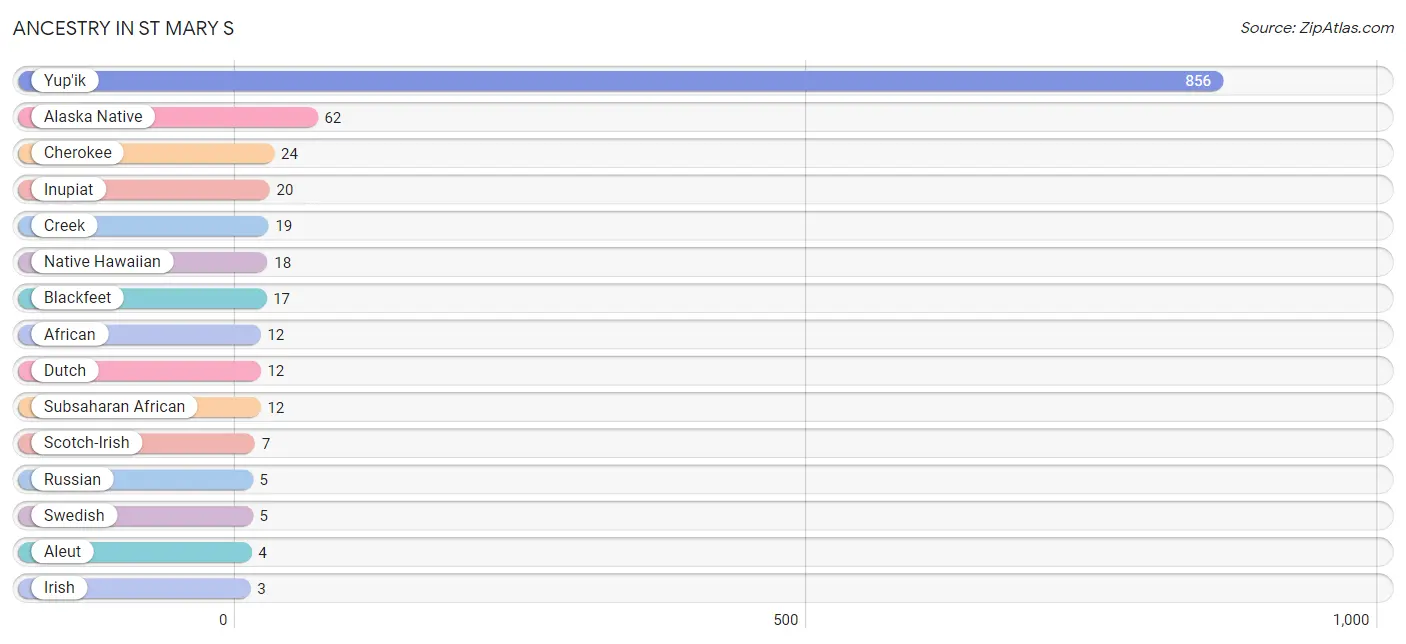
| Ancestry | # Population | % Population |
| African | 12 | 1.2% |
| Alaska Native | 62 | 6.2% |
| Aleut | 4 | 0.4% |
| Blackfeet | 17 | 1.7% |
| Cherokee | 24 | 2.4% |
| Creek | 19 | 1.9% |
| Dutch | 12 | 1.2% |
| English | 1 | 0.1% |
| European | 2 | 0.2% |
| German | 2 | 0.2% |
| Inupiat | 20 | 2.0% |
| Irish | 3 | 0.3% |
| Italian | 3 | 0.3% |
| Mexican | 3 | 0.3% |
| Native Hawaiian | 18 | 1.8% |
| Norwegian | 2 | 0.2% |
| Russian | 5 | 0.5% |
| Scotch-Irish | 7 | 0.7% |
| Subsaharan African | 12 | 1.2% |
| Swedish | 5 | 0.5% |
| Yup'ik | 856 | 86.3% | View All 21 Rows |
Immigrants in St Mary s
The most numerous immigrant groups reported in St Mary s came from , and Canada (3 | 0.3%), together accounting for 0.3% of all St Mary s residents.

| Immigration Origin | # Population | % Population |
| Canada | 3 | 0.3% | View All 1 Rows |
Sex and Age in St Mary s
Sex and Age in St Mary s
The most populous age groups in St Mary s are 10 to 14 Years (69 | 13.8%) for men and Under 5 Years (87 | 17.8%) for women.
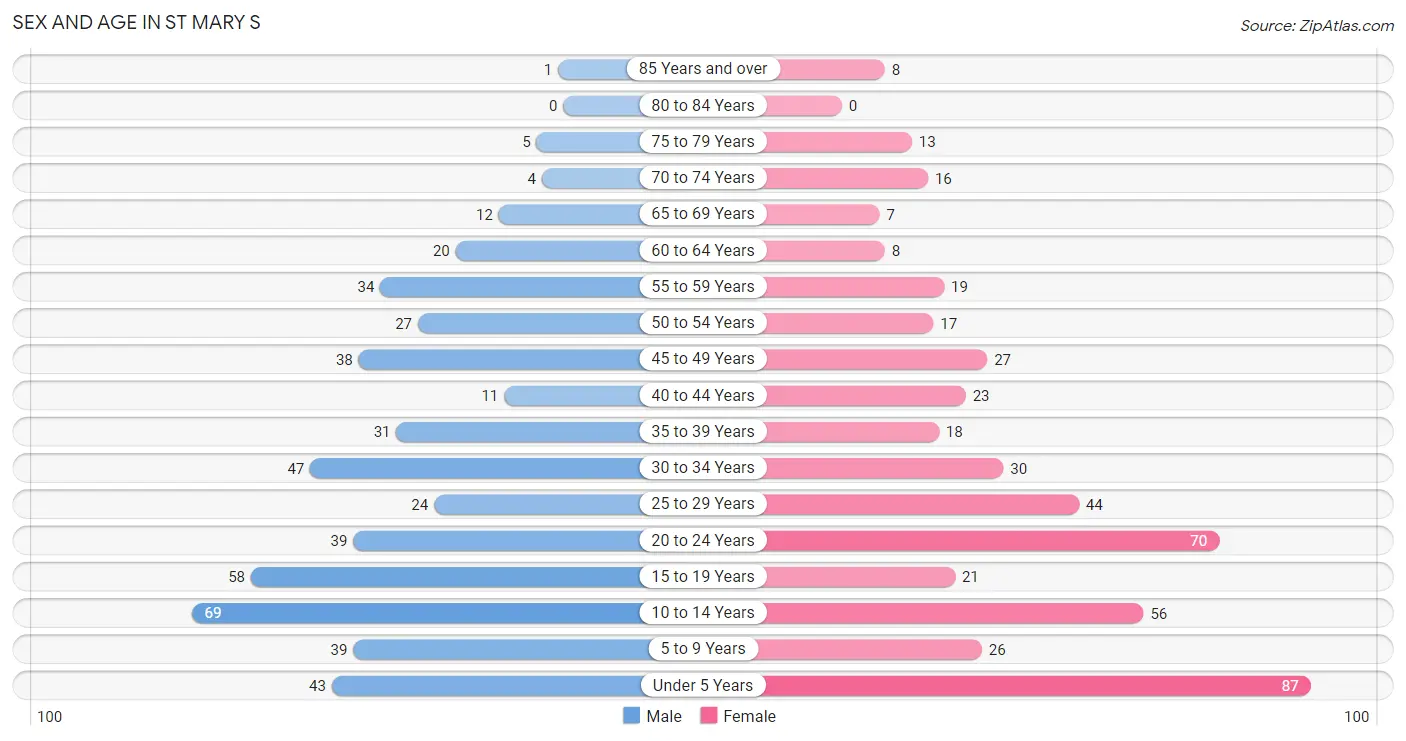
| Age Bracket | Male | Female |
| Under 5 Years | 43 (8.6%) | 87 (17.8%) |
| 5 to 9 Years | 39 (7.8%) | 26 (5.3%) |
| 10 to 14 Years | 69 (13.8%) | 56 (11.4%) |
| 15 to 19 Years | 58 (11.6%) | 21 (4.3%) |
| 20 to 24 Years | 39 (7.8%) | 70 (14.3%) |
| 25 to 29 Years | 24 (4.8%) | 44 (9.0%) |
| 30 to 34 Years | 47 (9.4%) | 30 (6.1%) |
| 35 to 39 Years | 31 (6.2%) | 18 (3.7%) |
| 40 to 44 Years | 11 (2.2%) | 23 (4.7%) |
| 45 to 49 Years | 38 (7.6%) | 27 (5.5%) |
| 50 to 54 Years | 27 (5.4%) | 17 (3.5%) |
| 55 to 59 Years | 34 (6.8%) | 19 (3.9%) |
| 60 to 64 Years | 20 (4.0%) | 8 (1.6%) |
| 65 to 69 Years | 12 (2.4%) | 7 (1.4%) |
| 70 to 74 Years | 4 (0.8%) | 16 (3.3%) |
| 75 to 79 Years | 5 (1.0%) | 13 (2.6%) |
| 80 to 84 Years | 0 (0.0%) | 0 (0.0%) |
| 85 Years and over | 1 (0.2%) | 8 (1.6%) |
| Total | 502 (100.0%) | 490 (100.0%) |
Families and Households in St Mary s
Median Family Size in St Mary s
The median family size in St Mary s is 4.09 persons per family, with married-couple families (105 | 51.0%) accounting for the largest median family size of 4.7 persons per family. On the other hand, single female/mother families (70 | 34.0%) represent the smallest median family size with 3.21 persons per family.
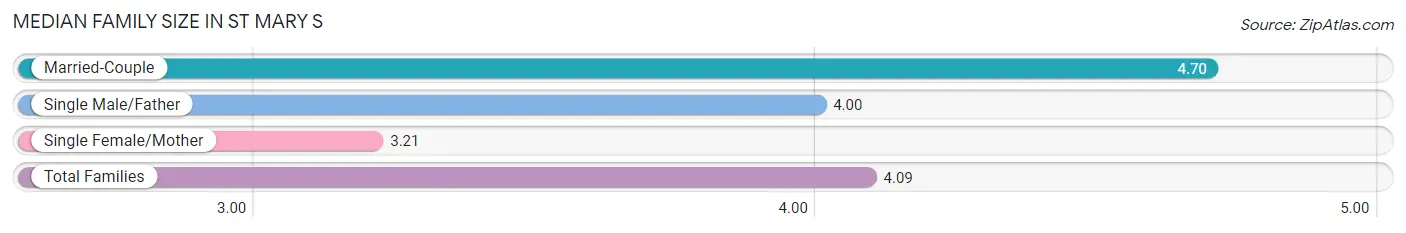
| Family Type | # Families | Family Size |
| Married-Couple | 105 (51.0%) | 4.70 |
| Single Male/Father | 31 (15.0%) | 4.00 |
| Single Female/Mother | 70 (34.0%) | 3.21 |
| Total Families | 206 (100.0%) | 4.09 |
Median Household Size in St Mary s
The median household size in St Mary s is 3.76 persons per household, with married-couple households (105 | 39.8%) accounting for the largest median household size of 4.88 persons per household. non-family households (58 | 22.0%) represent the smallest median household size with 1.09 persons per household.
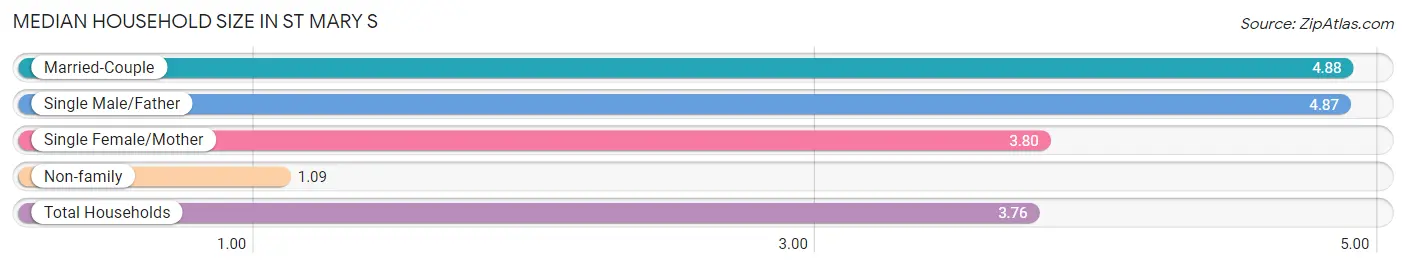
| Household Type | # Households | Household Size |
| Married-Couple | 105 (39.8%) | 4.88 |
| Single Male/Father | 31 (11.7%) | 4.87 |
| Single Female/Mother | 70 (26.5%) | 3.80 |
| Non-family | 58 (22.0%) | 1.09 |
| Total Households | 264 (100.0%) | 3.76 |
Household Size by Marriage Status in St Mary s
Out of a total of 264 households in St Mary s, 206 (78.0%) are family households, while 58 (22.0%) are nonfamily households. The most numerous type of family households are 5-person households, comprising 53, and the most common type of nonfamily households are 1-person households, comprising 52.
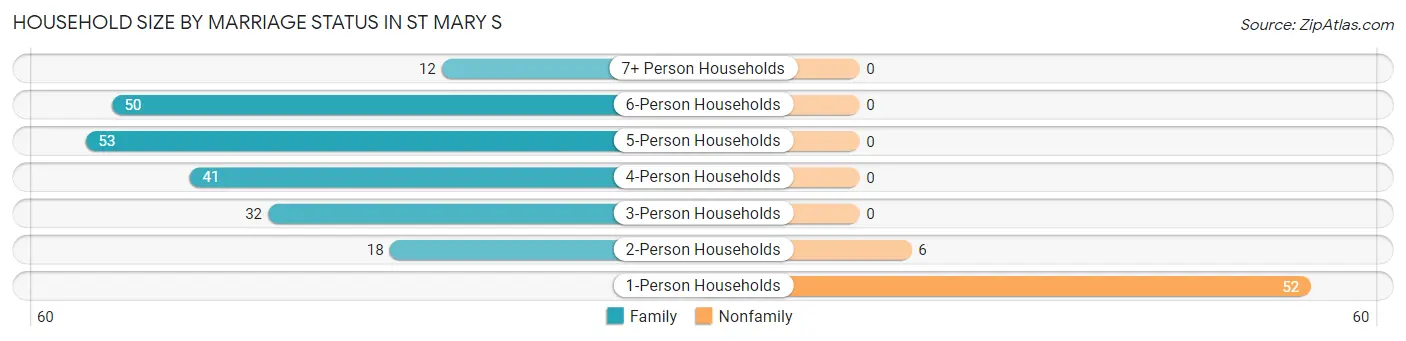
| Household Size | Family Households | Nonfamily Households |
| 1-Person Households | - | 52 (19.7%) |
| 2-Person Households | 18 (6.8%) | 6 (2.3%) |
| 3-Person Households | 32 (12.1%) | 0 (0.0%) |
| 4-Person Households | 41 (15.5%) | 0 (0.0%) |
| 5-Person Households | 53 (20.1%) | 0 (0.0%) |
| 6-Person Households | 50 (18.9%) | 0 (0.0%) |
| 7+ Person Households | 12 (4.5%) | 0 (0.0%) |
| Total | 206 (78.0%) | 58 (22.0%) |
Female Fertility in St Mary s
Fertility by Age in St Mary s
Average fertility rate in St Mary s is 51.0 births per 1,000 women. Women in the age bracket of 20 to 34 years have the highest fertility rate with 69.0 births per 1,000 women. Women in the age bracket of 20 to 34 years acount for 83.3% of all women with births.
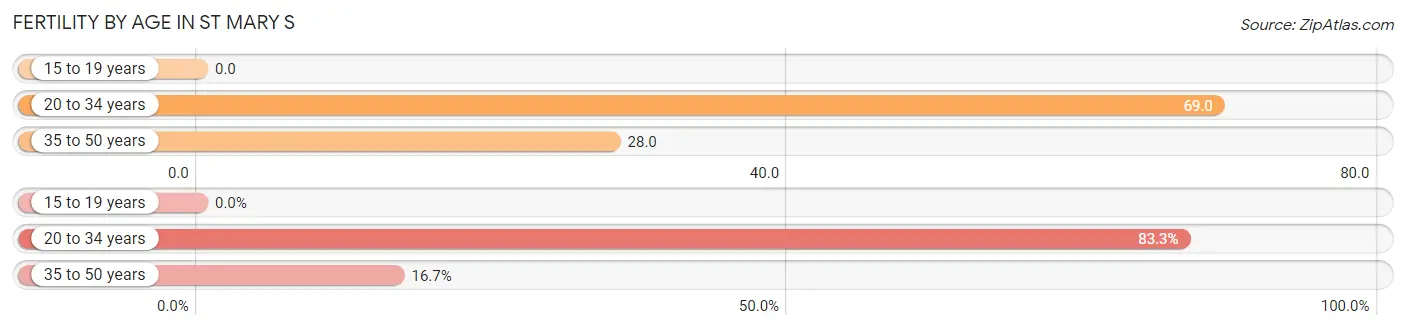
| Age Bracket | Women with Births | Births / 1,000 Women |
| 15 to 19 years | 0 (0.0%) | 0.0 |
| 20 to 34 years | 10 (83.3%) | 69.0 |
| 35 to 50 years | 2 (16.7%) | 28.0 |
| Total | 12 (100.0%) | 51.0 |
Fertility by Age by Marriage Status in St Mary s
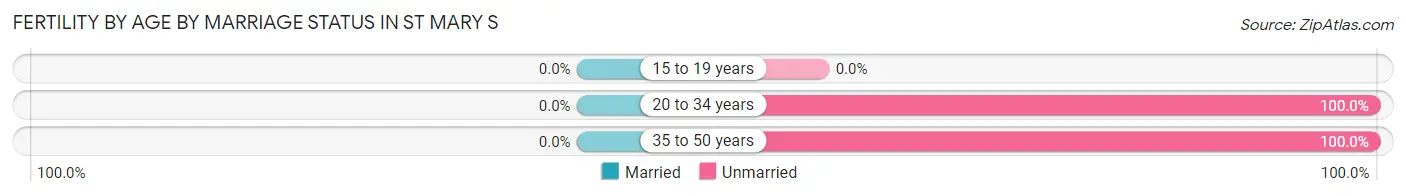
| Age Bracket | Married | Unmarried |
| 15 to 19 years | 0 (0.0%) | 0 (0.0%) |
| 20 to 34 years | 0 (0.0%) | 10 (100.0%) |
| 35 to 50 years | 0 (0.0%) | 2 (100.0%) |
| Total | 0 (0.0%) | 12 (100.0%) |
Fertility by Education in St Mary s
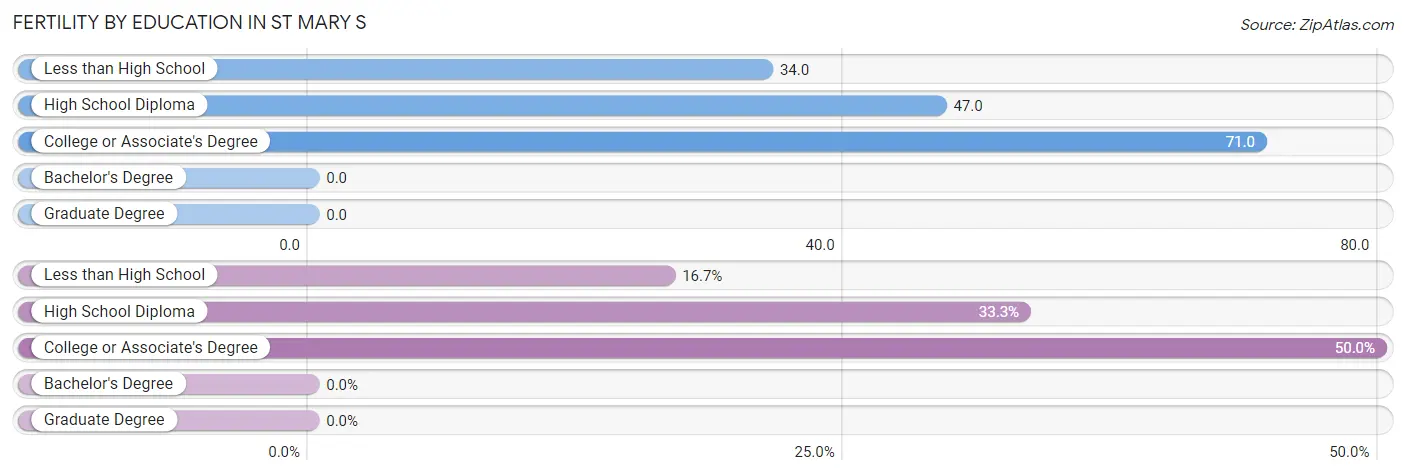
| Educational Attainment | Women with Births | Births / 1,000 Women |
| Less than High School | 2 (16.7%) | 34.0 |
| High School Diploma | 4 (33.3%) | 47.0 |
| College or Associate's Degree | 6 (50.0%) | 71.0 |
| Bachelor's Degree | 0 (0.0%) | 0.0 |
| Graduate Degree | 0 (0.0%) | 0.0 |
| Total | 12 (100.0%) | 51.0 |
Fertility by Education by Marriage Status in St Mary s
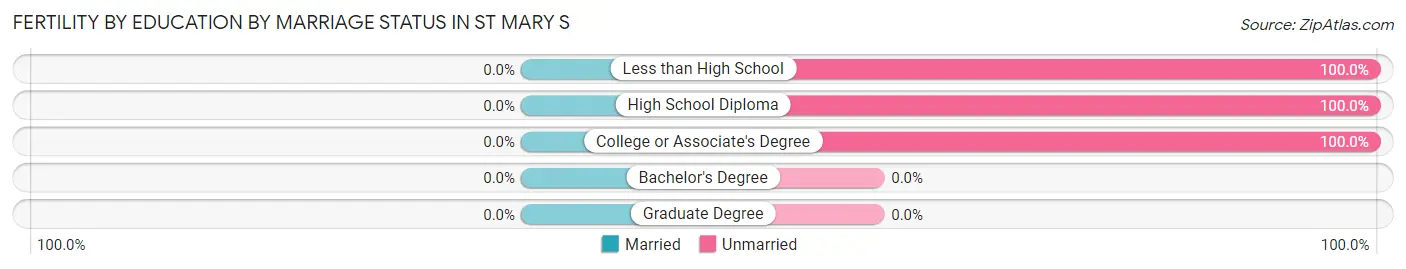
| Educational Attainment | Married | Unmarried |
| Less than High School | 0 (0.0%) | 2 (100.0%) |
| High School Diploma | 0 (0.0%) | 4 (100.0%) |
| College or Associate's Degree | 0 (0.0%) | 6 (100.0%) |
| Bachelor's Degree | 0 (0.0%) | 0 (0.0%) |
| Graduate Degree | 0 (0.0%) | 0 (0.0%) |
| Total | 0 (0.0%) | 12 (100.0%) |
Employment Characteristics in St Mary s
Employment by Class of Employer in St Mary s
Among the 318 employed individuals in St Mary s, local government employees (99 | 31.1%), private company employees (93 | 29.2%), and not-for-profit organizations (63 | 19.8%) make up the most common classes of employment.
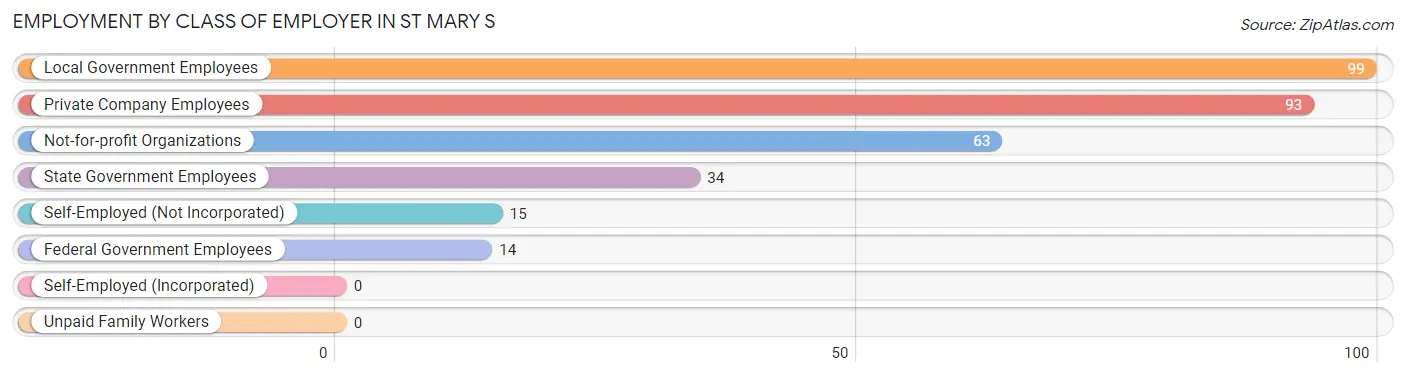
| Employer Class | # Employees | % Employees |
| Private Company Employees | 93 | 29.2% |
| Self-Employed (Incorporated) | 0 | 0.0% |
| Self-Employed (Not Incorporated) | 15 | 4.7% |
| Not-for-profit Organizations | 63 | 19.8% |
| Local Government Employees | 99 | 31.1% |
| State Government Employees | 34 | 10.7% |
| Federal Government Employees | 14 | 4.4% |
| Unpaid Family Workers | 0 | 0.0% |
| Total | 318 | 100.0% |
Employment Status by Age in St Mary s
According to the labor force statistics for St Mary s, out of the total population over 16 years of age (660), 64.4% or 425 individuals are in the labor force, with 22.0% or 94 of them unemployed. The age group with the highest labor force participation rate is 35 to 44 years, with 86.7% or 72 individuals in the labor force. Within the labor force, the 65 to 74 years age range has the highest percentage of unemployed individuals, with 55.6% or 5 of them being unemployed.
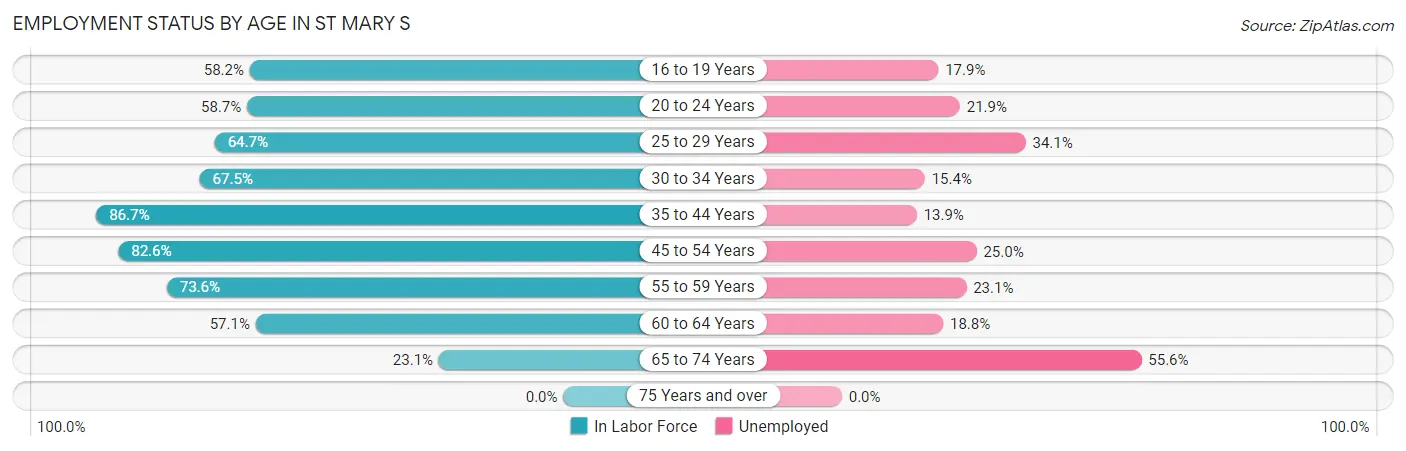
| Age Bracket | In Labor Force | Unemployed |
| 16 to 19 Years | 39 (58.2%) | 7 (17.9%) |
| 20 to 24 Years | 64 (58.7%) | 14 (21.9%) |
| 25 to 29 Years | 44 (64.7%) | 15 (34.1%) |
| 30 to 34 Years | 52 (67.5%) | 8 (15.4%) |
| 35 to 44 Years | 72 (86.7%) | 10 (13.9%) |
| 45 to 54 Years | 90 (82.6%) | 22 (25.0%) |
| 55 to 59 Years | 39 (73.6%) | 9 (23.1%) |
| 60 to 64 Years | 16 (57.1%) | 3 (18.8%) |
| 65 to 74 Years | 9 (23.1%) | 5 (55.6%) |
| 75 Years and over | 0 (0.0%) | 0 (0.0%) |
| Total | 425 (64.4%) | 94 (22.0%) |
Employment Status by Educational Attainment in St Mary s
According to labor force statistics for St Mary s, 74.9% of individuals (313) out of the total population between 25 and 64 years of age (418) are in the labor force, with 21.5% or 67 of them being unemployed. The group with the highest labor force participation rate are those with the educational attainment of bachelor's degree or higher, with 100.0% or 18 individuals in the labor force. Within the labor force, individuals with high school diploma education have the highest percentage of unemployment, with 27.0% or 50 of them being unemployed.
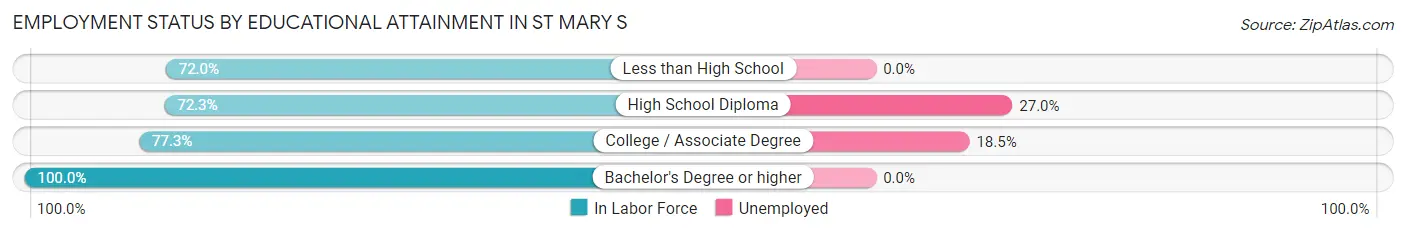
| Educational Attainment | In Labor Force | Unemployed |
| Less than High School | 18 (72.0%) | 0 (0.0%) |
| High School Diploma | 185 (72.3%) | 69 (27.0%) |
| College / Associate Degree | 92 (77.3%) | 22 (18.5%) |
| Bachelor's Degree or higher | 18 (100.0%) | 0 (0.0%) |
| Total | 313 (74.9%) | 90 (21.5%) |
Employment Occupations by Sex in St Mary s
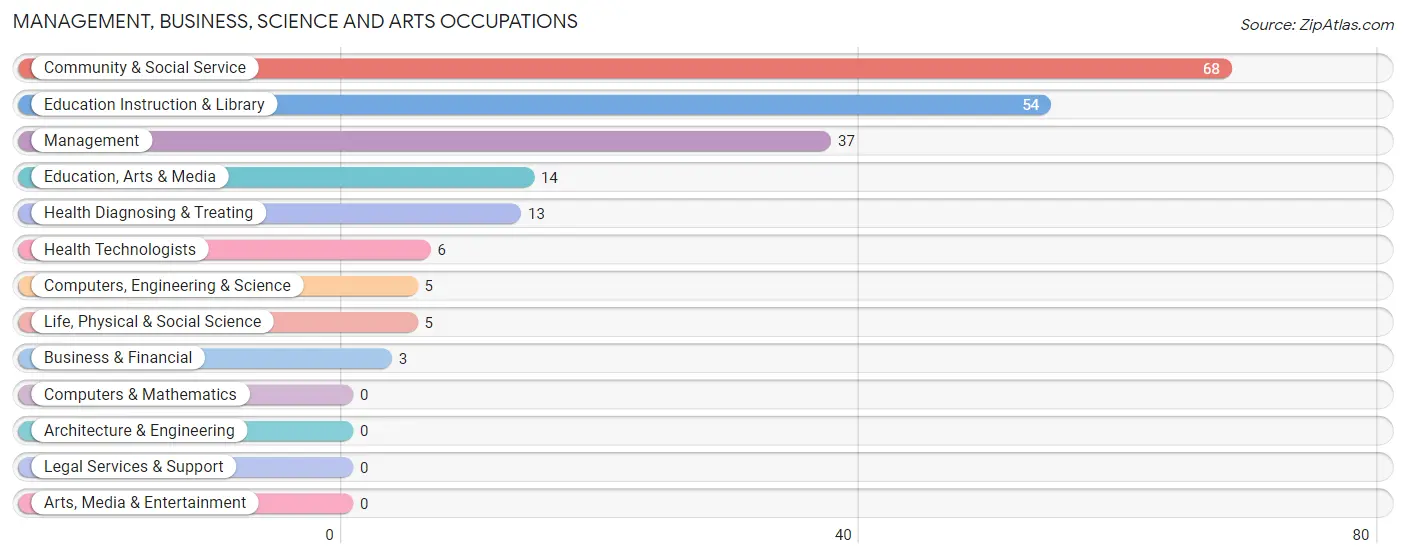
Management, Business, Science and Arts Occupations
The most common Management, Business, Science and Arts occupations in St Mary s are Community & Social Service (68 | 20.6%), Education Instruction & Library (54 | 16.4%), Management (37 | 11.2%), Education, Arts & Media (14 | 4.2%), and Health Diagnosing & Treating (13 | 3.9%).
Management, Business, Science and Arts Occupations by Sex
Within the Management, Business, Science and Arts occupations in St Mary s, the most male-oriented occupations are Computers, Engineering & Science (100.0%), Life, Physical & Social Science (100.0%), and Management (59.5%), while the most female-oriented occupations are Business & Financial (100.0%), Health Diagnosing & Treating (100.0%), and Health Technologists (100.0%).
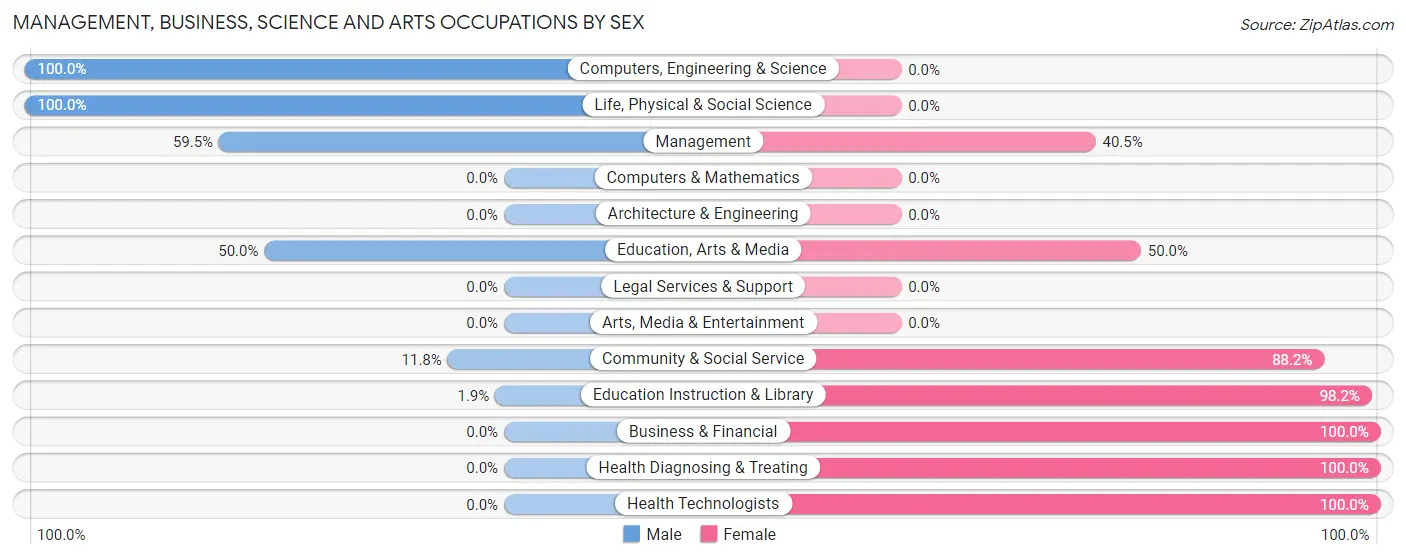
| Occupation | Male | Female |
| Management | 22 (59.5%) | 15 (40.5%) |
| Business & Financial | 0 (0.0%) | 3 (100.0%) |
| Computers, Engineering & Science | 5 (100.0%) | 0 (0.0%) |
| Computers & Mathematics | 0 (0.0%) | 0 (0.0%) |
| Architecture & Engineering | 0 (0.0%) | 0 (0.0%) |
| Life, Physical & Social Science | 5 (100.0%) | 0 (0.0%) |
| Community & Social Service | 8 (11.8%) | 60 (88.2%) |
| Education, Arts & Media | 7 (50.0%) | 7 (50.0%) |
| Legal Services & Support | 0 (0.0%) | 0 (0.0%) |
| Education Instruction & Library | 1 (1.8%) | 53 (98.2%) |
| Arts, Media & Entertainment | 0 (0.0%) | 0 (0.0%) |
| Health Diagnosing & Treating | 0 (0.0%) | 13 (100.0%) |
| Health Technologists | 0 (0.0%) | 6 (100.0%) |
| Total (Category) | 35 (27.8%) | 91 (72.2%) |
| Total (Overall) | 165 (50.0%) | 165 (50.0%) |
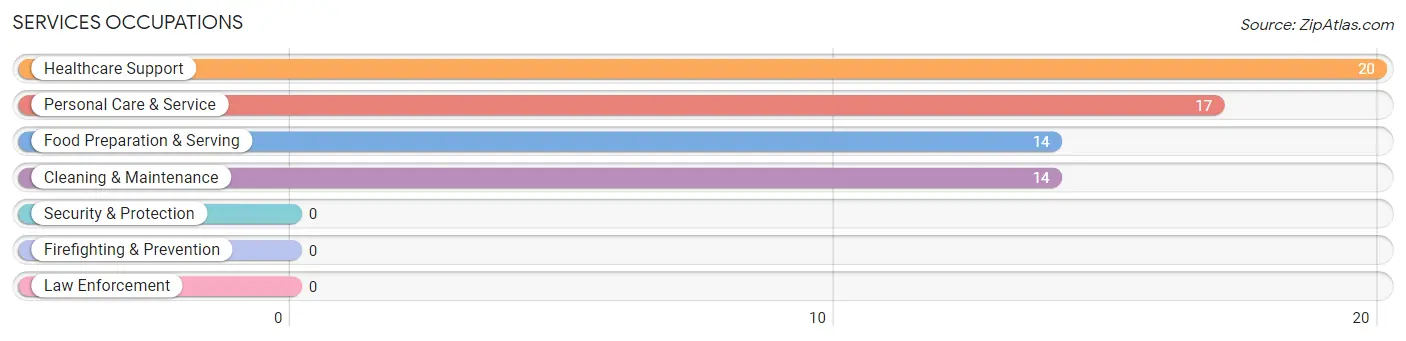
Services Occupations
The most common Services occupations in St Mary s are Healthcare Support (20 | 6.1%), Personal Care & Service (17 | 5.1%), Food Preparation & Serving (14 | 4.2%), and Cleaning & Maintenance (14 | 4.2%).
Services Occupations by Sex
Within the Services occupations in St Mary s, the most male-oriented occupations are Food Preparation & Serving (64.3%), Cleaning & Maintenance (57.1%), and Healthcare Support (45.0%), while the most female-oriented occupations are Personal Care & Service (76.5%), Healthcare Support (55.0%), and Cleaning & Maintenance (42.9%).
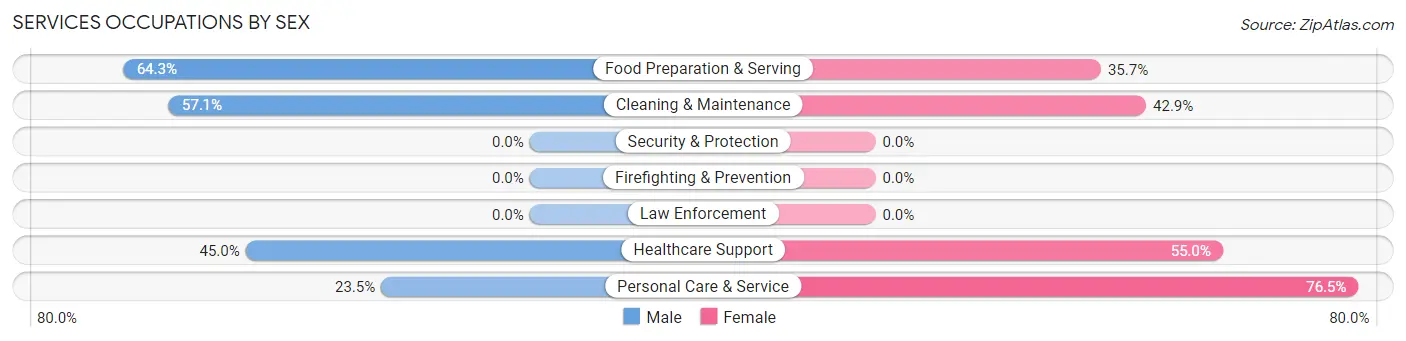
| Occupation | Male | Female |
| Healthcare Support | 9 (45.0%) | 11 (55.0%) |
| Security & Protection | 0 (0.0%) | 0 (0.0%) |
| Firefighting & Prevention | 0 (0.0%) | 0 (0.0%) |
| Law Enforcement | 0 (0.0%) | 0 (0.0%) |
| Food Preparation & Serving | 9 (64.3%) | 5 (35.7%) |
| Cleaning & Maintenance | 8 (57.1%) | 6 (42.9%) |
| Personal Care & Service | 4 (23.5%) | 13 (76.5%) |
| Total (Category) | 30 (46.2%) | 35 (53.8%) |
| Total (Overall) | 165 (50.0%) | 165 (50.0%) |
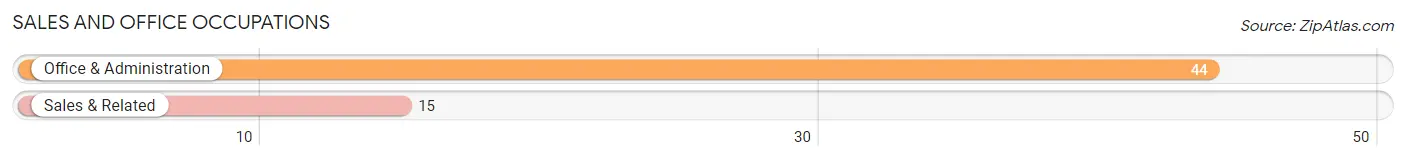
Sales and Office Occupations
The most common Sales and Office occupations in St Mary s are Office & Administration (44 | 13.3%), and Sales & Related (15 | 4.5%).
Sales and Office Occupations by Sex
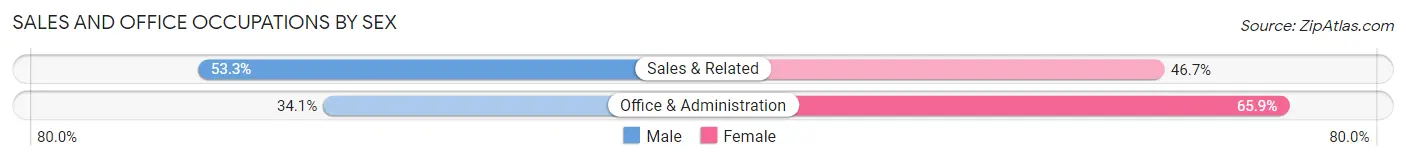
| Occupation | Male | Female |
| Sales & Related | 8 (53.3%) | 7 (46.7%) |
| Office & Administration | 15 (34.1%) | 29 (65.9%) |
| Total (Category) | 23 (39.0%) | 36 (61.0%) |
| Total (Overall) | 165 (50.0%) | 165 (50.0%) |
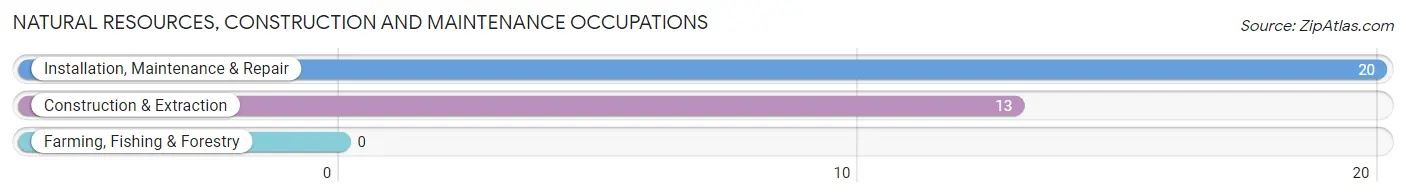
Natural Resources, Construction and Maintenance Occupations
The most common Natural Resources, Construction and Maintenance occupations in St Mary s are Installation, Maintenance & Repair (20 | 6.1%), and Construction & Extraction (13 | 3.9%).
Natural Resources, Construction and Maintenance Occupations by Sex
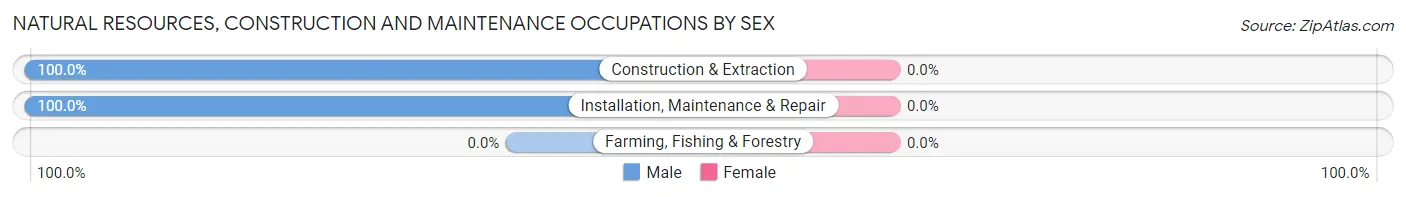
| Occupation | Male | Female |
| Farming, Fishing & Forestry | 0 (0.0%) | 0 (0.0%) |
| Construction & Extraction | 13 (100.0%) | 0 (0.0%) |
| Installation, Maintenance & Repair | 20 (100.0%) | 0 (0.0%) |
| Total (Category) | 33 (100.0%) | 0 (0.0%) |
| Total (Overall) | 165 (50.0%) | 165 (50.0%) |
Production, Transportation and Moving Occupations
The most common Production, Transportation and Moving occupations in St Mary s are Material Moving (29 | 8.8%), Transportation (12 | 3.6%), and Production (6 | 1.8%).
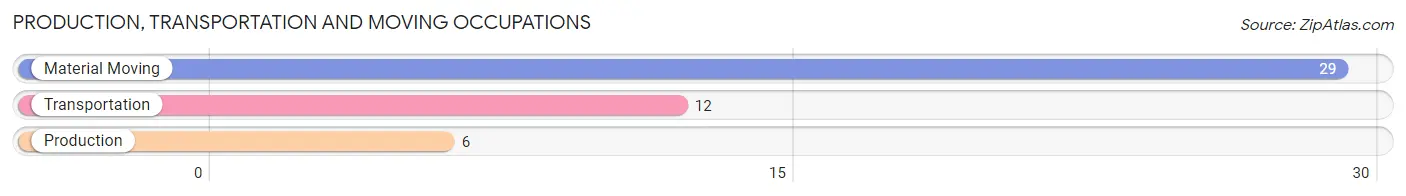
Production, Transportation and Moving Occupations by Sex
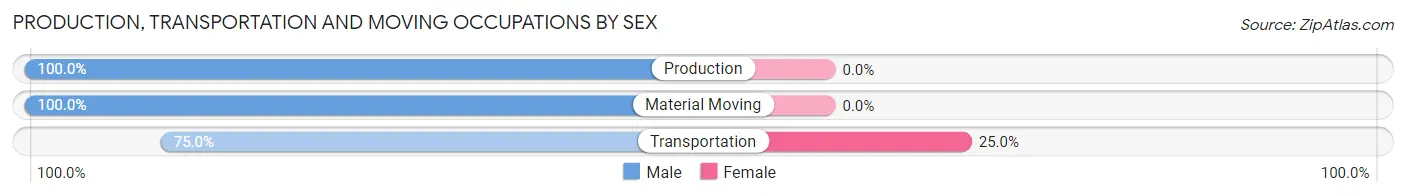
| Occupation | Male | Female |
| Production | 6 (100.0%) | 0 (0.0%) |
| Transportation | 9 (75.0%) | 3 (25.0%) |
| Material Moving | 29 (100.0%) | 0 (0.0%) |
| Total (Category) | 44 (93.6%) | 3 (6.4%) |
| Total (Overall) | 165 (50.0%) | 165 (50.0%) |
Employment Industries by Sex in St Mary s
Employment Industries in St Mary s
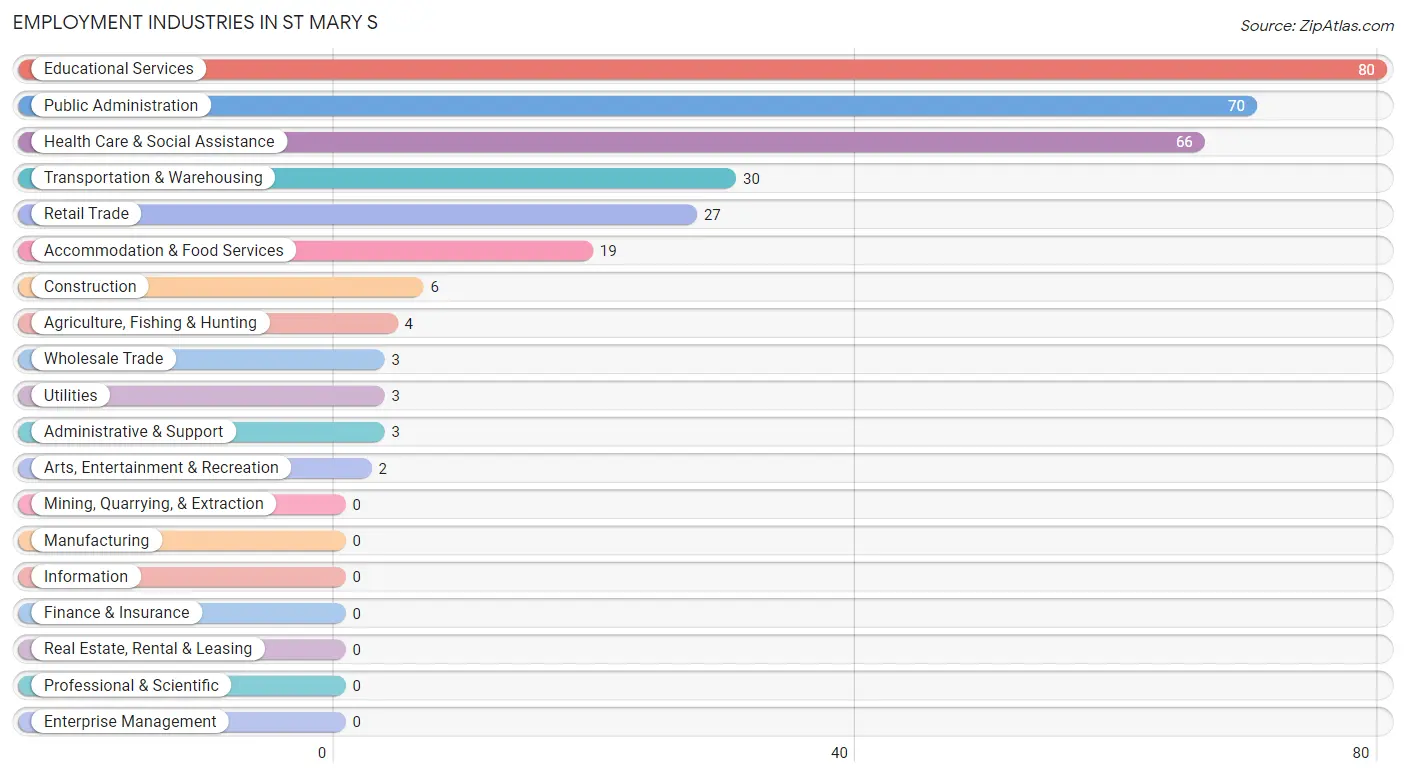
The major employment industries in St Mary s include Educational Services (80 | 24.2%), Public Administration (70 | 21.2%), Health Care & Social Assistance (66 | 20.0%), Transportation & Warehousing (30 | 9.1%), and Retail Trade (27 | 8.2%).
Employment Industries by Sex in St Mary s
The St Mary s industries that see more men than women are Agriculture, Fishing & Hunting (100.0%), Construction (100.0%), and Wholesale Trade (100.0%), whereas the industries that tend to have a higher number of women are Arts, Entertainment & Recreation (100.0%), Health Care & Social Assistance (81.8%), and Educational Services (73.8%).
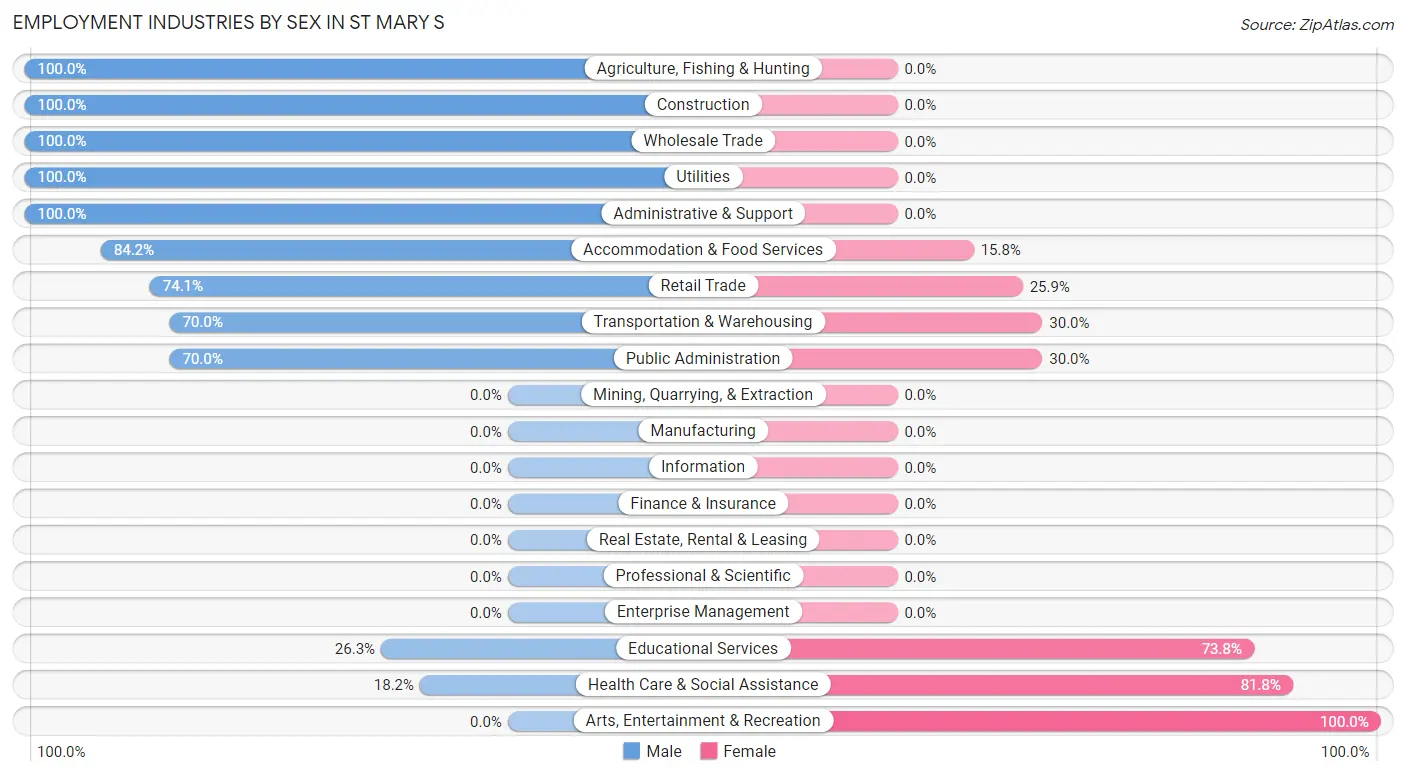
| Industry | Male | Female |
| Agriculture, Fishing & Hunting | 4 (100.0%) | 0 (0.0%) |
| Mining, Quarrying, & Extraction | 0 (0.0%) | 0 (0.0%) |
| Construction | 6 (100.0%) | 0 (0.0%) |
| Manufacturing | 0 (0.0%) | 0 (0.0%) |
| Wholesale Trade | 3 (100.0%) | 0 (0.0%) |
| Retail Trade | 20 (74.1%) | 7 (25.9%) |
| Transportation & Warehousing | 21 (70.0%) | 9 (30.0%) |
| Utilities | 3 (100.0%) | 0 (0.0%) |
| Information | 0 (0.0%) | 0 (0.0%) |
| Finance & Insurance | 0 (0.0%) | 0 (0.0%) |
| Real Estate, Rental & Leasing | 0 (0.0%) | 0 (0.0%) |
| Professional & Scientific | 0 (0.0%) | 0 (0.0%) |
| Enterprise Management | 0 (0.0%) | 0 (0.0%) |
| Administrative & Support | 3 (100.0%) | 0 (0.0%) |
| Educational Services | 21 (26.3%) | 59 (73.8%) |
| Health Care & Social Assistance | 12 (18.2%) | 54 (81.8%) |
| Arts, Entertainment & Recreation | 0 (0.0%) | 2 (100.0%) |
| Accommodation & Food Services | 16 (84.2%) | 3 (15.8%) |
| Public Administration | 49 (70.0%) | 21 (30.0%) |
| Total | 165 (50.0%) | 165 (50.0%) |
Education in St Mary s
School Enrollment in St Mary s
The most common levels of schooling among the 299 students in St Mary s are middle school (102 | 34.1%), elementary school (73 | 24.4%), and high school (60 | 20.1%).
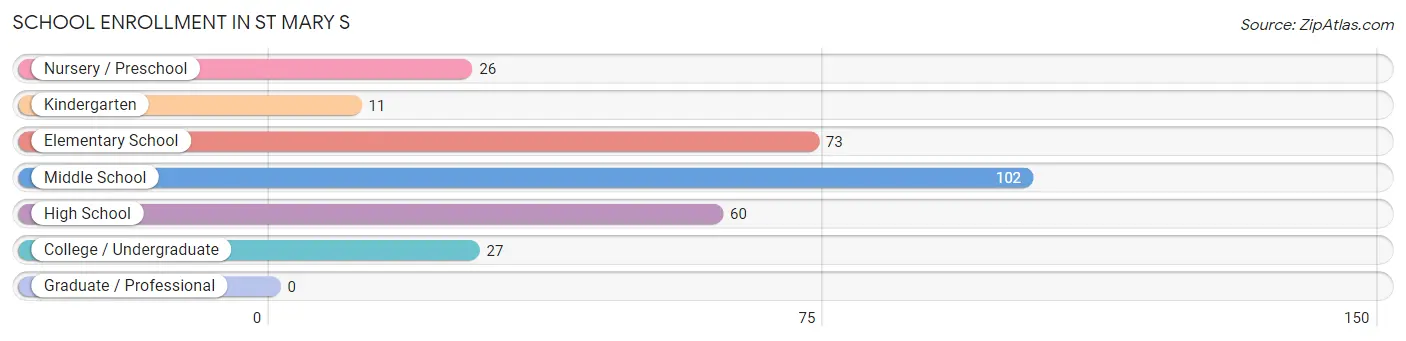
| School Level | # Students | % Students |
| Nursery / Preschool | 26 | 8.7% |
| Kindergarten | 11 | 3.7% |
| Elementary School | 73 | 24.4% |
| Middle School | 102 | 34.1% |
| High School | 60 | 20.1% |
| College / Undergraduate | 27 | 9.0% |
| Graduate / Professional | 0 | 0.0% |
| Total | 299 | 100.0% |
School Enrollment by Age by Funding Source in St Mary s
Out of a total of 299 students who are enrolled in schools in St Mary s, 8 (2.7%) attend a private institution, while the remaining 291 (97.3%) are enrolled in public schools. The age group of 5 to 9 year old has the highest likelihood of being enrolled in private schools, with 4 (6.1% in the age bracket) enrolled. Conversely, the age group of 3 to 4 year olds has the lowest likelihood of being enrolled in a private school, with 26 (100.0% in the age bracket) attending a public institution.
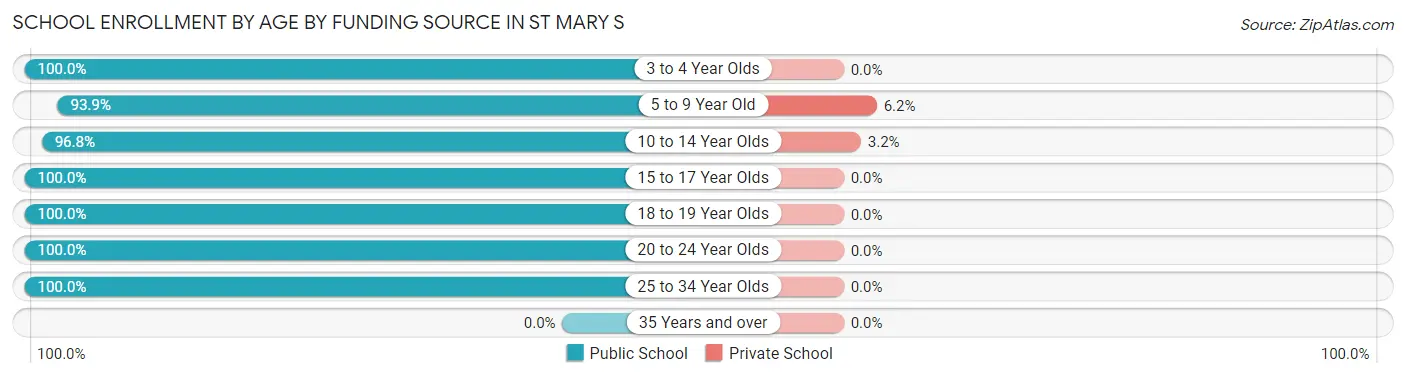
| Age Bracket | Public School | Private School |
| 3 to 4 Year Olds | 26 (100.0%) | 0 (0.0%) |
| 5 to 9 Year Old | 61 (93.9%) | 4 (6.1%) |
| 10 to 14 Year Olds | 121 (96.8%) | 4 (3.2%) |
| 15 to 17 Year Olds | 45 (100.0%) | 0 (0.0%) |
| 18 to 19 Year Olds | 24 (100.0%) | 0 (0.0%) |
| 20 to 24 Year Olds | 7 (100.0%) | 0 (0.0%) |
| 25 to 34 Year Olds | 7 (100.0%) | 0 (0.0%) |
| 35 Years and over | 0 (0.0%) | 0 (0.0%) |
| Total | 291 (97.3%) | 8 (2.7%) |
Educational Attainment by Field of Study in St Mary s
Science & technology (8 | 38.1%), engineering (4 | 19.1%), psychology (3 | 14.3%), bio, nature & agricultural (2 | 9.5%), and arts & humanities (2 | 9.5%) are the most common fields of study among 21 individuals in St Mary s who have obtained a bachelor's degree or higher.
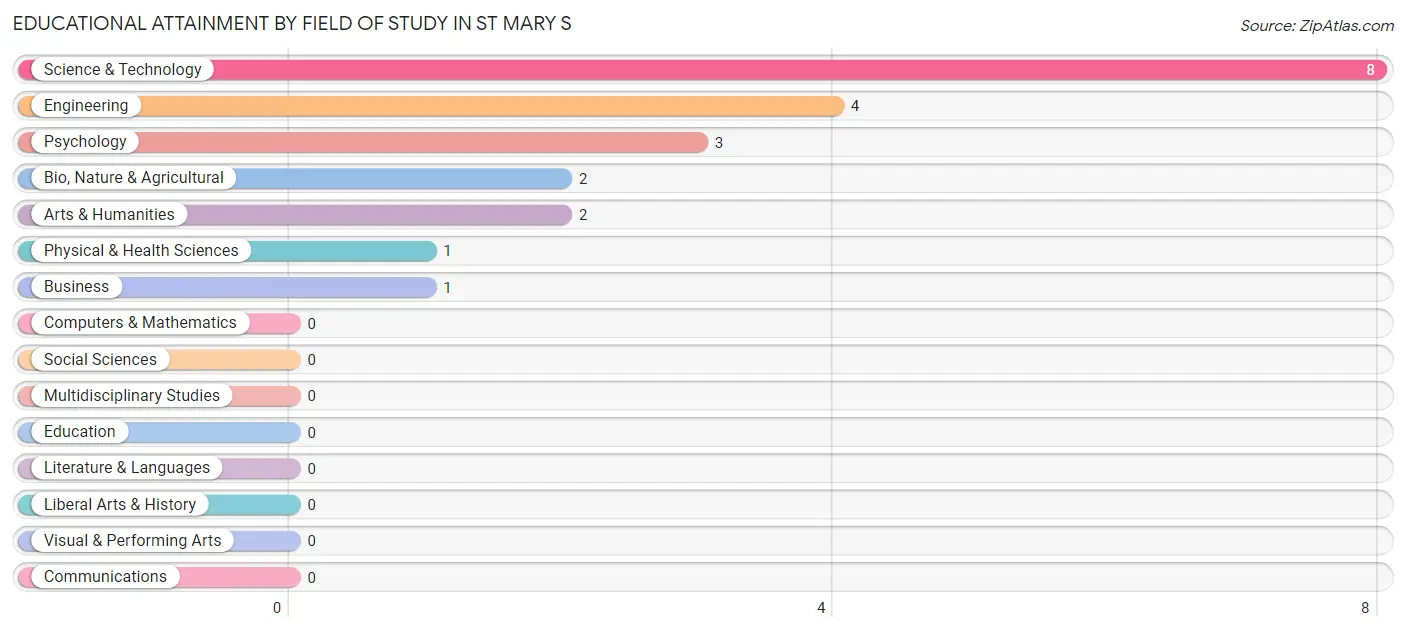
| Field of Study | # Graduates | % Graduates |
| Computers & Mathematics | 0 | 0.0% |
| Bio, Nature & Agricultural | 2 | 9.5% |
| Physical & Health Sciences | 1 | 4.8% |
| Psychology | 3 | 14.3% |
| Social Sciences | 0 | 0.0% |
| Engineering | 4 | 19.1% |
| Multidisciplinary Studies | 0 | 0.0% |
| Science & Technology | 8 | 38.1% |
| Business | 1 | 4.8% |
| Education | 0 | 0.0% |
| Literature & Languages | 0 | 0.0% |
| Liberal Arts & History | 0 | 0.0% |
| Visual & Performing Arts | 0 | 0.0% |
| Communications | 0 | 0.0% |
| Arts & Humanities | 2 | 9.5% |
| Total | 21 | 100.0% |
Transportation & Commute in St Mary s
Vehicle Availability by Sex in St Mary s
The most prevalent vehicle ownership categories in St Mary s are males with 1 vehicle (75, accounting for 45.5%) and females with 1 vehicle (62, making up 49.0%).
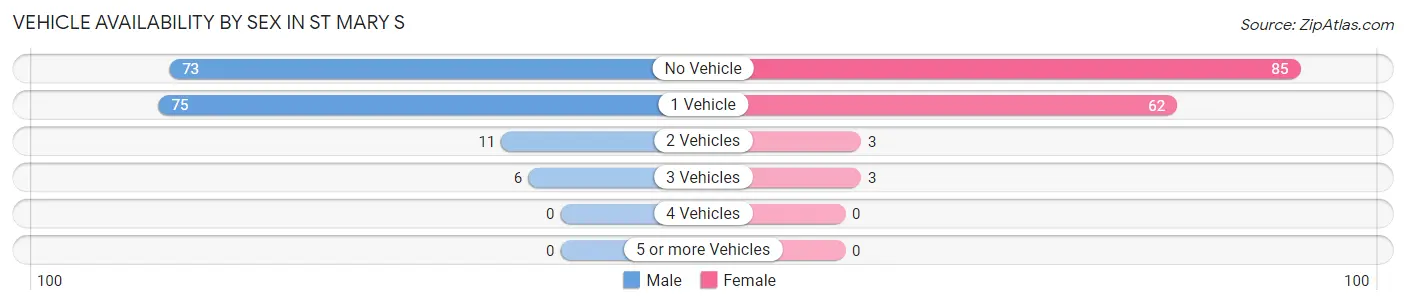
| Vehicles Available | Male | Female |
| No Vehicle | 73 (44.2%) | 85 (55.6%) |
| 1 Vehicle | 75 (45.5%) | 62 (40.5%) |
| 2 Vehicles | 11 (6.7%) | 3 (2.0%) |
| 3 Vehicles | 6 (3.6%) | 3 (2.0%) |
| 4 Vehicles | 0 (0.0%) | 0 (0.0%) |
| 5 or more Vehicles | 0 (0.0%) | 0 (0.0%) |
| Total | 165 (100.0%) | 153 (100.0%) |
Commute Time in St Mary s
The most frequently occuring commute durations in St Mary s are less than 5 minutes (137 commuters, 46.4%), 5 to 9 minutes (79 commuters, 26.8%), and 10 to 14 minutes (49 commuters, 16.6%).
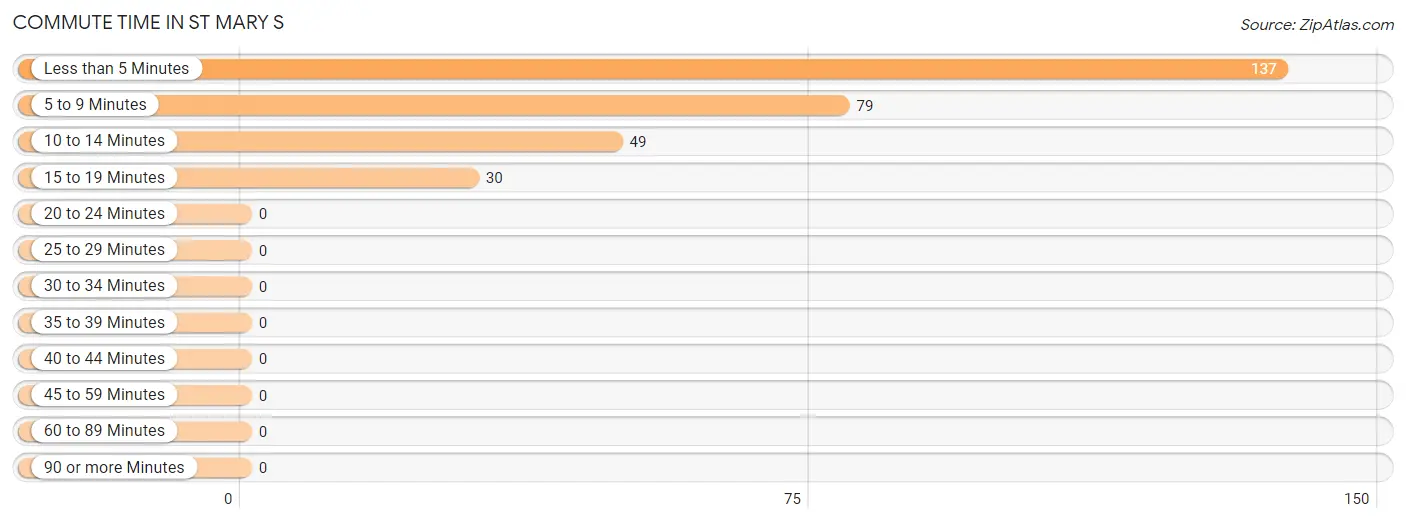
| Commute Time | # Commuters | % Commuters |
| Less than 5 Minutes | 137 | 46.4% |
| 5 to 9 Minutes | 79 | 26.8% |
| 10 to 14 Minutes | 49 | 16.6% |
| 15 to 19 Minutes | 30 | 10.2% |
| 20 to 24 Minutes | 0 | 0.0% |
| 25 to 29 Minutes | 0 | 0.0% |
| 30 to 34 Minutes | 0 | 0.0% |
| 35 to 39 Minutes | 0 | 0.0% |
| 40 to 44 Minutes | 0 | 0.0% |
| 45 to 59 Minutes | 0 | 0.0% |
| 60 to 89 Minutes | 0 | 0.0% |
| 90 or more Minutes | 0 | 0.0% |
Commute Time by Sex in St Mary s
The most common commute times in St Mary s are less than 5 minutes (56 commuters, 38.1%) for males and less than 5 minutes (81 commuters, 54.7%) for females.
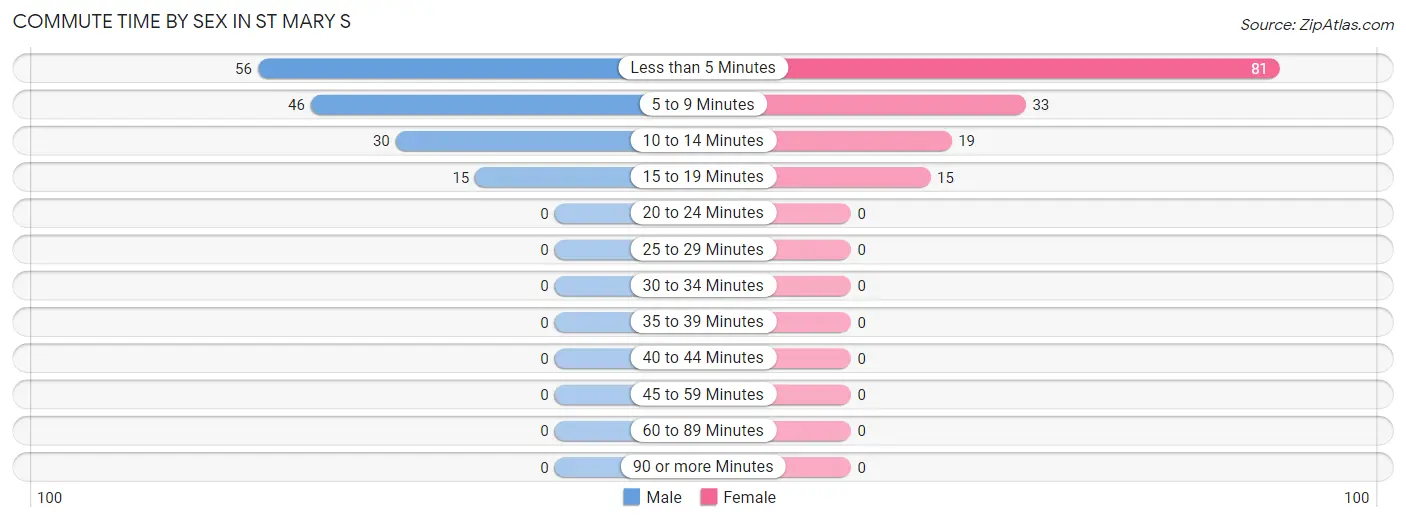
| Commute Time | Male | Female |
| Less than 5 Minutes | 56 (38.1%) | 81 (54.7%) |
| 5 to 9 Minutes | 46 (31.3%) | 33 (22.3%) |
| 10 to 14 Minutes | 30 (20.4%) | 19 (12.8%) |
| 15 to 19 Minutes | 15 (10.2%) | 15 (10.1%) |
| 20 to 24 Minutes | 0 (0.0%) | 0 (0.0%) |
| 25 to 29 Minutes | 0 (0.0%) | 0 (0.0%) |
| 30 to 34 Minutes | 0 (0.0%) | 0 (0.0%) |
| 35 to 39 Minutes | 0 (0.0%) | 0 (0.0%) |
| 40 to 44 Minutes | 0 (0.0%) | 0 (0.0%) |
| 45 to 59 Minutes | 0 (0.0%) | 0 (0.0%) |
| 60 to 89 Minutes | 0 (0.0%) | 0 (0.0%) |
| 90 or more Minutes | 0 (0.0%) | 0 (0.0%) |
Time of Departure to Work by Sex in St Mary s
The most frequent times of departure to work in St Mary s are 8:30 AM to 8:59 AM (40, 27.2%) for males and 8:00 AM to 8:29 AM (60, 40.5%) for females.
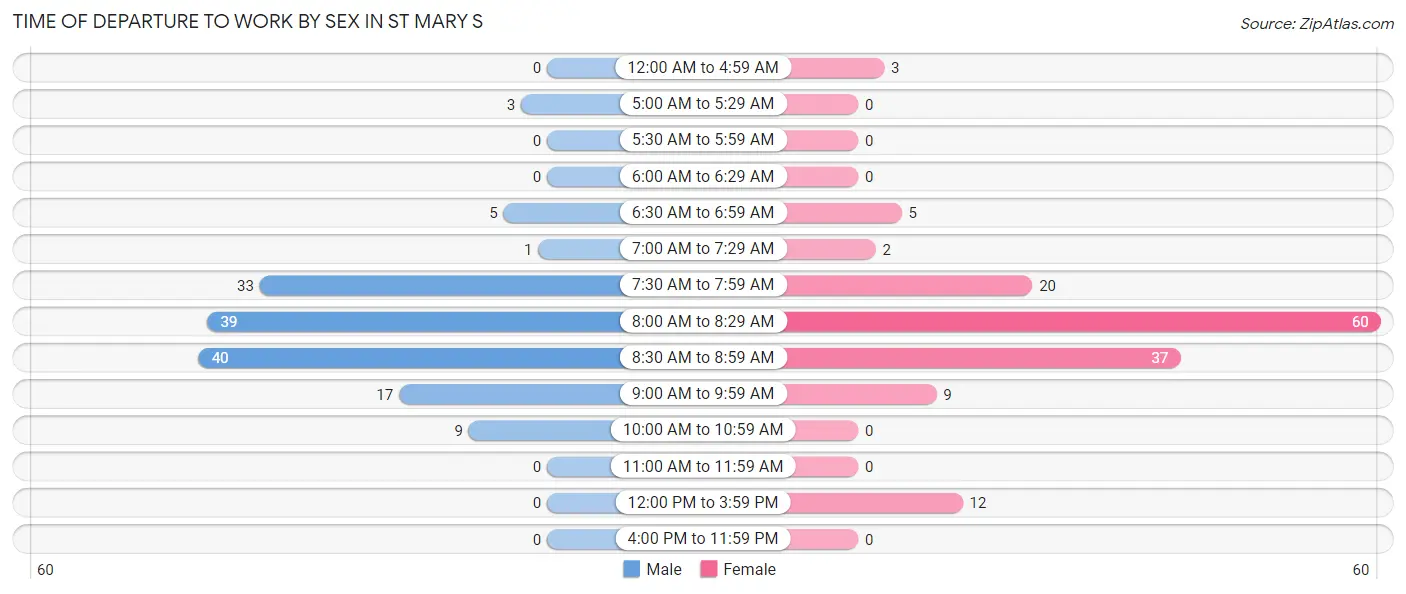
| Time of Departure | Male | Female |
| 12:00 AM to 4:59 AM | 0 (0.0%) | 3 (2.0%) |
| 5:00 AM to 5:29 AM | 3 (2.0%) | 0 (0.0%) |
| 5:30 AM to 5:59 AM | 0 (0.0%) | 0 (0.0%) |
| 6:00 AM to 6:29 AM | 0 (0.0%) | 0 (0.0%) |
| 6:30 AM to 6:59 AM | 5 (3.4%) | 5 (3.4%) |
| 7:00 AM to 7:29 AM | 1 (0.7%) | 2 (1.3%) |
| 7:30 AM to 7:59 AM | 33 (22.5%) | 20 (13.5%) |
| 8:00 AM to 8:29 AM | 39 (26.5%) | 60 (40.5%) |
| 8:30 AM to 8:59 AM | 40 (27.2%) | 37 (25.0%) |
| 9:00 AM to 9:59 AM | 17 (11.6%) | 9 (6.1%) |
| 10:00 AM to 10:59 AM | 9 (6.1%) | 0 (0.0%) |
| 11:00 AM to 11:59 AM | 0 (0.0%) | 0 (0.0%) |
| 12:00 PM to 3:59 PM | 0 (0.0%) | 12 (8.1%) |
| 4:00 PM to 11:59 PM | 0 (0.0%) | 0 (0.0%) |
| Total | 147 (100.0%) | 148 (100.0%) |
Housing Occupancy in St Mary s
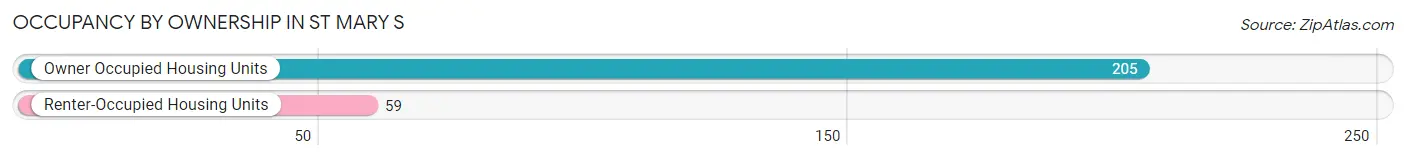
Occupancy by Ownership in St Mary s
Of the total 264 dwellings in St Mary s, owner-occupied units account for 205 (77.6%), while renter-occupied units make up 59 (22.4%).
| Occupancy | # Housing Units | % Housing Units |
| Owner Occupied Housing Units | 205 | 77.6% |
| Renter-Occupied Housing Units | 59 | 22.4% |
| Total Occupied Housing Units | 264 | 100.0% |
Occupancy by Household Size in St Mary s
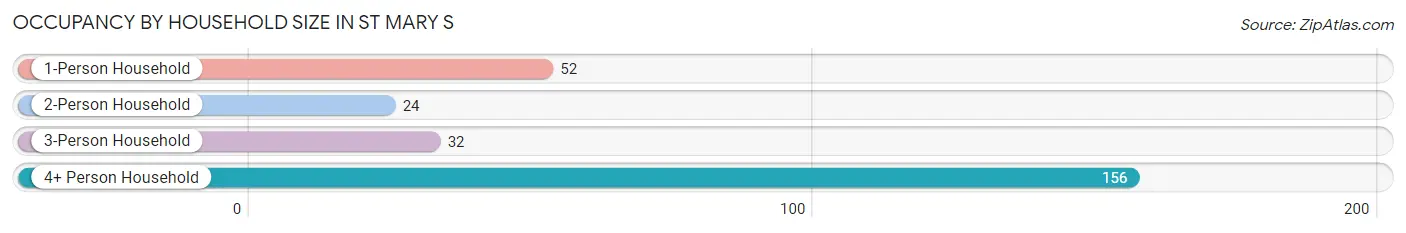
| Household Size | # Housing Units | % Housing Units |
| 1-Person Household | 52 | 19.7% |
| 2-Person Household | 24 | 9.1% |
| 3-Person Household | 32 | 12.1% |
| 4+ Person Household | 156 | 59.1% |
| Total Housing Units | 264 | 100.0% |
Occupancy by Ownership by Household Size in St Mary s
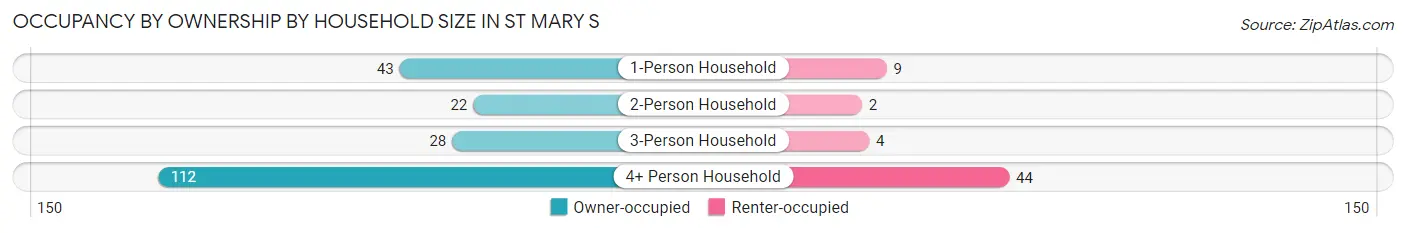
| Household Size | Owner-occupied | Renter-occupied |
| 1-Person Household | 43 (82.7%) | 9 (17.3%) |
| 2-Person Household | 22 (91.7%) | 2 (8.3%) |
| 3-Person Household | 28 (87.5%) | 4 (12.5%) |
| 4+ Person Household | 112 (71.8%) | 44 (28.2%) |
| Total Housing Units | 205 (77.6%) | 59 (22.4%) |
Occupancy by Educational Attainment in St Mary s
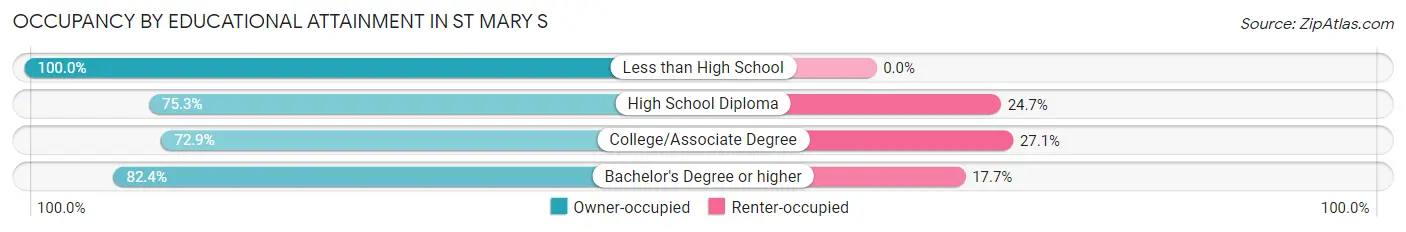
| Household Size | Owner-occupied | Renter-occupied |
| Less than High School | 26 (100.0%) | 0 (0.0%) |
| High School Diploma | 122 (75.3%) | 40 (24.7%) |
| College/Associate Degree | 43 (72.9%) | 16 (27.1%) |
| Bachelor's Degree or higher | 14 (82.4%) | 3 (17.6%) |
Occupancy by Age of Householder in St Mary s
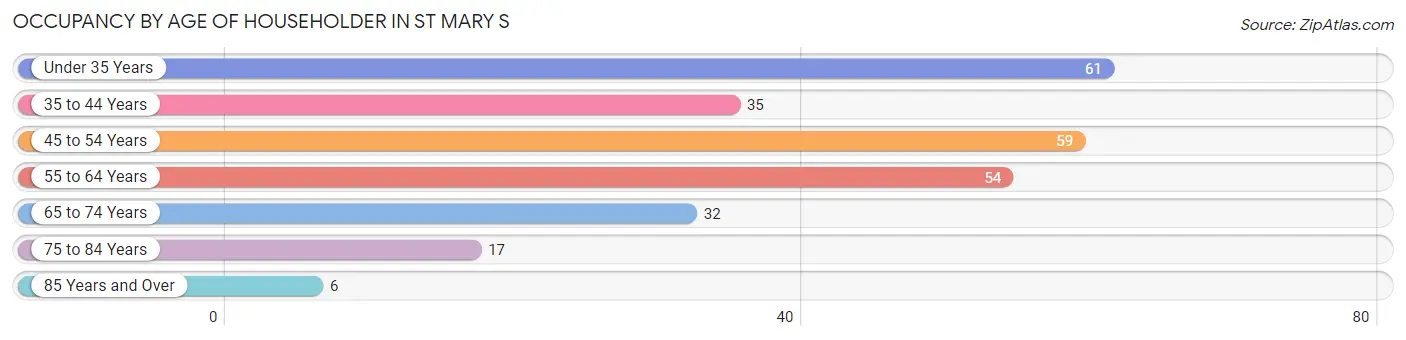
| Age Bracket | # Households | % Households |
| Under 35 Years | 61 | 23.1% |
| 35 to 44 Years | 35 | 13.3% |
| 45 to 54 Years | 59 | 22.4% |
| 55 to 64 Years | 54 | 20.4% |
| 65 to 74 Years | 32 | 12.1% |
| 75 to 84 Years | 17 | 6.4% |
| 85 Years and Over | 6 | 2.3% |
| Total | 264 | 100.0% |
Housing Finances in St Mary s
Median Income by Occupancy in St Mary s
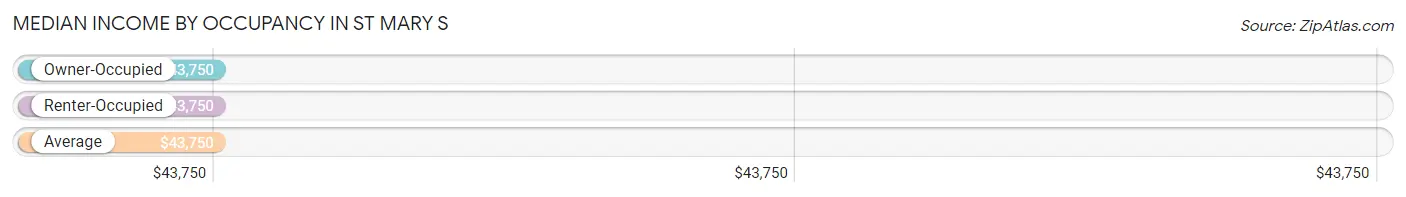
| Occupancy Type | # Households | Median Income |
| Owner-Occupied | 205 (77.6%) | $43,750 |
| Renter-Occupied | 59 (22.4%) | $43,750 |
| Average | 264 (100.0%) | $43,750 |
Occupancy by Householder Income Bracket in St Mary s
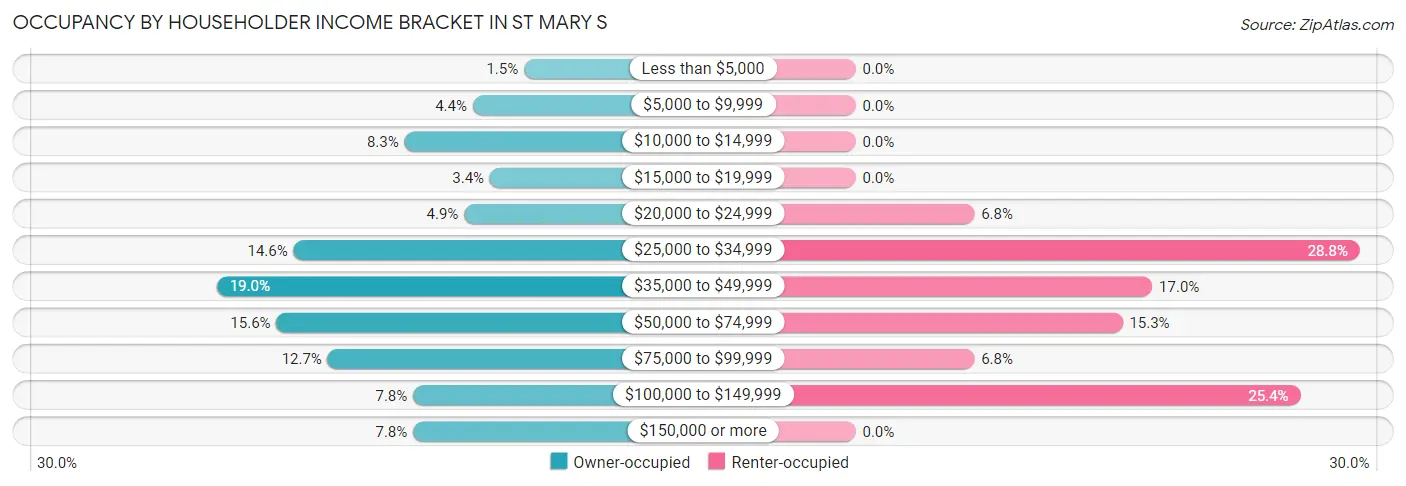
| Income Bracket | Owner-occupied | Renter-occupied |
| Less than $5,000 | 3 (1.5%) | 0 (0.0%) |
| $5,000 to $9,999 | 9 (4.4%) | 0 (0.0%) |
| $10,000 to $14,999 | 17 (8.3%) | 0 (0.0%) |
| $15,000 to $19,999 | 7 (3.4%) | 0 (0.0%) |
| $20,000 to $24,999 | 10 (4.9%) | 4 (6.8%) |
| $25,000 to $34,999 | 30 (14.6%) | 17 (28.8%) |
| $35,000 to $49,999 | 39 (19.0%) | 10 (17.0%) |
| $50,000 to $74,999 | 32 (15.6%) | 9 (15.2%) |
| $75,000 to $99,999 | 26 (12.7%) | 4 (6.8%) |
| $100,000 to $149,999 | 16 (7.8%) | 15 (25.4%) |
| $150,000 or more | 16 (7.8%) | 0 (0.0%) |
| Total | 205 (100.0%) | 59 (100.0%) |
Monthly Housing Cost Tiers in St Mary s
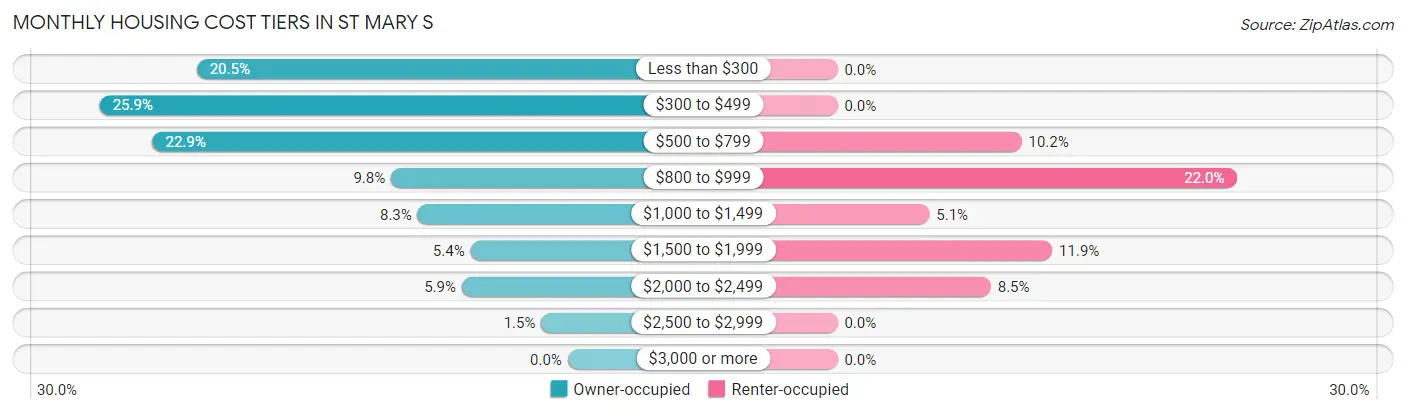
| Monthly Cost | Owner-occupied | Renter-occupied |
| Less than $300 | 42 (20.5%) | 0 (0.0%) |
| $300 to $499 | 53 (25.9%) | 0 (0.0%) |
| $500 to $799 | 47 (22.9%) | 6 (10.2%) |
| $800 to $999 | 20 (9.8%) | 13 (22.0%) |
| $1,000 to $1,499 | 17 (8.3%) | 3 (5.1%) |
| $1,500 to $1,999 | 11 (5.4%) | 7 (11.9%) |
| $2,000 to $2,499 | 12 (5.9%) | 5 (8.5%) |
| $2,500 to $2,999 | 3 (1.5%) | 0 (0.0%) |
| $3,000 or more | 0 (0.0%) | 0 (0.0%) |
| Total | 205 (100.0%) | 59 (100.0%) |
Physical Housing Characteristics in St Mary s
Housing Structures in St Mary s
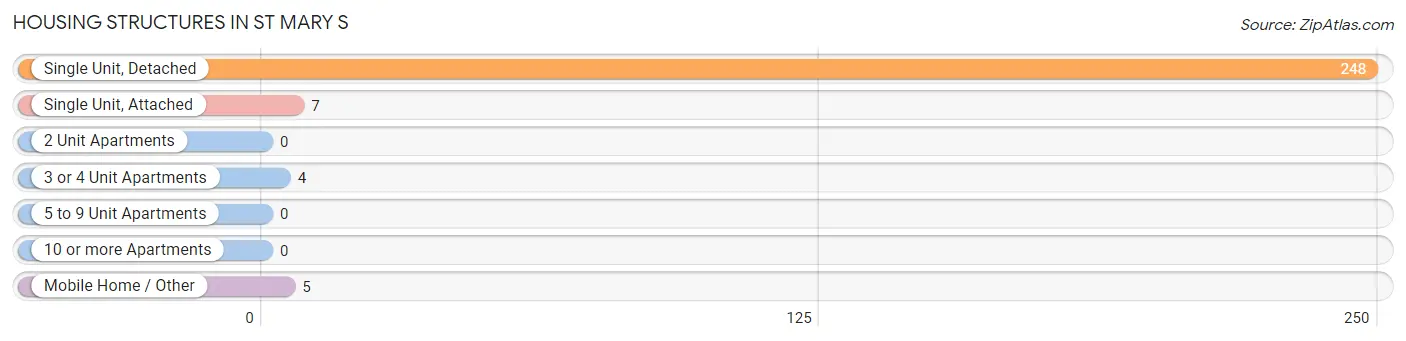
| Structure Type | # Housing Units | % Housing Units |
| Single Unit, Detached | 248 | 93.9% |
| Single Unit, Attached | 7 | 2.6% |
| 2 Unit Apartments | 0 | 0.0% |
| 3 or 4 Unit Apartments | 4 | 1.5% |
| 5 to 9 Unit Apartments | 0 | 0.0% |
| 10 or more Apartments | 0 | 0.0% |
| Mobile Home / Other | 5 | 1.9% |
| Total | 264 | 100.0% |
Housing Structures by Occupancy in St Mary s
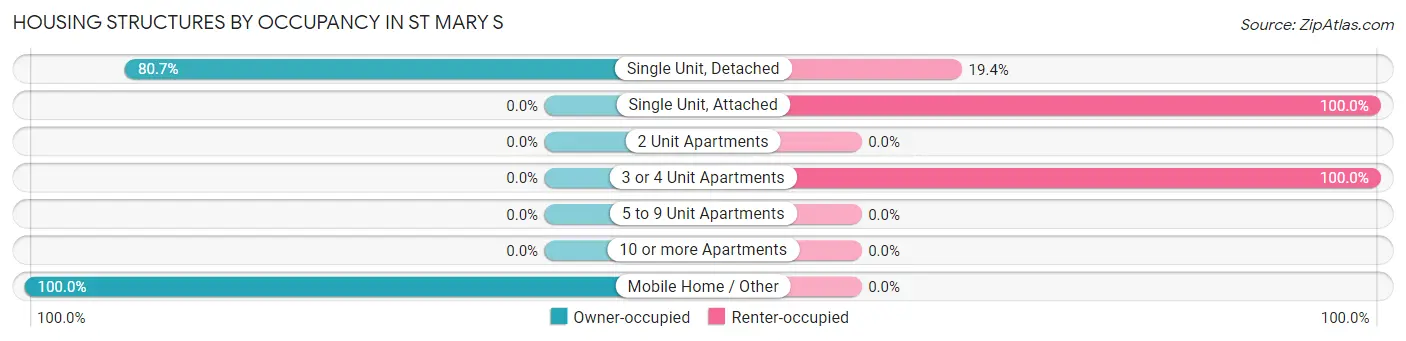
| Structure Type | Owner-occupied | Renter-occupied |
| Single Unit, Detached | 200 (80.6%) | 48 (19.4%) |
| Single Unit, Attached | 0 (0.0%) | 7 (100.0%) |
| 2 Unit Apartments | 0 (0.0%) | 0 (0.0%) |
| 3 or 4 Unit Apartments | 0 (0.0%) | 4 (100.0%) |
| 5 to 9 Unit Apartments | 0 (0.0%) | 0 (0.0%) |
| 10 or more Apartments | 0 (0.0%) | 0 (0.0%) |
| Mobile Home / Other | 5 (100.0%) | 0 (0.0%) |
| Total | 205 (77.6%) | 59 (22.4%) |
Housing Structures by Number of Rooms in St Mary s
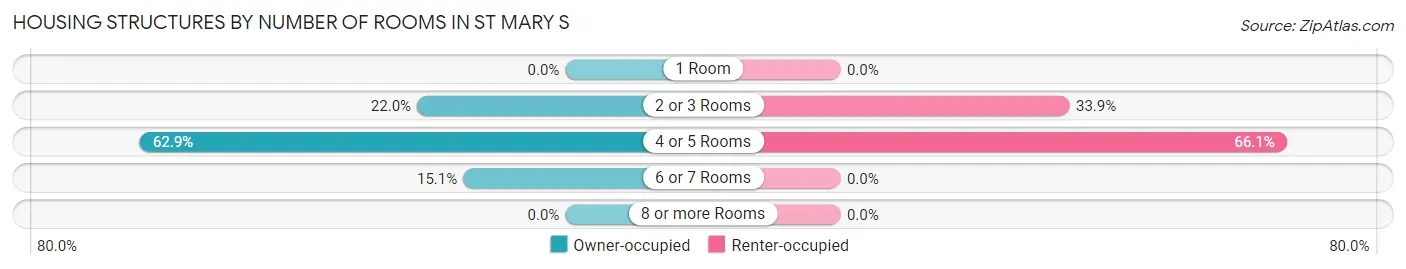
| Number of Rooms | Owner-occupied | Renter-occupied |
| 1 Room | 0 (0.0%) | 0 (0.0%) |
| 2 or 3 Rooms | 45 (22.0%) | 20 (33.9%) |
| 4 or 5 Rooms | 129 (62.9%) | 39 (66.1%) |
| 6 or 7 Rooms | 31 (15.1%) | 0 (0.0%) |
| 8 or more Rooms | 0 (0.0%) | 0 (0.0%) |
| Total | 205 (100.0%) | 59 (100.0%) |
Housing Structure by Heating Type in St Mary s
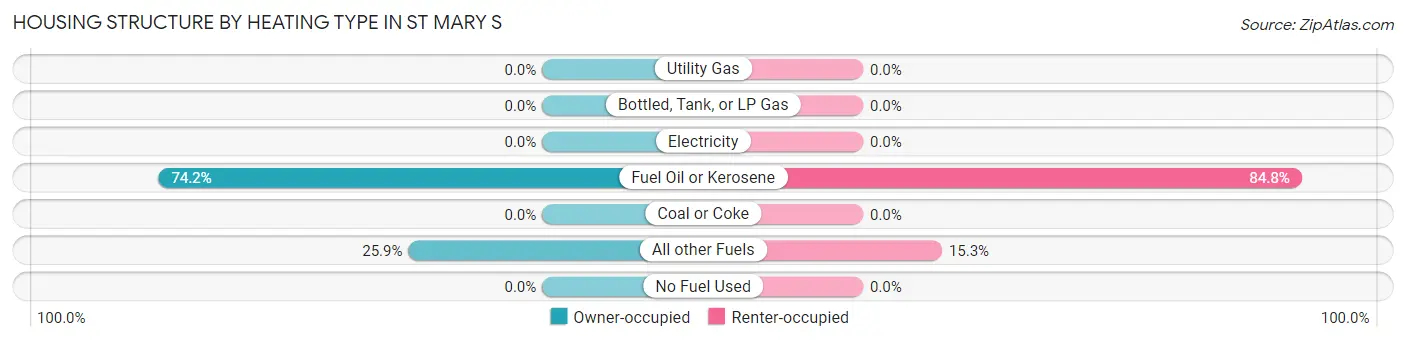
| Heating Type | Owner-occupied | Renter-occupied |
| Utility Gas | 0 (0.0%) | 0 (0.0%) |
| Bottled, Tank, or LP Gas | 0 (0.0%) | 0 (0.0%) |
| Electricity | 0 (0.0%) | 0 (0.0%) |
| Fuel Oil or Kerosene | 152 (74.2%) | 50 (84.8%) |
| Coal or Coke | 0 (0.0%) | 0 (0.0%) |
| All other Fuels | 53 (25.9%) | 9 (15.2%) |
| No Fuel Used | 0 (0.0%) | 0 (0.0%) |
| Total | 205 (100.0%) | 59 (100.0%) |
Household Vehicle Usage in St Mary s
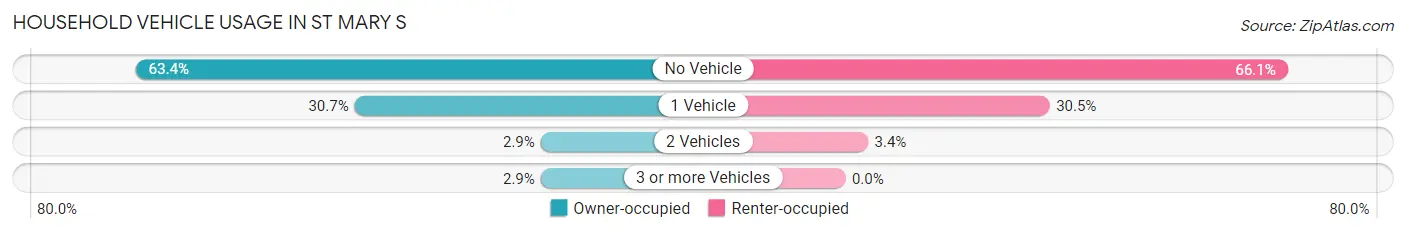
| Vehicles per Household | Owner-occupied | Renter-occupied |
| No Vehicle | 130 (63.4%) | 39 (66.1%) |
| 1 Vehicle | 63 (30.7%) | 18 (30.5%) |
| 2 Vehicles | 6 (2.9%) | 2 (3.4%) |
| 3 or more Vehicles | 6 (2.9%) | 0 (0.0%) |
| Total | 205 (100.0%) | 59 (100.0%) |
Real Estate & Mortgages in St Mary s
Real Estate and Mortgage Overview in St Mary s
| Characteristic | Without Mortgage | With Mortgage |
| Housing Units | 128 | 77 |
| Median Property Value | $56,500 | $159,400 |
| Median Household Income | $37,500 | $9 |
| Monthly Housing Costs | $372 | $0 |
| Real Estate Taxes | - | - |
Property Value by Mortgage Status in St Mary s
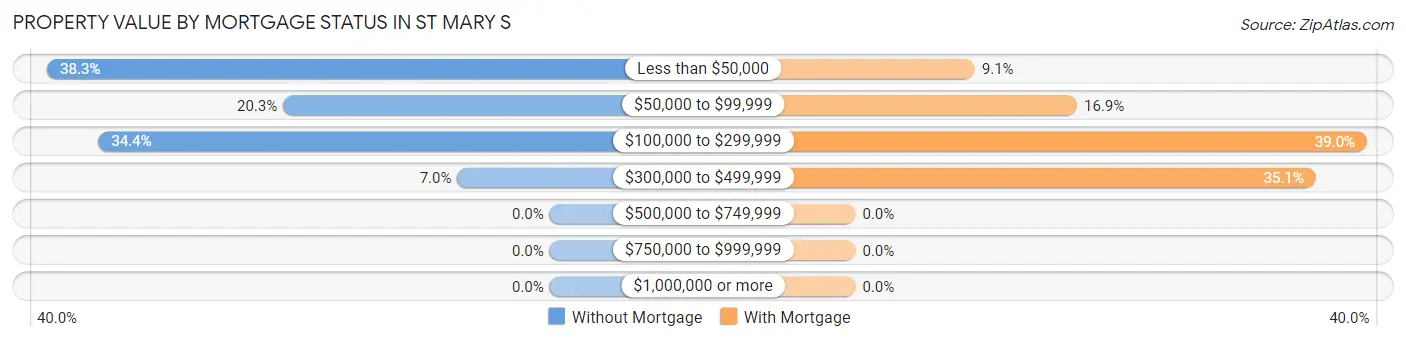
| Property Value | Without Mortgage | With Mortgage |
| Less than $50,000 | 49 (38.3%) | 7 (9.1%) |
| $50,000 to $99,999 | 26 (20.3%) | 13 (16.9%) |
| $100,000 to $299,999 | 44 (34.4%) | 30 (39.0%) |
| $300,000 to $499,999 | 9 (7.0%) | 27 (35.1%) |
| $500,000 to $749,999 | 0 (0.0%) | 0 (0.0%) |
| $750,000 to $999,999 | 0 (0.0%) | 0 (0.0%) |
| $1,000,000 or more | 0 (0.0%) | 0 (0.0%) |
| Total | 128 (100.0%) | 77 (100.0%) |
Household Income by Mortgage Status in St Mary s
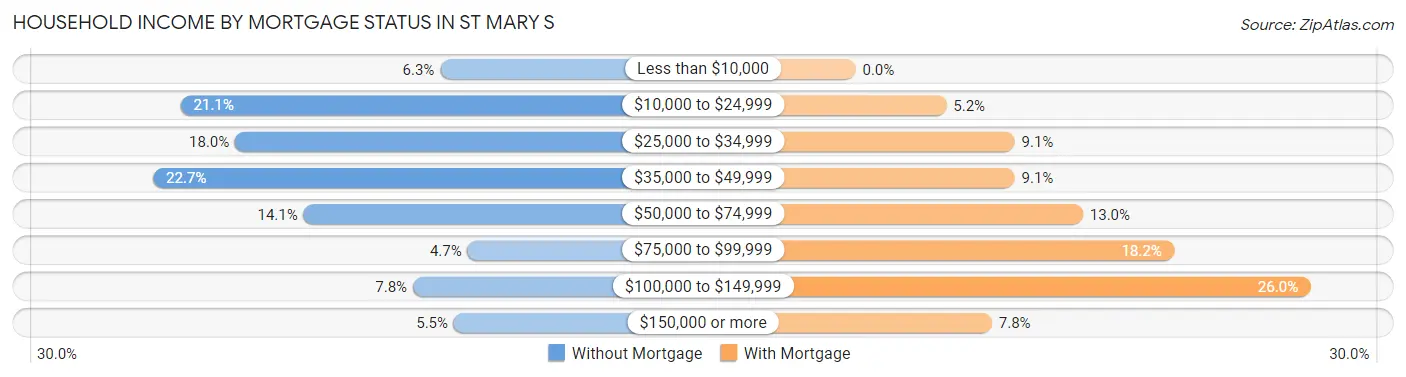
| Household Income | Without Mortgage | With Mortgage |
| Less than $10,000 | 8 (6.2%) | 0 (0.0%) |
| $10,000 to $24,999 | 27 (21.1%) | 4 (5.2%) |
| $25,000 to $34,999 | 23 (18.0%) | 7 (9.1%) |
| $35,000 to $49,999 | 29 (22.7%) | 7 (9.1%) |
| $50,000 to $74,999 | 18 (14.1%) | 10 (13.0%) |
| $75,000 to $99,999 | 6 (4.7%) | 14 (18.2%) |
| $100,000 to $149,999 | 10 (7.8%) | 20 (26.0%) |
| $150,000 or more | 7 (5.5%) | 6 (7.8%) |
| Total | 128 (100.0%) | 77 (100.0%) |
Property Value to Household Income Ratio in St Mary s
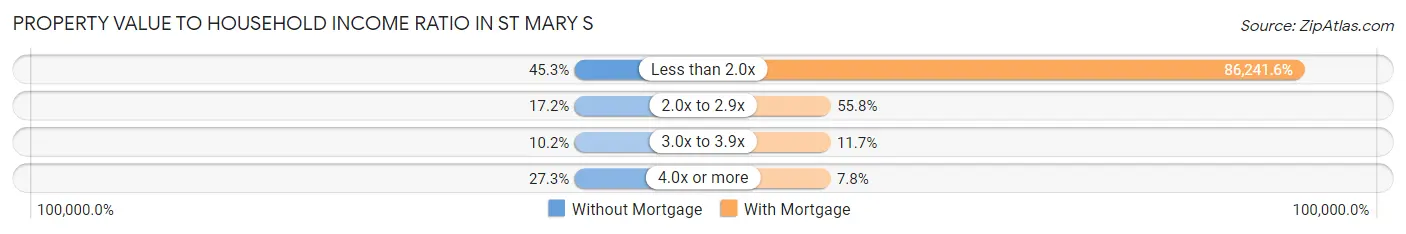
| Value-to-Income Ratio | Without Mortgage | With Mortgage |
| Less than 2.0x | 58 (45.3%) | 66,406 (86,241.6%) |
| 2.0x to 2.9x | 22 (17.2%) | 43 (55.8%) |
| 3.0x to 3.9x | 13 (10.2%) | 9 (11.7%) |
| 4.0x or more | 35 (27.3%) | 6 (7.8%) |
| Total | 128 (100.0%) | 77 (100.0%) |
Real Estate Taxes by Mortgage Status in St Mary s
| Property Taxes | Without Mortgage | With Mortgage |
| Less than $800 | 0 (0.0%) | 0 (0.0%) |
| $800 to $1,499 | 0 (0.0%) | 0 (0.0%) |
| $800 to $1,499 | 0 (0.0%) | 0 (0.0%) |
| Total | 128 (100.0%) | 77 (100.0%) |
Health & Disability in St Mary s
Health Insurance Coverage by Age in St Mary s
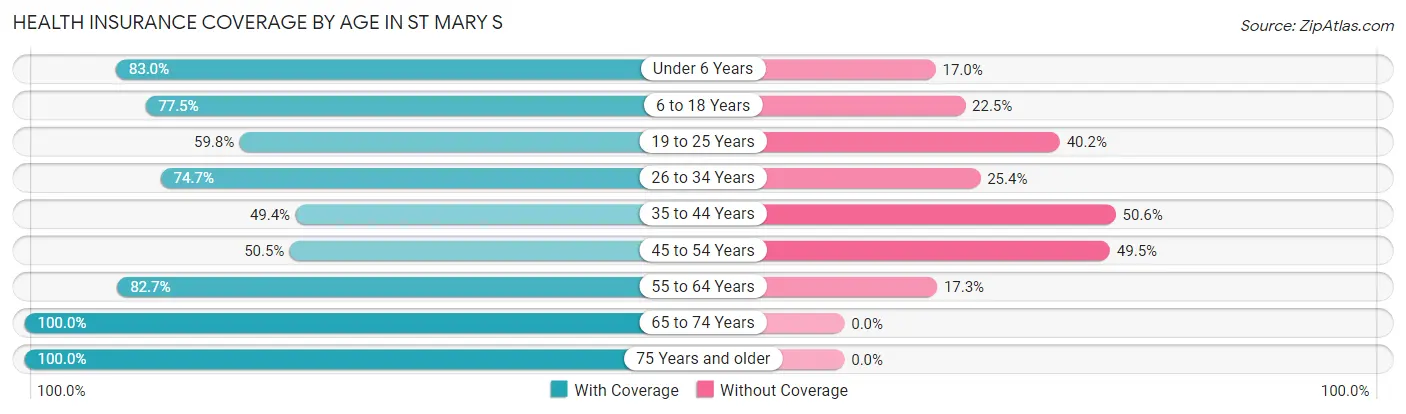
| Age Bracket | With Coverage | Without Coverage |
| Under 6 Years | 117 (83.0%) | 24 (17.0%) |
| 6 to 18 Years | 196 (77.5%) | 57 (22.5%) |
| 19 to 25 Years | 70 (59.8%) | 47 (40.2%) |
| 26 to 34 Years | 106 (74.7%) | 36 (25.4%) |
| 35 to 44 Years | 41 (49.4%) | 42 (50.6%) |
| 45 to 54 Years | 54 (50.5%) | 53 (49.5%) |
| 55 to 64 Years | 67 (82.7%) | 14 (17.3%) |
| 65 to 74 Years | 39 (100.0%) | 0 (0.0%) |
| 75 Years and older | 27 (100.0%) | 0 (0.0%) |
| Total | 717 (72.4%) | 273 (27.6%) |
Health Insurance Coverage by Citizenship Status in St Mary s
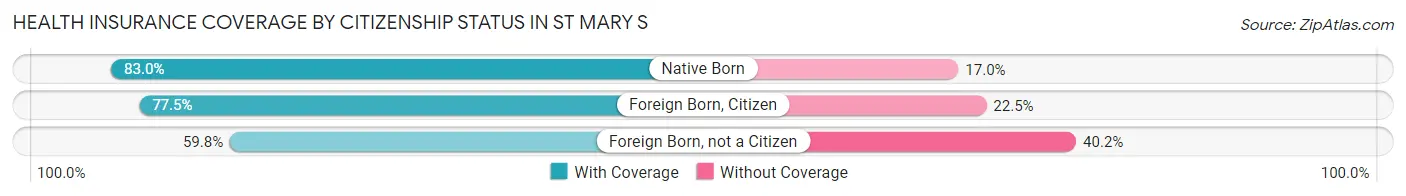
| Citizenship Status | With Coverage | Without Coverage |
| Native Born | 117 (83.0%) | 24 (17.0%) |
| Foreign Born, Citizen | 196 (77.5%) | 57 (22.5%) |
| Foreign Born, not a Citizen | 70 (59.8%) | 47 (40.2%) |
Health Insurance Coverage by Household Income in St Mary s
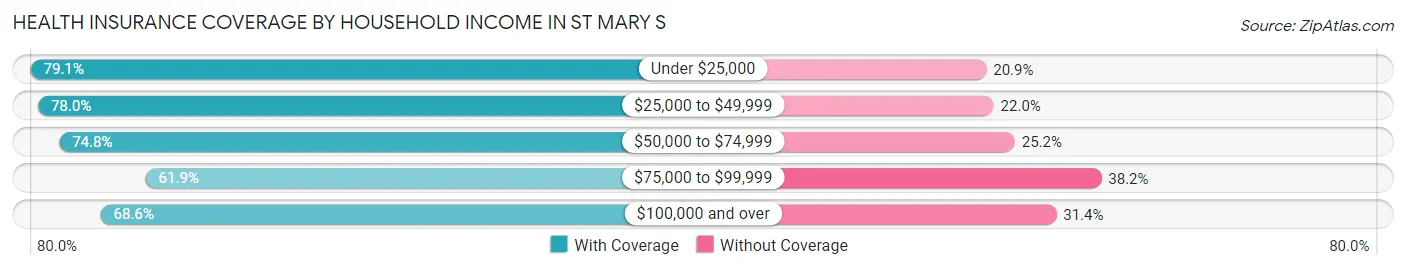
| Household Income | With Coverage | Without Coverage |
| Under $25,000 | 87 (79.1%) | 23 (20.9%) |
| $25,000 to $49,999 | 248 (78.0%) | 70 (22.0%) |
| $50,000 to $74,999 | 98 (74.8%) | 33 (25.2%) |
| $75,000 to $99,999 | 107 (61.9%) | 66 (38.2%) |
| $100,000 and over | 177 (68.6%) | 81 (31.4%) |
Public vs Private Health Insurance Coverage by Age in St Mary s
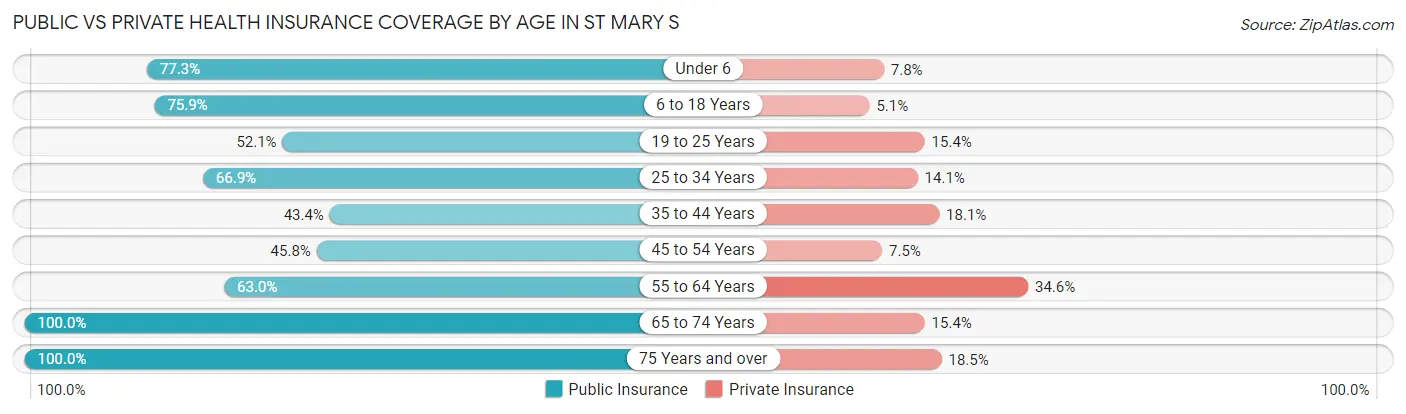
| Age Bracket | Public Insurance | Private Insurance |
| Under 6 | 109 (77.3%) | 11 (7.8%) |
| 6 to 18 Years | 192 (75.9%) | 13 (5.1%) |
| 19 to 25 Years | 61 (52.1%) | 18 (15.4%) |
| 25 to 34 Years | 95 (66.9%) | 20 (14.1%) |
| 35 to 44 Years | 36 (43.4%) | 15 (18.1%) |
| 45 to 54 Years | 49 (45.8%) | 8 (7.5%) |
| 55 to 64 Years | 51 (63.0%) | 28 (34.6%) |
| 65 to 74 Years | 39 (100.0%) | 6 (15.4%) |
| 75 Years and over | 27 (100.0%) | 5 (18.5%) |
| Total | 659 (66.6%) | 124 (12.5%) |
Disability Status by Sex by Age in St Mary s
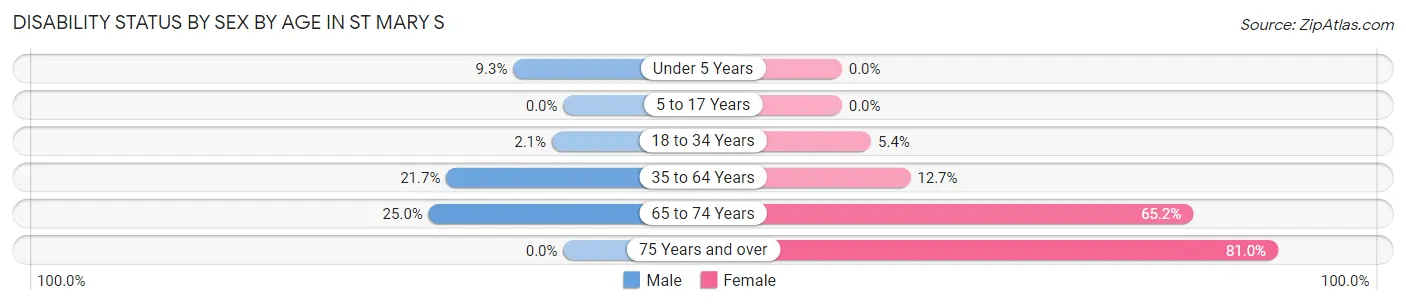
| Age Bracket | Male | Female |
| Under 5 Years | 4 (9.3%) | 0 (0.0%) |
| 5 to 17 Years | 0 (0.0%) | 0 (0.0%) |
| 18 to 34 Years | 3 (2.1%) | 8 (5.4%) |
| 35 to 64 Years | 35 (21.7%) | 14 (12.7%) |
| 65 to 74 Years | 4 (25.0%) | 15 (65.2%) |
| 75 Years and over | 0 (0.0%) | 17 (80.9%) |
Disability Class by Sex by Age in St Mary s
Disability Class: Hearing Difficulty
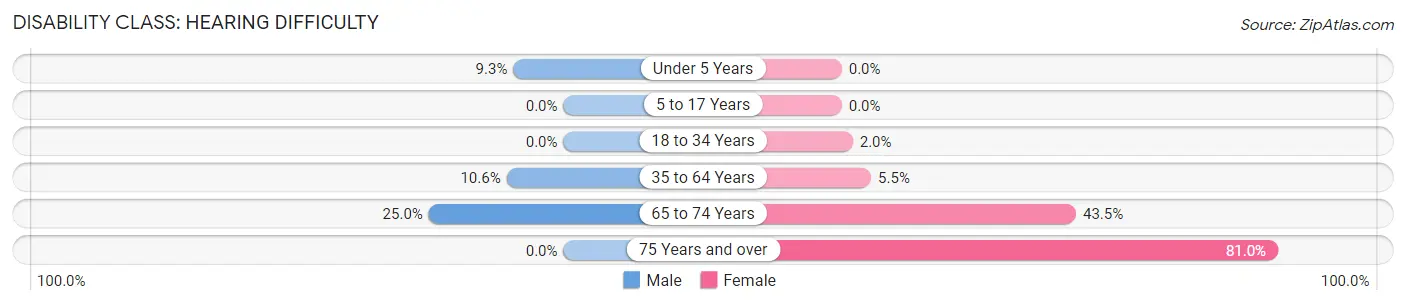
| Age Bracket | Male | Female |
| Under 5 Years | 4 (9.3%) | 0 (0.0%) |
| 5 to 17 Years | 0 (0.0%) | 0 (0.0%) |
| 18 to 34 Years | 0 (0.0%) | 3 (2.0%) |
| 35 to 64 Years | 17 (10.6%) | 6 (5.4%) |
| 65 to 74 Years | 4 (25.0%) | 10 (43.5%) |
| 75 Years and over | 0 (0.0%) | 17 (80.9%) |
Disability Class: Vision Difficulty
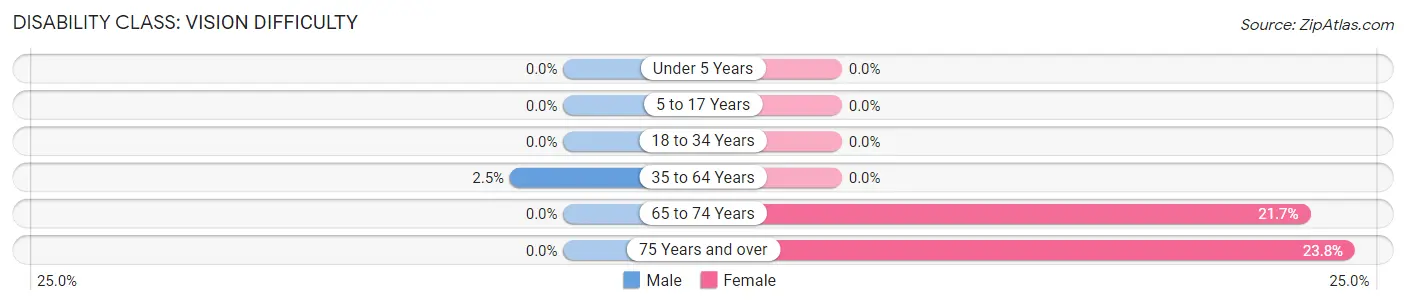
| Age Bracket | Male | Female |
| Under 5 Years | 0 (0.0%) | 0 (0.0%) |
| 5 to 17 Years | 0 (0.0%) | 0 (0.0%) |
| 18 to 34 Years | 0 (0.0%) | 0 (0.0%) |
| 35 to 64 Years | 4 (2.5%) | 0 (0.0%) |
| 65 to 74 Years | 0 (0.0%) | 5 (21.7%) |
| 75 Years and over | 0 (0.0%) | 5 (23.8%) |
Disability Class: Cognitive Difficulty
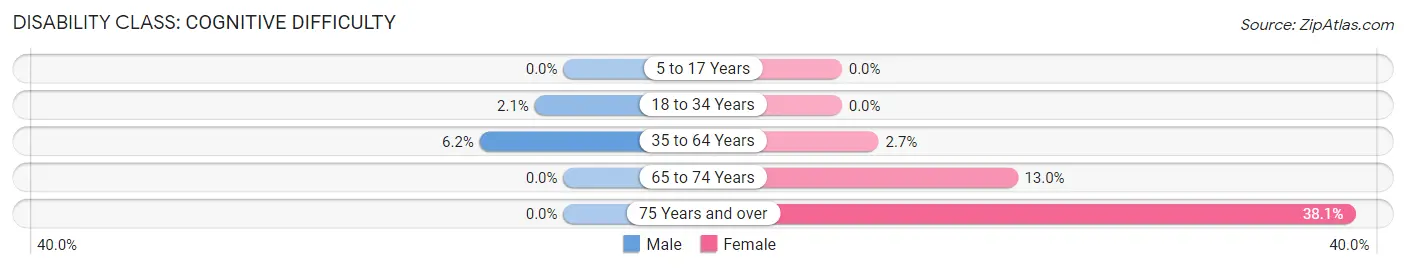
| Age Bracket | Male | Female |
| 5 to 17 Years | 0 (0.0%) | 0 (0.0%) |
| 18 to 34 Years | 3 (2.1%) | 0 (0.0%) |
| 35 to 64 Years | 10 (6.2%) | 3 (2.7%) |
| 65 to 74 Years | 0 (0.0%) | 3 (13.0%) |
| 75 Years and over | 0 (0.0%) | 8 (38.1%) |
Disability Class: Ambulatory Difficulty
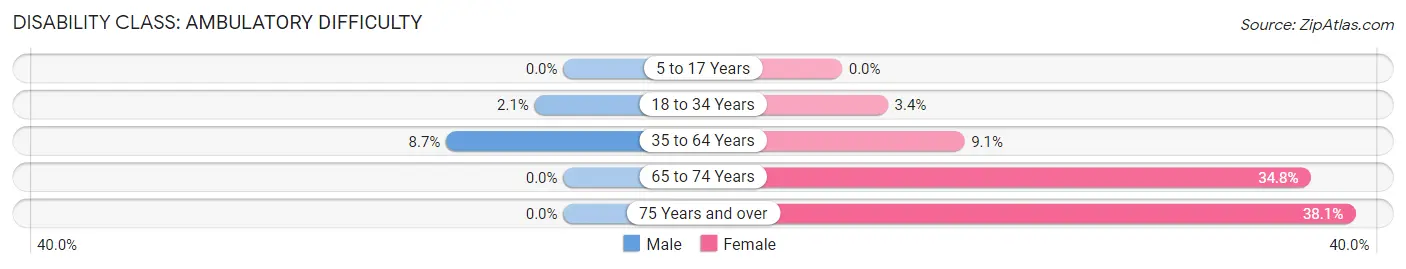
| Age Bracket | Male | Female |
| 5 to 17 Years | 0 (0.0%) | 0 (0.0%) |
| 18 to 34 Years | 3 (2.1%) | 5 (3.4%) |
| 35 to 64 Years | 14 (8.7%) | 10 (9.1%) |
| 65 to 74 Years | 0 (0.0%) | 8 (34.8%) |
| 75 Years and over | 0 (0.0%) | 8 (38.1%) |
Disability Class: Self-Care Difficulty
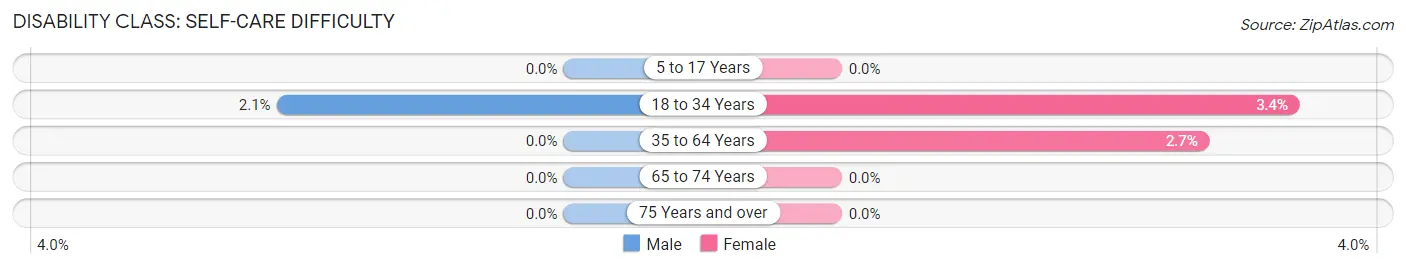
| Age Bracket | Male | Female |
| 5 to 17 Years | 0 (0.0%) | 0 (0.0%) |
| 18 to 34 Years | 3 (2.1%) | 5 (3.4%) |
| 35 to 64 Years | 0 (0.0%) | 3 (2.7%) |
| 65 to 74 Years | 0 (0.0%) | 0 (0.0%) |
| 75 Years and over | 0 (0.0%) | 0 (0.0%) |
Technology Access in St Mary s
Computing Device Access in St Mary s
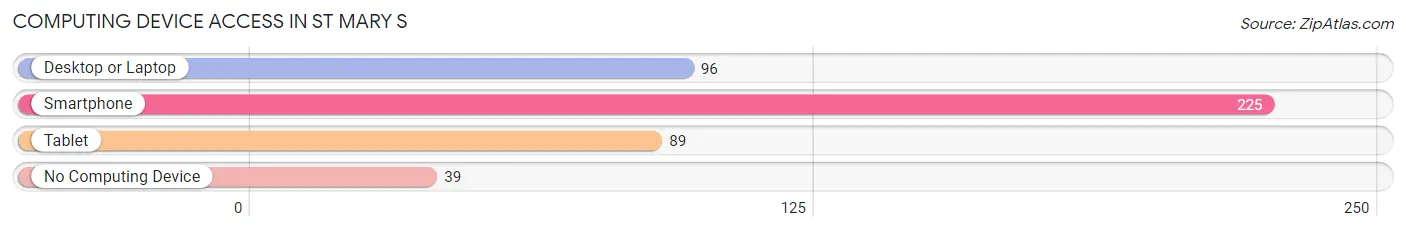
| Device Type | # Households | % Households |
| Desktop or Laptop | 96 | 36.4% |
| Smartphone | 225 | 85.2% |
| Tablet | 89 | 33.7% |
| No Computing Device | 39 | 14.8% |
| Total | 264 | 100.0% |
Internet Access in St Mary s

| Internet Type | # Households | % Households |
| Dial-Up Internet | 0 | 0.0% |
| Broadband Home | 45 | 17.1% |
| Cellular Data Only | 149 | 56.4% |
| Satellite Internet | 15 | 5.7% |
| No Internet | 55 | 20.8% |
| Total | 264 | 100.0% |
St Mary s Summary
St Marys is a city located in the state of Alaska, United States. It is located in the western part of the state, on the Alaska Peninsula, and is the only city in the region. The city is situated on the banks of the St Marys River, which flows into the Bering Sea. The city has a population of approximately 2,000 people, and is the largest city in the region.
Geography
St Marys is located on the Alaska Peninsula, in the western part of the state. The city is situated on the banks of the St Marys River, which flows into the Bering Sea. The city is surrounded by mountains, and is located in a region of tundra and boreal forest. The climate in St Marys is subarctic, with cold winters and mild summers. The average temperature in the summer is around 50°F (10°C), and in the winter it is around 0°F (-18°C).
Economy
The economy of St Marys is largely based on fishing and tourism. The city is home to a number of commercial fishing operations, and is a popular destination for sport fishing. The city also has a number of tourist attractions, including the St Marys Museum, the St Marys Historical Society, and the St Marys National Wildlife Refuge.
Demographics
As of the 2010 census, the population of St Marys was 2,039. The racial makeup of the city was 95.3% White, 0.7% Native American, 0.3% Asian, 0.2% Pacific Islander, 0.1% from other races, and 3.4% from two or more races. The median age in St Marys was 37.7 years, and the median household income was $50,945.
History
St Marys was first settled by the Yup'ik people, who had lived in the area for thousands of years. The first European settlers arrived in the area in the late 19th century, and the city was officially incorporated in 1901. The city was named after the St Marys River, which was named by Russian explorer Vitus Bering in 1741.
In the early 20th century, St Marys was a major trading center for the region, and was home to a number of businesses, including a cannery, a sawmill, and a salmon saltery. The city was also home to a number of churches, including the St Marys Orthodox Church, which was founded in 1902.
In the late 20th century, St Marys began to experience a decline in population, as many of the city's businesses closed or moved away. In recent years, the city has seen a resurgence in population, as more people have moved to the area to take advantage of the city's natural beauty and recreational opportunities.
Conclusion
St Marys is a city located in the western part of Alaska, on the banks of the St Marys River. The city has a population of approximately 2,000 people, and is the largest city in the region. The economy of St Marys is largely based on fishing and tourism, and the city is home to a number of tourist attractions. The city was first settled by the Yup'ik people, and was officially incorporated in 1901. In recent years, the city has seen a resurgence in population, as more people have moved to the area to take advantage of the city's natural beauty and recreational opportunities.
Common Questions
What is Per Capita Income in St Mary s?
Per Capita income in St Mary s is $16,421.
What is the Median Family Income in St Mary s?
Median Family Income in St Mary s is $43,077.
What is the Median Household income in St Mary s?
Median Household Income in St Mary s is $43,750.
What is Income or Wage Gap in St Mary s?
Income or Wage Gap in St Mary s is 9.5%.
Women in St Mary s earn 90.5 cents for every dollar earned by a man.
What is Inequality or Gini Index in St Mary s?
Inequality or Gini Index in St Mary s is 0.44.
What is the Total Population of St Mary s?
Total Population of St Mary s is 992.
What is the Total Male Population of St Mary s?
Total Male Population of St Mary s is 502.
What is the Total Female Population of St Mary s?
Total Female Population of St Mary s is 490.
What is the Ratio of Males per 100 Females in St Mary s?
There are 102.45 Males per 100 Females in St Mary s.
What is the Ratio of Females per 100 Males in St Mary s?
There are 97.61 Females per 100 Males in St Mary s.
What is the Median Population Age in St Mary s?
Median Population Age in St Mary s is 24.6 Years.
What is the Average Family Size in St Mary s
Average Family Size in St Mary s is 4.1 People.
What is the Average Household Size in St Mary s
Average Household Size in St Mary s is 3.8 People.
How Large is the Labor Force in St Mary s?
There are 425 People in the Labor Forcein in St Mary s.
What is the Percentage of People in the Labor Force in St Mary s?
64.4% of People are in the Labor Force in St Mary s.
What is the Unemployment Rate in St Mary s?
Unemployment Rate in St Mary s is 22.0%.