Chena Ridge, AK Map & Demographics
Chena Ridge Map
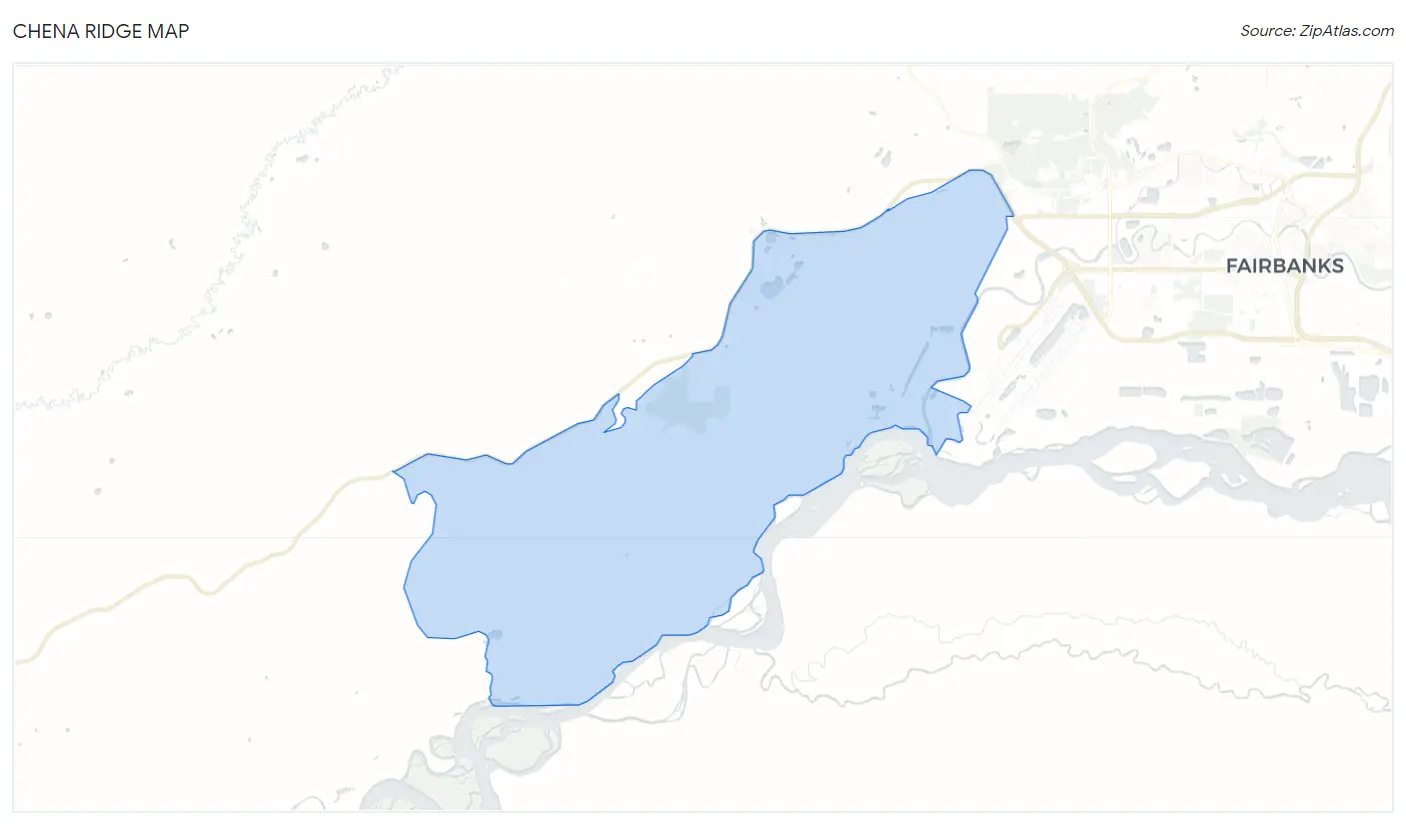
Chena Ridge Overview
$63,754
PER CAPITA INCOME
$148,793
AVG FAMILY INCOME
$106,688
AVG HOUSEHOLD INCOME
16.1%
WAGE / INCOME GAP [ % ]
83.9¢/ $1
WAGE / INCOME GAP [ $ ]
0.46
INEQUALITY / GINI INDEX
5,321
TOTAL POPULATION
2,570
MALE POPULATION
2,751
FEMALE POPULATION
93.42
MALES / 100 FEMALES
107.04
FEMALES / 100 MALES
37.7
MEDIAN AGE
3.0
AVG FAMILY SIZE
2.5
AVG HOUSEHOLD SIZE
3,042
LABOR FORCE [ PEOPLE ]
71.5%
PERCENT IN LABOR FORCE
6.1%
UNEMPLOYMENT RATE
Income in Chena Ridge
Income Overview in Chena Ridge
Per Capita Income in Chena Ridge is $63,754, while median incomes of families and households are $148,793 and $106,688 respectively.
| Characteristic | Number | Measure |
| Per Capita Income | 5,321 | $63,754 |
| Median Family Income | 1,434 | $148,793 |
| Mean Family Income | 1,434 | $185,501 |
| Median Household Income | 2,157 | $106,688 |
| Mean Household Income | 2,157 | $153,410 |
| Income Deficit | 1,434 | $0 |
| Wage / Income Gap (%) | 5,321 | 16.09% |
| Wage / Income Gap ($) | 5,321 | 83.91¢ per $1 |
| Gini / Inequality Index | 5,321 | 0.46 |
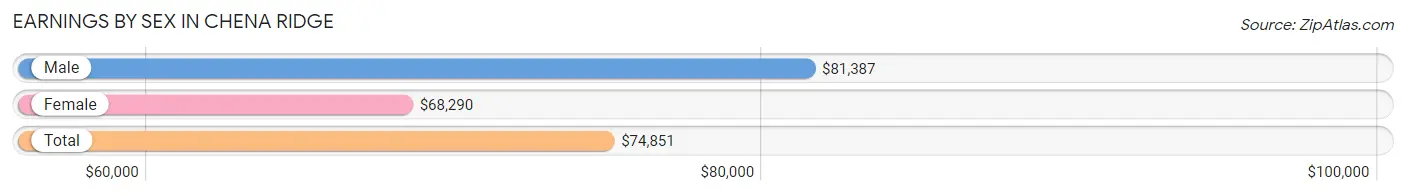
Earnings by Sex in Chena Ridge
Average Earnings in Chena Ridge are $74,851, $81,387 for men and $68,290 for women, a difference of 16.1%.
| Sex | Number | Average Earnings |
| Male | 1,595 (49.3%) | $81,387 |
| Female | 1,637 (50.6%) | $68,290 |
| Total | 3,232 (100.0%) | $74,851 |
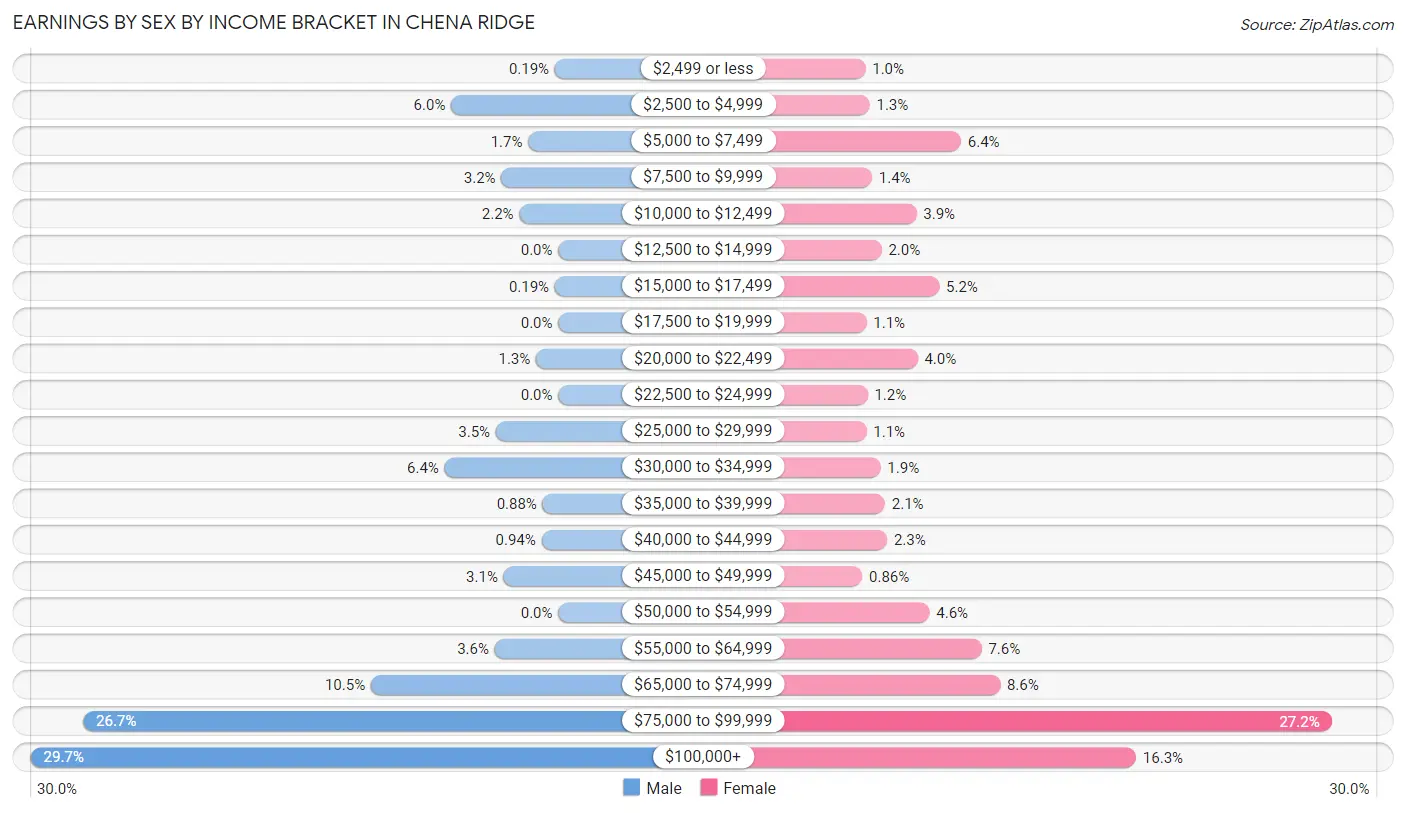
Earnings by Sex by Income Bracket in Chena Ridge
The most common earnings brackets in Chena Ridge are $100,000+ for men (473 | 29.7%) and $75,000 to $99,999 for women (446 | 27.2%).
| Income | Male | Female |
| $2,499 or less | 3 (0.2%) | 17 (1.0%) |
| $2,500 to $4,999 | 96 (6.0%) | 21 (1.3%) |
| $5,000 to $7,499 | 27 (1.7%) | 105 (6.4%) |
| $7,500 to $9,999 | 51 (3.2%) | 23 (1.4%) |
| $10,000 to $12,499 | 35 (2.2%) | 64 (3.9%) |
| $12,500 to $14,999 | 0 (0.0%) | 32 (1.9%) |
| $15,000 to $17,499 | 3 (0.2%) | 85 (5.2%) |
| $17,500 to $19,999 | 0 (0.0%) | 18 (1.1%) |
| $20,000 to $22,499 | 20 (1.3%) | 65 (4.0%) |
| $22,500 to $24,999 | 0 (0.0%) | 19 (1.2%) |
| $25,000 to $29,999 | 56 (3.5%) | 18 (1.1%) |
| $30,000 to $34,999 | 102 (6.4%) | 31 (1.9%) |
| $35,000 to $39,999 | 14 (0.9%) | 35 (2.1%) |
| $40,000 to $44,999 | 15 (0.9%) | 37 (2.3%) |
| $45,000 to $49,999 | 49 (3.1%) | 14 (0.9%) |
| $50,000 to $54,999 | 0 (0.0%) | 76 (4.6%) |
| $55,000 to $64,999 | 57 (3.6%) | 124 (7.6%) |
| $65,000 to $74,999 | 168 (10.5%) | 141 (8.6%) |
| $75,000 to $99,999 | 426 (26.7%) | 446 (27.2%) |
| $100,000+ | 473 (29.7%) | 266 (16.3%) |
| Total | 1,595 (100.0%) | 1,637 (100.0%) |
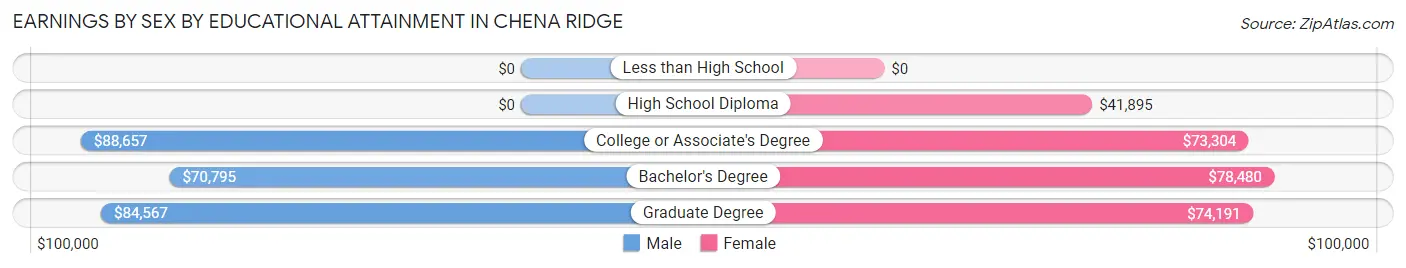
Earnings by Sex by Educational Attainment in Chena Ridge
Average earnings in Chena Ridge are $83,858 for men and $74,395 for women, a difference of 11.3%. Men with an educational attainment of college or associate's degree enjoy the highest average annual earnings of $88,657, while those with bachelor's degree education earn the least with $70,795. Women with an educational attainment of bachelor's degree earn the most with the average annual earnings of $78,480, while those with high school diploma education have the smallest earnings of $41,895.
| Educational Attainment | Male Income | Female Income |
| Less than High School | - | - |
| High School Diploma | - | - |
| College or Associate's Degree | $88,657 | $73,304 |
| Bachelor's Degree | $70,795 | $78,480 |
| Graduate Degree | $84,567 | $74,191 |
| Total | $83,858 | $74,395 |
Family Income in Chena Ridge
Family Income Brackets in Chena Ridge
According to the Chena Ridge family income data, there are 435 families falling into the $200,000+ income range, which is the most common income bracket and makes up 30.3% of all families. Conversely, the $35,000 to $49,999 income bracket is the least frequent group with only 3 families (0.2%) belonging to this category.
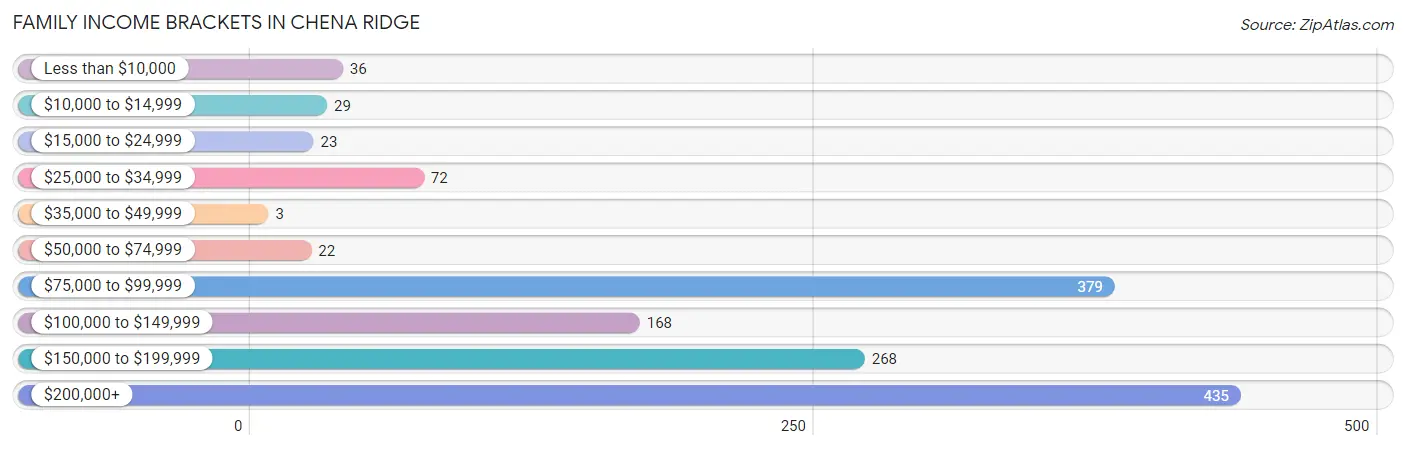
| Income Bracket | # Families | % Families |
| Less than $10,000 | 36 | 2.5% |
| $10,000 to $14,999 | 29 | 2.0% |
| $15,000 to $24,999 | 23 | 1.6% |
| $25,000 to $34,999 | 72 | 5.0% |
| $35,000 to $49,999 | 3 | 0.2% |
| $50,000 to $74,999 | 22 | 1.5% |
| $75,000 to $99,999 | 379 | 26.4% |
| $100,000 to $149,999 | 168 | 11.7% |
| $150,000 to $199,999 | 268 | 18.7% |
| $200,000+ | 435 | 30.3% |
Family Income by Famaliy Size in Chena Ridge
6-person families (31 | 2.2%) account for the highest median family income in Chena Ridge with $250,001 per family, while 4-person families (237 | 16.5%) have the highest median income of $55,569 per family member.
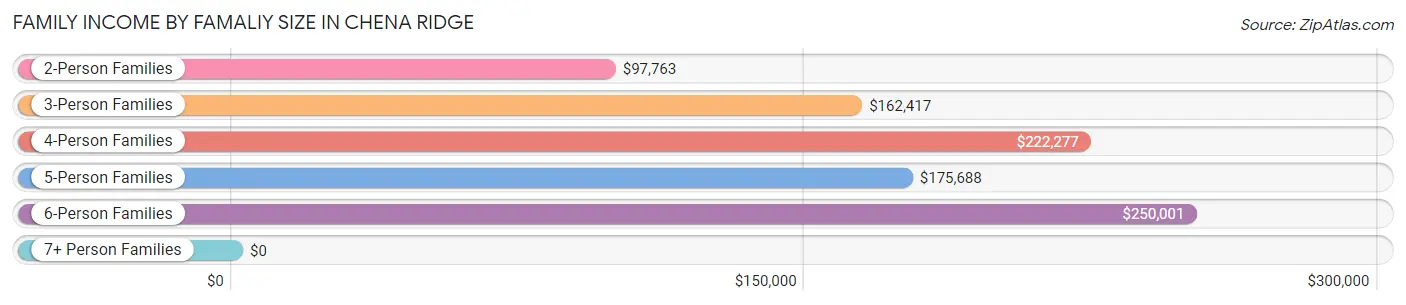
| Income Bracket | # Families | Median Income |
| 2-Person Families | 792 (55.2%) | $97,763 |
| 3-Person Families | 273 (19.0%) | $162,417 |
| 4-Person Families | 237 (16.5%) | $222,277 |
| 5-Person Families | 85 (5.9%) | $175,688 |
| 6-Person Families | 31 (2.2%) | $250,001 |
| 7+ Person Families | 16 (1.1%) | $0 |
| Total | 1,434 (100.0%) | $148,793 |
Family Income by Number of Earners in Chena Ridge
The median family income in Chena Ridge is $148,793, with families comprising 3+ earners (144) having the highest median family income of $250,001, while families with no earners (159) have the lowest median family income of $31,036, accounting for 10.0% and 11.1% of families, respectively.
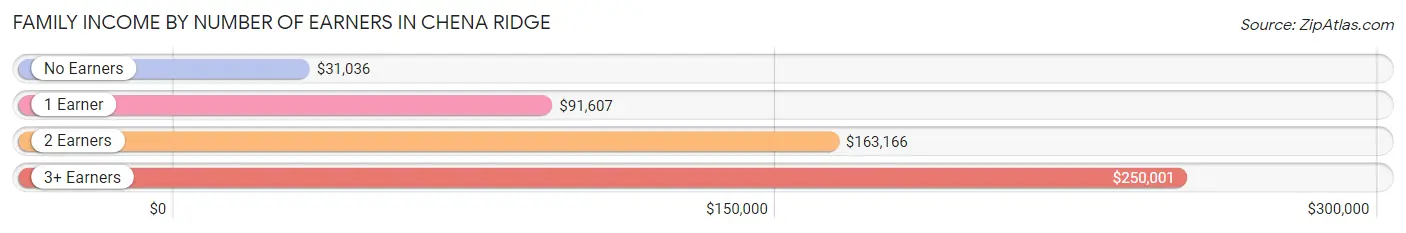
| Number of Earners | # Families | Median Income |
| No Earners | 159 (11.1%) | $31,036 |
| 1 Earner | 420 (29.3%) | $91,607 |
| 2 Earners | 711 (49.6%) | $163,166 |
| 3+ Earners | 144 (10.0%) | $250,001 |
| Total | 1,434 (100.0%) | $148,793 |
Household Income in Chena Ridge
Household Income Brackets in Chena Ridge
With 531 households falling in the category, the $200,000+ income range is the most frequent in Chena Ridge, accounting for 24.6% of all households. In contrast, only 47 households (2.2%) fall into the $10,000 to $14,999 income bracket, making it the least populous group.
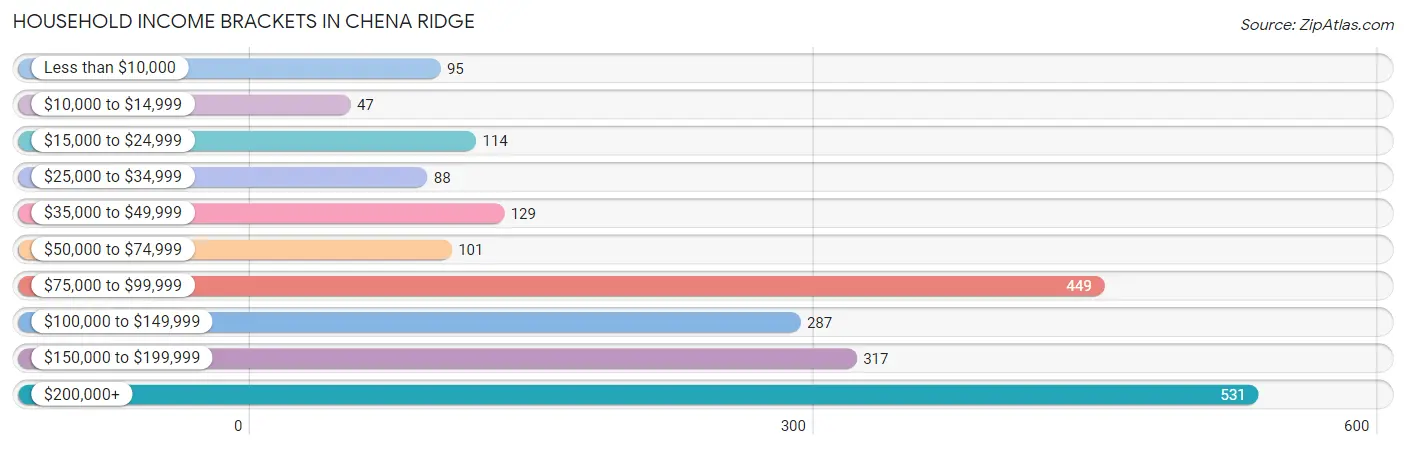
| Income Bracket | # Households | % Households |
| Less than $10,000 | 95 | 4.4% |
| $10,000 to $14,999 | 47 | 2.2% |
| $15,000 to $24,999 | 114 | 5.3% |
| $25,000 to $34,999 | 88 | 4.1% |
| $35,000 to $49,999 | 129 | 6.0% |
| $50,000 to $74,999 | 101 | 4.7% |
| $75,000 to $99,999 | 449 | 20.8% |
| $100,000 to $149,999 | 287 | 13.3% |
| $150,000 to $199,999 | 317 | 14.7% |
| $200,000+ | 531 | 24.6% |
Household Income by Householder Age in Chena Ridge
The median household income in Chena Ridge is $106,688, with the highest median household income of $162,636 found in the 25 to 44 years age bracket for the primary householder. A total of 802 households (37.2%) fall into this category. Meanwhile, the 15 to 24 years age bracket for the primary householder has the lowest median household income of $46,047, with 119 households (5.5%) in this group.
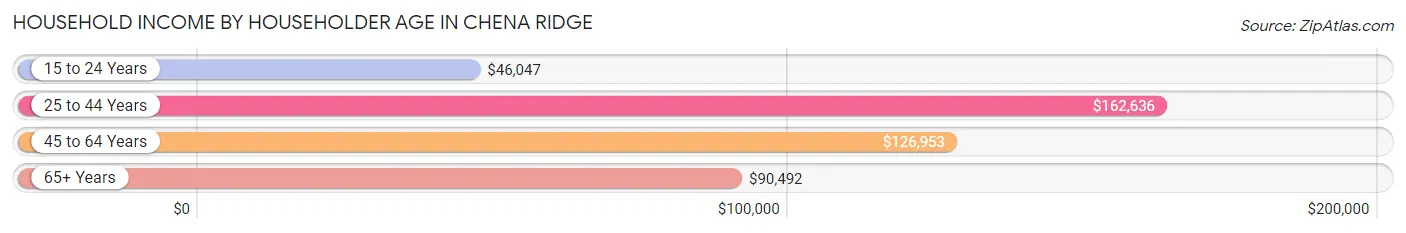
| Income Bracket | # Households | Median Income |
| 15 to 24 Years | 119 (5.5%) | $46,047 |
| 25 to 44 Years | 802 (37.2%) | $162,636 |
| 45 to 64 Years | 879 (40.7%) | $126,953 |
| 65+ Years | 357 (16.6%) | $90,492 |
| Total | 2,157 (100.0%) | $106,688 |
Poverty in Chena Ridge
Income Below Poverty by Sex and Age in Chena Ridge
With 8.2% poverty level for males and 4.5% for females among the residents of Chena Ridge, 18 to 24 year old males and 18 to 24 year old females are the most vulnerable to poverty, with 58 males (25.2%) and 53 females (33.1%) in their respective age groups living below the poverty level.
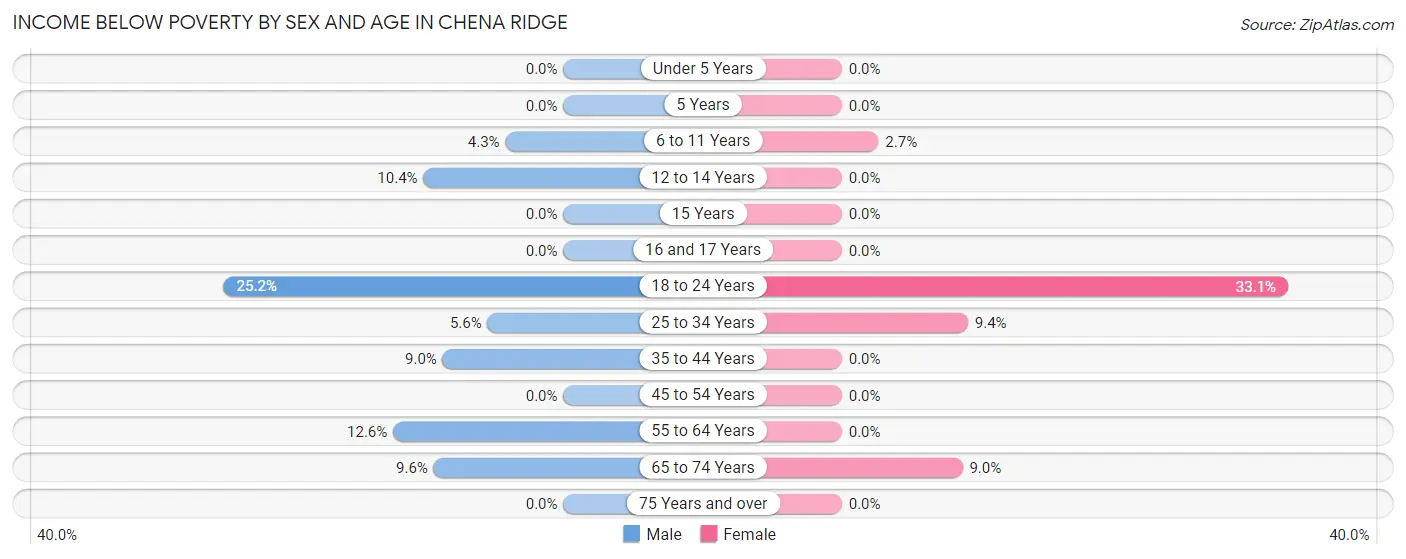
| Age Bracket | Male | Female |
| Under 5 Years | 0 (0.0%) | 0 (0.0%) |
| 5 Years | 0 (0.0%) | 0 (0.0%) |
| 6 to 11 Years | 8 (4.3%) | 5 (2.7%) |
| 12 to 14 Years | 8 (10.4%) | 0 (0.0%) |
| 15 Years | 0 (0.0%) | 0 (0.0%) |
| 16 and 17 Years | 0 (0.0%) | 0 (0.0%) |
| 18 to 24 Years | 58 (25.2%) | 53 (33.1%) |
| 25 to 34 Years | 21 (5.6%) | 47 (9.4%) |
| 35 to 44 Years | 38 (9.0%) | 0 (0.0%) |
| 45 to 54 Years | 0 (0.0%) | 0 (0.0%) |
| 55 to 64 Years | 56 (12.6%) | 0 (0.0%) |
| 65 to 74 Years | 18 (9.6%) | 19 (9.0%) |
| 75 Years and over | 0 (0.0%) | 0 (0.0%) |
| Total | 207 (8.2%) | 124 (4.5%) |
Income Above Poverty by Sex and Age in Chena Ridge
According to the poverty statistics in Chena Ridge, males aged under 5 years and females aged under 5 years are the age groups that are most secure financially, with 100.0% of males and 100.0% of females in these age groups living above the poverty line.
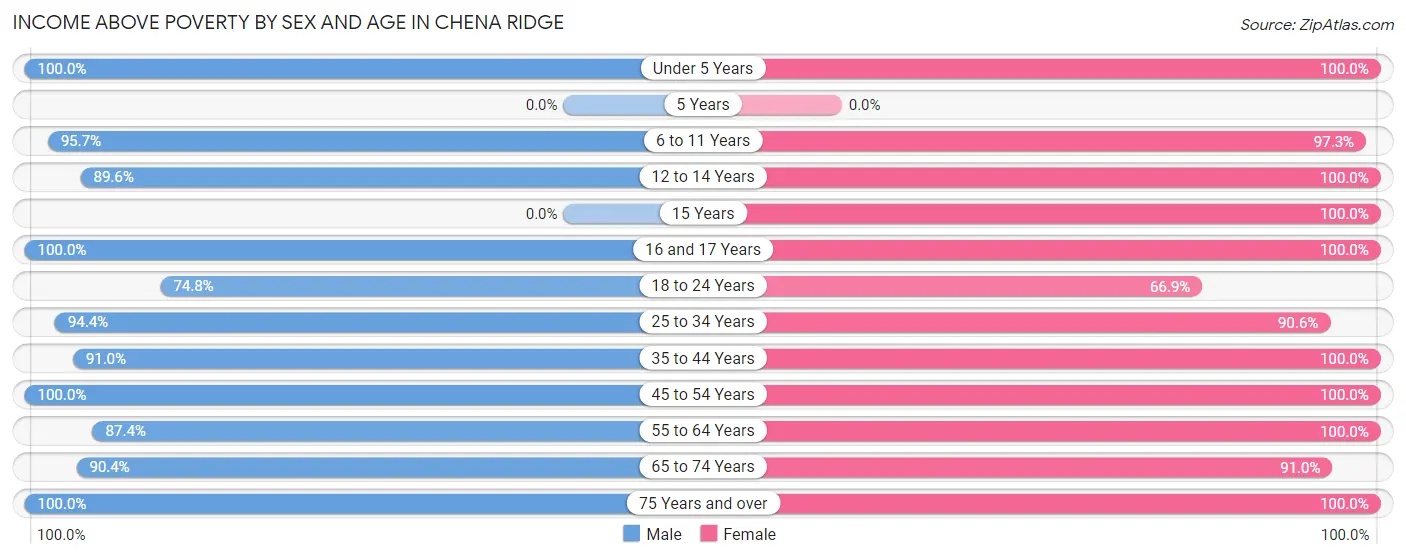
| Age Bracket | Male | Female |
| Under 5 Years | 151 (100.0%) | 158 (100.0%) |
| 5 Years | 0 (0.0%) | 0 (0.0%) |
| 6 to 11 Years | 178 (95.7%) | 179 (97.3%) |
| 12 to 14 Years | 69 (89.6%) | 252 (100.0%) |
| 15 Years | 0 (0.0%) | 11 (100.0%) |
| 16 and 17 Years | 3 (100.0%) | 71 (100.0%) |
| 18 to 24 Years | 172 (74.8%) | 107 (66.9%) |
| 25 to 34 Years | 352 (94.4%) | 455 (90.6%) |
| 35 to 44 Years | 386 (91.0%) | 374 (100.0%) |
| 45 to 54 Years | 391 (100.0%) | 389 (100.0%) |
| 55 to 64 Years | 387 (87.4%) | 415 (100.0%) |
| 65 to 74 Years | 169 (90.4%) | 193 (91.0%) |
| 75 Years and over | 58 (100.0%) | 23 (100.0%) |
| Total | 2,316 (91.8%) | 2,627 (95.5%) |
Income Below Poverty Among Married-Couple Families in Chena Ridge
The poverty statistics for married-couple families in Chena Ridge show that 1.5% or 19 of the total 1,276 families live below the poverty line. Families with no children have the highest poverty rate of 2.3%, comprising of 19 families. On the other hand, families with 1 or 2 children have the lowest poverty rate of 0.0%, which includes 0 families.
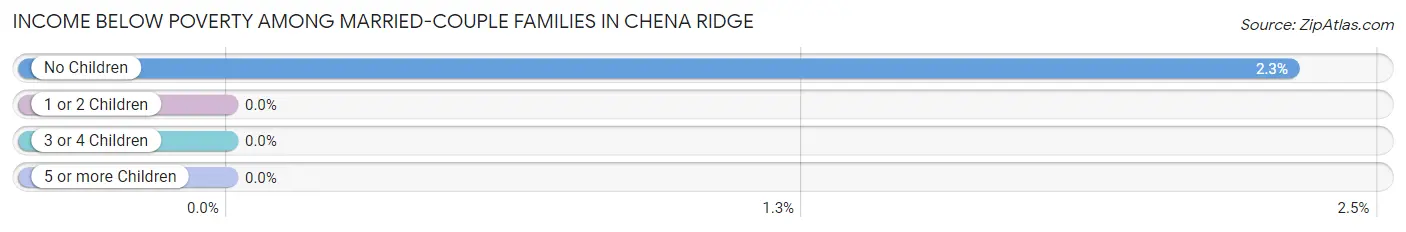
| Children | Above Poverty | Below Poverty |
| No Children | 804 (97.7%) | 19 (2.3%) |
| 1 or 2 Children | 347 (100.0%) | 0 (0.0%) |
| 3 or 4 Children | 90 (100.0%) | 0 (0.0%) |
| 5 or more Children | 16 (100.0%) | 0 (0.0%) |
| Total | 1,257 (98.5%) | 19 (1.5%) |
Income Below Poverty Among Single-Parent Households in Chena Ridge
According to the poverty data in Chena Ridge, 16.0% or 17 single-father households and 55.8% or 29 single-mother households are living below the poverty line. Among single-father households, those with no children have the highest poverty rate, with 17 households (20.0%) experiencing poverty. Likewise, among single-mother households, those with 3 or 4 children have the highest poverty rate, with 29 households (100.0%) falling below the poverty line.
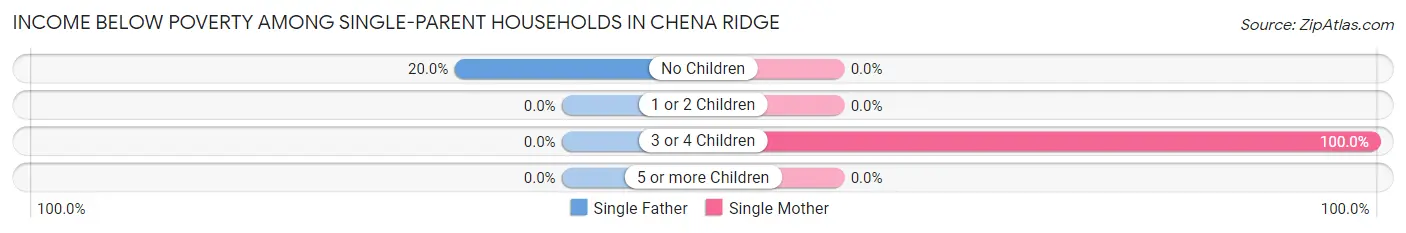
| Children | Single Father | Single Mother |
| No Children | 17 (20.0%) | 0 (0.0%) |
| 1 or 2 Children | 0 (0.0%) | 0 (0.0%) |
| 3 or 4 Children | 0 (0.0%) | 29 (100.0%) |
| 5 or more Children | 0 (0.0%) | 0 (0.0%) |
| Total | 17 (16.0%) | 29 (55.8%) |
Income Below Poverty Among Married-Couple vs Single-Parent Households in Chena Ridge
The poverty data for Chena Ridge shows that 19 of the married-couple family households (1.5%) and 46 of the single-parent households (29.1%) are living below the poverty level. Within the married-couple family households, those with no children have the highest poverty rate, with 19 households (2.3%) falling below the poverty line. Among the single-parent households, those with 3 or 4 children have the highest poverty rate, with 29 household (100.0%) living below poverty.
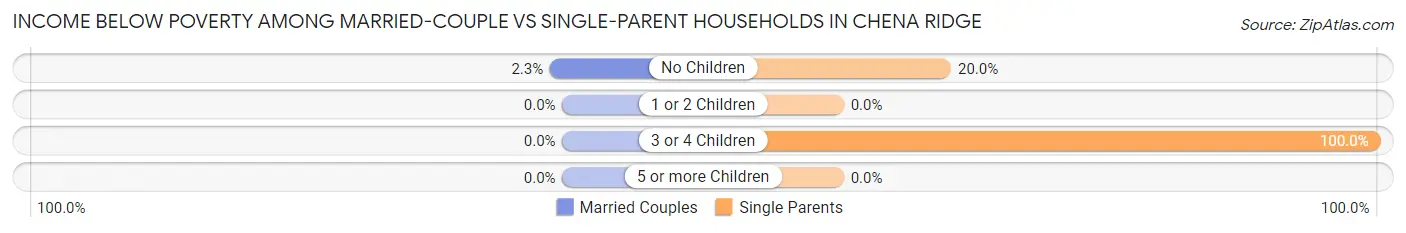
| Children | Married-Couple Families | Single-Parent Households |
| No Children | 19 (2.3%) | 17 (20.0%) |
| 1 or 2 Children | 0 (0.0%) | 0 (0.0%) |
| 3 or 4 Children | 0 (0.0%) | 29 (100.0%) |
| 5 or more Children | 0 (0.0%) | 0 (0.0%) |
| Total | 19 (1.5%) | 46 (29.1%) |
Race in Chena Ridge
The most populous races in Chena Ridge are White / Caucasian (3,652 | 68.6%), Two or more Races (673 | 12.7%), and Native / Alaskan (568 | 10.7%).
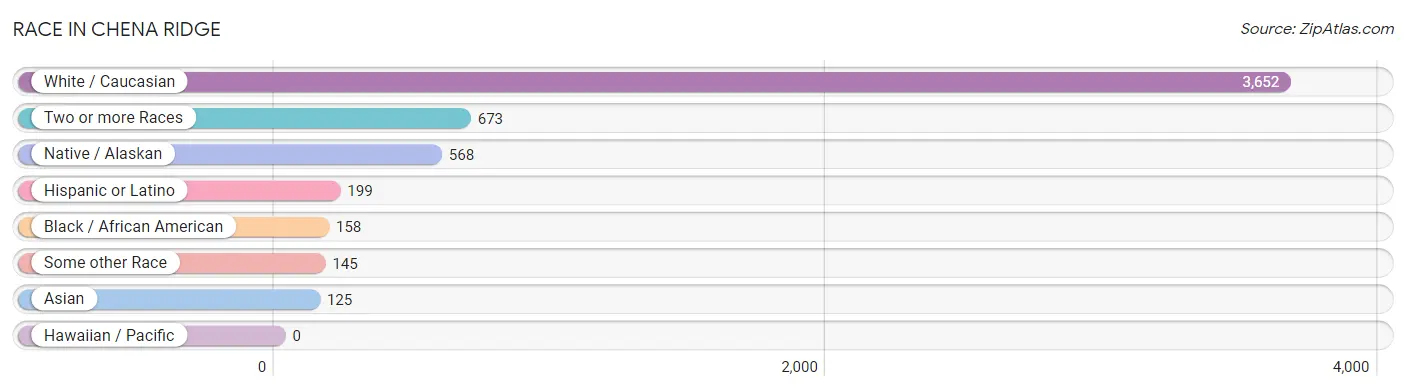
| Race | # Population | % Population |
| Asian | 125 | 2.4% |
| Black / African American | 158 | 3.0% |
| Hawaiian / Pacific | 0 | 0.0% |
| Hispanic or Latino | 199 | 3.7% |
| Native / Alaskan | 568 | 10.7% |
| White / Caucasian | 3,652 | 68.6% |
| Two or more Races | 673 | 12.7% |
| Some other Race | 145 | 2.7% |
| Total | 5,321 | 100.0% |
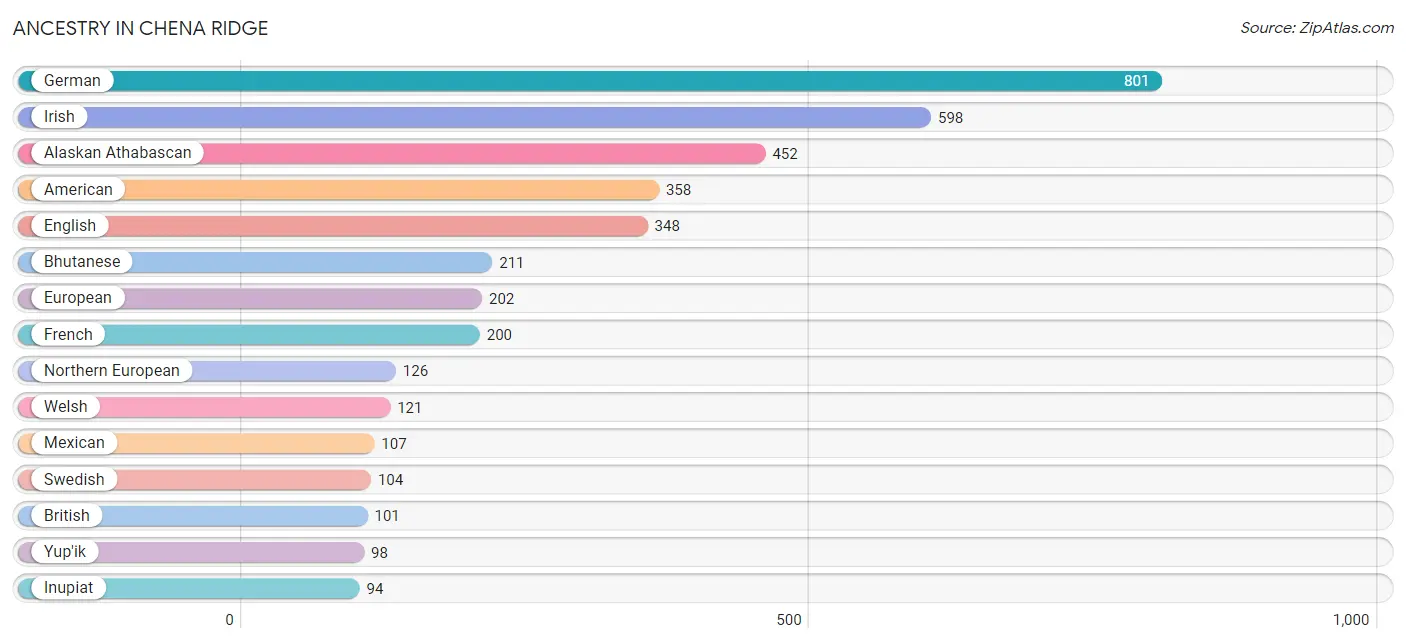
Ancestry in Chena Ridge
The most populous ancestries reported in Chena Ridge are German (801 | 15.0%), Irish (598 | 11.2%), Alaskan Athabascan (452 | 8.5%), American (358 | 6.7%), and English (348 | 6.5%), together accounting for 48.1% of all Chena Ridge residents.
| Ancestry | # Population | % Population |
| African | 87 | 1.6% |
| Alaska Native | 25 | 0.5% |
| Alaskan Athabascan | 452 | 8.5% |
| American | 358 | 6.7% |
| Australian | 13 | 0.2% |
| Austrian | 55 | 1.0% |
| Bhutanese | 211 | 4.0% |
| Bolivian | 54 | 1.0% |
| British | 101 | 1.9% |
| Burmese | 49 | 0.9% |
| Cambodian | 39 | 0.7% |
| Canadian | 41 | 0.8% |
| Celtic | 19 | 0.4% |
| Cherokee | 18 | 0.3% |
| Cree | 79 | 1.5% |
| Czech | 22 | 0.4% |
| Danish | 51 | 1.0% |
| Dutch | 89 | 1.7% |
| Eastern European | 15 | 0.3% |
| English | 348 | 6.5% |
| European | 202 | 3.8% |
| Filipino | 57 | 1.1% |
| Finnish | 17 | 0.3% |
| French | 200 | 3.8% |
| French Canadian | 12 | 0.2% |
| German | 801 | 15.0% |
| Indian (Asian) | 17 | 0.3% |
| Inupiat | 94 | 1.8% |
| Irish | 598 | 11.2% |
| Italian | 70 | 1.3% |
| Korean | 76 | 1.4% |
| Lithuanian | 41 | 0.8% |
| Mexican | 107 | 2.0% |
| Northern European | 126 | 2.4% |
| Norwegian | 32 | 0.6% |
| Pakistani | 17 | 0.3% |
| Polish | 51 | 1.0% |
| Romanian | 21 | 0.4% |
| Scandinavian | 59 | 1.1% |
| Scotch-Irish | 18 | 0.3% |
| Scottish | 31 | 0.6% |
| Shoshone | 15 | 0.3% |
| Slovak | 21 | 0.4% |
| South American | 54 | 1.0% |
| Spaniard | 1 | 0.0% |
| Subsaharan African | 87 | 1.6% |
| Swedish | 104 | 1.9% |
| Swiss | 32 | 0.6% |
| Thai | 14 | 0.3% |
| Ukrainian | 13 | 0.2% |
| Welsh | 121 | 2.3% |
| Yup'ik | 98 | 1.8% | View All 52 Rows |
Immigrants in Chena Ridge
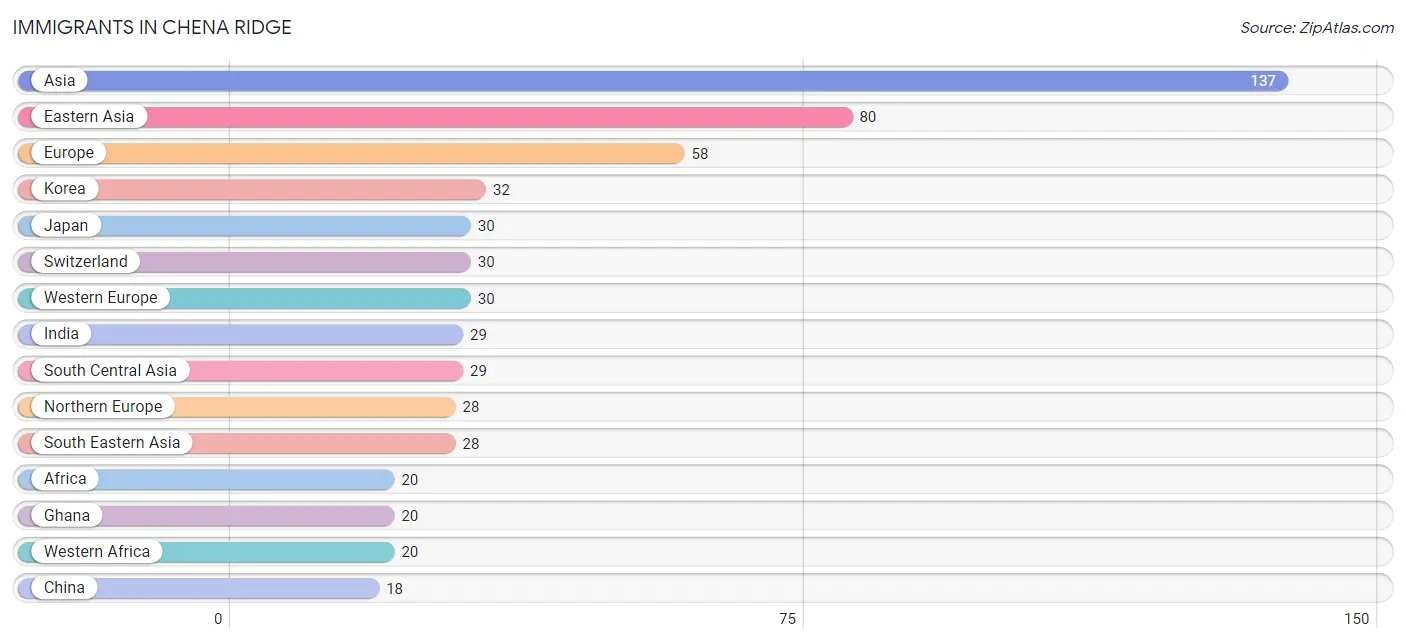
The most numerous immigrant groups reported in Chena Ridge came from Asia (137 | 2.6%), Eastern Asia (80 | 1.5%), Europe (58 | 1.1%), Korea (32 | 0.6%), and Japan (30 | 0.6%), together accounting for 6.3% of all Chena Ridge residents.
| Immigration Origin | # Population | % Population |
| Africa | 20 | 0.4% |
| Asia | 137 | 2.6% |
| Australia | 13 | 0.2% |
| China | 18 | 0.3% |
| Eastern Asia | 80 | 1.5% |
| England | 16 | 0.3% |
| Europe | 58 | 1.1% |
| Ghana | 20 | 0.4% |
| Guyana | 18 | 0.3% |
| India | 29 | 0.5% |
| Japan | 30 | 0.6% |
| Korea | 32 | 0.6% |
| Latin America | 18 | 0.3% |
| Northern Europe | 28 | 0.5% |
| Oceania | 13 | 0.2% |
| Philippines | 11 | 0.2% |
| South America | 18 | 0.3% |
| South Central Asia | 29 | 0.5% |
| South Eastern Asia | 28 | 0.5% |
| Switzerland | 30 | 0.6% |
| Thailand | 17 | 0.3% |
| Western Africa | 20 | 0.4% |
| Western Europe | 30 | 0.6% | View All 23 Rows |
Sex and Age in Chena Ridge
Sex and Age in Chena Ridge
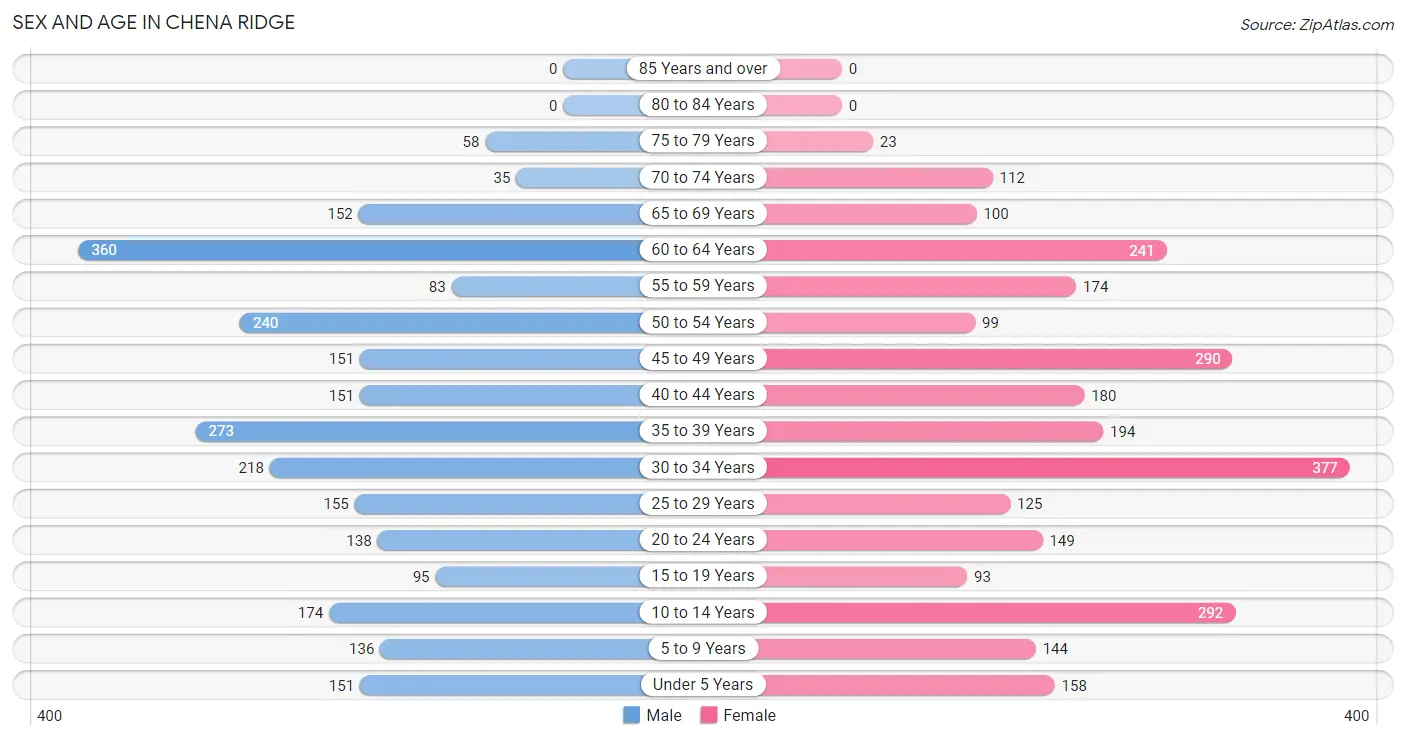
The most populous age groups in Chena Ridge are 60 to 64 Years (360 | 14.0%) for men and 30 to 34 Years (377 | 13.7%) for women.
| Age Bracket | Male | Female |
| Under 5 Years | 151 (5.9%) | 158 (5.7%) |
| 5 to 9 Years | 136 (5.3%) | 144 (5.2%) |
| 10 to 14 Years | 174 (6.8%) | 292 (10.6%) |
| 15 to 19 Years | 95 (3.7%) | 93 (3.4%) |
| 20 to 24 Years | 138 (5.4%) | 149 (5.4%) |
| 25 to 29 Years | 155 (6.0%) | 125 (4.5%) |
| 30 to 34 Years | 218 (8.5%) | 377 (13.7%) |
| 35 to 39 Years | 273 (10.6%) | 194 (7.0%) |
| 40 to 44 Years | 151 (5.9%) | 180 (6.5%) |
| 45 to 49 Years | 151 (5.9%) | 290 (10.5%) |
| 50 to 54 Years | 240 (9.3%) | 99 (3.6%) |
| 55 to 59 Years | 83 (3.2%) | 174 (6.3%) |
| 60 to 64 Years | 360 (14.0%) | 241 (8.8%) |
| 65 to 69 Years | 152 (5.9%) | 100 (3.6%) |
| 70 to 74 Years | 35 (1.4%) | 112 (4.1%) |
| 75 to 79 Years | 58 (2.3%) | 23 (0.8%) |
| 80 to 84 Years | 0 (0.0%) | 0 (0.0%) |
| 85 Years and over | 0 (0.0%) | 0 (0.0%) |
| Total | 2,570 (100.0%) | 2,751 (100.0%) |
Families and Households in Chena Ridge
Median Family Size in Chena Ridge
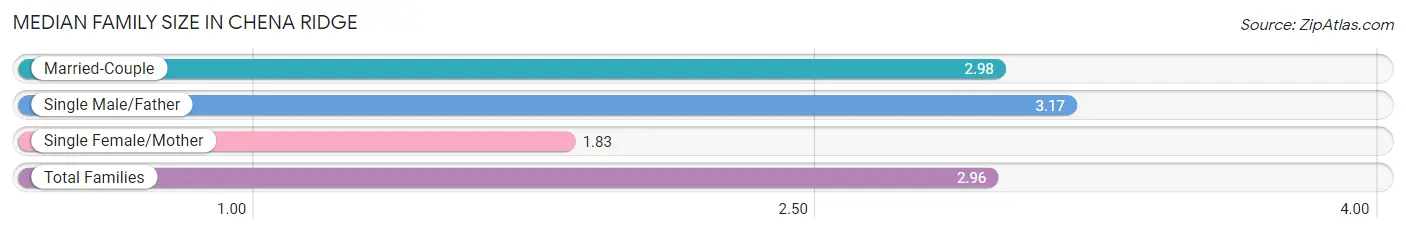
The median family size in Chena Ridge is 2.96 persons per family, with single male/father families (106 | 7.4%) accounting for the largest median family size of 3.17 persons per family. On the other hand, single female/mother families (52 | 3.6%) represent the smallest median family size with 1.83 persons per family.
| Family Type | # Families | Family Size |
| Married-Couple | 1,276 (89.0%) | 2.98 |
| Single Male/Father | 106 (7.4%) | 3.17 |
| Single Female/Mother | 52 (3.6%) | 1.83 |
| Total Families | 1,434 (100.0%) | 2.96 |
Median Household Size in Chena Ridge
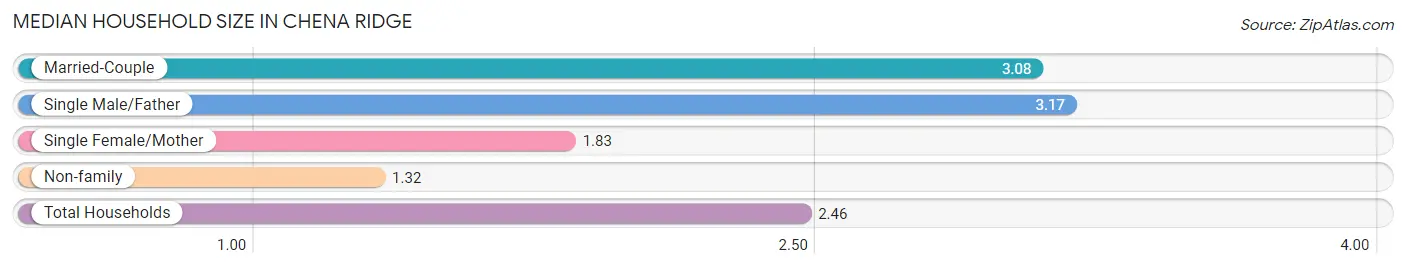
The median household size in Chena Ridge is 2.46 persons per household, with single male/father households (106 | 4.9%) accounting for the largest median household size of 3.17 persons per household. non-family households (723 | 33.5%) represent the smallest median household size with 1.32 persons per household.
| Household Type | # Households | Household Size |
| Married-Couple | 1,276 (59.2%) | 3.08 |
| Single Male/Father | 106 (4.9%) | 3.17 |
| Single Female/Mother | 52 (2.4%) | 1.83 |
| Non-family | 723 (33.5%) | 1.32 |
| Total Households | 2,157 (100.0%) | 2.46 |
Household Size by Marriage Status in Chena Ridge
Out of a total of 2,157 households in Chena Ridge, 1,434 (66.5%) are family households, while 723 (33.5%) are nonfamily households. The most numerous type of family households are 2-person households, comprising 762, and the most common type of nonfamily households are 1-person households, comprising 537.
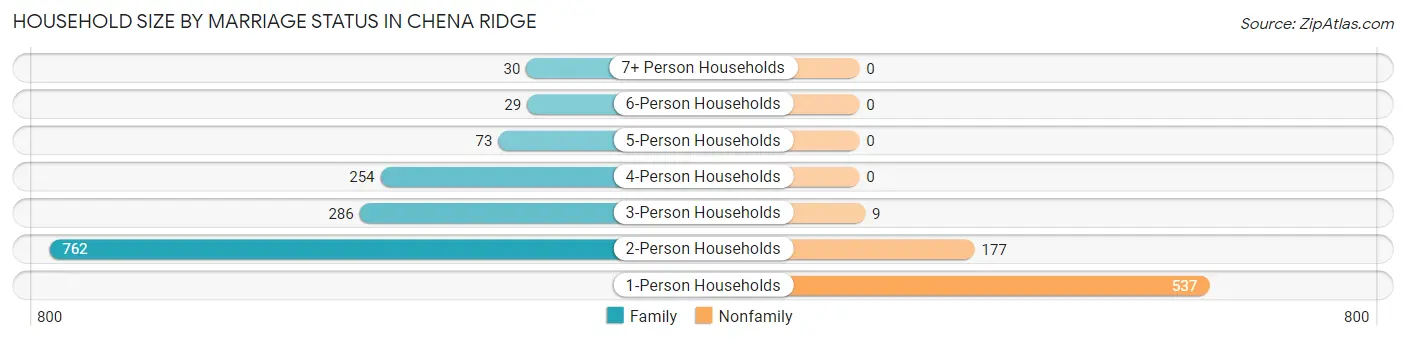
| Household Size | Family Households | Nonfamily Households |
| 1-Person Households | - | 537 (24.9%) |
| 2-Person Households | 762 (35.3%) | 177 (8.2%) |
| 3-Person Households | 286 (13.3%) | 9 (0.4%) |
| 4-Person Households | 254 (11.8%) | 0 (0.0%) |
| 5-Person Households | 73 (3.4%) | 0 (0.0%) |
| 6-Person Households | 29 (1.3%) | 0 (0.0%) |
| 7+ Person Households | 30 (1.4%) | 0 (0.0%) |
| Total | 1,434 (66.5%) | 723 (33.5%) |
Female Fertility in Chena Ridge
Fertility by Age in Chena Ridge
Average fertility rate in Chena Ridge is 46.0 births per 1,000 women. Women in the age bracket of 35 to 50 years have the highest fertility rate with 59.0 births per 1,000 women. Women in the age bracket of 35 to 50 years acount for 60.6% of all women with births.
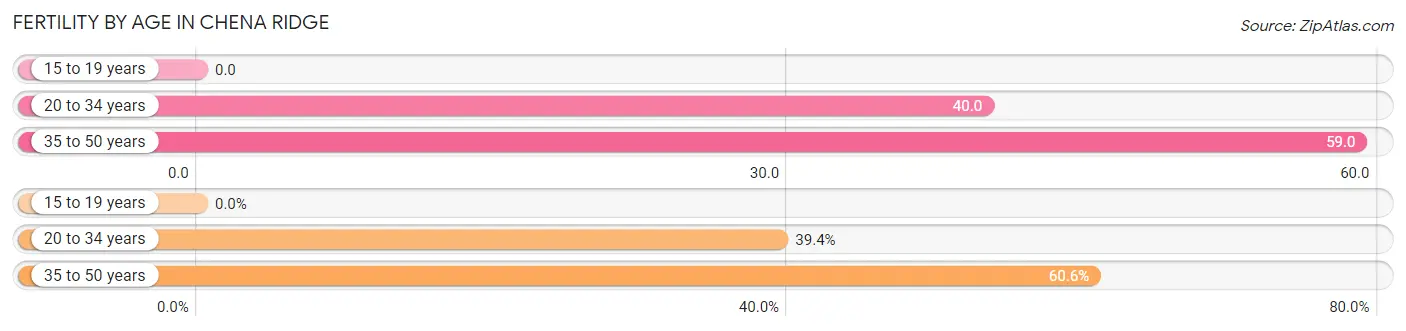
| Age Bracket | Women with Births | Births / 1,000 Women |
| 15 to 19 years | 0 (0.0%) | 0.0 |
| 20 to 34 years | 26 (39.4%) | 40.0 |
| 35 to 50 years | 40 (60.6%) | 59.0 |
| Total | 66 (100.0%) | 46.0 |
Fertility by Age by Marriage Status in Chena Ridge
65.2% of women with births (66) in Chena Ridge are married. The highest percentage of unmarried women with births falls into 35 to 50 years age bracket with 57.5% of them unmarried at the time of birth, while the lowest percentage of unmarried women with births belong to 20 to 34 years age bracket with 0.0% of them unmarried.
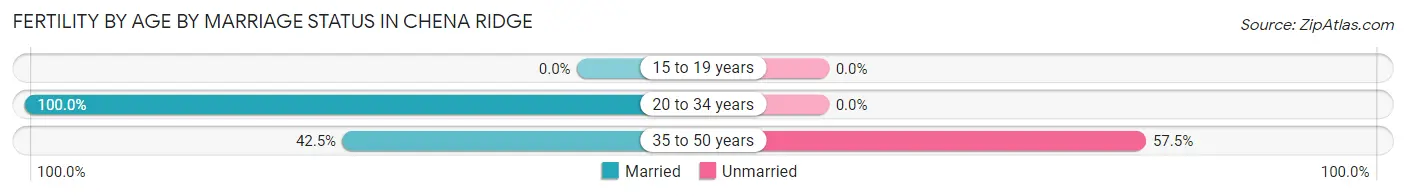
| Age Bracket | Married | Unmarried |
| 15 to 19 years | 0 (0.0%) | 0 (0.0%) |
| 20 to 34 years | 26 (100.0%) | 0 (0.0%) |
| 35 to 50 years | 17 (42.5%) | 23 (57.5%) |
| Total | 43 (65.1%) | 23 (34.8%) |
Fertility by Education in Chena Ridge
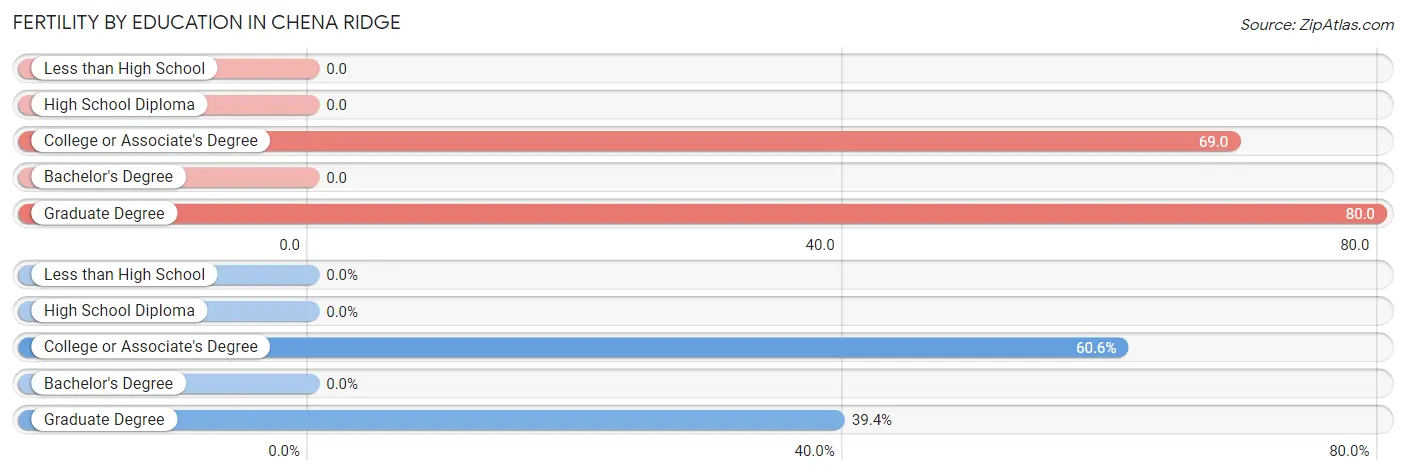
| Educational Attainment | Women with Births | Births / 1,000 Women |
| Less than High School | 0 (0.0%) | 0.0 |
| High School Diploma | 0 (0.0%) | 0.0 |
| College or Associate's Degree | 40 (60.6%) | 69.0 |
| Bachelor's Degree | 0 (0.0%) | 0.0 |
| Graduate Degree | 26 (39.4%) | 80.0 |
| Total | 66 (100.0%) | 46.0 |
Fertility by Education by Marriage Status in Chena Ridge
34.8% of women with births in Chena Ridge are unmarried. Women with the educational attainment of graduate degree are most likely to be married with 100.0% of them married at childbirth, while women with the educational attainment of college or associate's degree are least likely to be married with 57.5% of them unmarried at childbirth.
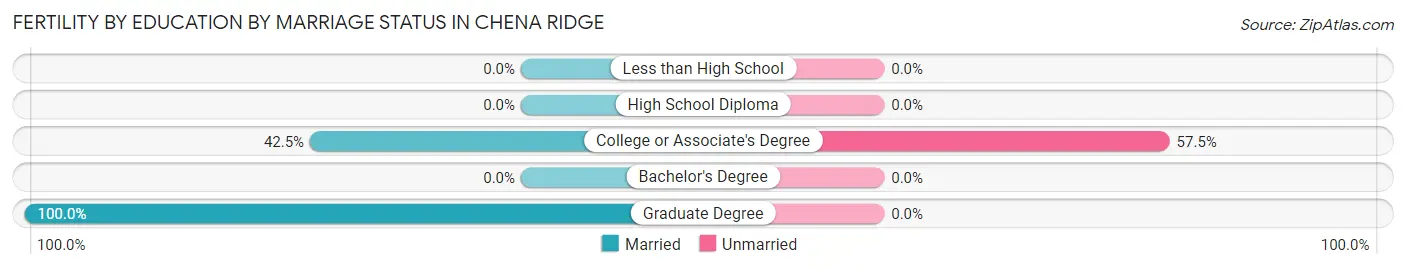
| Educational Attainment | Married | Unmarried |
| Less than High School | 0 (0.0%) | 0 (0.0%) |
| High School Diploma | 0 (0.0%) | 0 (0.0%) |
| College or Associate's Degree | 17 (42.5%) | 23 (57.5%) |
| Bachelor's Degree | 0 (0.0%) | 0 (0.0%) |
| Graduate Degree | 26 (100.0%) | 0 (0.0%) |
| Total | 43 (65.1%) | 23 (34.8%) |
Employment Characteristics in Chena Ridge
Employment by Class of Employer in Chena Ridge
Among the 2,809 employed individuals in Chena Ridge, private company employees (1,263 | 45.0%), state government employees (500 | 17.8%), and federal government employees (266 | 9.5%) make up the most common classes of employment.
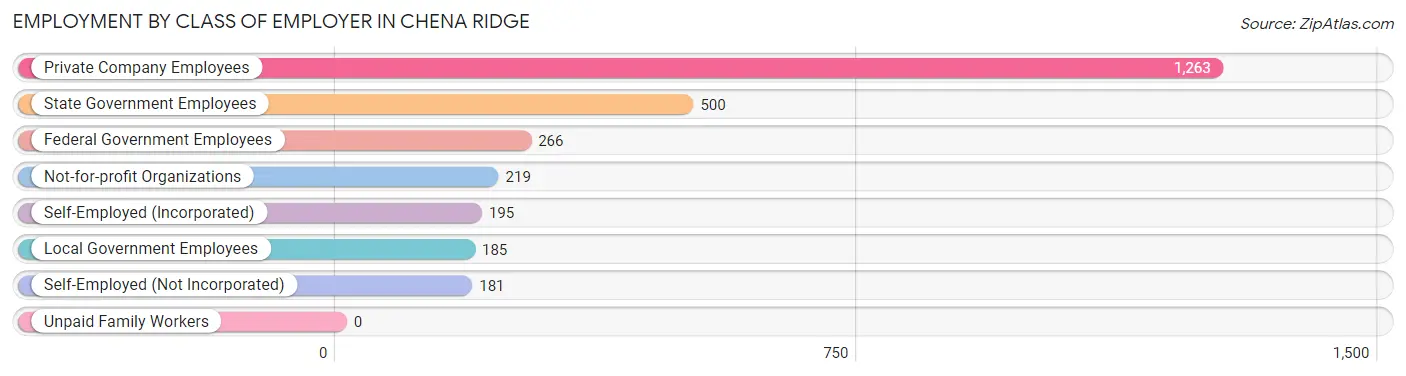
| Employer Class | # Employees | % Employees |
| Private Company Employees | 1,263 | 45.0% |
| Self-Employed (Incorporated) | 195 | 6.9% |
| Self-Employed (Not Incorporated) | 181 | 6.4% |
| Not-for-profit Organizations | 219 | 7.8% |
| Local Government Employees | 185 | 6.6% |
| State Government Employees | 500 | 17.8% |
| Federal Government Employees | 266 | 9.5% |
| Unpaid Family Workers | 0 | 0.0% |
| Total | 2,809 | 100.0% |
Employment Status by Age in Chena Ridge
According to the labor force statistics for Chena Ridge, out of the total population over 16 years of age (4,255), 71.5% or 3,042 individuals are in the labor force, with 6.1% or 186 of them unemployed. The age group with the highest labor force participation rate is 45 to 54 years, with 95.8% or 747 individuals in the labor force. Within the labor force, the 20 to 24 years age range has the highest percentage of unemployed individuals, with 15.8% or 35 of them being unemployed.
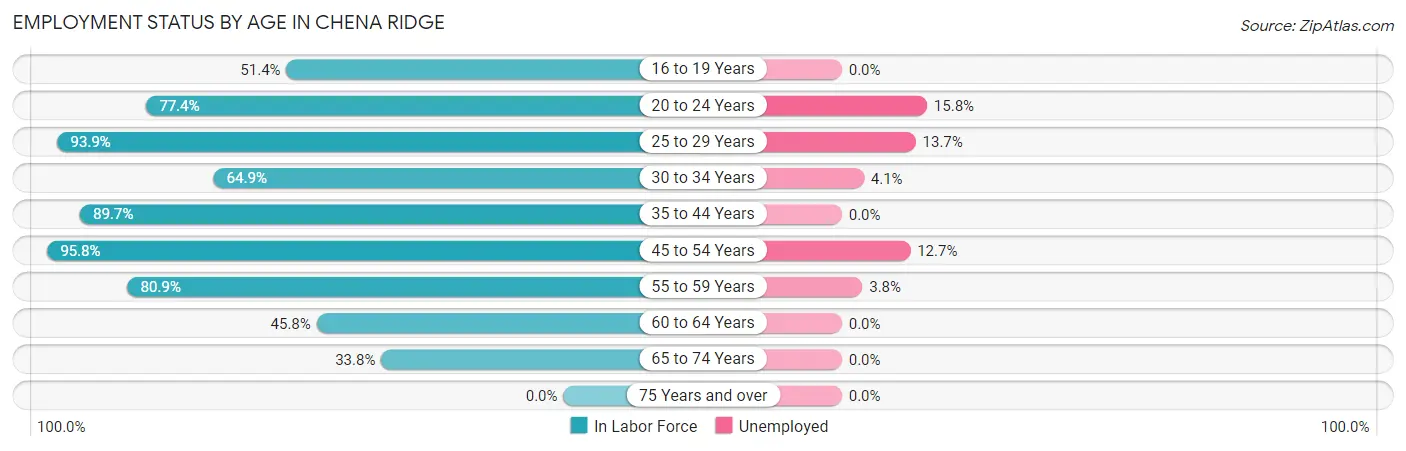
| Age Bracket | In Labor Force | Unemployed |
| 16 to 19 Years | 91 (51.4%) | 0 (0.0%) |
| 20 to 24 Years | 222 (77.4%) | 35 (15.8%) |
| 25 to 29 Years | 263 (93.9%) | 36 (13.7%) |
| 30 to 34 Years | 386 (64.9%) | 16 (4.1%) |
| 35 to 44 Years | 716 (89.7%) | 0 (0.0%) |
| 45 to 54 Years | 747 (95.8%) | 95 (12.7%) |
| 55 to 59 Years | 208 (80.9%) | 8 (3.8%) |
| 60 to 64 Years | 275 (45.8%) | 0 (0.0%) |
| 65 to 74 Years | 135 (33.8%) | 0 (0.0%) |
| 75 Years and over | 0 (0.0%) | 0 (0.0%) |
| Total | 3,042 (71.5%) | 186 (6.1%) |
Employment Status by Educational Attainment in Chena Ridge
According to labor force statistics for Chena Ridge, 78.4% of individuals (2,596) out of the total population between 25 and 64 years of age (3,311) are in the labor force, with 5.8% or 151 of them being unemployed. The group with the highest labor force participation rate are those with the educational attainment of less than high school, with 100.0% or 16 individuals in the labor force. Within the labor force, individuals with less than high school education have the highest percentage of unemployment, with 100.0% or 16 of them being unemployed.
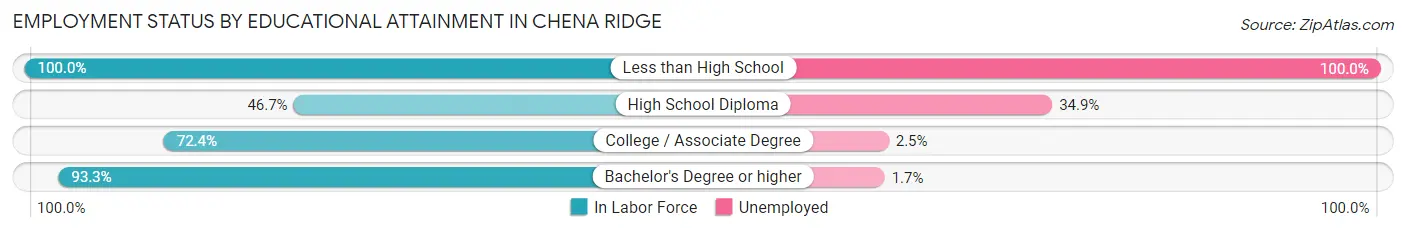
| Educational Attainment | In Labor Force | Unemployed |
| Less than High School | 16 (100.0%) | 16 (100.0%) |
| High School Diploma | 265 (46.7%) | 198 (34.9%) |
| College / Associate Degree | 800 (72.4%) | 28 (2.5%) |
| Bachelor's Degree or higher | 1,514 (93.3%) | 28 (1.7%) |
| Total | 2,596 (78.4%) | 192 (5.8%) |
Employment Occupations by Sex in Chena Ridge
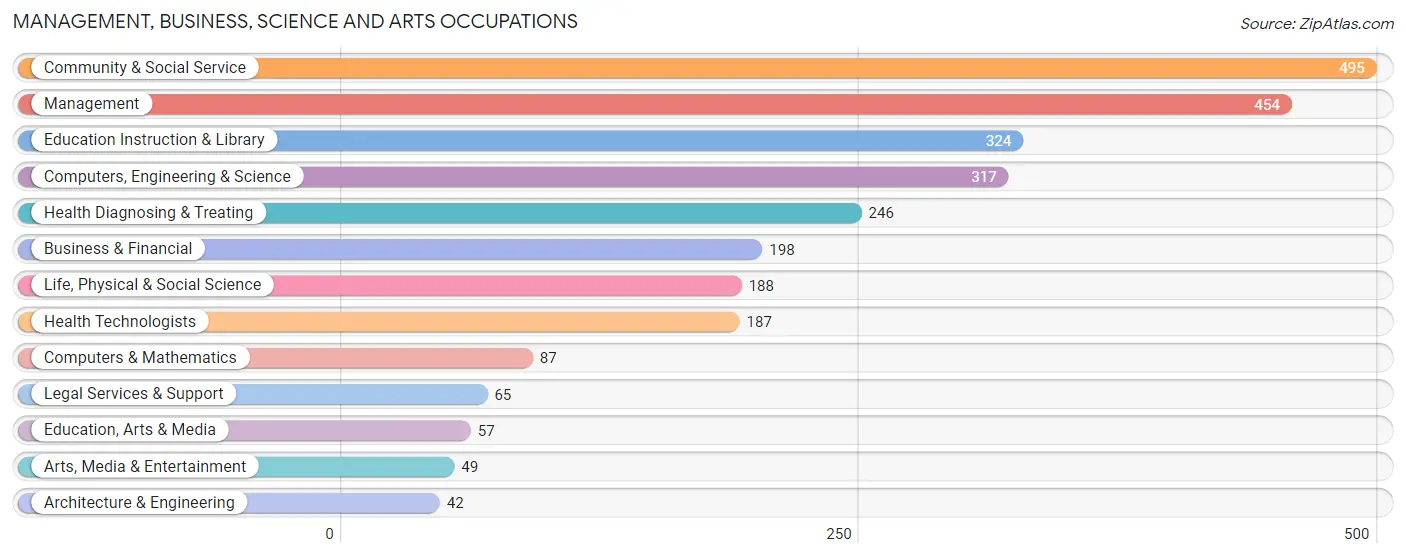
Management, Business, Science and Arts Occupations
The most common Management, Business, Science and Arts occupations in Chena Ridge are Community & Social Service (495 | 17.6%), Management (454 | 16.1%), Education Instruction & Library (324 | 11.5%), Computers, Engineering & Science (317 | 11.3%), and Health Diagnosing & Treating (246 | 8.7%).
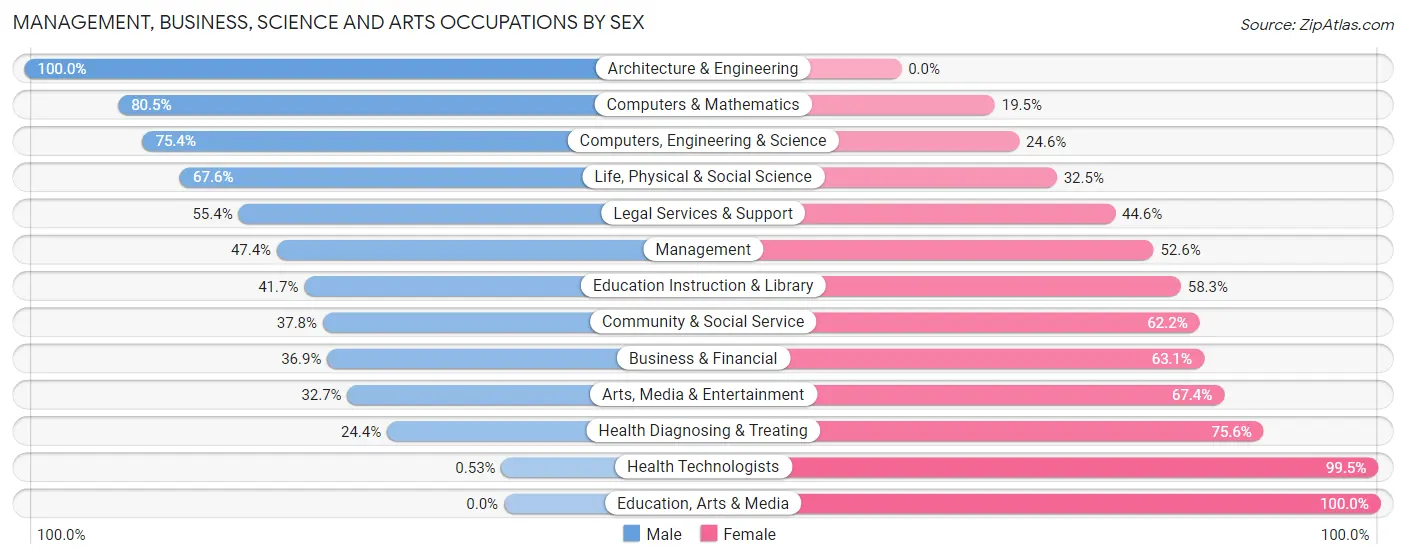
Management, Business, Science and Arts Occupations by Sex
Within the Management, Business, Science and Arts occupations in Chena Ridge, the most male-oriented occupations are Architecture & Engineering (100.0%), Computers & Mathematics (80.5%), and Computers, Engineering & Science (75.4%), while the most female-oriented occupations are Education, Arts & Media (100.0%), Health Technologists (99.5%), and Health Diagnosing & Treating (75.6%).
| Occupation | Male | Female |
| Management | 215 (47.4%) | 239 (52.6%) |
| Business & Financial | 73 (36.9%) | 125 (63.1%) |
| Computers, Engineering & Science | 239 (75.4%) | 78 (24.6%) |
| Computers & Mathematics | 70 (80.5%) | 17 (19.5%) |
| Architecture & Engineering | 42 (100.0%) | 0 (0.0%) |
| Life, Physical & Social Science | 127 (67.5%) | 61 (32.5%) |
| Community & Social Service | 187 (37.8%) | 308 (62.2%) |
| Education, Arts & Media | 0 (0.0%) | 57 (100.0%) |
| Legal Services & Support | 36 (55.4%) | 29 (44.6%) |
| Education Instruction & Library | 135 (41.7%) | 189 (58.3%) |
| Arts, Media & Entertainment | 16 (32.7%) | 33 (67.3%) |
| Health Diagnosing & Treating | 60 (24.4%) | 186 (75.6%) |
| Health Technologists | 1 (0.5%) | 186 (99.5%) |
| Total (Category) | 774 (45.3%) | 936 (54.7%) |
| Total (Overall) | 1,303 (46.3%) | 1,512 (53.7%) |
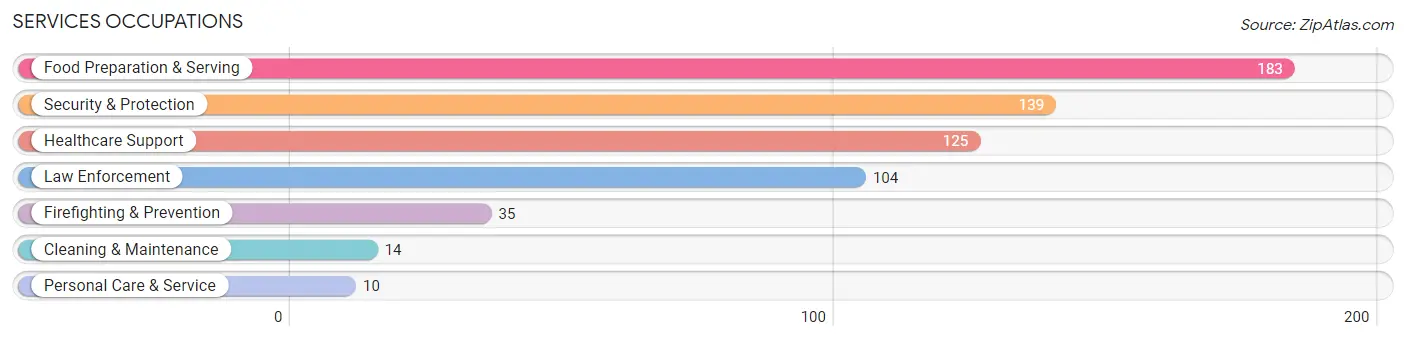
Services Occupations
The most common Services occupations in Chena Ridge are Food Preparation & Serving (183 | 6.5%), Security & Protection (139 | 4.9%), Healthcare Support (125 | 4.4%), Law Enforcement (104 | 3.7%), and Firefighting & Prevention (35 | 1.2%).
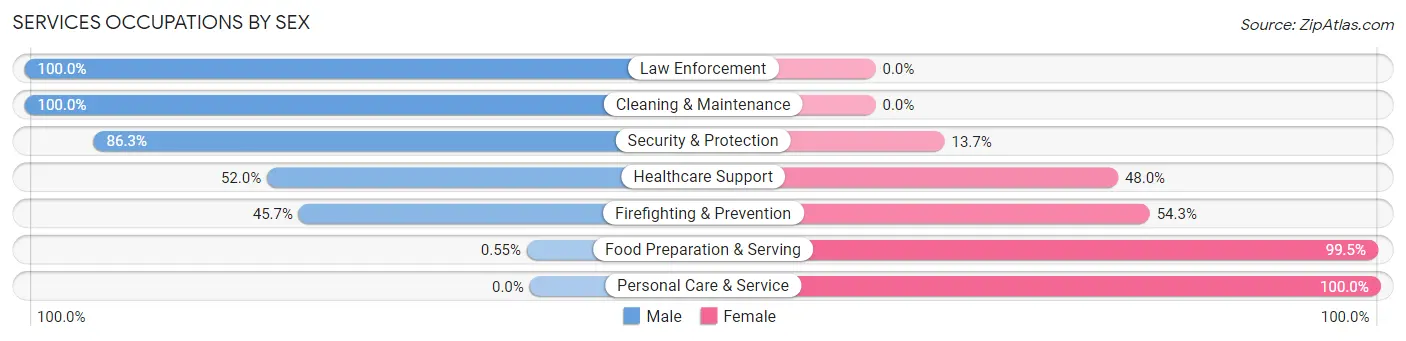
Services Occupations by Sex
Within the Services occupations in Chena Ridge, the most male-oriented occupations are Law Enforcement (100.0%), Cleaning & Maintenance (100.0%), and Security & Protection (86.3%), while the most female-oriented occupations are Personal Care & Service (100.0%), Food Preparation & Serving (99.5%), and Firefighting & Prevention (54.3%).
| Occupation | Male | Female |
| Healthcare Support | 65 (52.0%) | 60 (48.0%) |
| Security & Protection | 120 (86.3%) | 19 (13.7%) |
| Firefighting & Prevention | 16 (45.7%) | 19 (54.3%) |
| Law Enforcement | 104 (100.0%) | 0 (0.0%) |
| Food Preparation & Serving | 1 (0.5%) | 182 (99.5%) |
| Cleaning & Maintenance | 14 (100.0%) | 0 (0.0%) |
| Personal Care & Service | 0 (0.0%) | 10 (100.0%) |
| Total (Category) | 200 (42.5%) | 271 (57.5%) |
| Total (Overall) | 1,303 (46.3%) | 1,512 (53.7%) |
Sales and Office Occupations
The most common Sales and Office occupations in Chena Ridge are Office & Administration (165 | 5.9%), and Sales & Related (161 | 5.7%).
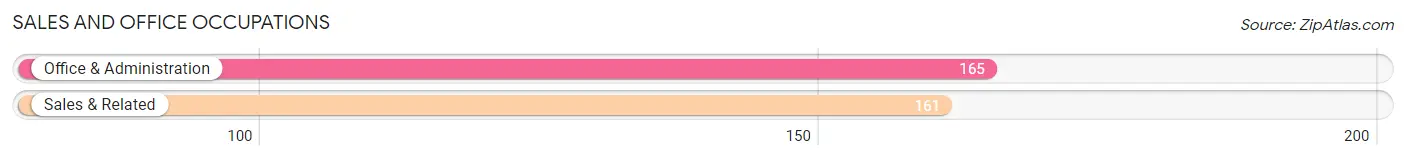
Sales and Office Occupations by Sex

| Occupation | Male | Female |
| Sales & Related | 79 (49.1%) | 82 (50.9%) |
| Office & Administration | 22 (13.3%) | 143 (86.7%) |
| Total (Category) | 101 (31.0%) | 225 (69.0%) |
| Total (Overall) | 1,303 (46.3%) | 1,512 (53.7%) |
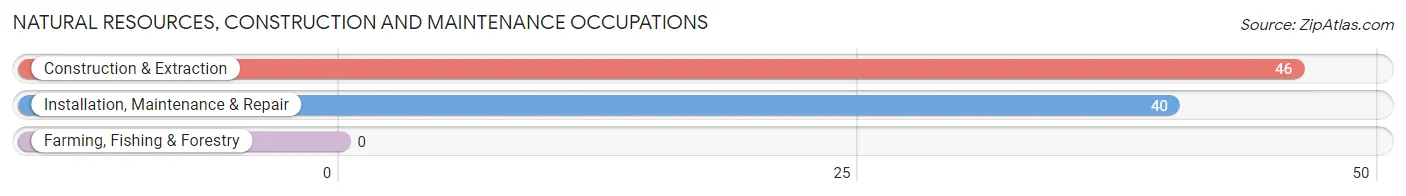
Natural Resources, Construction and Maintenance Occupations
The most common Natural Resources, Construction and Maintenance occupations in Chena Ridge are Construction & Extraction (46 | 1.6%), and Installation, Maintenance & Repair (40 | 1.4%).
Natural Resources, Construction and Maintenance Occupations by Sex
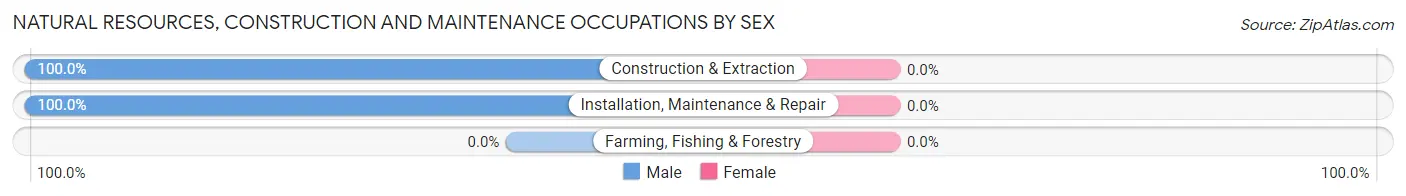
| Occupation | Male | Female |
| Farming, Fishing & Forestry | 0 (0.0%) | 0 (0.0%) |
| Construction & Extraction | 46 (100.0%) | 0 (0.0%) |
| Installation, Maintenance & Repair | 40 (100.0%) | 0 (0.0%) |
| Total (Category) | 86 (100.0%) | 0 (0.0%) |
| Total (Overall) | 1,303 (46.3%) | 1,512 (53.7%) |
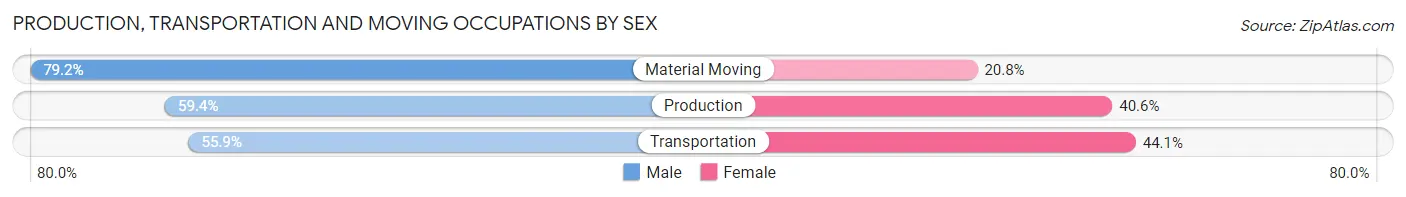
Production, Transportation and Moving Occupations
The most common Production, Transportation and Moving occupations in Chena Ridge are Transportation (118 | 4.2%), Material Moving (72 | 2.6%), and Production (32 | 1.1%).
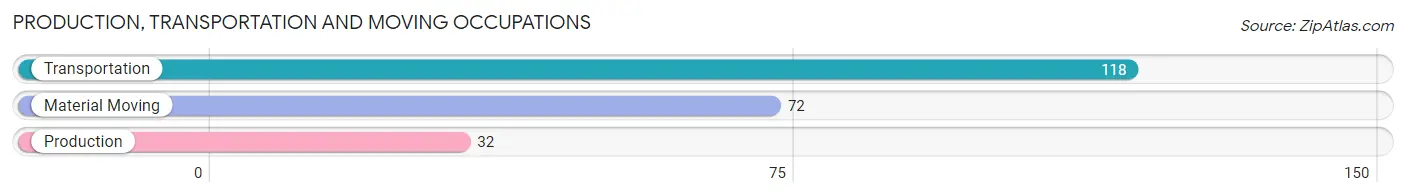
Production, Transportation and Moving Occupations by Sex
| Occupation | Male | Female |
| Production | 19 (59.4%) | 13 (40.6%) |
| Transportation | 66 (55.9%) | 52 (44.1%) |
| Material Moving | 57 (79.2%) | 15 (20.8%) |
| Total (Category) | 142 (64.0%) | 80 (36.0%) |
| Total (Overall) | 1,303 (46.3%) | 1,512 (53.7%) |
Employment Industries by Sex in Chena Ridge
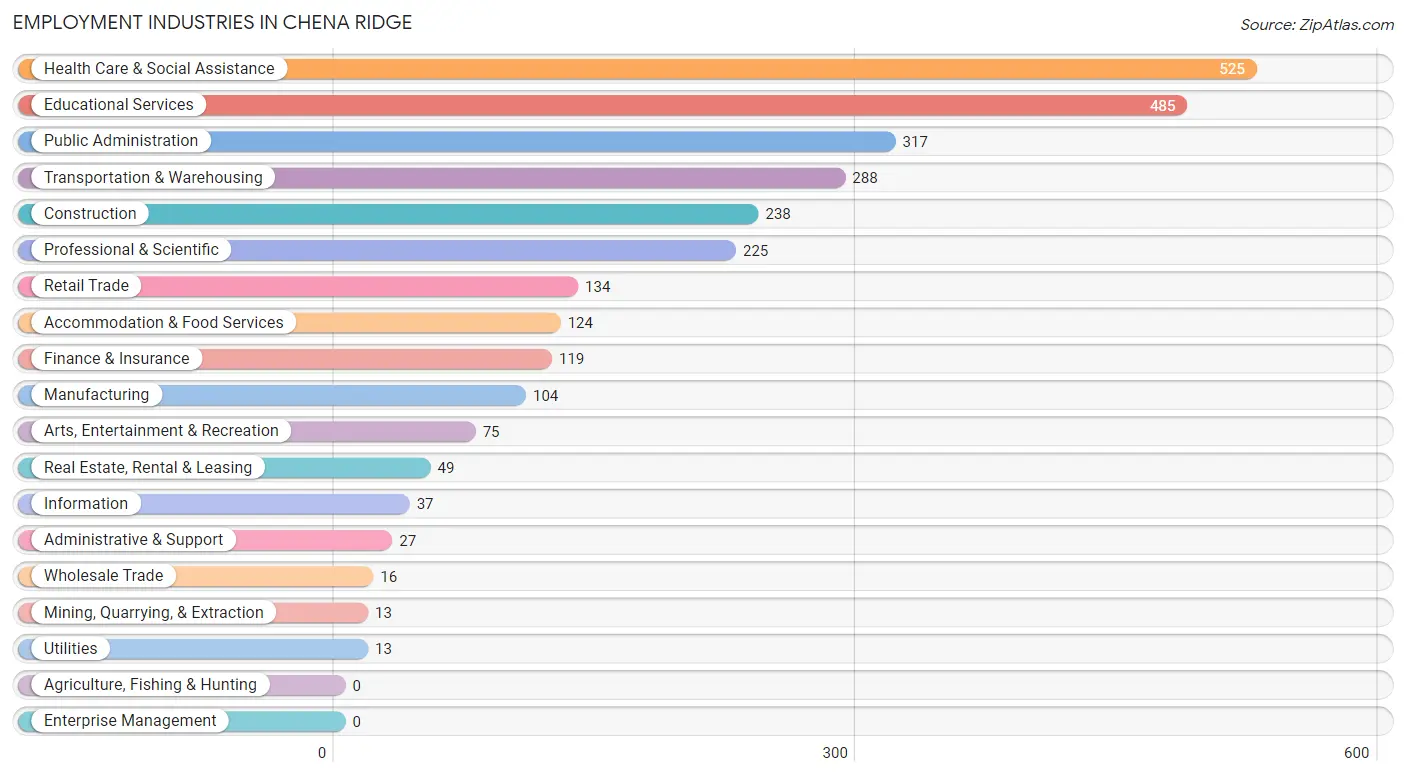
Employment Industries in Chena Ridge
The major employment industries in Chena Ridge include Health Care & Social Assistance (525 | 18.6%), Educational Services (485 | 17.2%), Public Administration (317 | 11.3%), Transportation & Warehousing (288 | 10.2%), and Construction (238 | 8.5%).
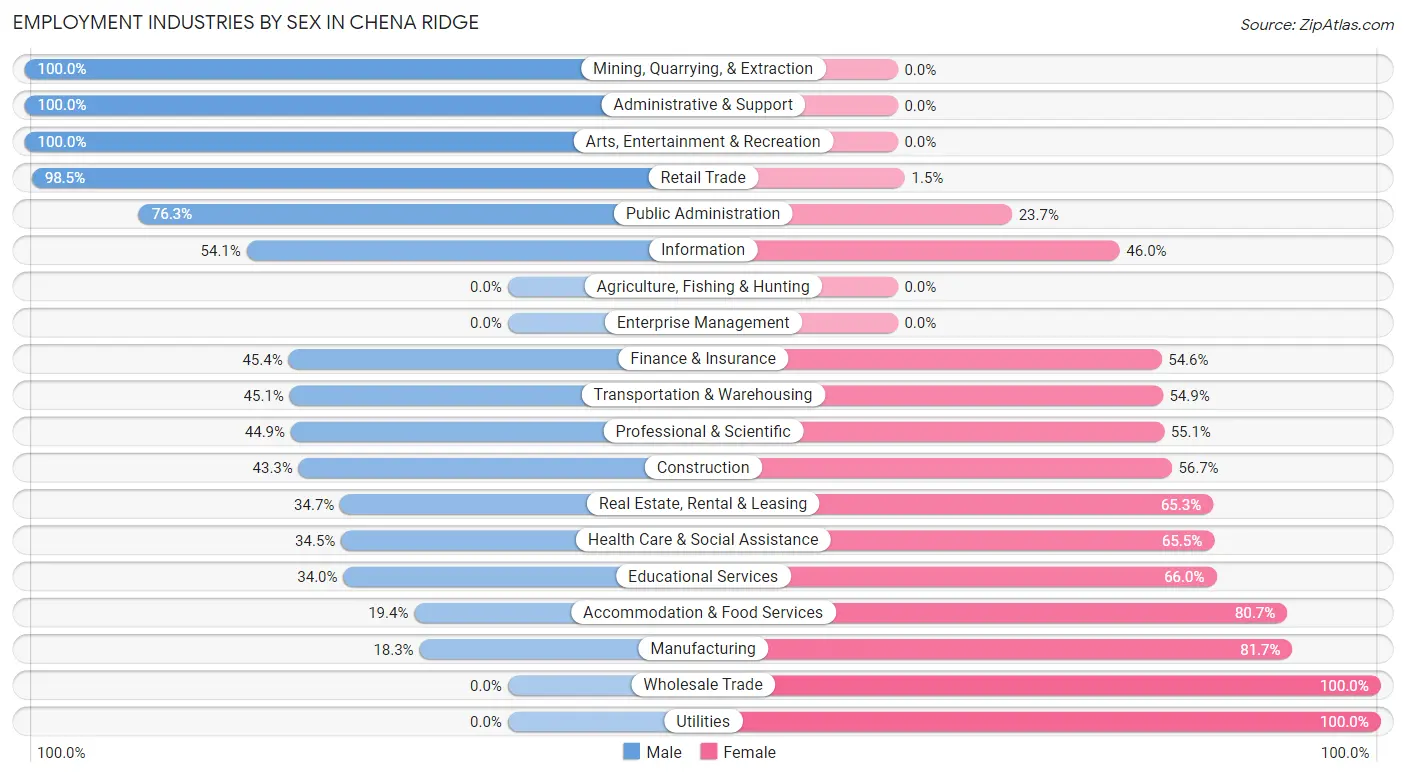
Employment Industries by Sex in Chena Ridge
The Chena Ridge industries that see more men than women are Mining, Quarrying, & Extraction (100.0%), Administrative & Support (100.0%), and Arts, Entertainment & Recreation (100.0%), whereas the industries that tend to have a higher number of women are Wholesale Trade (100.0%), Utilities (100.0%), and Manufacturing (81.7%).
| Industry | Male | Female |
| Agriculture, Fishing & Hunting | 0 (0.0%) | 0 (0.0%) |
| Mining, Quarrying, & Extraction | 13 (100.0%) | 0 (0.0%) |
| Construction | 103 (43.3%) | 135 (56.7%) |
| Manufacturing | 19 (18.3%) | 85 (81.7%) |
| Wholesale Trade | 0 (0.0%) | 16 (100.0%) |
| Retail Trade | 132 (98.5%) | 2 (1.5%) |
| Transportation & Warehousing | 130 (45.1%) | 158 (54.9%) |
| Utilities | 0 (0.0%) | 13 (100.0%) |
| Information | 20 (54.0%) | 17 (46.0%) |
| Finance & Insurance | 54 (45.4%) | 65 (54.6%) |
| Real Estate, Rental & Leasing | 17 (34.7%) | 32 (65.3%) |
| Professional & Scientific | 101 (44.9%) | 124 (55.1%) |
| Enterprise Management | 0 (0.0%) | 0 (0.0%) |
| Administrative & Support | 27 (100.0%) | 0 (0.0%) |
| Educational Services | 165 (34.0%) | 320 (66.0%) |
| Health Care & Social Assistance | 181 (34.5%) | 344 (65.5%) |
| Arts, Entertainment & Recreation | 75 (100.0%) | 0 (0.0%) |
| Accommodation & Food Services | 24 (19.4%) | 100 (80.6%) |
| Public Administration | 242 (76.3%) | 75 (23.7%) |
| Total | 1,303 (46.3%) | 1,512 (53.7%) |
Education in Chena Ridge
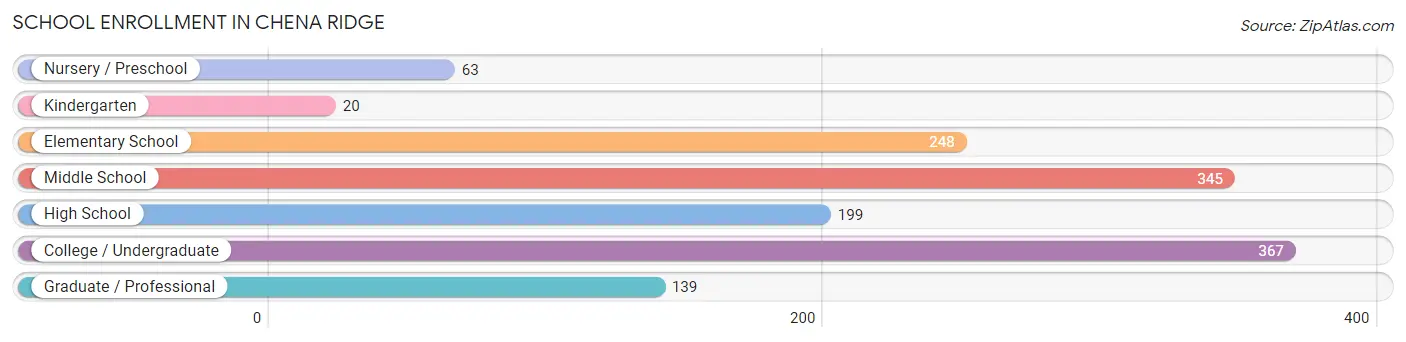
School Enrollment in Chena Ridge
The most common levels of schooling among the 1,381 students in Chena Ridge are college / undergraduate (367 | 26.6%), middle school (345 | 25.0%), and elementary school (248 | 18.0%).
| School Level | # Students | % Students |
| Nursery / Preschool | 63 | 4.6% |
| Kindergarten | 20 | 1.5% |
| Elementary School | 248 | 18.0% |
| Middle School | 345 | 25.0% |
| High School | 199 | 14.4% |
| College / Undergraduate | 367 | 26.6% |
| Graduate / Professional | 139 | 10.1% |
| Total | 1,381 | 100.0% |
School Enrollment by Age by Funding Source in Chena Ridge
Out of a total of 1,381 students who are enrolled in schools in Chena Ridge, 220 (15.9%) attend a private institution, while the remaining 1,161 (84.1%) are enrolled in public schools. The age group of 3 to 4 year olds has the highest likelihood of being enrolled in private schools, with 74 (100.0% in the age bracket) enrolled. Conversely, the age group of 25 to 34 year olds has the lowest likelihood of being enrolled in a private school, with 63 (100.0% in the age bracket) attending a public institution.
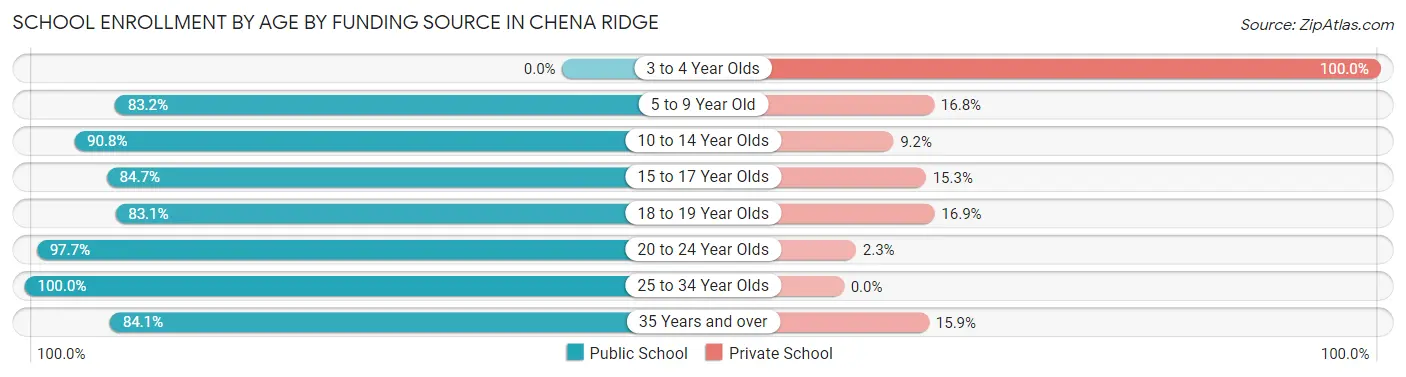
| Age Bracket | Public School | Private School |
| 3 to 4 Year Olds | 0 (0.0%) | 74 (100.0%) |
| 5 to 9 Year Old | 198 (83.2%) | 40 (16.8%) |
| 10 to 14 Year Olds | 423 (90.8%) | 43 (9.2%) |
| 15 to 17 Year Olds | 72 (84.7%) | 13 (15.3%) |
| 18 to 19 Year Olds | 59 (83.1%) | 12 (16.9%) |
| 20 to 24 Year Olds | 172 (97.7%) | 4 (2.3%) |
| 25 to 34 Year Olds | 63 (100.0%) | 0 (0.0%) |
| 35 Years and over | 175 (84.1%) | 33 (15.9%) |
| Total | 1,161 (84.1%) | 220 (15.9%) |
Educational Attainment by Field of Study in Chena Ridge
Literature & languages (263 | 12.3%), social sciences (255 | 11.9%), bio, nature & agricultural (218 | 10.2%), business (197 | 9.2%), and physical & health sciences (182 | 8.5%) are the most common fields of study among 2,137 individuals in Chena Ridge who have obtained a bachelor's degree or higher.
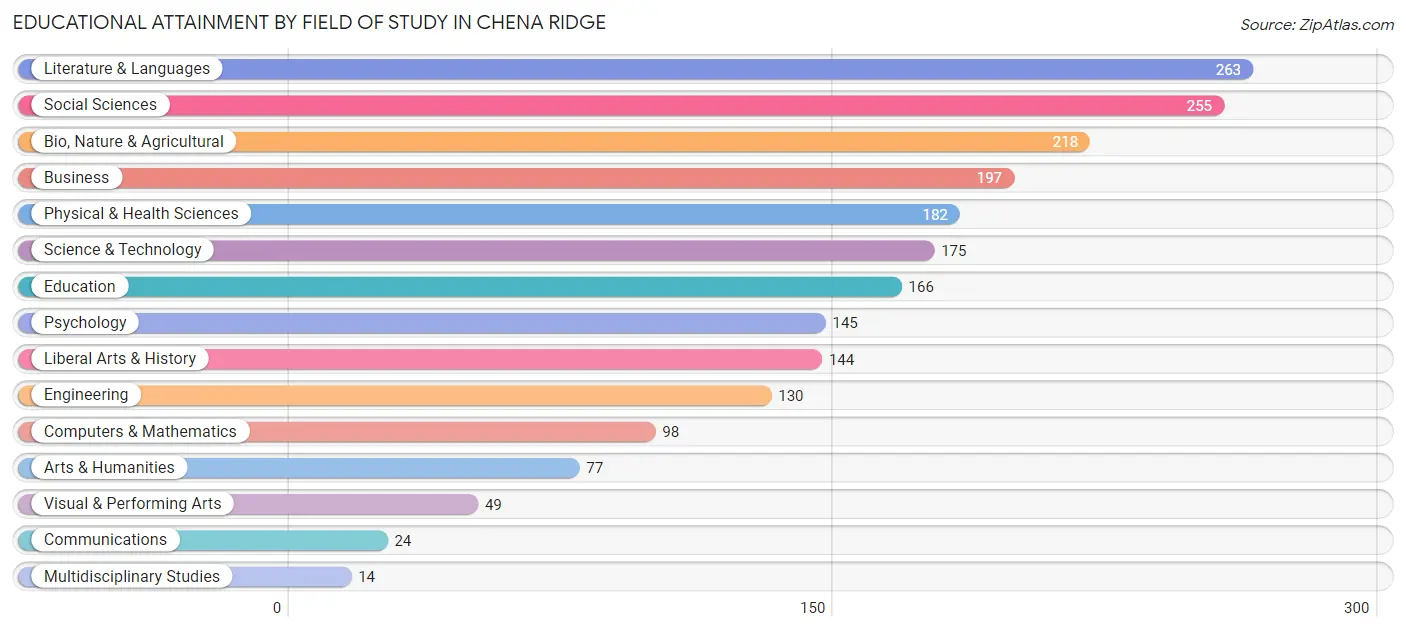
| Field of Study | # Graduates | % Graduates |
| Computers & Mathematics | 98 | 4.6% |
| Bio, Nature & Agricultural | 218 | 10.2% |
| Physical & Health Sciences | 182 | 8.5% |
| Psychology | 145 | 6.8% |
| Social Sciences | 255 | 11.9% |
| Engineering | 130 | 6.1% |
| Multidisciplinary Studies | 14 | 0.7% |
| Science & Technology | 175 | 8.2% |
| Business | 197 | 9.2% |
| Education | 166 | 7.8% |
| Literature & Languages | 263 | 12.3% |
| Liberal Arts & History | 144 | 6.7% |
| Visual & Performing Arts | 49 | 2.3% |
| Communications | 24 | 1.1% |
| Arts & Humanities | 77 | 3.6% |
| Total | 2,137 | 100.0% |
Transportation & Commute in Chena Ridge
Vehicle Availability by Sex in Chena Ridge
The most prevalent vehicle ownership categories in Chena Ridge are males with 2 vehicles (892, accounting for 67.2%) and females with 2 vehicles (792, making up 60.4%).
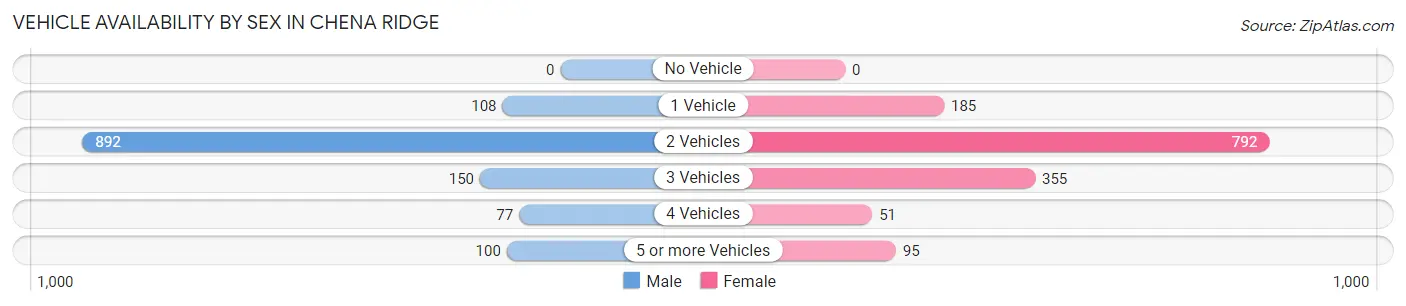
| Vehicles Available | Male | Female |
| No Vehicle | 0 (0.0%) | 0 (0.0%) |
| 1 Vehicle | 108 (8.1%) | 185 (12.5%) |
| 2 Vehicles | 892 (67.2%) | 792 (53.6%) |
| 3 Vehicles | 150 (11.3%) | 355 (24.0%) |
| 4 Vehicles | 77 (5.8%) | 51 (3.5%) |
| 5 or more Vehicles | 100 (7.5%) | 95 (6.4%) |
| Total | 1,327 (100.0%) | 1,478 (100.0%) |
Commute Time in Chena Ridge
The most frequently occuring commute durations in Chena Ridge are 15 to 19 minutes (815 commuters, 31.7%), 20 to 24 minutes (472 commuters, 18.3%), and 10 to 14 minutes (470 commuters, 18.3%).
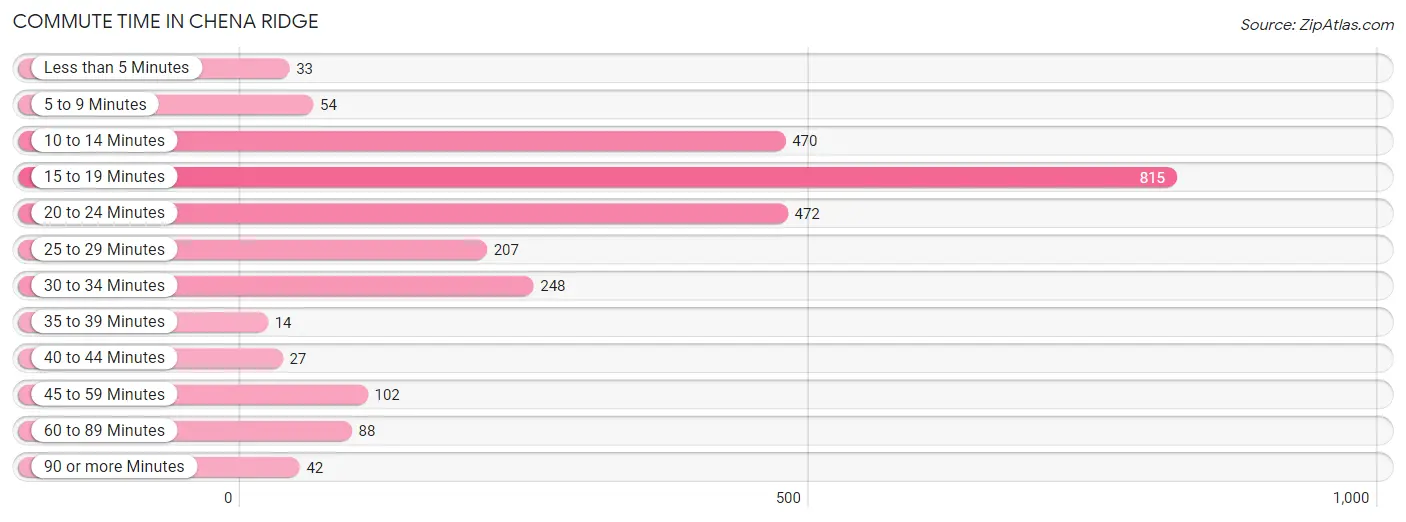
| Commute Time | # Commuters | % Commuters |
| Less than 5 Minutes | 33 | 1.3% |
| 5 to 9 Minutes | 54 | 2.1% |
| 10 to 14 Minutes | 470 | 18.3% |
| 15 to 19 Minutes | 815 | 31.7% |
| 20 to 24 Minutes | 472 | 18.3% |
| 25 to 29 Minutes | 207 | 8.1% |
| 30 to 34 Minutes | 248 | 9.6% |
| 35 to 39 Minutes | 14 | 0.5% |
| 40 to 44 Minutes | 27 | 1.1% |
| 45 to 59 Minutes | 102 | 4.0% |
| 60 to 89 Minutes | 88 | 3.4% |
| 90 or more Minutes | 42 | 1.6% |
Commute Time by Sex in Chena Ridge
The most common commute times in Chena Ridge are 15 to 19 minutes (389 commuters, 31.5%) for males and 15 to 19 minutes (426 commuters, 31.8%) for females.
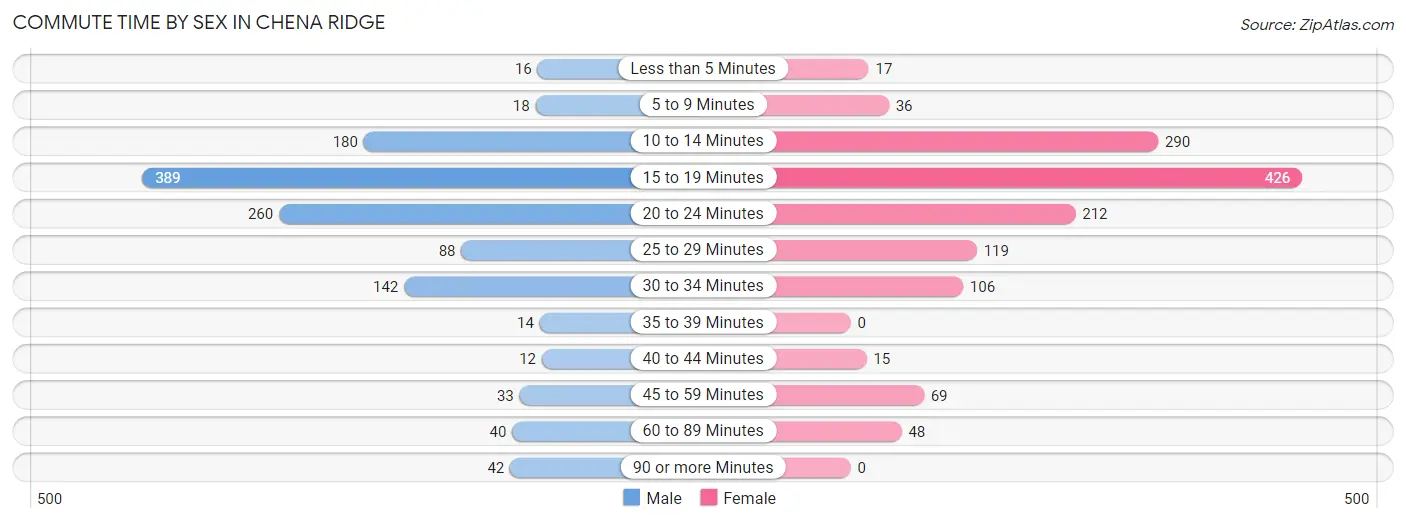
| Commute Time | Male | Female |
| Less than 5 Minutes | 16 (1.3%) | 17 (1.3%) |
| 5 to 9 Minutes | 18 (1.5%) | 36 (2.7%) |
| 10 to 14 Minutes | 180 (14.6%) | 290 (21.7%) |
| 15 to 19 Minutes | 389 (31.5%) | 426 (31.8%) |
| 20 to 24 Minutes | 260 (21.1%) | 212 (15.8%) |
| 25 to 29 Minutes | 88 (7.1%) | 119 (8.9%) |
| 30 to 34 Minutes | 142 (11.5%) | 106 (7.9%) |
| 35 to 39 Minutes | 14 (1.1%) | 0 (0.0%) |
| 40 to 44 Minutes | 12 (1.0%) | 15 (1.1%) |
| 45 to 59 Minutes | 33 (2.7%) | 69 (5.2%) |
| 60 to 89 Minutes | 40 (3.2%) | 48 (3.6%) |
| 90 or more Minutes | 42 (3.4%) | 0 (0.0%) |
Time of Departure to Work by Sex in Chena Ridge
The most frequent times of departure to work in Chena Ridge are 7:30 AM to 7:59 AM (234, 19.0%) for males and 7:30 AM to 7:59 AM (368, 27.5%) for females.
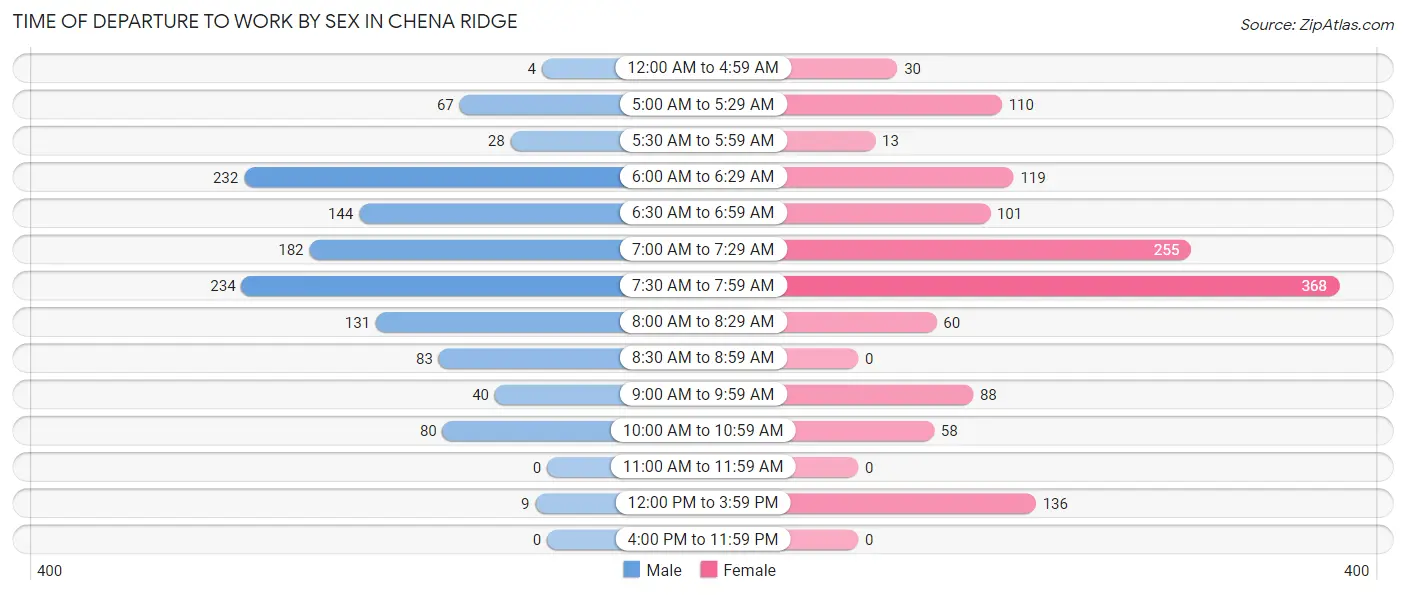
| Time of Departure | Male | Female |
| 12:00 AM to 4:59 AM | 4 (0.3%) | 30 (2.2%) |
| 5:00 AM to 5:29 AM | 67 (5.4%) | 110 (8.2%) |
| 5:30 AM to 5:59 AM | 28 (2.3%) | 13 (1.0%) |
| 6:00 AM to 6:29 AM | 232 (18.8%) | 119 (8.9%) |
| 6:30 AM to 6:59 AM | 144 (11.7%) | 101 (7.5%) |
| 7:00 AM to 7:29 AM | 182 (14.7%) | 255 (19.1%) |
| 7:30 AM to 7:59 AM | 234 (19.0%) | 368 (27.5%) |
| 8:00 AM to 8:29 AM | 131 (10.6%) | 60 (4.5%) |
| 8:30 AM to 8:59 AM | 83 (6.7%) | 0 (0.0%) |
| 9:00 AM to 9:59 AM | 40 (3.2%) | 88 (6.6%) |
| 10:00 AM to 10:59 AM | 80 (6.5%) | 58 (4.3%) |
| 11:00 AM to 11:59 AM | 0 (0.0%) | 0 (0.0%) |
| 12:00 PM to 3:59 PM | 9 (0.7%) | 136 (10.2%) |
| 4:00 PM to 11:59 PM | 0 (0.0%) | 0 (0.0%) |
| Total | 1,234 (100.0%) | 1,338 (100.0%) |
Housing Occupancy in Chena Ridge
Occupancy by Ownership in Chena Ridge
Of the total 2,157 dwellings in Chena Ridge, owner-occupied units account for 1,528 (70.8%), while renter-occupied units make up 629 (29.2%).
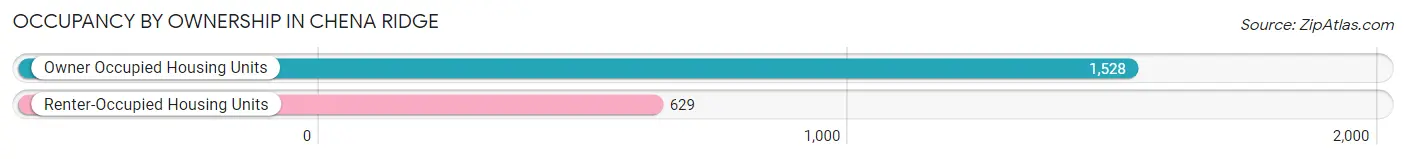
| Occupancy | # Housing Units | % Housing Units |
| Owner Occupied Housing Units | 1,528 | 70.8% |
| Renter-Occupied Housing Units | 629 | 29.2% |
| Total Occupied Housing Units | 2,157 | 100.0% |
Occupancy by Household Size in Chena Ridge
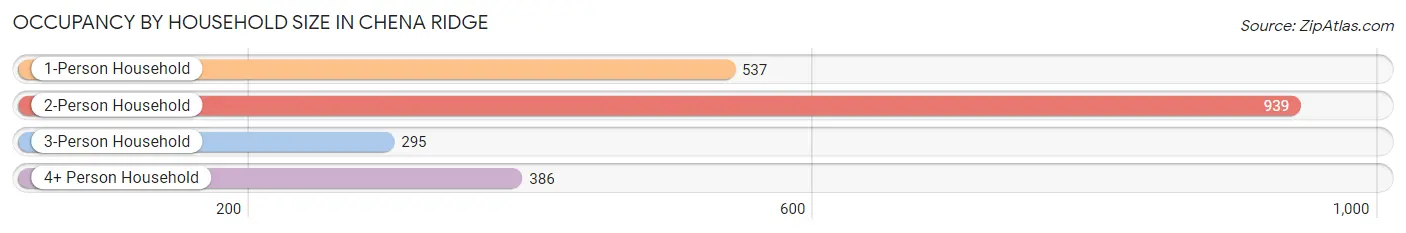
| Household Size | # Housing Units | % Housing Units |
| 1-Person Household | 537 | 24.9% |
| 2-Person Household | 939 | 43.5% |
| 3-Person Household | 295 | 13.7% |
| 4+ Person Household | 386 | 17.9% |
| Total Housing Units | 2,157 | 100.0% |
Occupancy by Ownership by Household Size in Chena Ridge
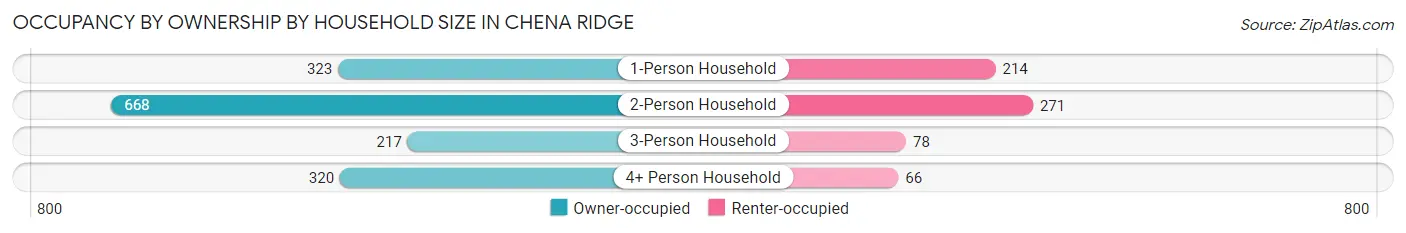
| Household Size | Owner-occupied | Renter-occupied |
| 1-Person Household | 323 (60.2%) | 214 (39.9%) |
| 2-Person Household | 668 (71.1%) | 271 (28.9%) |
| 3-Person Household | 217 (73.6%) | 78 (26.4%) |
| 4+ Person Household | 320 (82.9%) | 66 (17.1%) |
| Total Housing Units | 1,528 (70.8%) | 629 (29.2%) |
Occupancy by Educational Attainment in Chena Ridge
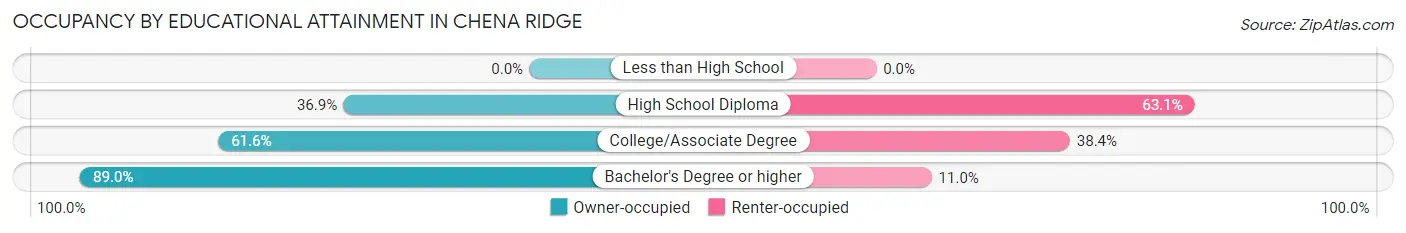
| Household Size | Owner-occupied | Renter-occupied |
| Less than High School | 0 (0.0%) | 0 (0.0%) |
| High School Diploma | 156 (36.9%) | 267 (63.1%) |
| College/Associate Degree | 385 (61.6%) | 240 (38.4%) |
| Bachelor's Degree or higher | 987 (89.0%) | 122 (11.0%) |
Occupancy by Age of Householder in Chena Ridge
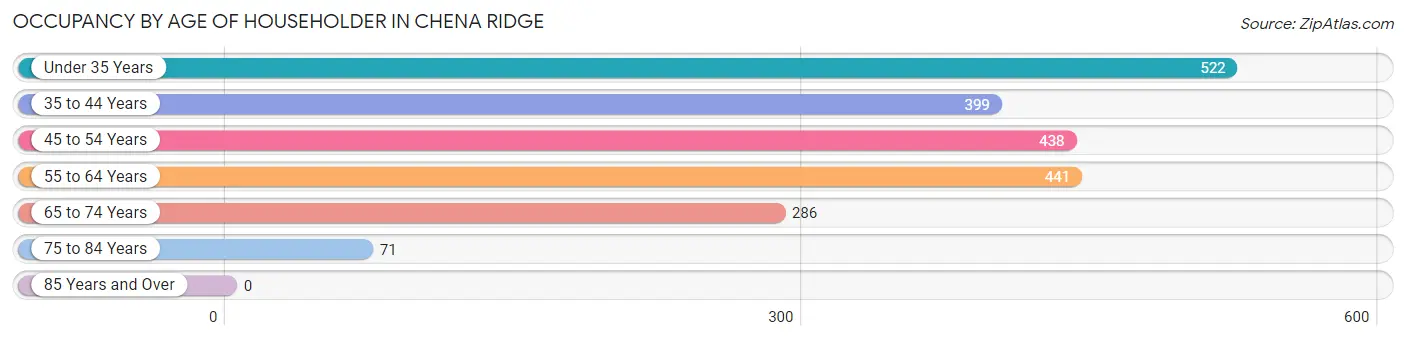
| Age Bracket | # Households | % Households |
| Under 35 Years | 522 | 24.2% |
| 35 to 44 Years | 399 | 18.5% |
| 45 to 54 Years | 438 | 20.3% |
| 55 to 64 Years | 441 | 20.4% |
| 65 to 74 Years | 286 | 13.3% |
| 75 to 84 Years | 71 | 3.3% |
| 85 Years and Over | 0 | 0.0% |
| Total | 2,157 | 100.0% |
Housing Finances in Chena Ridge
Median Income by Occupancy in Chena Ridge
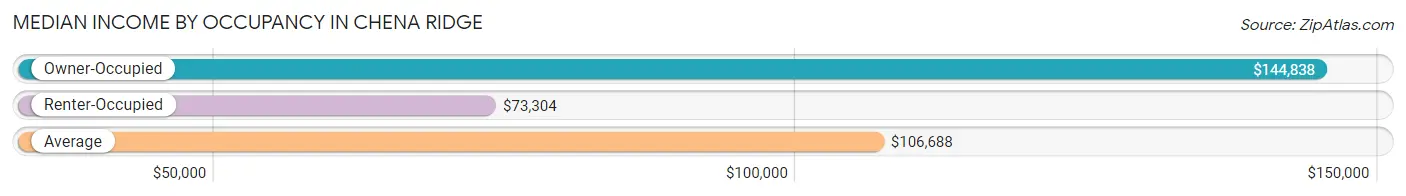
| Occupancy Type | # Households | Median Income |
| Owner-Occupied | 1,528 (70.8%) | $144,838 |
| Renter-Occupied | 629 (29.2%) | $73,304 |
| Average | 2,157 (100.0%) | $106,688 |
Occupancy by Householder Income Bracket in Chena Ridge
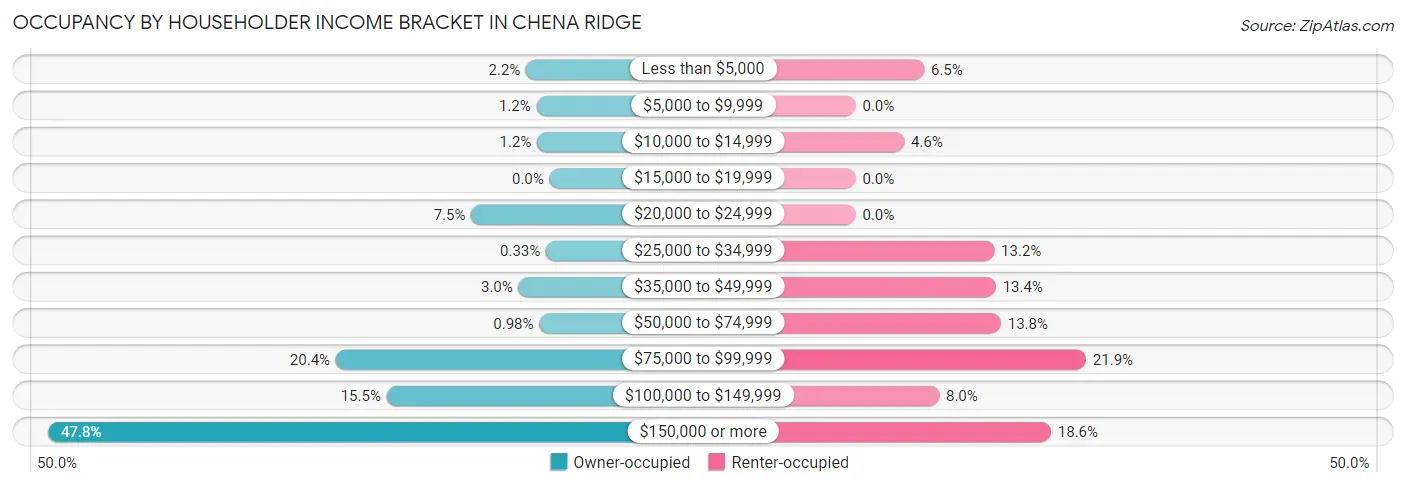
| Income Bracket | Owner-occupied | Renter-occupied |
| Less than $5,000 | 34 (2.2%) | 41 (6.5%) |
| $5,000 to $9,999 | 19 (1.2%) | 0 (0.0%) |
| $10,000 to $14,999 | 18 (1.2%) | 29 (4.6%) |
| $15,000 to $19,999 | 0 (0.0%) | 0 (0.0%) |
| $20,000 to $24,999 | 114 (7.5%) | 0 (0.0%) |
| $25,000 to $34,999 | 5 (0.3%) | 83 (13.2%) |
| $35,000 to $49,999 | 45 (2.9%) | 84 (13.4%) |
| $50,000 to $74,999 | 15 (1.0%) | 87 (13.8%) |
| $75,000 to $99,999 | 311 (20.3%) | 138 (21.9%) |
| $100,000 to $149,999 | 237 (15.5%) | 50 (8.0%) |
| $150,000 or more | 730 (47.8%) | 117 (18.6%) |
| Total | 1,528 (100.0%) | 629 (100.0%) |
Monthly Housing Cost Tiers in Chena Ridge
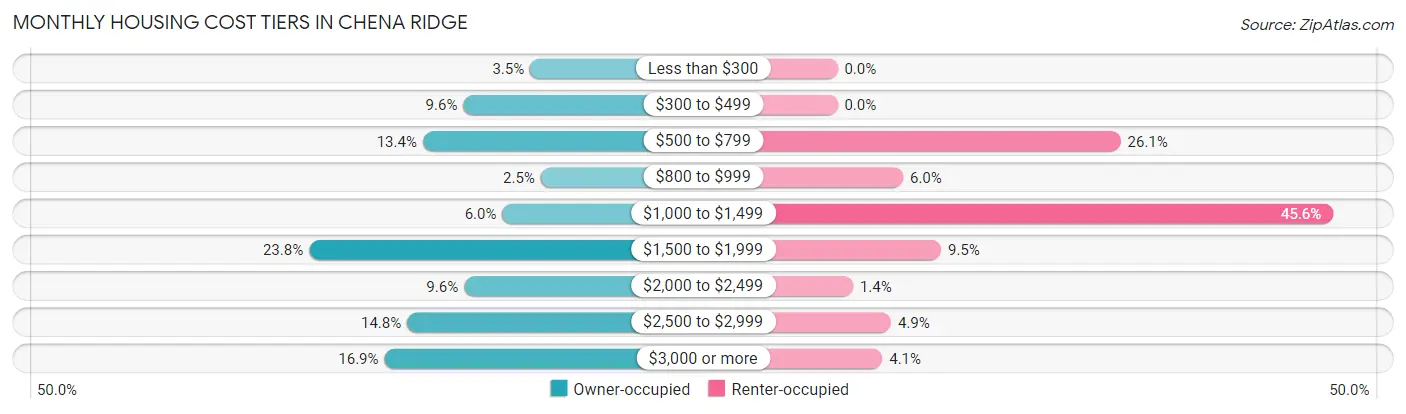
| Monthly Cost | Owner-occupied | Renter-occupied |
| Less than $300 | 53 (3.5%) | 0 (0.0%) |
| $300 to $499 | 147 (9.6%) | 0 (0.0%) |
| $500 to $799 | 204 (13.4%) | 164 (26.1%) |
| $800 to $999 | 38 (2.5%) | 38 (6.0%) |
| $1,000 to $1,499 | 92 (6.0%) | 287 (45.6%) |
| $1,500 to $1,999 | 364 (23.8%) | 60 (9.5%) |
| $2,000 to $2,499 | 146 (9.6%) | 9 (1.4%) |
| $2,500 to $2,999 | 226 (14.8%) | 31 (4.9%) |
| $3,000 or more | 258 (16.9%) | 26 (4.1%) |
| Total | 1,528 (100.0%) | 629 (100.0%) |
Physical Housing Characteristics in Chena Ridge
Housing Structures in Chena Ridge
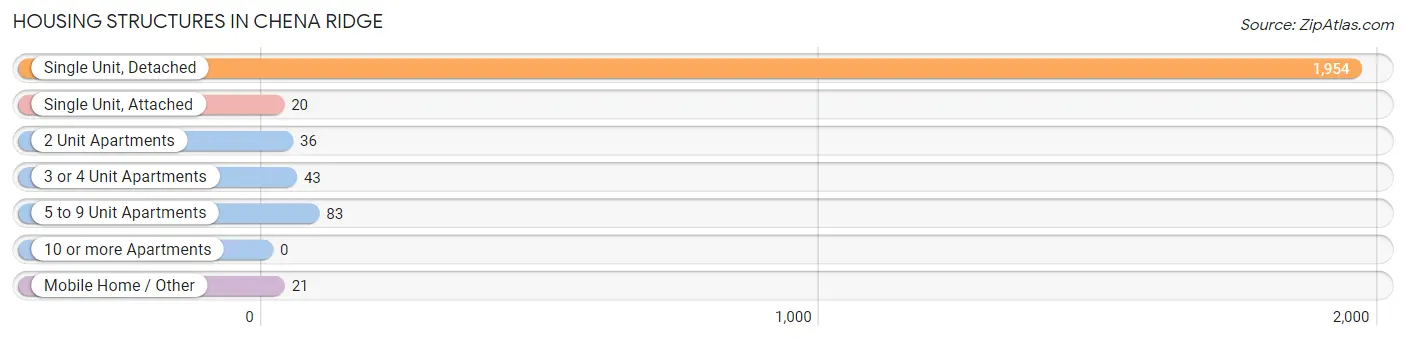
| Structure Type | # Housing Units | % Housing Units |
| Single Unit, Detached | 1,954 | 90.6% |
| Single Unit, Attached | 20 | 0.9% |
| 2 Unit Apartments | 36 | 1.7% |
| 3 or 4 Unit Apartments | 43 | 2.0% |
| 5 to 9 Unit Apartments | 83 | 3.8% |
| 10 or more Apartments | 0 | 0.0% |
| Mobile Home / Other | 21 | 1.0% |
| Total | 2,157 | 100.0% |
Housing Structures by Occupancy in Chena Ridge
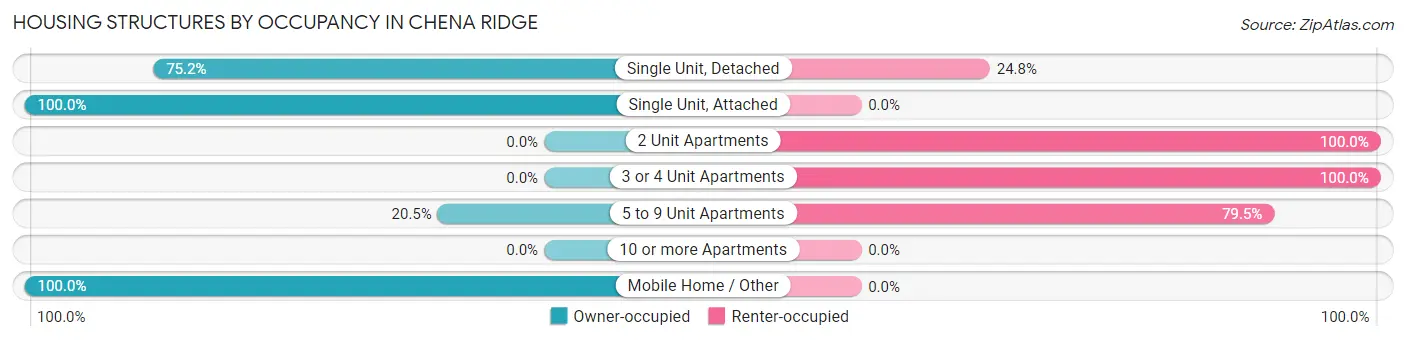
| Structure Type | Owner-occupied | Renter-occupied |
| Single Unit, Detached | 1,470 (75.2%) | 484 (24.8%) |
| Single Unit, Attached | 20 (100.0%) | 0 (0.0%) |
| 2 Unit Apartments | 0 (0.0%) | 36 (100.0%) |
| 3 or 4 Unit Apartments | 0 (0.0%) | 43 (100.0%) |
| 5 to 9 Unit Apartments | 17 (20.5%) | 66 (79.5%) |
| 10 or more Apartments | 0 (0.0%) | 0 (0.0%) |
| Mobile Home / Other | 21 (100.0%) | 0 (0.0%) |
| Total | 1,528 (70.8%) | 629 (29.2%) |
Housing Structures by Number of Rooms in Chena Ridge
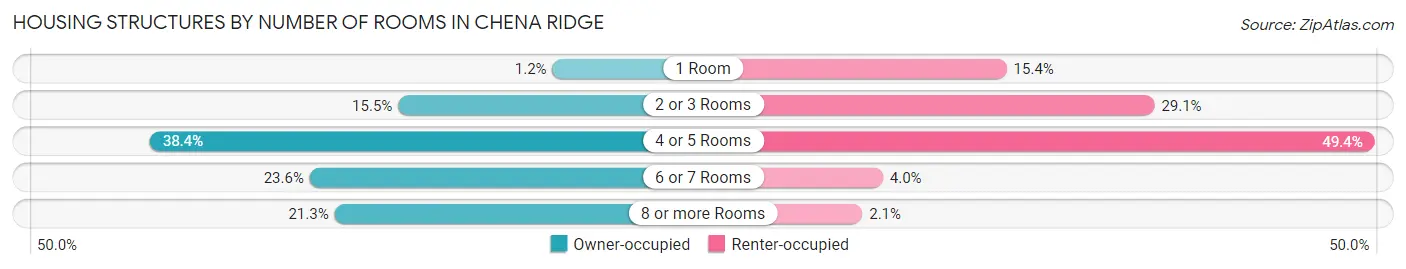
| Number of Rooms | Owner-occupied | Renter-occupied |
| 1 Room | 18 (1.2%) | 97 (15.4%) |
| 2 or 3 Rooms | 236 (15.4%) | 183 (29.1%) |
| 4 or 5 Rooms | 587 (38.4%) | 311 (49.4%) |
| 6 or 7 Rooms | 361 (23.6%) | 25 (4.0%) |
| 8 or more Rooms | 326 (21.3%) | 13 (2.1%) |
| Total | 1,528 (100.0%) | 629 (100.0%) |
Housing Structure by Heating Type in Chena Ridge
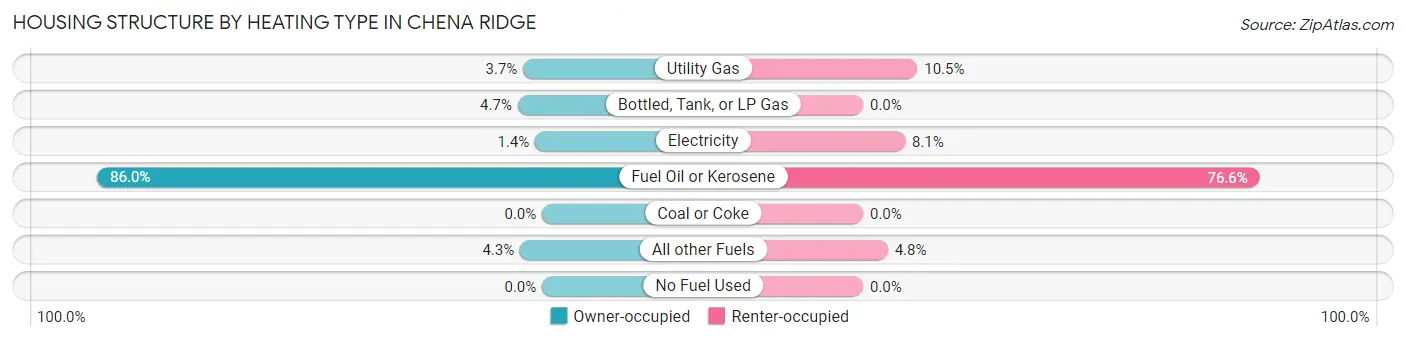
| Heating Type | Owner-occupied | Renter-occupied |
| Utility Gas | 56 (3.7%) | 66 (10.5%) |
| Bottled, Tank, or LP Gas | 72 (4.7%) | 0 (0.0%) |
| Electricity | 21 (1.4%) | 51 (8.1%) |
| Fuel Oil or Kerosene | 1,314 (86.0%) | 482 (76.6%) |
| Coal or Coke | 0 (0.0%) | 0 (0.0%) |
| All other Fuels | 65 (4.3%) | 30 (4.8%) |
| No Fuel Used | 0 (0.0%) | 0 (0.0%) |
| Total | 1,528 (100.0%) | 629 (100.0%) |
Household Vehicle Usage in Chena Ridge
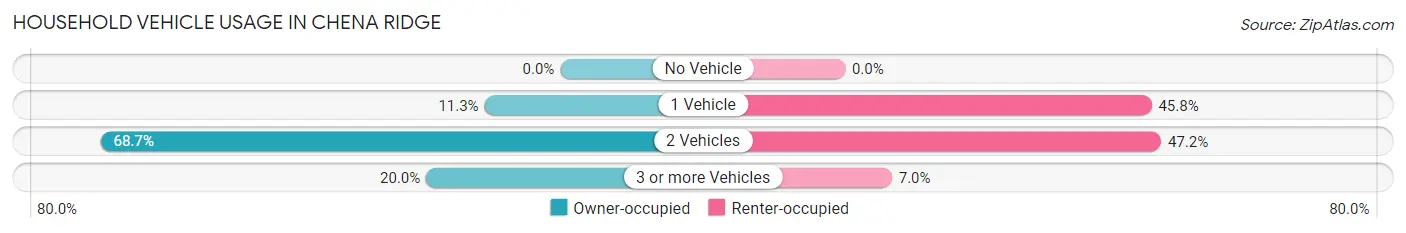
| Vehicles per Household | Owner-occupied | Renter-occupied |
| No Vehicle | 0 (0.0%) | 0 (0.0%) |
| 1 Vehicle | 173 (11.3%) | 288 (45.8%) |
| 2 Vehicles | 1,049 (68.6%) | 297 (47.2%) |
| 3 or more Vehicles | 306 (20.0%) | 44 (7.0%) |
| Total | 1,528 (100.0%) | 629 (100.0%) |
Real Estate & Mortgages in Chena Ridge
Real Estate and Mortgage Overview in Chena Ridge
| Characteristic | Without Mortgage | With Mortgage |
| Housing Units | 498 | 1,030 |
| Median Property Value | $360,400 | $358,300 |
| Median Household Income | $93,163 | $592 |
| Monthly Housing Costs | $678 | $258 |
| Real Estate Taxes | $4,875 | $0 |
Property Value by Mortgage Status in Chena Ridge
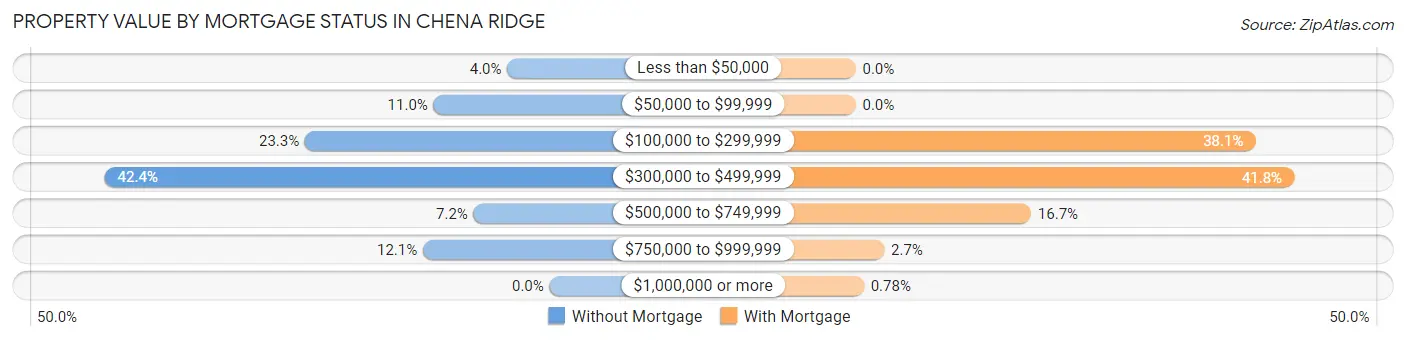
| Property Value | Without Mortgage | With Mortgage |
| Less than $50,000 | 20 (4.0%) | 0 (0.0%) |
| $50,000 to $99,999 | 55 (11.0%) | 0 (0.0%) |
| $100,000 to $299,999 | 116 (23.3%) | 392 (38.1%) |
| $300,000 to $499,999 | 211 (42.4%) | 430 (41.7%) |
| $500,000 to $749,999 | 36 (7.2%) | 172 (16.7%) |
| $750,000 to $999,999 | 60 (12.0%) | 28 (2.7%) |
| $1,000,000 or more | 0 (0.0%) | 8 (0.8%) |
| Total | 498 (100.0%) | 1,030 (100.0%) |
Household Income by Mortgage Status in Chena Ridge
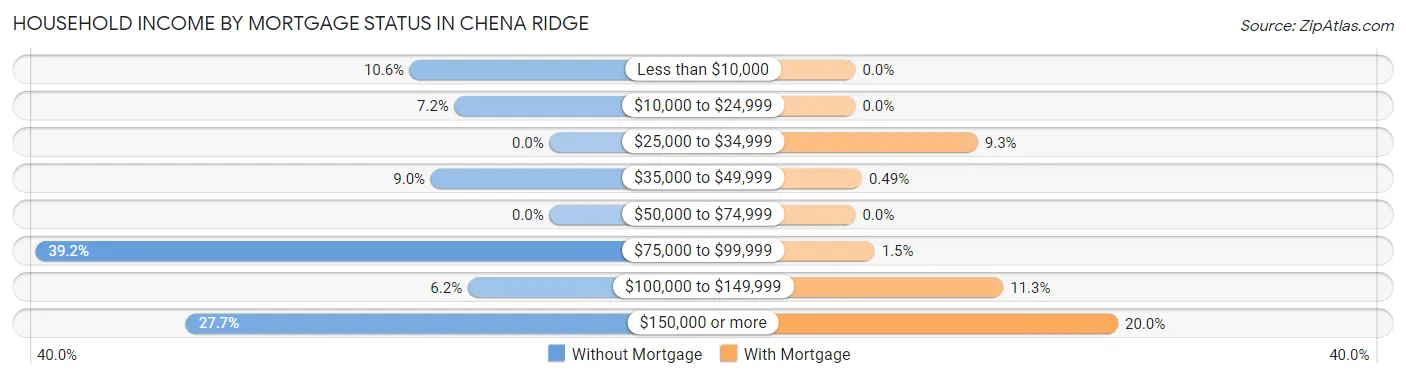
| Household Income | Without Mortgage | With Mortgage |
| Less than $10,000 | 53 (10.6%) | 0 (0.0%) |
| $10,000 to $24,999 | 36 (7.2%) | 0 (0.0%) |
| $25,000 to $34,999 | 0 (0.0%) | 96 (9.3%) |
| $35,000 to $49,999 | 45 (9.0%) | 5 (0.5%) |
| $50,000 to $74,999 | 0 (0.0%) | 0 (0.0%) |
| $75,000 to $99,999 | 195 (39.2%) | 15 (1.5%) |
| $100,000 to $149,999 | 31 (6.2%) | 116 (11.3%) |
| $150,000 or more | 138 (27.7%) | 206 (20.0%) |
| Total | 498 (100.0%) | 1,030 (100.0%) |
Property Value to Household Income Ratio in Chena Ridge
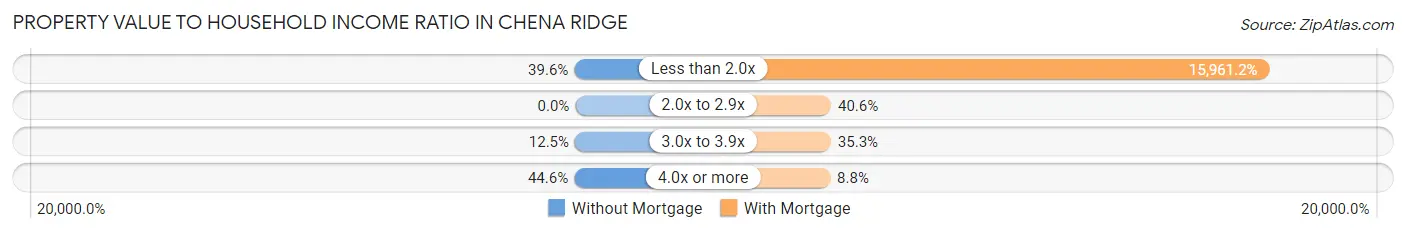
| Value-to-Income Ratio | Without Mortgage | With Mortgage |
| Less than 2.0x | 197 (39.6%) | 164,400 (15,961.2%) |
| 2.0x to 2.9x | 0 (0.0%) | 418 (40.6%) |
| 3.0x to 3.9x | 62 (12.4%) | 364 (35.3%) |
| 4.0x or more | 222 (44.6%) | 91 (8.8%) |
| Total | 498 (100.0%) | 1,030 (100.0%) |
Real Estate Taxes by Mortgage Status in Chena Ridge
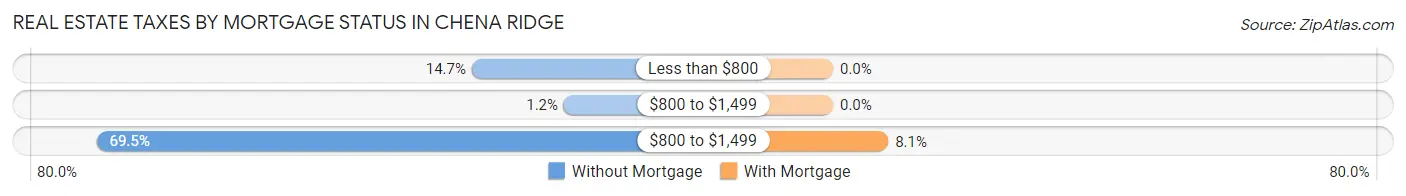
| Property Taxes | Without Mortgage | With Mortgage |
| Less than $800 | 73 (14.7%) | 0 (0.0%) |
| $800 to $1,499 | 6 (1.2%) | 0 (0.0%) |
| $800 to $1,499 | 346 (69.5%) | 83 (8.1%) |
| Total | 498 (100.0%) | 1,030 (100.0%) |
Health & Disability in Chena Ridge
Health Insurance Coverage by Age in Chena Ridge
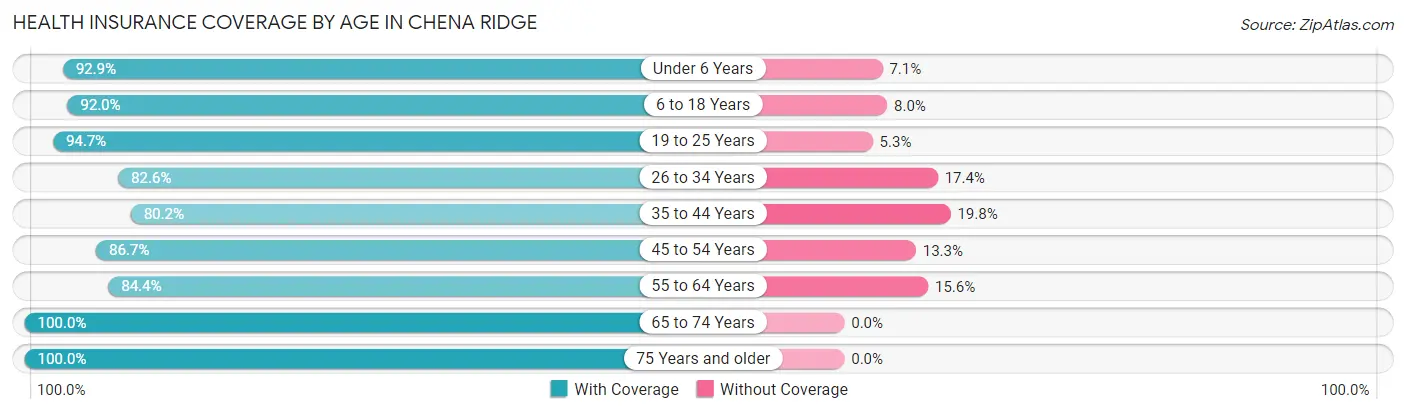
| Age Bracket | With Coverage | Without Coverage |
| Under 6 Years | 287 (92.9%) | 22 (7.1%) |
| 6 to 18 Years | 819 (92.0%) | 71 (8.0%) |
| 19 to 25 Years | 448 (94.7%) | 25 (5.3%) |
| 26 to 34 Years | 569 (82.6%) | 120 (17.4%) |
| 35 to 44 Years | 640 (80.2%) | 158 (19.8%) |
| 45 to 54 Years | 676 (86.7%) | 104 (13.3%) |
| 55 to 64 Years | 724 (84.4%) | 134 (15.6%) |
| 65 to 74 Years | 399 (100.0%) | 0 (0.0%) |
| 75 Years and older | 81 (100.0%) | 0 (0.0%) |
| Total | 4,643 (88.0%) | 634 (12.0%) |
Health Insurance Coverage by Citizenship Status in Chena Ridge
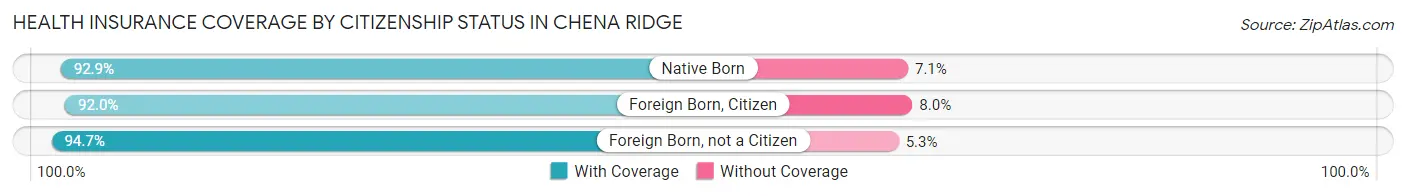
| Citizenship Status | With Coverage | Without Coverage |
| Native Born | 287 (92.9%) | 22 (7.1%) |
| Foreign Born, Citizen | 819 (92.0%) | 71 (8.0%) |
| Foreign Born, not a Citizen | 448 (94.7%) | 25 (5.3%) |
Health Insurance Coverage by Household Income in Chena Ridge
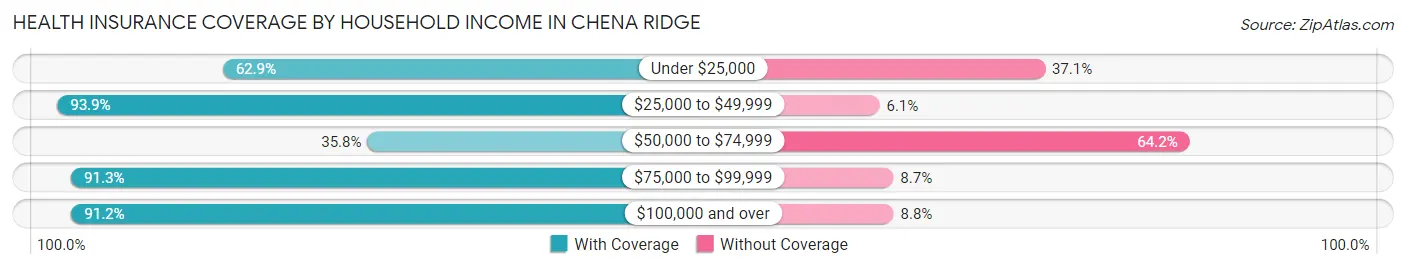
| Household Income | With Coverage | Without Coverage |
| Under $25,000 | 210 (62.9%) | 124 (37.1%) |
| $25,000 to $49,999 | 444 (93.9%) | 29 (6.1%) |
| $50,000 to $74,999 | 58 (35.8%) | 104 (64.2%) |
| $75,000 to $99,999 | 920 (91.3%) | 88 (8.7%) |
| $100,000 and over | 3,006 (91.2%) | 289 (8.8%) |
Public vs Private Health Insurance Coverage by Age in Chena Ridge
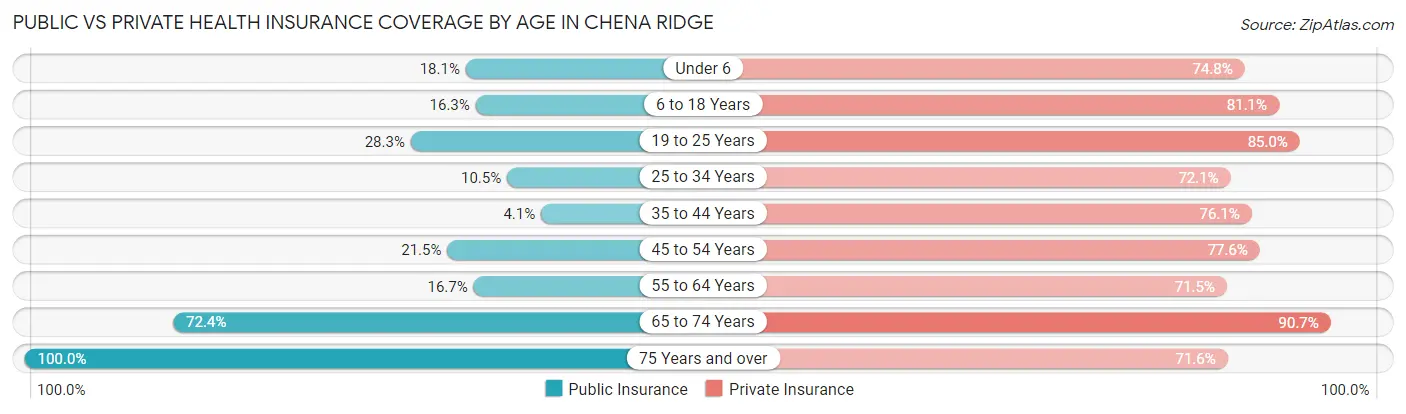
| Age Bracket | Public Insurance | Private Insurance |
| Under 6 | 56 (18.1%) | 231 (74.8%) |
| 6 to 18 Years | 145 (16.3%) | 722 (81.1%) |
| 19 to 25 Years | 134 (28.3%) | 402 (85.0%) |
| 25 to 34 Years | 72 (10.4%) | 497 (72.1%) |
| 35 to 44 Years | 33 (4.1%) | 607 (76.1%) |
| 45 to 54 Years | 168 (21.5%) | 605 (77.6%) |
| 55 to 64 Years | 143 (16.7%) | 613 (71.5%) |
| 65 to 74 Years | 289 (72.4%) | 362 (90.7%) |
| 75 Years and over | 81 (100.0%) | 58 (71.6%) |
| Total | 1,121 (21.2%) | 4,097 (77.6%) |
Disability Status by Sex by Age in Chena Ridge
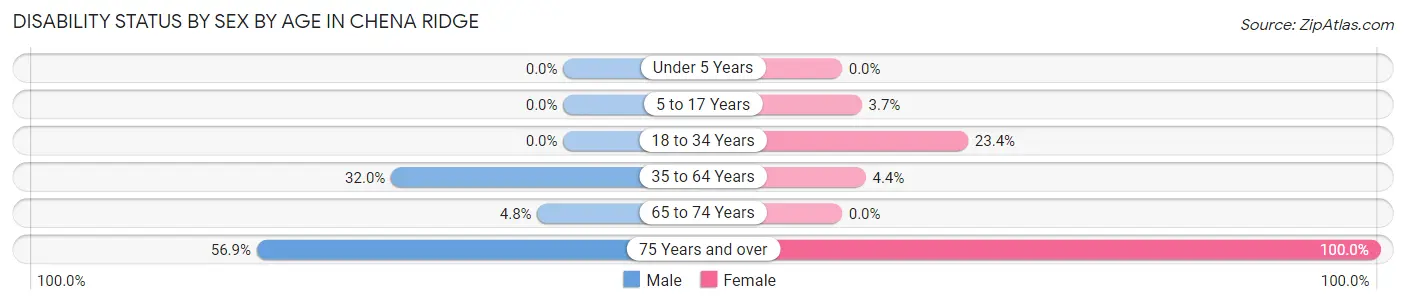
| Age Bracket | Male | Female |
| Under 5 Years | 0 (0.0%) | 0 (0.0%) |
| 5 to 17 Years | 0 (0.0%) | 19 (3.7%) |
| 18 to 34 Years | 0 (0.0%) | 155 (23.4%) |
| 35 to 64 Years | 402 (32.0%) | 52 (4.4%) |
| 65 to 74 Years | 9 (4.8%) | 0 (0.0%) |
| 75 Years and over | 33 (56.9%) | 23 (100.0%) |
Disability Class by Sex by Age in Chena Ridge
Disability Class: Hearing Difficulty
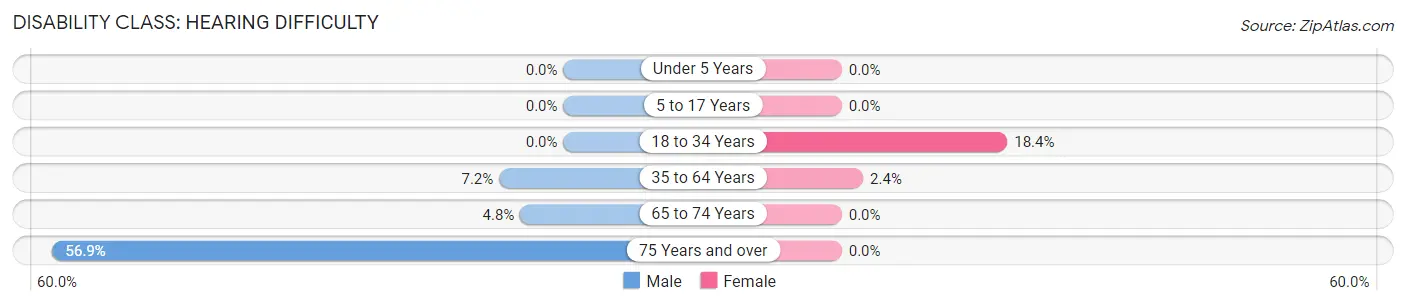
| Age Bracket | Male | Female |
| Under 5 Years | 0 (0.0%) | 0 (0.0%) |
| 5 to 17 Years | 0 (0.0%) | 0 (0.0%) |
| 18 to 34 Years | 0 (0.0%) | 122 (18.4%) |
| 35 to 64 Years | 90 (7.1%) | 28 (2.4%) |
| 65 to 74 Years | 9 (4.8%) | 0 (0.0%) |
| 75 Years and over | 33 (56.9%) | 0 (0.0%) |
Disability Class: Vision Difficulty
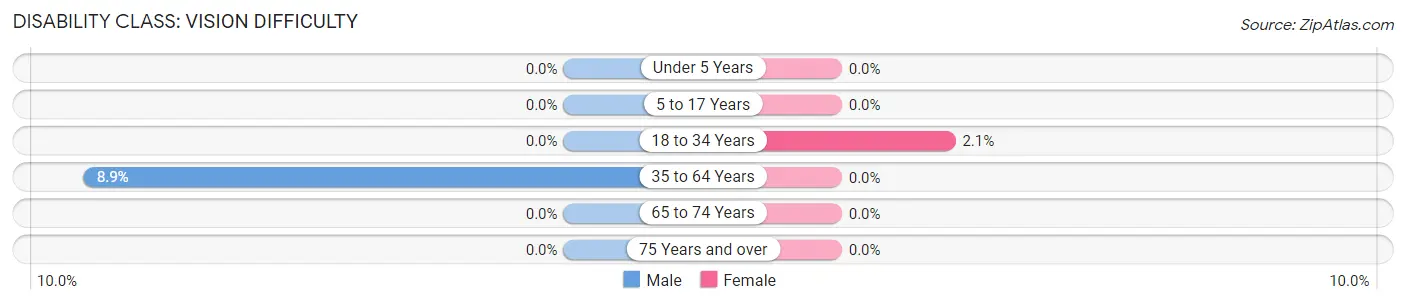
| Age Bracket | Male | Female |
| Under 5 Years | 0 (0.0%) | 0 (0.0%) |
| 5 to 17 Years | 0 (0.0%) | 0 (0.0%) |
| 18 to 34 Years | 0 (0.0%) | 14 (2.1%) |
| 35 to 64 Years | 112 (8.9%) | 0 (0.0%) |
| 65 to 74 Years | 0 (0.0%) | 0 (0.0%) |
| 75 Years and over | 0 (0.0%) | 0 (0.0%) |
Disability Class: Cognitive Difficulty
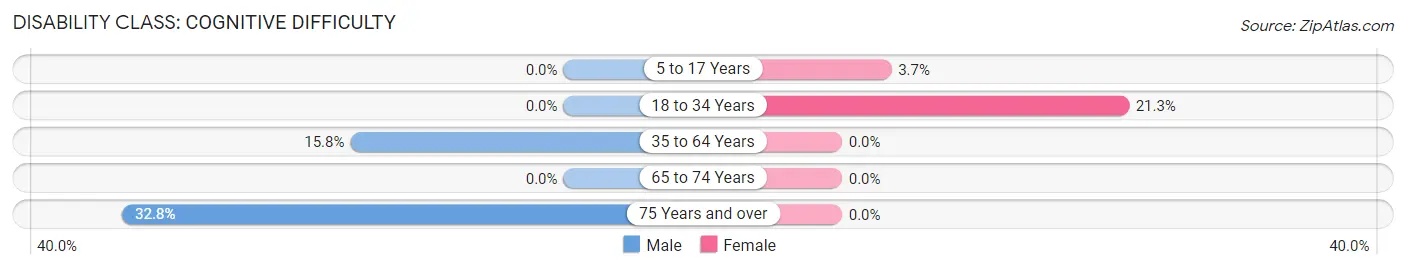
| Age Bracket | Male | Female |
| 5 to 17 Years | 0 (0.0%) | 19 (3.7%) |
| 18 to 34 Years | 0 (0.0%) | 141 (21.3%) |
| 35 to 64 Years | 199 (15.8%) | 0 (0.0%) |
| 65 to 74 Years | 0 (0.0%) | 0 (0.0%) |
| 75 Years and over | 19 (32.8%) | 0 (0.0%) |
Disability Class: Ambulatory Difficulty
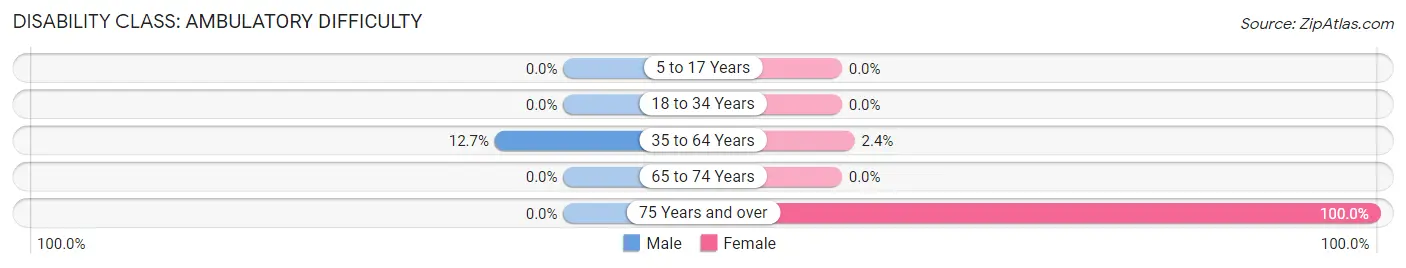
| Age Bracket | Male | Female |
| 5 to 17 Years | 0 (0.0%) | 0 (0.0%) |
| 18 to 34 Years | 0 (0.0%) | 0 (0.0%) |
| 35 to 64 Years | 160 (12.7%) | 28 (2.4%) |
| 65 to 74 Years | 0 (0.0%) | 0 (0.0%) |
| 75 Years and over | 0 (0.0%) | 23 (100.0%) |
Disability Class: Self-Care Difficulty
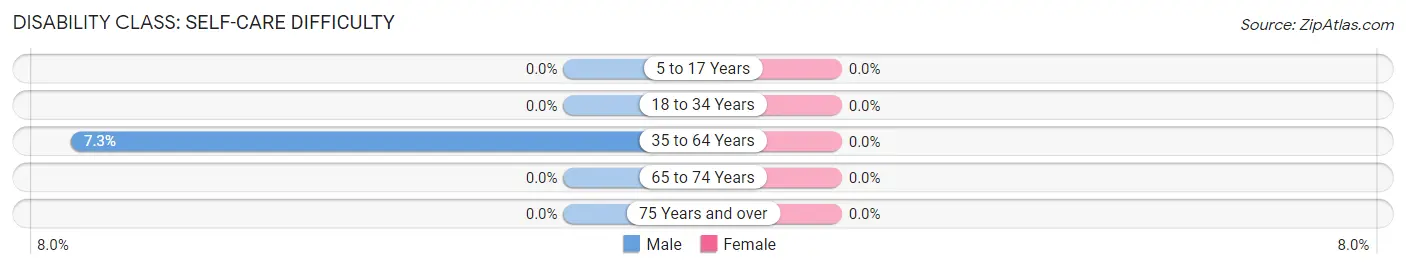
| Age Bracket | Male | Female |
| 5 to 17 Years | 0 (0.0%) | 0 (0.0%) |
| 18 to 34 Years | 0 (0.0%) | 0 (0.0%) |
| 35 to 64 Years | 92 (7.3%) | 0 (0.0%) |
| 65 to 74 Years | 0 (0.0%) | 0 (0.0%) |
| 75 Years and over | 0 (0.0%) | 0 (0.0%) |
Technology Access in Chena Ridge
Computing Device Access in Chena Ridge
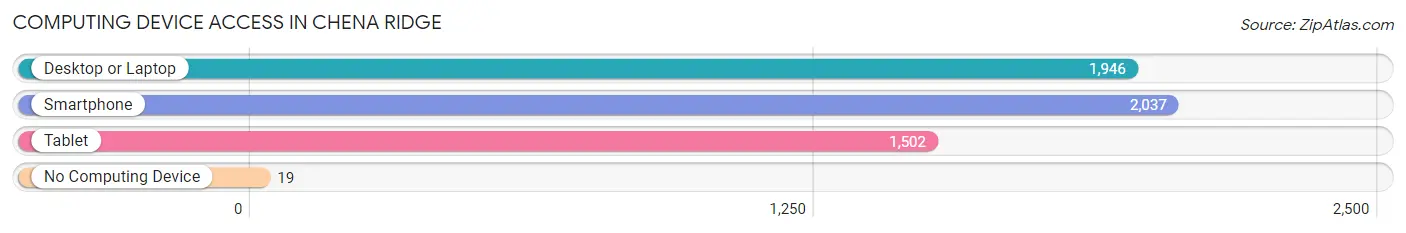
| Device Type | # Households | % Households |
| Desktop or Laptop | 1,946 | 90.2% |
| Smartphone | 2,037 | 94.4% |
| Tablet | 1,502 | 69.6% |
| No Computing Device | 19 | 0.9% |
| Total | 2,157 | 100.0% |
Internet Access in Chena Ridge
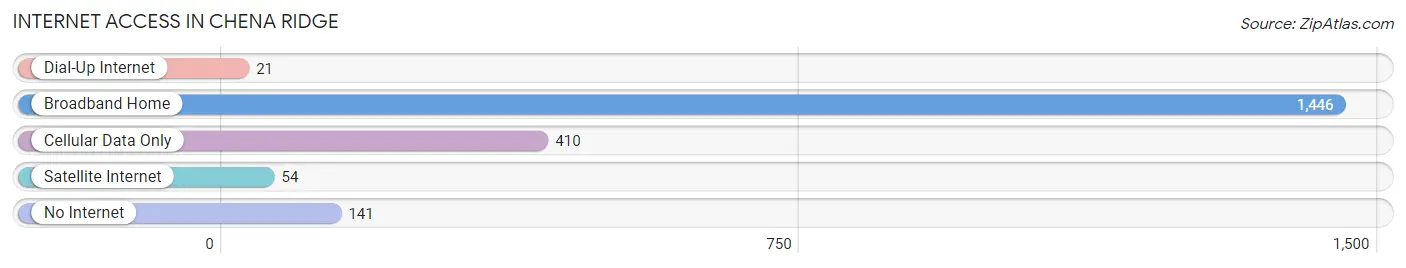
| Internet Type | # Households | % Households |
| Dial-Up Internet | 21 | 1.0% |
| Broadband Home | 1,446 | 67.0% |
| Cellular Data Only | 410 | 19.0% |
| Satellite Internet | 54 | 2.5% |
| No Internet | 141 | 6.5% |
| Total | 2,157 | 100.0% |
Chena Ridge Summary
Chena Ridge is a small, unincorporated community located in the Fairbanks North Star Borough of Alaska. It is situated on the northern edge of the Tanana Valley, approximately 10 miles east of Fairbanks. The community is home to approximately 1,000 people, and is known for its rural atmosphere and close-knit community.
History
The area now known as Chena Ridge was first settled by the Tanana Athabascans in the late 1800s. The Tanana Athabascans were a nomadic people who lived off the land, hunting and fishing for their sustenance. They were also known for their intricate basket weaving and beadwork.
In the early 1900s, the area was settled by homesteaders, who established farms and ranches in the area. The first post office in the area was established in 1915, and the community was officially named Chena Ridge in 1921.
In the 1950s, the area began to experience rapid growth as the nearby city of Fairbanks began to expand. This growth was spurred by the construction of the nearby military base, Eielson Air Force Base, which brought an influx of new residents to the area.
Geography
Chena Ridge is located in the Fairbanks North Star Borough of Alaska. It is situated on the northern edge of the Tanana Valley, approximately 10 miles east of Fairbanks. The area is characterized by rolling hills and open meadows, with the Chena River running through the center of the community.
The climate in Chena Ridge is generally mild, with temperatures ranging from -20°F in the winter to 80°F in the summer. The area receives an average of 20 inches of precipitation per year, with most of it falling in the form of snow.
Economy
The economy of Chena Ridge is largely based on agriculture and tourism. The area is home to several small farms and ranches, which produce a variety of crops and livestock. The area is also popular with tourists, who come to enjoy the rural atmosphere and outdoor activities such as fishing, hunting, and camping.
In addition to agriculture and tourism, the area is also home to several small businesses, including restaurants, retail stores, and service providers. The nearby military base, Eielson Air Force Base, is also a major employer in the area.
Demographics
As of the 2010 census, the population of Chena Ridge was 1,000. The racial makeup of the community was 95.2% White, 0.7% Native American, 0.7% Asian, 0.3% African American, and 2.1% from other races. The median household income was $50,000, and the median age was 37.
Conclusion
Chena Ridge is a small, unincorporated community located in the Fairbanks North Star Borough of Alaska. It is situated on the northern edge of the Tanana Valley, approximately 10 miles east of Fairbanks. The community is home to approximately 1,000 people, and is known for its rural atmosphere and close-knit community. The economy of Chena Ridge is largely based on agriculture and tourism, and the area is also home to several small businesses. The population of Chena Ridge is predominantly White, with a median household income of $50,000 and a median age of 37.
Common Questions
What is Per Capita Income in Chena Ridge?
Per Capita income in Chena Ridge is $63,754.
What is the Median Family Income in Chena Ridge?
Median Family Income in Chena Ridge is $148,793.
What is the Median Household income in Chena Ridge?
Median Household Income in Chena Ridge is $106,688.
What is Income or Wage Gap in Chena Ridge?
Income or Wage Gap in Chena Ridge is 16.1%.
Women in Chena Ridge earn 83.9 cents for every dollar earned by a man.
What is Inequality or Gini Index in Chena Ridge?
Inequality or Gini Index in Chena Ridge is 0.46.
What is the Total Population of Chena Ridge?
Total Population of Chena Ridge is 5,321.
What is the Total Male Population of Chena Ridge?
Total Male Population of Chena Ridge is 2,570.
What is the Total Female Population of Chena Ridge?
Total Female Population of Chena Ridge is 2,751.
What is the Ratio of Males per 100 Females in Chena Ridge?
There are 93.42 Males per 100 Females in Chena Ridge.
What is the Ratio of Females per 100 Males in Chena Ridge?
There are 107.04 Females per 100 Males in Chena Ridge.
What is the Median Population Age in Chena Ridge?
Median Population Age in Chena Ridge is 37.7 Years.
What is the Average Family Size in Chena Ridge
Average Family Size in Chena Ridge is 3.0 People.
What is the Average Household Size in Chena Ridge
Average Household Size in Chena Ridge is 2.5 People.
How Large is the Labor Force in Chena Ridge?
There are 3,042 People in the Labor Forcein in Chena Ridge.
What is the Percentage of People in the Labor Force in Chena Ridge?
71.5% of People are in the Labor Force in Chena Ridge.
What is the Unemployment Rate in Chena Ridge?
Unemployment Rate in Chena Ridge is 6.1%.