Knik River, AK Map & Demographics
Knik River Map
Knik River Overview
$38,180
PER CAPITA INCOME
$118,333
AVG FAMILY INCOME
$75,000
AVG HOUSEHOLD INCOME
17.7%
WAGE / INCOME GAP [ % ]
82.3¢/ $1
WAGE / INCOME GAP [ $ ]
0.42
INEQUALITY / GINI INDEX
822
TOTAL POPULATION
485
MALE POPULATION
337
FEMALE POPULATION
143.92
MALES / 100 FEMALES
69.48
FEMALES / 100 MALES
35.0
MEDIAN AGE
3.1
AVG FAMILY SIZE
2.6
AVG HOUSEHOLD SIZE
436
LABOR FORCE [ PEOPLE ]
68.4%
PERCENT IN LABOR FORCE
2.4%
UNEMPLOYMENT RATE
Income in Knik River
Income Overview in Knik River
Per Capita Income in Knik River is $38,180, while median incomes of families and households are $118,333 and $75,000 respectively.
| Characteristic | Number | Measure |
| Per Capita Income | 822 | $38,180 |
| Median Family Income | 220 | $118,333 |
| Mean Family Income | 220 | $114,286 |
| Median Household Income | 316 | $75,000 |
| Mean Household Income | 316 | $99,032 |
| Income Deficit | 220 | $0 |
| Wage / Income Gap (%) | 822 | 17.73% |
| Wage / Income Gap ($) | 822 | 82.27¢ per $1 |
| Gini / Inequality Index | 822 | 0.42 |
Earnings by Sex in Knik River
Average Earnings in Knik River are $40,789, $41,406 for men and $34,063 for women, a difference of 17.7%.
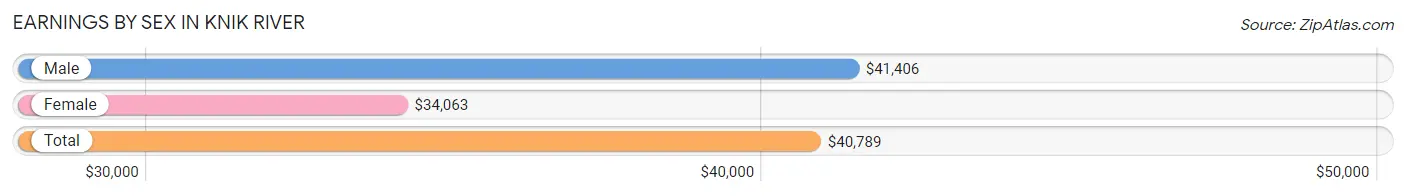
| Sex | Number | Average Earnings |
| Male | 276 (58.7%) | $41,406 |
| Female | 194 (41.3%) | $34,063 |
| Total | 470 (100.0%) | $40,789 |
Earnings by Sex by Income Bracket in Knik River
The most common earnings brackets in Knik River are $100,000+ for men (46 | 16.7%) and $75,000 to $99,999 for women (53 | 27.3%).
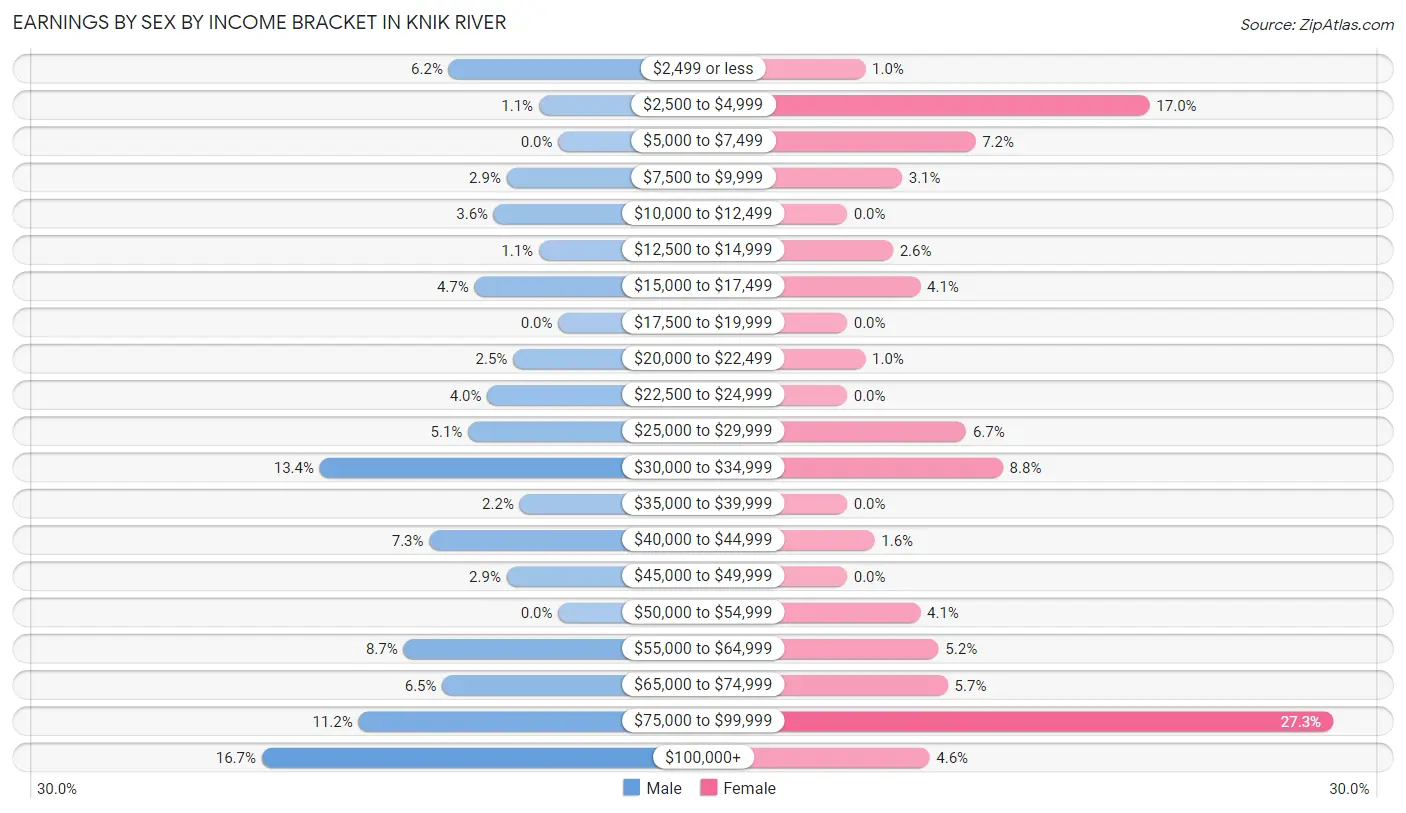
| Income | Male | Female |
| $2,499 or less | 17 (6.2%) | 2 (1.0%) |
| $2,500 to $4,999 | 3 (1.1%) | 33 (17.0%) |
| $5,000 to $7,499 | 0 (0.0%) | 14 (7.2%) |
| $7,500 to $9,999 | 8 (2.9%) | 6 (3.1%) |
| $10,000 to $12,499 | 10 (3.6%) | 0 (0.0%) |
| $12,500 to $14,999 | 3 (1.1%) | 5 (2.6%) |
| $15,000 to $17,499 | 13 (4.7%) | 8 (4.1%) |
| $17,500 to $19,999 | 0 (0.0%) | 0 (0.0%) |
| $20,000 to $22,499 | 7 (2.5%) | 2 (1.0%) |
| $22,500 to $24,999 | 11 (4.0%) | 0 (0.0%) |
| $25,000 to $29,999 | 14 (5.1%) | 13 (6.7%) |
| $30,000 to $34,999 | 37 (13.4%) | 17 (8.8%) |
| $35,000 to $39,999 | 6 (2.2%) | 0 (0.0%) |
| $40,000 to $44,999 | 20 (7.2%) | 3 (1.5%) |
| $45,000 to $49,999 | 8 (2.9%) | 0 (0.0%) |
| $50,000 to $54,999 | 0 (0.0%) | 8 (4.1%) |
| $55,000 to $64,999 | 24 (8.7%) | 10 (5.1%) |
| $65,000 to $74,999 | 18 (6.5%) | 11 (5.7%) |
| $75,000 to $99,999 | 31 (11.2%) | 53 (27.3%) |
| $100,000+ | 46 (16.7%) | 9 (4.6%) |
| Total | 276 (100.0%) | 194 (100.0%) |
Earnings by Sex by Educational Attainment in Knik River
Average earnings in Knik River are $55,417 for men and $50,469 for women, a difference of 8.9%. Men with an educational attainment of bachelor's degree enjoy the highest average annual earnings of $148,438, while those with less than high school education earn the least with $32,045. Women with an educational attainment of graduate degree earn the most with the average annual earnings of $86,458, while those with high school diploma education have the smallest earnings of $29,712.
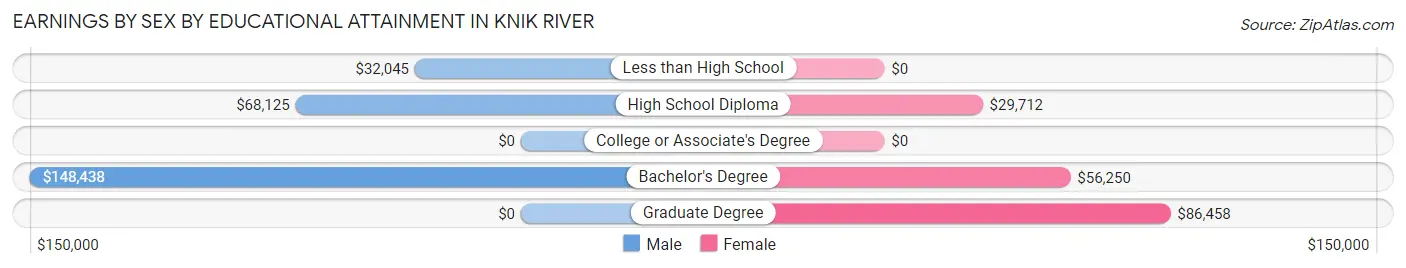
| Educational Attainment | Male Income | Female Income |
| Less than High School | $32,045 | $0 |
| High School Diploma | $68,125 | $29,712 |
| College or Associate's Degree | - | - |
| Bachelor's Degree | $148,438 | $56,250 |
| Graduate Degree | - | - |
| Total | $55,417 | $50,469 |
Family Income in Knik River
Family Income Brackets in Knik River
According to the Knik River family income data, there are 48 families falling into the $100,000 to $149,999 income range, which is the most common income bracket and makes up 21.8% of all families.
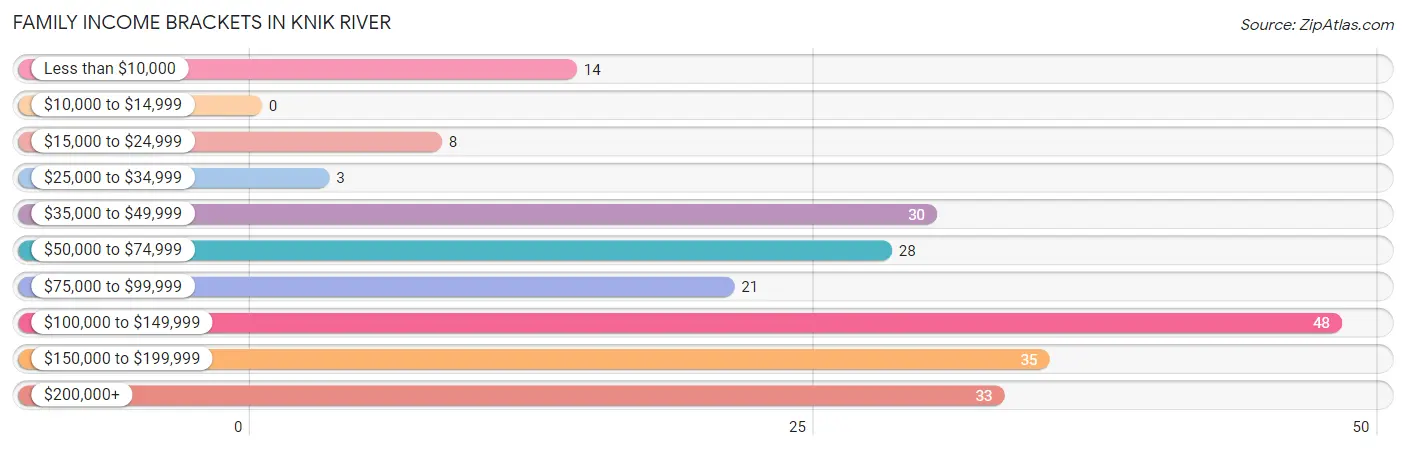
| Income Bracket | # Families | % Families |
| Less than $10,000 | 14 | 6.4% |
| $10,000 to $14,999 | 0 | 0.0% |
| $15,000 to $24,999 | 8 | 3.6% |
| $25,000 to $34,999 | 3 | 1.4% |
| $35,000 to $49,999 | 30 | 13.6% |
| $50,000 to $74,999 | 28 | 12.7% |
| $75,000 to $99,999 | 21 | 9.5% |
| $100,000 to $149,999 | 48 | 21.8% |
| $150,000 to $199,999 | 35 | 15.9% |
| $200,000+ | 33 | 15.0% |
Family Income by Famaliy Size in Knik River
5-person families (16 | 7.3%) account for the highest median family income in Knik River with $173,750 per family, while 3-person families (41 | 18.6%) have the highest median income of $43,542 per family member.
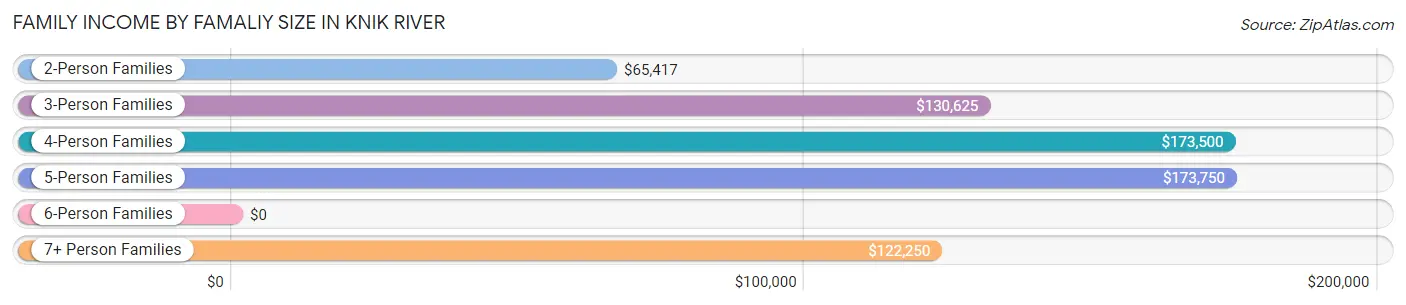
| Income Bracket | # Families | Median Income |
| 2-Person Families | 120 (54.5%) | $65,417 |
| 3-Person Families | 41 (18.6%) | $130,625 |
| 4-Person Families | 22 (10.0%) | $173,500 |
| 5-Person Families | 16 (7.3%) | $173,750 |
| 6-Person Families | 6 (2.7%) | $0 |
| 7+ Person Families | 15 (6.8%) | $122,250 |
| Total | 220 (100.0%) | $118,333 |
Family Income by Number of Earners in Knik River
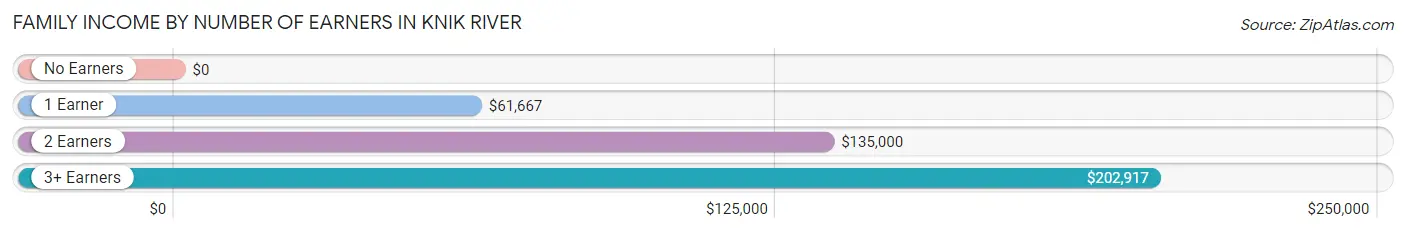
| Number of Earners | # Families | Median Income |
| No Earners | 14 (6.4%) | $0 |
| 1 Earner | 80 (36.4%) | $61,667 |
| 2 Earners | 100 (45.5%) | $135,000 |
| 3+ Earners | 26 (11.8%) | $202,917 |
| Total | 220 (100.0%) | $118,333 |
Household Income in Knik River
Household Income Brackets in Knik River
With 63 households falling in the category, the $100,000 to $149,999 income range is the most frequent in Knik River, accounting for 19.9% of all households. In contrast, only 1 households (0.3%) fall into the $10,000 to $14,999 income bracket, making it the least populous group.
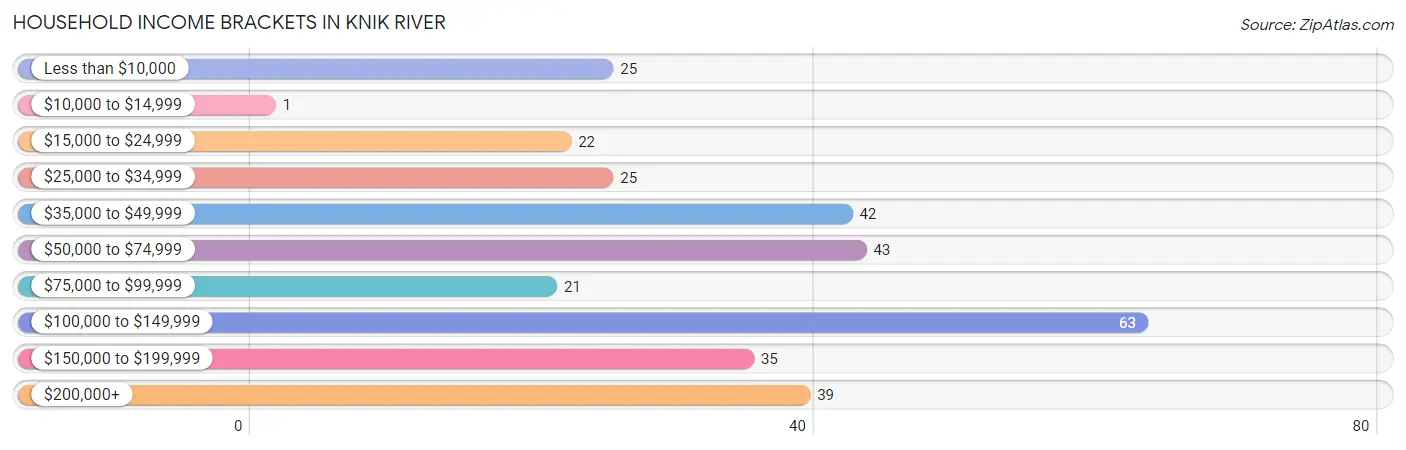
| Income Bracket | # Households | % Households |
| Less than $10,000 | 25 | 7.9% |
| $10,000 to $14,999 | 1 | 0.3% |
| $15,000 to $24,999 | 22 | 7.0% |
| $25,000 to $34,999 | 25 | 7.9% |
| $35,000 to $49,999 | 42 | 13.3% |
| $50,000 to $74,999 | 43 | 13.6% |
| $75,000 to $99,999 | 21 | 6.6% |
| $100,000 to $149,999 | 63 | 19.9% |
| $150,000 to $199,999 | 35 | 11.1% |
| $200,000+ | 39 | 12.3% |
Household Income by Householder Age in Knik River
The median household income in Knik River is $75,000, with the highest median household income of $136,250 found in the 25 to 44 years age bracket for the primary householder. A total of 90 households (28.5%) fall into this category. Meanwhile, the 15 to 24 years age bracket for the primary householder has the lowest median household income of $0, with 16 households (5.1%) in this group.
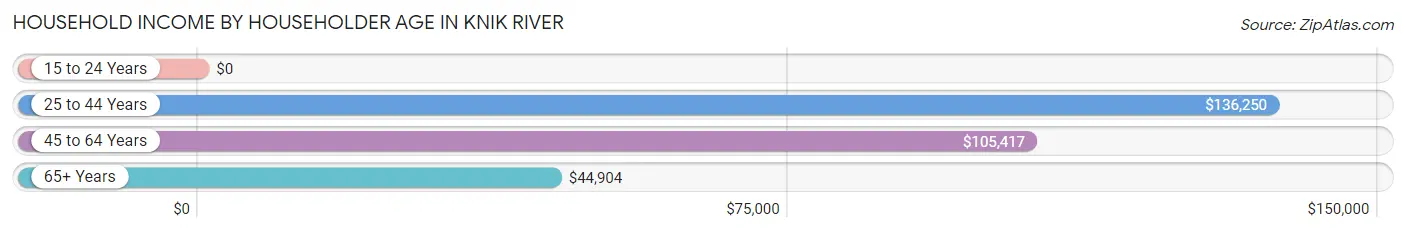
| Income Bracket | # Households | Median Income |
| 15 to 24 Years | 16 (5.1%) | $0 |
| 25 to 44 Years | 90 (28.5%) | $136,250 |
| 45 to 64 Years | 121 (38.3%) | $105,417 |
| 65+ Years | 89 (28.2%) | $44,904 |
| Total | 316 (100.0%) | $75,000 |
Poverty in Knik River
Income Below Poverty by Sex and Age in Knik River
With 15.7% poverty level for males and 4.4% for females among the residents of Knik River, 15 year old males and 12 to 14 year old females are the most vulnerable to poverty, with 5 males (100.0%) and 4 females (20.0%) in their respective age groups living below the poverty level.
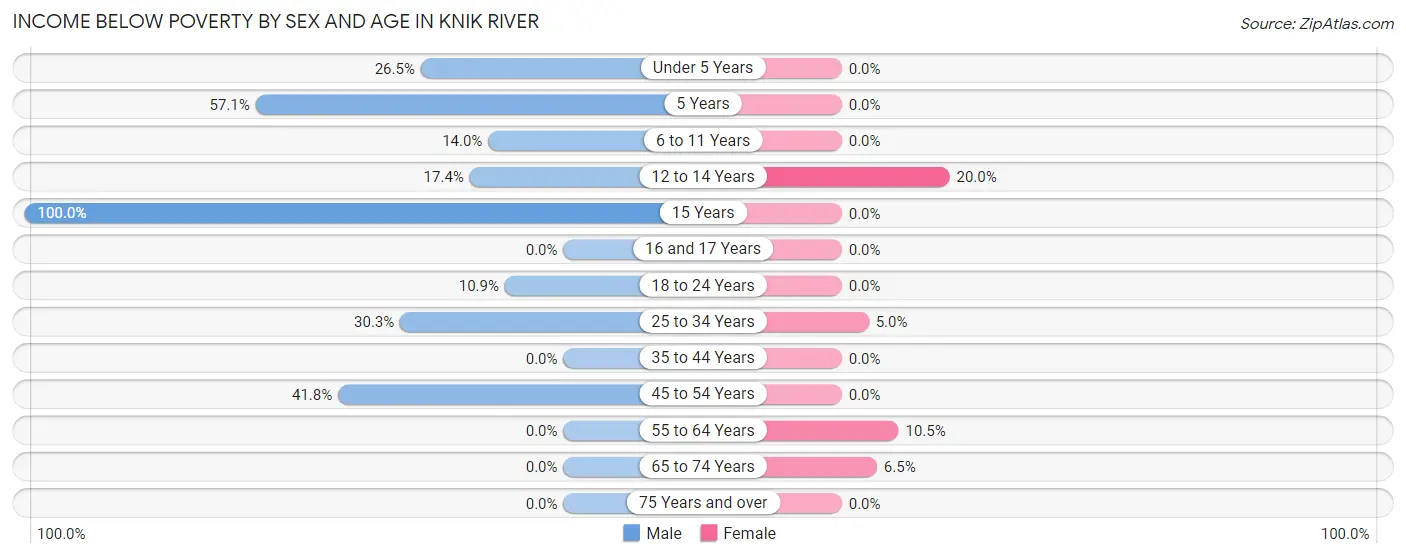
| Age Bracket | Male | Female |
| Under 5 Years | 9 (26.5%) | 0 (0.0%) |
| 5 Years | 4 (57.1%) | 0 (0.0%) |
| 6 to 11 Years | 6 (14.0%) | 0 (0.0%) |
| 12 to 14 Years | 4 (17.4%) | 4 (20.0%) |
| 15 Years | 5 (100.0%) | 0 (0.0%) |
| 16 and 17 Years | 0 (0.0%) | 0 (0.0%) |
| 18 to 24 Years | 5 (10.9%) | 0 (0.0%) |
| 25 to 34 Years | 20 (30.3%) | 4 (5.0%) |
| 35 to 44 Years | 0 (0.0%) | 0 (0.0%) |
| 45 to 54 Years | 23 (41.8%) | 0 (0.0%) |
| 55 to 64 Years | 0 (0.0%) | 4 (10.5%) |
| 65 to 74 Years | 0 (0.0%) | 3 (6.5%) |
| 75 Years and over | 0 (0.0%) | 0 (0.0%) |
| Total | 76 (15.7%) | 15 (4.4%) |
Income Above Poverty by Sex and Age in Knik River
According to the poverty statistics in Knik River, males aged 16 and 17 years and females aged under 5 years are the age groups that are most secure financially, with 100.0% of males and 100.0% of females in these age groups living above the poverty line.
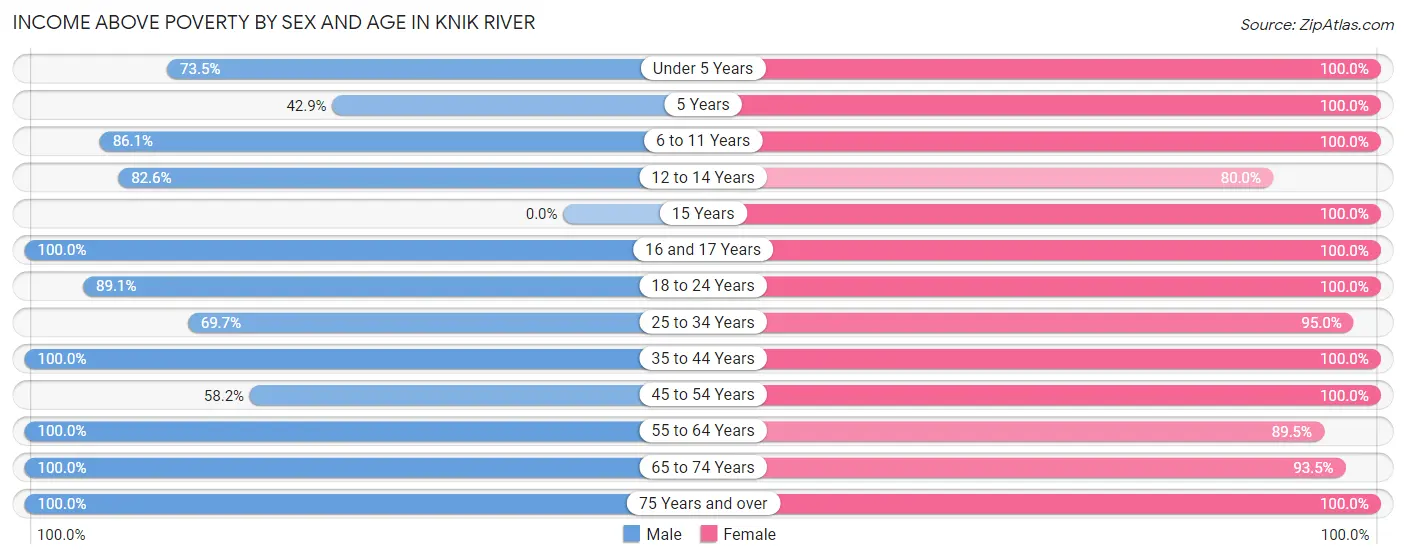
| Age Bracket | Male | Female |
| Under 5 Years | 25 (73.5%) | 16 (100.0%) |
| 5 Years | 3 (42.9%) | 4 (100.0%) |
| 6 to 11 Years | 37 (86.1%) | 24 (100.0%) |
| 12 to 14 Years | 19 (82.6%) | 16 (80.0%) |
| 15 Years | 0 (0.0%) | 9 (100.0%) |
| 16 and 17 Years | 8 (100.0%) | 8 (100.0%) |
| 18 to 24 Years | 41 (89.1%) | 19 (100.0%) |
| 25 to 34 Years | 46 (69.7%) | 76 (95.0%) |
| 35 to 44 Years | 45 (100.0%) | 41 (100.0%) |
| 45 to 54 Years | 32 (58.2%) | 29 (100.0%) |
| 55 to 64 Years | 74 (100.0%) | 34 (89.5%) |
| 65 to 74 Years | 75 (100.0%) | 43 (93.5%) |
| 75 Years and over | 4 (100.0%) | 3 (100.0%) |
| Total | 409 (84.3%) | 322 (95.6%) |
Income Below Poverty Among Married-Couple Families in Knik River
The poverty statistics for married-couple families in Knik River show that 1.8% or 3 of the total 169 families live below the poverty line. Families with 5 or more children have the highest poverty rate of 20.0%, comprising of 3 families. On the other hand, families with no children have the lowest poverty rate of 0.0%, which includes 0 families.
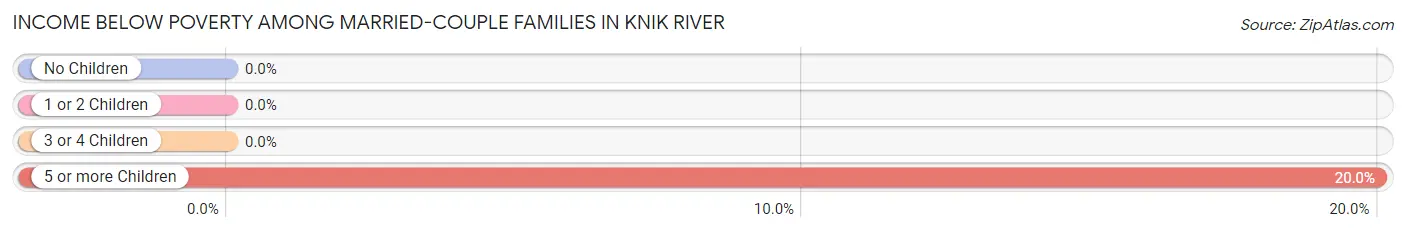
| Children | Above Poverty | Below Poverty |
| No Children | 97 (100.0%) | 0 (0.0%) |
| 1 or 2 Children | 43 (100.0%) | 0 (0.0%) |
| 3 or 4 Children | 14 (100.0%) | 0 (0.0%) |
| 5 or more Children | 12 (80.0%) | 3 (20.0%) |
| Total | 166 (98.2%) | 3 (1.8%) |
Income Below Poverty Among Single-Parent Households in Knik River
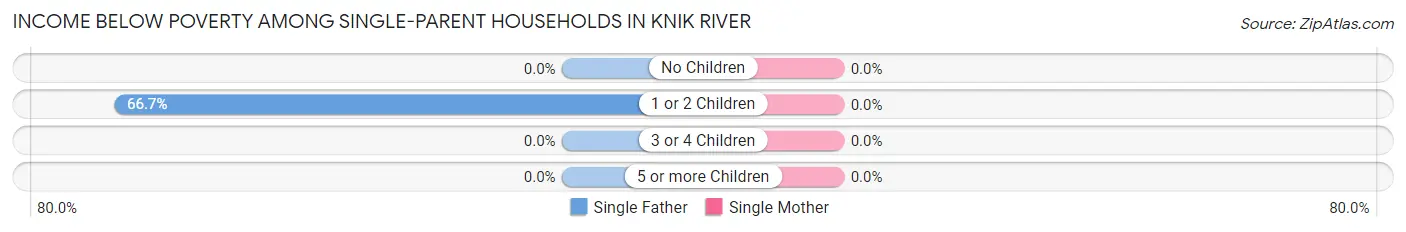
| Children | Single Father | Single Mother |
| No Children | 0 (0.0%) | 0 (0.0%) |
| 1 or 2 Children | 14 (66.7%) | 0 (0.0%) |
| 3 or 4 Children | 0 (0.0%) | 0 (0.0%) |
| 5 or more Children | 0 (0.0%) | 0 (0.0%) |
| Total | 14 (35.0%) | 0 (0.0%) |
Income Below Poverty Among Married-Couple vs Single-Parent Households in Knik River
The poverty data for Knik River shows that 3 of the married-couple family households (1.8%) and 14 of the single-parent households (27.5%) are living below the poverty level. Within the married-couple family households, those with 5 or more children have the highest poverty rate, with 3 households (20.0%) falling below the poverty line. Among the single-parent households, those with 1 or 2 children have the highest poverty rate, with 14 household (46.7%) living below poverty.
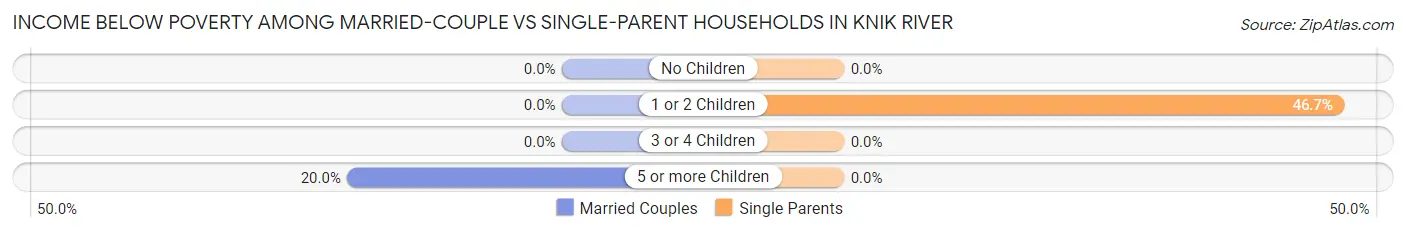
| Children | Married-Couple Families | Single-Parent Households |
| No Children | 0 (0.0%) | 0 (0.0%) |
| 1 or 2 Children | 0 (0.0%) | 14 (46.7%) |
| 3 or 4 Children | 0 (0.0%) | 0 (0.0%) |
| 5 or more Children | 3 (20.0%) | 0 (0.0%) |
| Total | 3 (1.8%) | 14 (27.5%) |
Race in Knik River
The most populous races in Knik River are White / Caucasian (712 | 86.6%), Hispanic or Latino (52 | 6.3%), and Native / Alaskan (48 | 5.8%).
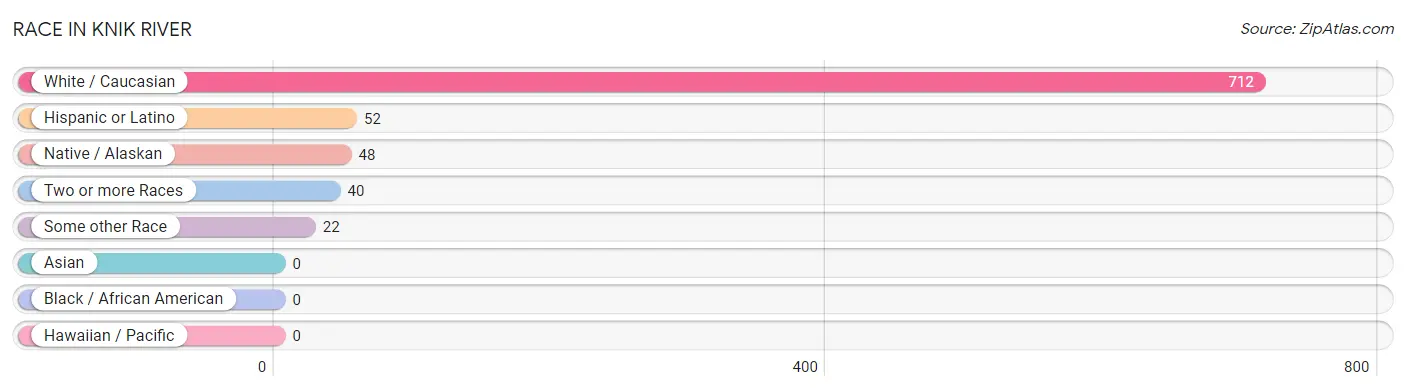
| Race | # Population | % Population |
| Asian | 0 | 0.0% |
| Black / African American | 0 | 0.0% |
| Hawaiian / Pacific | 0 | 0.0% |
| Hispanic or Latino | 52 | 6.3% |
| Native / Alaskan | 48 | 5.8% |
| White / Caucasian | 712 | 86.6% |
| Two or more Races | 40 | 4.9% |
| Some other Race | 22 | 2.7% |
| Total | 822 | 100.0% |
Ancestry in Knik River
The most populous ancestries reported in Knik River are German (170 | 20.7%), Irish (91 | 11.1%), English (88 | 10.7%), Mexican (49 | 6.0%), and Norwegian (35 | 4.3%), together accounting for 52.7% of all Knik River residents.
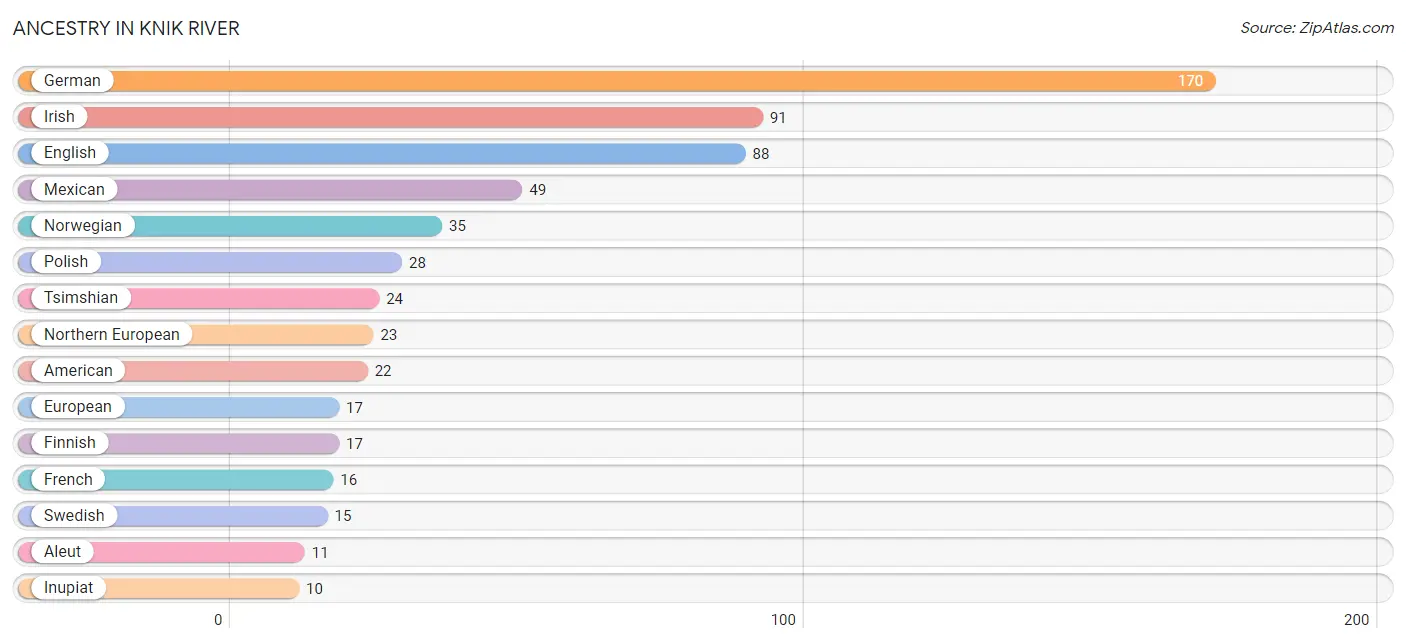
| Ancestry | # Population | % Population |
| Alaska Native | 9 | 1.1% |
| Alaskan Athabascan | 6 | 0.7% |
| Aleut | 11 | 1.3% |
| American | 22 | 2.7% |
| Apache | 3 | 0.4% |
| Austrian | 1 | 0.1% |
| Burmese | 6 | 0.7% |
| Celtic | 5 | 0.6% |
| Cree | 3 | 0.4% |
| Dutch | 3 | 0.4% |
| Eastern European | 4 | 0.5% |
| English | 88 | 10.7% |
| European | 17 | 2.1% |
| Finnish | 17 | 2.1% |
| French | 16 | 1.9% |
| German | 170 | 20.7% |
| Inupiat | 10 | 1.2% |
| Irish | 91 | 11.1% |
| Italian | 8 | 1.0% |
| Mexican | 49 | 6.0% |
| Northern European | 23 | 2.8% |
| Norwegian | 35 | 4.3% |
| Pennsylvania German | 3 | 0.4% |
| Polish | 28 | 3.4% |
| Puerto Rican | 3 | 0.4% |
| Scandinavian | 4 | 0.5% |
| Scotch-Irish | 4 | 0.5% |
| Scottish | 9 | 1.1% |
| Slovak | 2 | 0.2% |
| Swedish | 15 | 1.8% |
| Swiss | 3 | 0.4% |
| Tsimshian | 24 | 2.9% |
| Ukrainian | 8 | 1.0% |
| Yup'ik | 6 | 0.7% | View All 34 Rows |
Immigrants in Knik River
The most numerous immigrant groups reported in Knik River came from Europe (46 | 5.6%), Eastern Europe (38 | 4.6%), Poland (22 | 2.7%), Belarus (15 | 1.8%), and England (8 | 1.0%), together accounting for 15.7% of all Knik River residents.
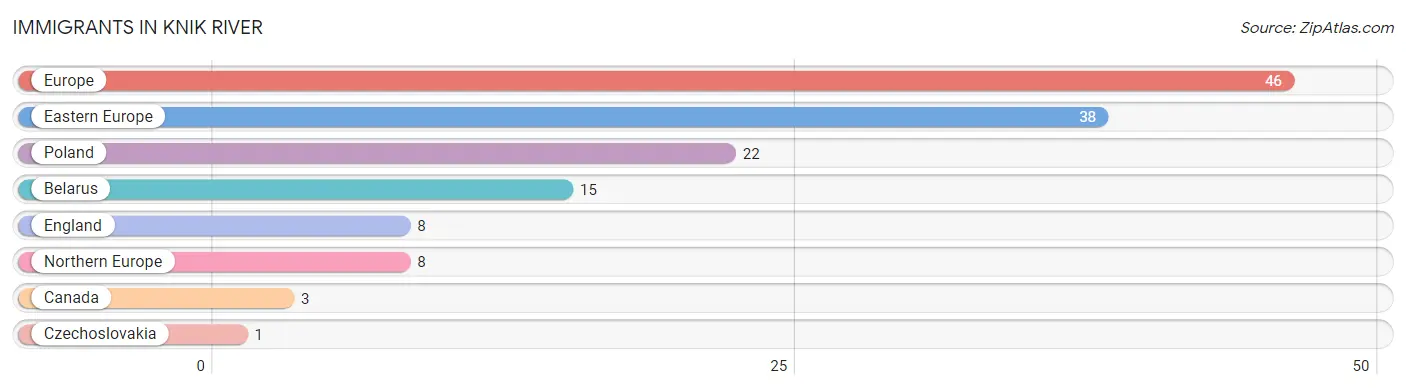
| Immigration Origin | # Population | % Population |
| Belarus | 15 | 1.8% |
| Canada | 3 | 0.4% |
| Czechoslovakia | 1 | 0.1% |
| Eastern Europe | 38 | 4.6% |
| England | 8 | 1.0% |
| Europe | 46 | 5.6% |
| Northern Europe | 8 | 1.0% |
| Poland | 22 | 2.7% | View All 8 Rows |
Sex and Age in Knik River
Sex and Age in Knik River
The most populous age groups in Knik River are 65 to 69 Years (61 | 12.6%) for men and 30 to 34 Years (55 | 16.3%) for women.
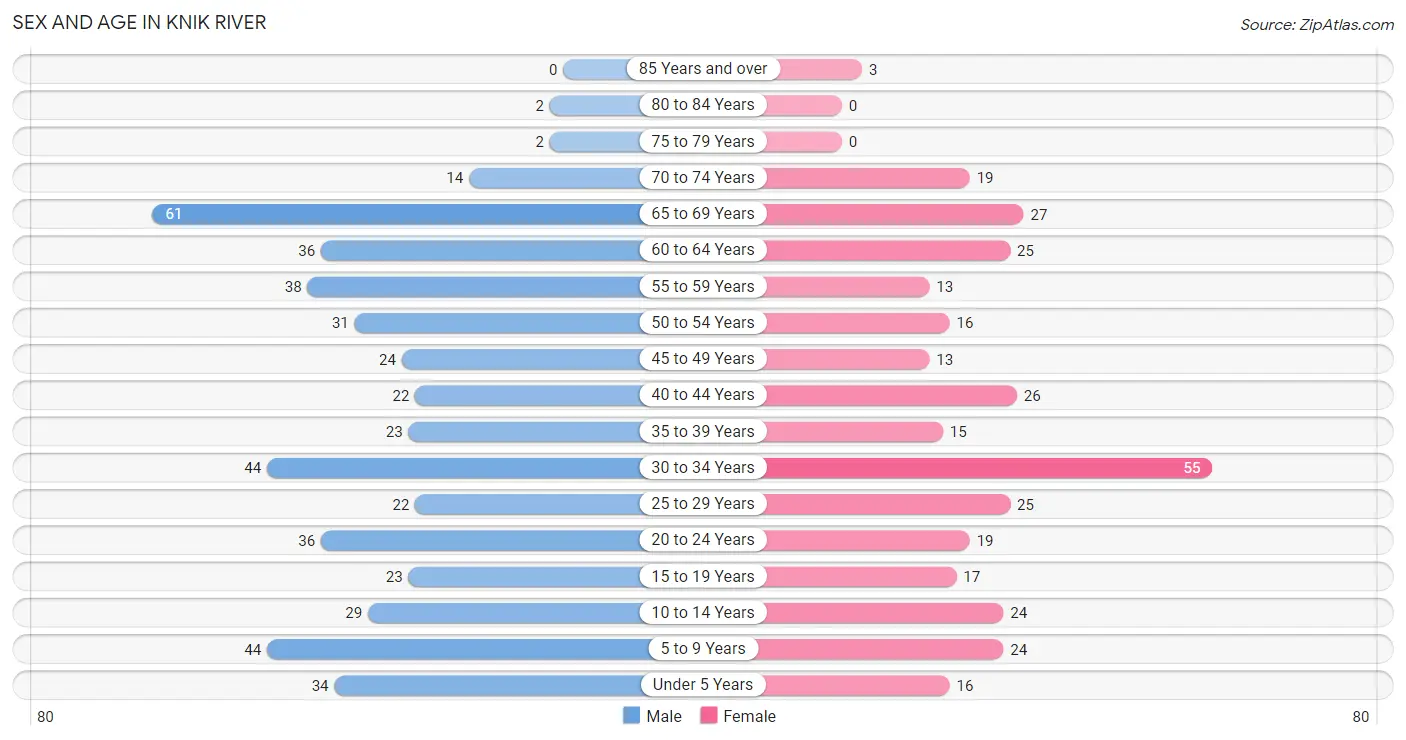
| Age Bracket | Male | Female |
| Under 5 Years | 34 (7.0%) | 16 (4.8%) |
| 5 to 9 Years | 44 (9.1%) | 24 (7.1%) |
| 10 to 14 Years | 29 (6.0%) | 24 (7.1%) |
| 15 to 19 Years | 23 (4.7%) | 17 (5.0%) |
| 20 to 24 Years | 36 (7.4%) | 19 (5.6%) |
| 25 to 29 Years | 22 (4.5%) | 25 (7.4%) |
| 30 to 34 Years | 44 (9.1%) | 55 (16.3%) |
| 35 to 39 Years | 23 (4.7%) | 15 (4.4%) |
| 40 to 44 Years | 22 (4.5%) | 26 (7.7%) |
| 45 to 49 Years | 24 (5.0%) | 13 (3.9%) |
| 50 to 54 Years | 31 (6.4%) | 16 (4.8%) |
| 55 to 59 Years | 38 (7.8%) | 13 (3.9%) |
| 60 to 64 Years | 36 (7.4%) | 25 (7.4%) |
| 65 to 69 Years | 61 (12.6%) | 27 (8.0%) |
| 70 to 74 Years | 14 (2.9%) | 19 (5.6%) |
| 75 to 79 Years | 2 (0.4%) | 0 (0.0%) |
| 80 to 84 Years | 2 (0.4%) | 0 (0.0%) |
| 85 Years and over | 0 (0.0%) | 3 (0.9%) |
| Total | 485 (100.0%) | 337 (100.0%) |
Families and Households in Knik River
Median Family Size in Knik River
The median family size in Knik River is 3.13 persons per family, with married-couple families (169 | 76.8%) accounting for the largest median family size of 3.34 persons per family. On the other hand, single male/father families (40 | 18.2%) represent the smallest median family size with 2.25 persons per family.
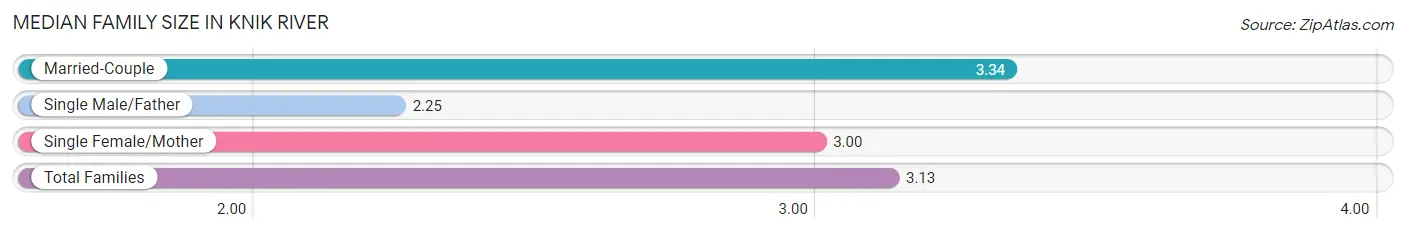
| Family Type | # Families | Family Size |
| Married-Couple | 169 (76.8%) | 3.34 |
| Single Male/Father | 40 (18.2%) | 2.25 |
| Single Female/Mother | 11 (5.0%) | 3.00 |
| Total Families | 220 (100.0%) | 3.13 |
Median Household Size in Knik River
The median household size in Knik River is 2.60 persons per household, with married-couple households (169 | 53.5%) accounting for the largest median household size of 3.37 persons per household. non-family households (96 | 30.4%) represent the smallest median household size with 1.21 persons per household.
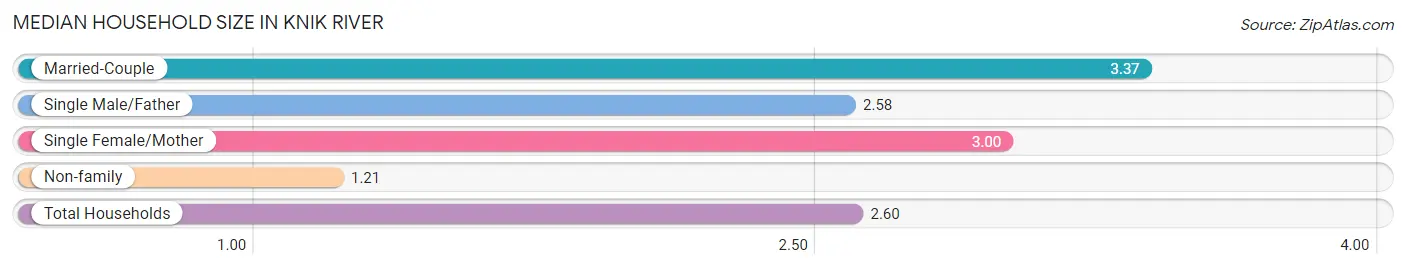
| Household Type | # Households | Household Size |
| Married-Couple | 169 (53.5%) | 3.37 |
| Single Male/Father | 40 (12.7%) | 2.58 |
| Single Female/Mother | 11 (3.5%) | 3.00 |
| Non-family | 96 (30.4%) | 1.21 |
| Total Households | 316 (100.0%) | 2.60 |
Household Size by Marriage Status in Knik River
Out of a total of 316 households in Knik River, 220 (69.6%) are family households, while 96 (30.4%) are nonfamily households. The most numerous type of family households are 2-person households, comprising 115, and the most common type of nonfamily households are 1-person households, comprising 74.
| Household Size | Family Households | Nonfamily Households |
| 1-Person Households | - | 74 (23.4%) |
| 2-Person Households | 115 (36.4%) | 22 (7.0%) |
| 3-Person Households | 40 (12.7%) | 0 (0.0%) |
| 4-Person Households | 20 (6.3%) | 0 (0.0%) |
| 5-Person Households | 24 (7.6%) | 0 (0.0%) |
| 6-Person Households | 6 (1.9%) | 0 (0.0%) |
| 7+ Person Households | 15 (4.8%) | 0 (0.0%) |
| Total | 220 (69.6%) | 96 (30.4%) |
Female Fertility in Knik River
Fertility by Age in Knik River
Average fertility rate in Knik River is 6.0 births per 1,000 women. Women in the age bracket of 20 to 34 years have the highest fertility rate with 10.0 births per 1,000 women. Women in the age bracket of 20 to 34 years acount for 100.0% of all women with births.
| Age Bracket | Women with Births | Births / 1,000 Women |
| 15 to 19 years | 0 (0.0%) | 0.0 |
| 20 to 34 years | 1 (100.0%) | 10.0 |
| 35 to 50 years | 0 (0.0%) | 0.0 |
| Total | 1 (100.0%) | 6.0 |
Fertility by Age by Marriage Status in Knik River
| Age Bracket | Married | Unmarried |
| 15 to 19 years | 0 (0.0%) | 0 (0.0%) |
| 20 to 34 years | 1 (100.0%) | 0 (0.0%) |
| 35 to 50 years | 0 (0.0%) | 0 (0.0%) |
| Total | 1 (100.0%) | 0 (0.0%) |
Fertility by Education in Knik River
| Educational Attainment | Women with Births | Births / 1,000 Women |
| Less than High School | 0 (0.0%) | 0.0 |
| High School Diploma | 0 (0.0%) | 0.0 |
| College or Associate's Degree | 0 (0.0%) | 0.0 |
| Bachelor's Degree | 1 (100.0%) | 30.0 |
| Graduate Degree | 0 (0.0%) | 0.0 |
| Total | 1 (100.0%) | 6.0 |
Fertility by Education by Marriage Status in Knik River
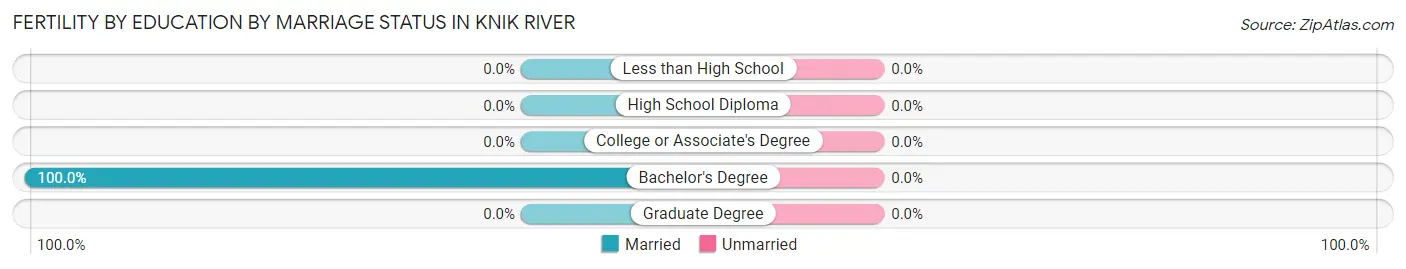
| Educational Attainment | Married | Unmarried |
| Less than High School | 0 (0.0%) | 0 (0.0%) |
| High School Diploma | 0 (0.0%) | 0 (0.0%) |
| College or Associate's Degree | 0 (0.0%) | 0 (0.0%) |
| Bachelor's Degree | 1 (100.0%) | 0 (0.0%) |
| Graduate Degree | 0 (0.0%) | 0 (0.0%) |
| Total | 1 (100.0%) | 0 (0.0%) |
Employment Characteristics in Knik River
Employment by Class of Employer in Knik River
Among the 426 employed individuals in Knik River, private company employees (255 | 59.9%), federal government employees (47 | 11.0%), and self-employed (not incorporated) (37 | 8.7%) make up the most common classes of employment.
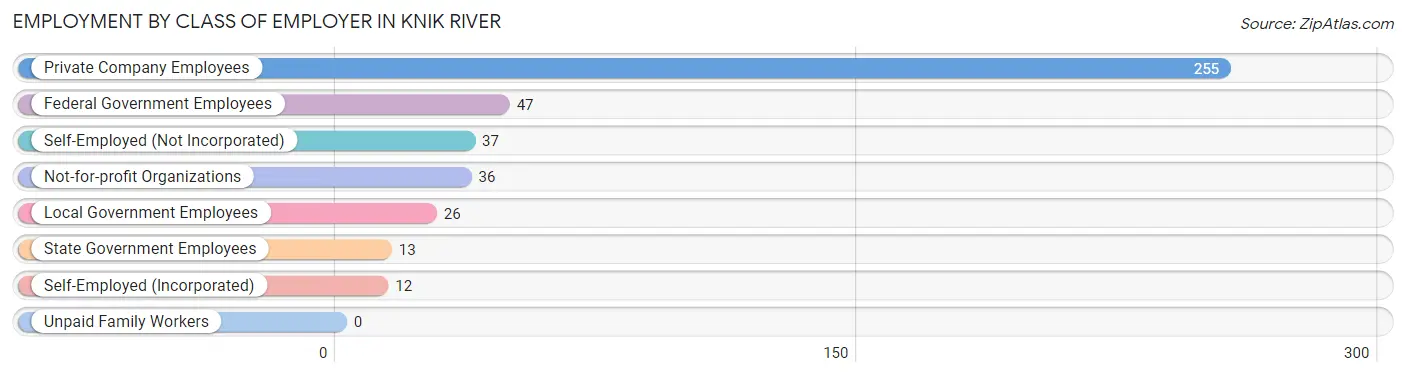
| Employer Class | # Employees | % Employees |
| Private Company Employees | 255 | 59.9% |
| Self-Employed (Incorporated) | 12 | 2.8% |
| Self-Employed (Not Incorporated) | 37 | 8.7% |
| Not-for-profit Organizations | 36 | 8.5% |
| Local Government Employees | 26 | 6.1% |
| State Government Employees | 13 | 3.0% |
| Federal Government Employees | 47 | 11.0% |
| Unpaid Family Workers | 0 | 0.0% |
| Total | 426 | 100.0% |
Employment Status by Age in Knik River
According to the labor force statistics for Knik River, out of the total population over 16 years of age (637), 68.4% or 436 individuals are in the labor force, with 2.4% or 10 of them unemployed. The age group with the highest labor force participation rate is 30 to 34 years, with 90.9% or 90 individuals in the labor force. Within the labor force, the 75 years and over age range has the highest percentage of unemployed individuals, with 100.0% or 2 of them being unemployed.
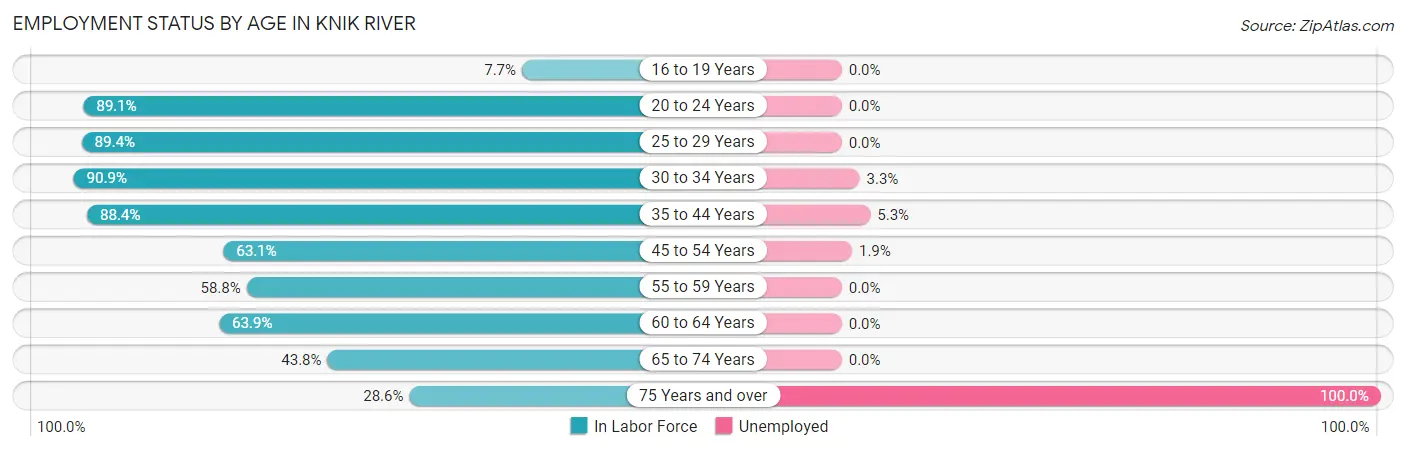
| Age Bracket | In Labor Force | Unemployed |
| 16 to 19 Years | 2 (7.7%) | 0 (0.0%) |
| 20 to 24 Years | 49 (89.1%) | 0 (0.0%) |
| 25 to 29 Years | 42 (89.4%) | 0 (0.0%) |
| 30 to 34 Years | 90 (90.9%) | 3 (3.3%) |
| 35 to 44 Years | 76 (88.4%) | 4 (5.3%) |
| 45 to 54 Years | 53 (63.1%) | 1 (1.9%) |
| 55 to 59 Years | 30 (58.8%) | 0 (0.0%) |
| 60 to 64 Years | 39 (63.9%) | 0 (0.0%) |
| 65 to 74 Years | 53 (43.8%) | 0 (0.0%) |
| 75 Years and over | 2 (28.6%) | 2 (100.0%) |
| Total | 436 (68.4%) | 10 (2.4%) |
Employment Status by Educational Attainment in Knik River
According to labor force statistics for Knik River, 77.1% of individuals (330) out of the total population between 25 and 64 years of age (428) are in the labor force, with 2.4% or 8 of them being unemployed. The group with the highest labor force participation rate are those with the educational attainment of college / associate degree, with 78.7% or 111 individuals in the labor force. Within the labor force, individuals with college / associate degree education have the highest percentage of unemployment, with 6.3% or 7 of them being unemployed.
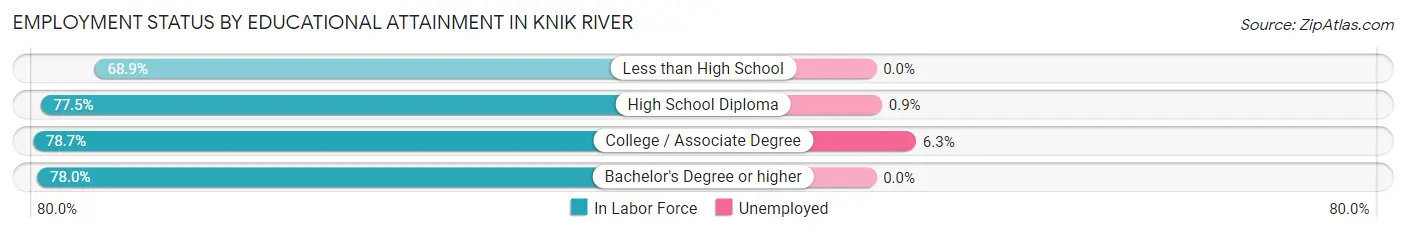
| Educational Attainment | In Labor Force | Unemployed |
| Less than High School | 31 (68.9%) | 0 (0.0%) |
| High School Diploma | 110 (77.5%) | 1 (0.9%) |
| College / Associate Degree | 111 (78.7%) | 9 (6.3%) |
| Bachelor's Degree or higher | 78 (78.0%) | 0 (0.0%) |
| Total | 330 (77.1%) | 10 (2.4%) |
Employment Occupations by Sex in Knik River
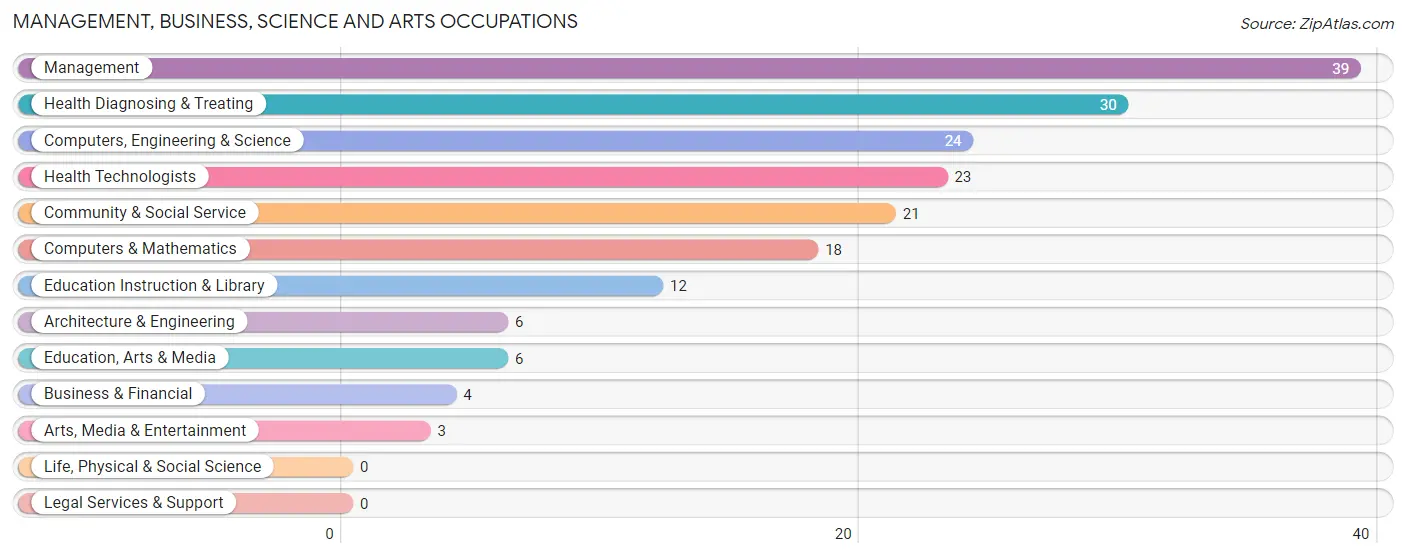
Management, Business, Science and Arts Occupations
The most common Management, Business, Science and Arts occupations in Knik River are Management (39 | 9.4%), Health Diagnosing & Treating (30 | 7.2%), Computers, Engineering & Science (24 | 5.8%), Health Technologists (23 | 5.5%), and Community & Social Service (21 | 5.1%).
Management, Business, Science and Arts Occupations by Sex
Within the Management, Business, Science and Arts occupations in Knik River, the most male-oriented occupations are Business & Financial (100.0%), Architecture & Engineering (100.0%), and Computers, Engineering & Science (70.8%), while the most female-oriented occupations are Arts, Media & Entertainment (100.0%), Health Technologists (100.0%), and Health Diagnosing & Treating (90.0%).
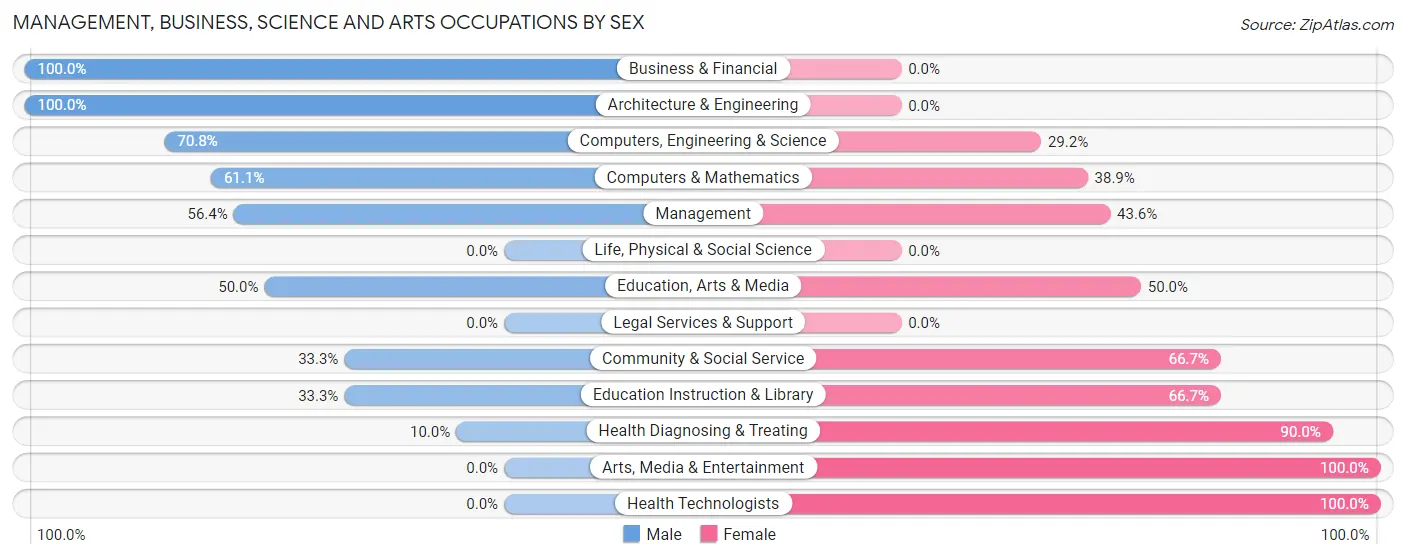
| Occupation | Male | Female |
| Management | 22 (56.4%) | 17 (43.6%) |
| Business & Financial | 4 (100.0%) | 0 (0.0%) |
| Computers, Engineering & Science | 17 (70.8%) | 7 (29.2%) |
| Computers & Mathematics | 11 (61.1%) | 7 (38.9%) |
| Architecture & Engineering | 6 (100.0%) | 0 (0.0%) |
| Life, Physical & Social Science | 0 (0.0%) | 0 (0.0%) |
| Community & Social Service | 7 (33.3%) | 14 (66.7%) |
| Education, Arts & Media | 3 (50.0%) | 3 (50.0%) |
| Legal Services & Support | 0 (0.0%) | 0 (0.0%) |
| Education Instruction & Library | 4 (33.3%) | 8 (66.7%) |
| Arts, Media & Entertainment | 0 (0.0%) | 3 (100.0%) |
| Health Diagnosing & Treating | 3 (10.0%) | 27 (90.0%) |
| Health Technologists | 0 (0.0%) | 23 (100.0%) |
| Total (Category) | 53 (44.9%) | 65 (55.1%) |
| Total (Overall) | 238 (57.4%) | 177 (42.6%) |
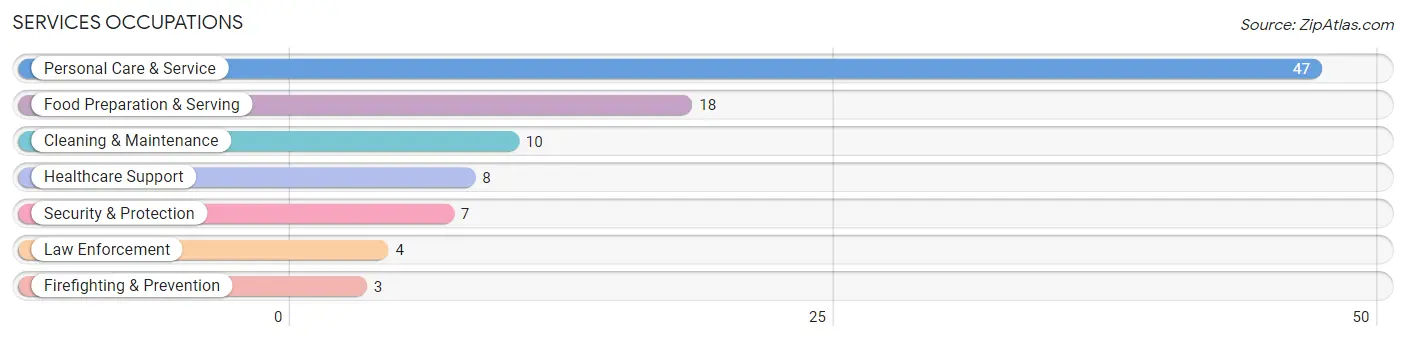
Services Occupations
The most common Services occupations in Knik River are Personal Care & Service (47 | 11.3%), Food Preparation & Serving (18 | 4.3%), Cleaning & Maintenance (10 | 2.4%), Healthcare Support (8 | 1.9%), and Security & Protection (7 | 1.7%).
Services Occupations by Sex
Within the Services occupations in Knik River, the most male-oriented occupations are Security & Protection (100.0%), Firefighting & Prevention (100.0%), and Law Enforcement (100.0%), while the most female-oriented occupations are Healthcare Support (100.0%), Food Preparation & Serving (100.0%), and Personal Care & Service (44.7%).
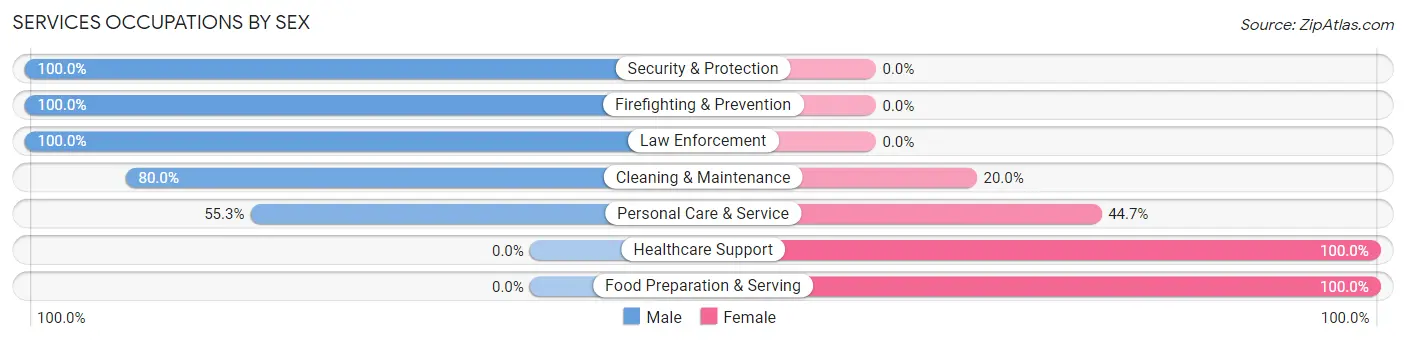
| Occupation | Male | Female |
| Healthcare Support | 0 (0.0%) | 8 (100.0%) |
| Security & Protection | 7 (100.0%) | 0 (0.0%) |
| Firefighting & Prevention | 3 (100.0%) | 0 (0.0%) |
| Law Enforcement | 4 (100.0%) | 0 (0.0%) |
| Food Preparation & Serving | 0 (0.0%) | 18 (100.0%) |
| Cleaning & Maintenance | 8 (80.0%) | 2 (20.0%) |
| Personal Care & Service | 26 (55.3%) | 21 (44.7%) |
| Total (Category) | 41 (45.6%) | 49 (54.4%) |
| Total (Overall) | 238 (57.4%) | 177 (42.6%) |
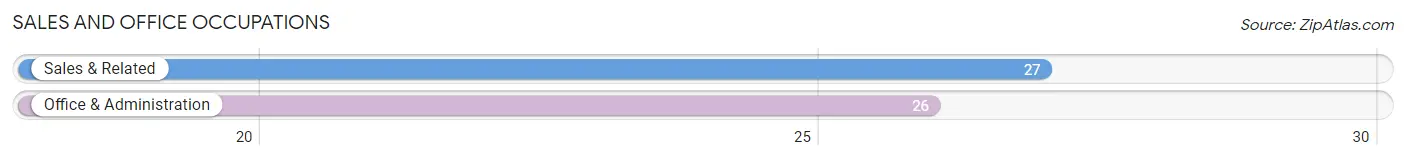
Sales and Office Occupations
The most common Sales and Office occupations in Knik River are Sales & Related (27 | 6.5%), and Office & Administration (26 | 6.3%).
Sales and Office Occupations by Sex
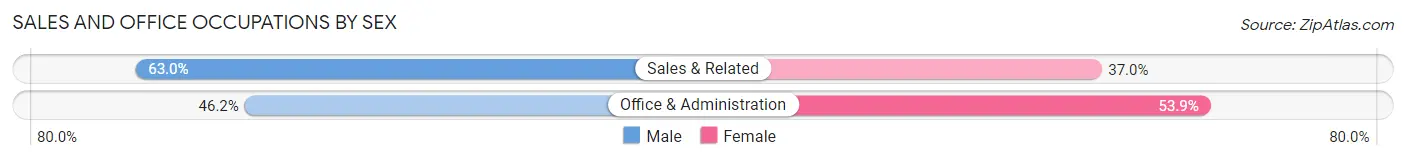
| Occupation | Male | Female |
| Sales & Related | 17 (63.0%) | 10 (37.0%) |
| Office & Administration | 12 (46.2%) | 14 (53.8%) |
| Total (Category) | 29 (54.7%) | 24 (45.3%) |
| Total (Overall) | 238 (57.4%) | 177 (42.6%) |
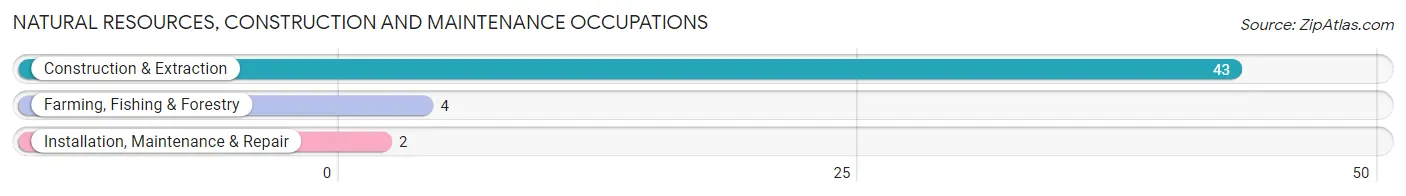
Natural Resources, Construction and Maintenance Occupations
The most common Natural Resources, Construction and Maintenance occupations in Knik River are Construction & Extraction (43 | 10.4%), Farming, Fishing & Forestry (4 | 1.0%), and Installation, Maintenance & Repair (2 | 0.5%).
Natural Resources, Construction and Maintenance Occupations by Sex
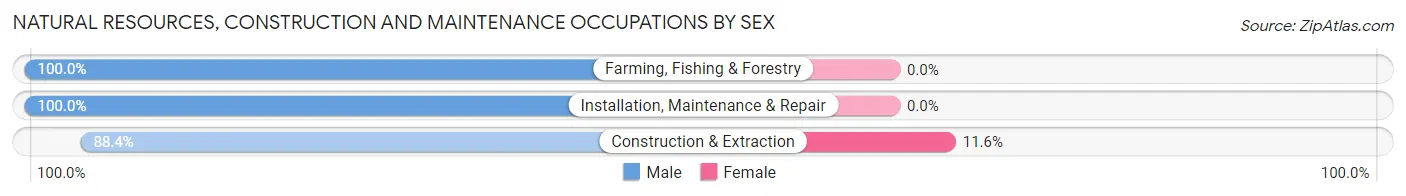
| Occupation | Male | Female |
| Farming, Fishing & Forestry | 4 (100.0%) | 0 (0.0%) |
| Construction & Extraction | 38 (88.4%) | 5 (11.6%) |
| Installation, Maintenance & Repair | 2 (100.0%) | 0 (0.0%) |
| Total (Category) | 44 (89.8%) | 5 (10.2%) |
| Total (Overall) | 238 (57.4%) | 177 (42.6%) |
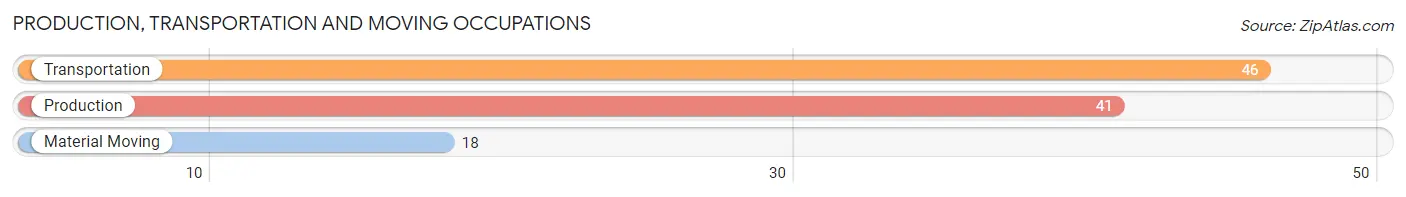
Production, Transportation and Moving Occupations
The most common Production, Transportation and Moving occupations in Knik River are Transportation (46 | 11.1%), Production (41 | 9.9%), and Material Moving (18 | 4.3%).
Production, Transportation and Moving Occupations by Sex
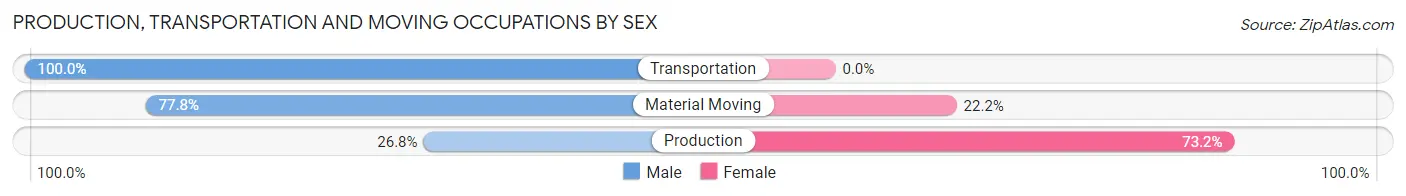
| Occupation | Male | Female |
| Production | 11 (26.8%) | 30 (73.2%) |
| Transportation | 46 (100.0%) | 0 (0.0%) |
| Material Moving | 14 (77.8%) | 4 (22.2%) |
| Total (Category) | 71 (67.6%) | 34 (32.4%) |
| Total (Overall) | 238 (57.4%) | 177 (42.6%) |
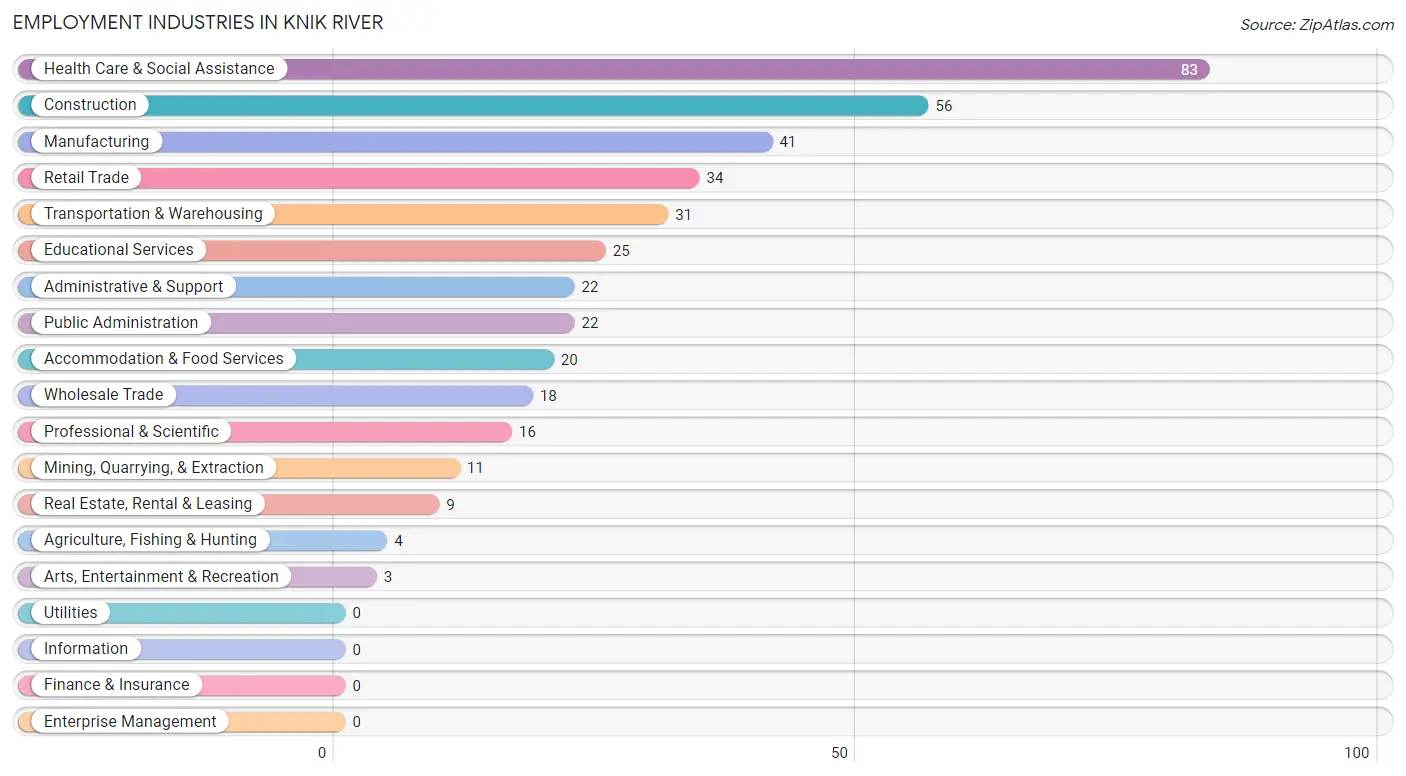
Employment Industries by Sex in Knik River
Employment Industries in Knik River
The major employment industries in Knik River include Health Care & Social Assistance (83 | 20.0%), Construction (56 | 13.5%), Manufacturing (41 | 9.9%), Retail Trade (34 | 8.2%), and Transportation & Warehousing (31 | 7.5%).
Employment Industries by Sex in Knik River
The Knik River industries that see more men than women are Agriculture, Fishing & Hunting (100.0%), Mining, Quarrying, & Extraction (100.0%), and Public Administration (100.0%), whereas the industries that tend to have a higher number of women are Arts, Entertainment & Recreation (100.0%), Educational Services (84.0%), and Accommodation & Food Services (80.0%).
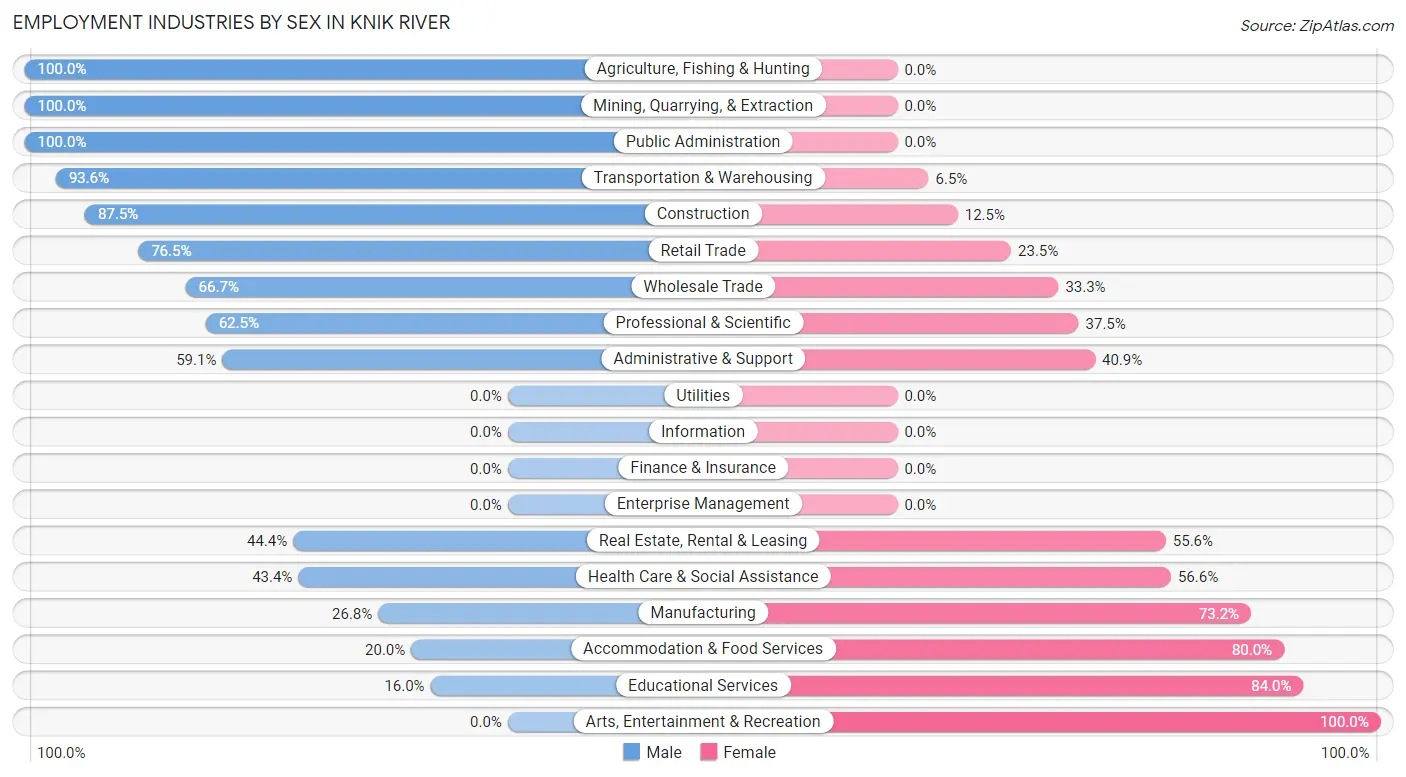
| Industry | Male | Female |
| Agriculture, Fishing & Hunting | 4 (100.0%) | 0 (0.0%) |
| Mining, Quarrying, & Extraction | 11 (100.0%) | 0 (0.0%) |
| Construction | 49 (87.5%) | 7 (12.5%) |
| Manufacturing | 11 (26.8%) | 30 (73.2%) |
| Wholesale Trade | 12 (66.7%) | 6 (33.3%) |
| Retail Trade | 26 (76.5%) | 8 (23.5%) |
| Transportation & Warehousing | 29 (93.5%) | 2 (6.5%) |
| Utilities | 0 (0.0%) | 0 (0.0%) |
| Information | 0 (0.0%) | 0 (0.0%) |
| Finance & Insurance | 0 (0.0%) | 0 (0.0%) |
| Real Estate, Rental & Leasing | 4 (44.4%) | 5 (55.6%) |
| Professional & Scientific | 10 (62.5%) | 6 (37.5%) |
| Enterprise Management | 0 (0.0%) | 0 (0.0%) |
| Administrative & Support | 13 (59.1%) | 9 (40.9%) |
| Educational Services | 4 (16.0%) | 21 (84.0%) |
| Health Care & Social Assistance | 36 (43.4%) | 47 (56.6%) |
| Arts, Entertainment & Recreation | 0 (0.0%) | 3 (100.0%) |
| Accommodation & Food Services | 4 (20.0%) | 16 (80.0%) |
| Public Administration | 22 (100.0%) | 0 (0.0%) |
| Total | 238 (57.4%) | 177 (42.6%) |
Education in Knik River
School Enrollment in Knik River
The most common levels of schooling among the 221 students in Knik River are elementary school (56 | 25.3%), high school (44 | 19.9%), and middle school (43 | 19.5%).
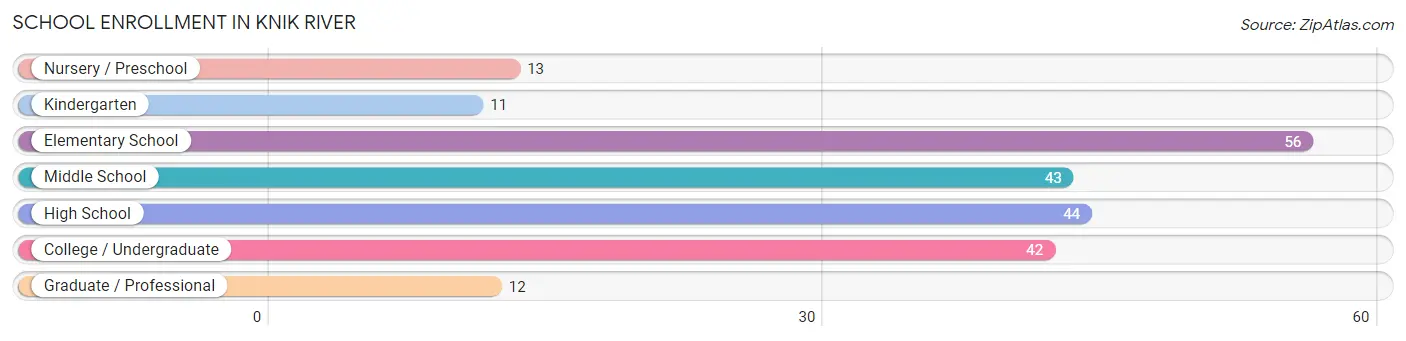
| School Level | # Students | % Students |
| Nursery / Preschool | 13 | 5.9% |
| Kindergarten | 11 | 5.0% |
| Elementary School | 56 | 25.3% |
| Middle School | 43 | 19.5% |
| High School | 44 | 19.9% |
| College / Undergraduate | 42 | 19.0% |
| Graduate / Professional | 12 | 5.4% |
| Total | 221 | 100.0% |
School Enrollment by Age by Funding Source in Knik River
Out of a total of 221 students who are enrolled in schools in Knik River, 97 (43.9%) attend a private institution, while the remaining 124 (56.1%) are enrolled in public schools. The age group of 3 to 4 year olds has the highest likelihood of being enrolled in private schools, with 9 (100.0% in the age bracket) enrolled. Conversely, the age group of 18 to 19 year olds has the lowest likelihood of being enrolled in a private school, with 10 (100.0% in the age bracket) attending a public institution.
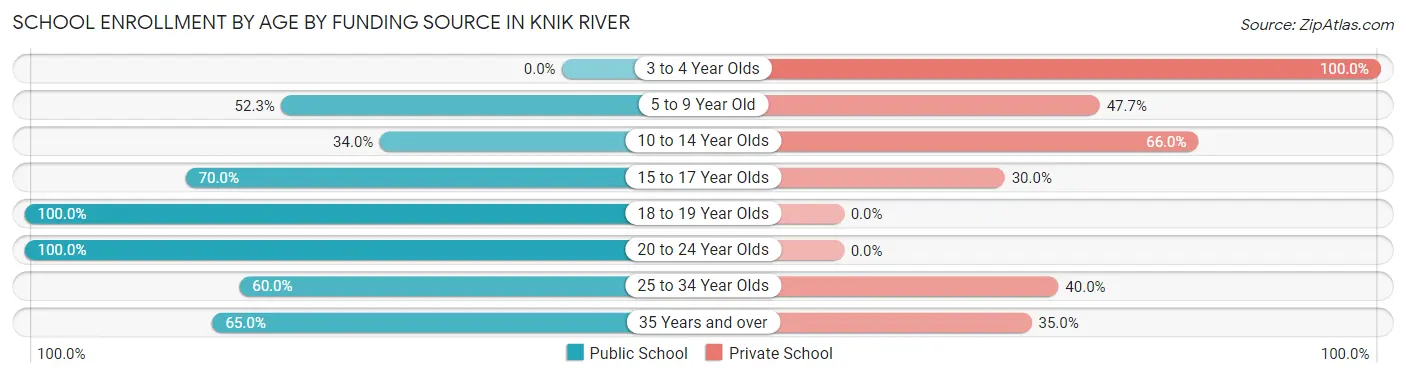
| Age Bracket | Public School | Private School |
| 3 to 4 Year Olds | 0 (0.0%) | 9 (100.0%) |
| 5 to 9 Year Old | 34 (52.3%) | 31 (47.7%) |
| 10 to 14 Year Olds | 18 (34.0%) | 35 (66.0%) |
| 15 to 17 Year Olds | 21 (70.0%) | 9 (30.0%) |
| 18 to 19 Year Olds | 10 (100.0%) | 0 (0.0%) |
| 20 to 24 Year Olds | 19 (100.0%) | 0 (0.0%) |
| 25 to 34 Year Olds | 9 (60.0%) | 6 (40.0%) |
| 35 Years and over | 13 (65.0%) | 7 (35.0%) |
| Total | 124 (56.1%) | 97 (43.9%) |
Educational Attainment by Field of Study in Knik River
Engineering (21 | 15.8%), business (21 | 15.8%), education (18 | 13.5%), psychology (16 | 12.0%), and science & technology (12 | 9.0%) are the most common fields of study among 133 individuals in Knik River who have obtained a bachelor's degree or higher.
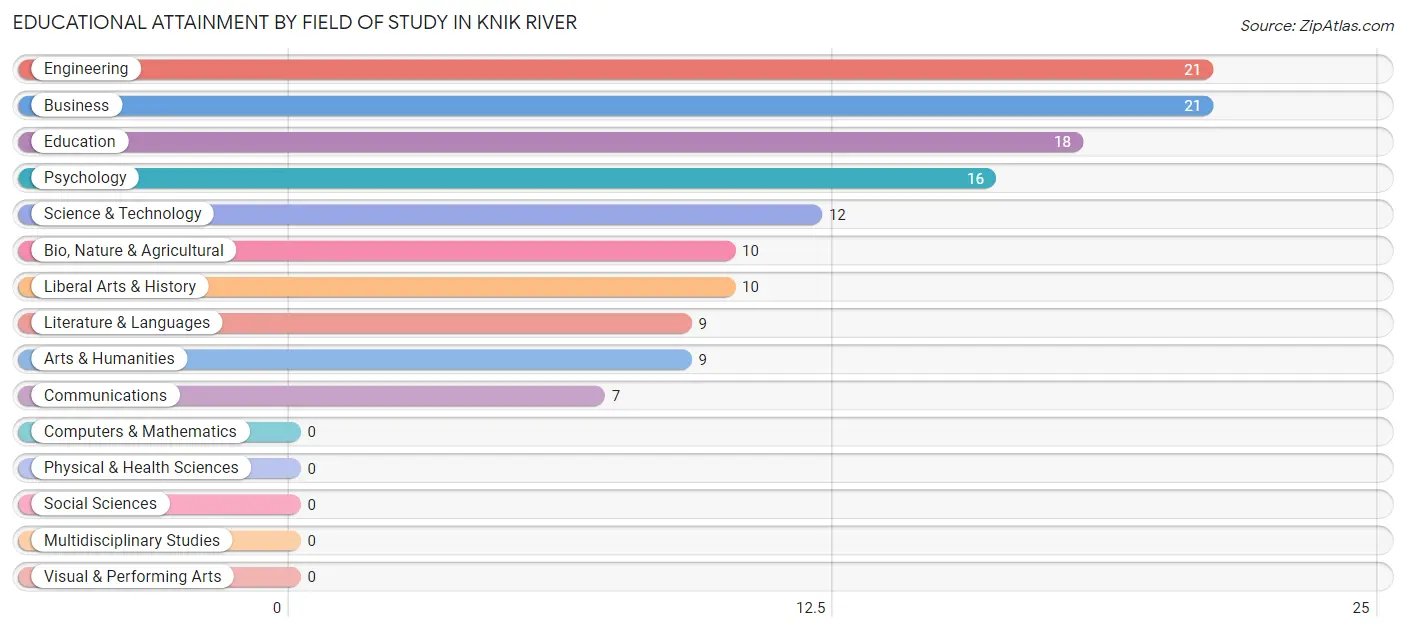
| Field of Study | # Graduates | % Graduates |
| Computers & Mathematics | 0 | 0.0% |
| Bio, Nature & Agricultural | 10 | 7.5% |
| Physical & Health Sciences | 0 | 0.0% |
| Psychology | 16 | 12.0% |
| Social Sciences | 0 | 0.0% |
| Engineering | 21 | 15.8% |
| Multidisciplinary Studies | 0 | 0.0% |
| Science & Technology | 12 | 9.0% |
| Business | 21 | 15.8% |
| Education | 18 | 13.5% |
| Literature & Languages | 9 | 6.8% |
| Liberal Arts & History | 10 | 7.5% |
| Visual & Performing Arts | 0 | 0.0% |
| Communications | 7 | 5.3% |
| Arts & Humanities | 9 | 6.8% |
| Total | 133 | 100.0% |
Transportation & Commute in Knik River
Vehicle Availability by Sex in Knik River
The most prevalent vehicle ownership categories in Knik River are males with 2 vehicles (80, accounting for 32.1%) and females with 2 vehicles (43, making up 45.2%).
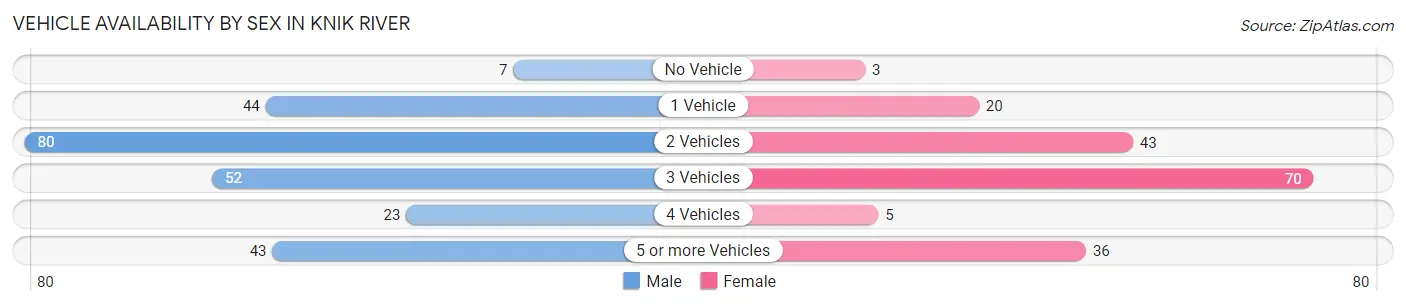
| Vehicles Available | Male | Female |
| No Vehicle | 7 (2.8%) | 3 (1.7%) |
| 1 Vehicle | 44 (17.7%) | 20 (11.3%) |
| 2 Vehicles | 80 (32.1%) | 43 (24.3%) |
| 3 Vehicles | 52 (20.9%) | 70 (39.6%) |
| 4 Vehicles | 23 (9.2%) | 5 (2.8%) |
| 5 or more Vehicles | 43 (17.3%) | 36 (20.3%) |
| Total | 249 (100.0%) | 177 (100.0%) |
Commute Time in Knik River
The most frequently occuring commute durations in Knik River are 30 to 34 minutes (84 commuters, 21.9%), 45 to 59 minutes (79 commuters, 20.6%), and 60 to 89 minutes (69 commuters, 18.0%).
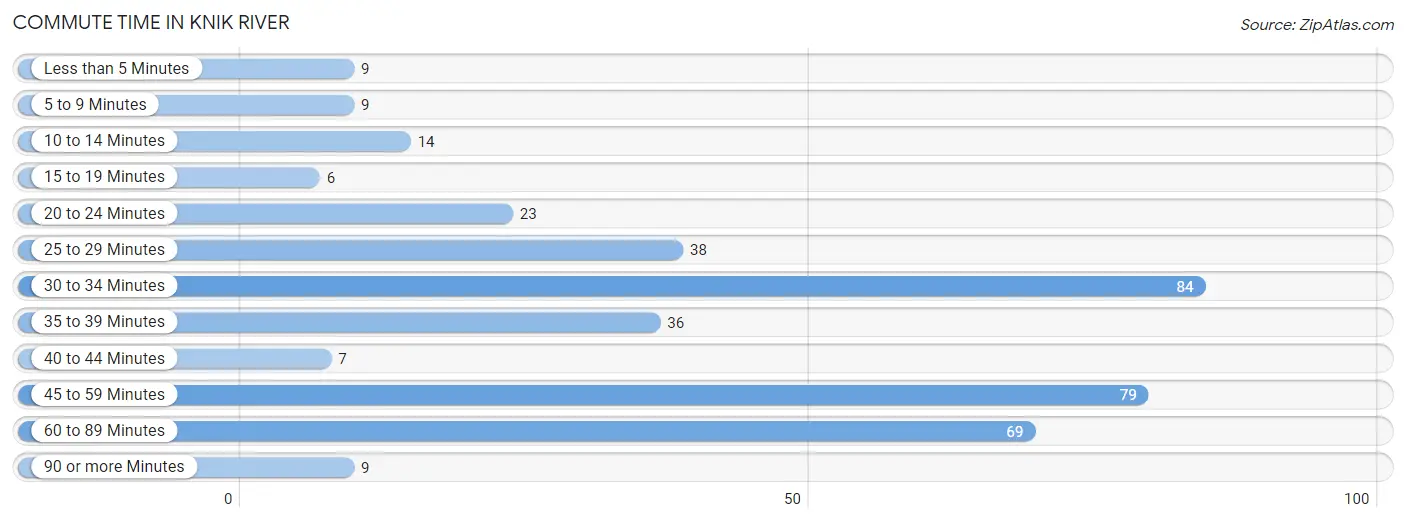
| Commute Time | # Commuters | % Commuters |
| Less than 5 Minutes | 9 | 2.4% |
| 5 to 9 Minutes | 9 | 2.4% |
| 10 to 14 Minutes | 14 | 3.7% |
| 15 to 19 Minutes | 6 | 1.6% |
| 20 to 24 Minutes | 23 | 6.0% |
| 25 to 29 Minutes | 38 | 9.9% |
| 30 to 34 Minutes | 84 | 21.9% |
| 35 to 39 Minutes | 36 | 9.4% |
| 40 to 44 Minutes | 7 | 1.8% |
| 45 to 59 Minutes | 79 | 20.6% |
| 60 to 89 Minutes | 69 | 18.0% |
| 90 or more Minutes | 9 | 2.4% |
Commute Time by Sex in Knik River
The most common commute times in Knik River are 45 to 59 minutes (60 commuters, 26.4%) for males and 30 to 34 minutes (43 commuters, 27.6%) for females.
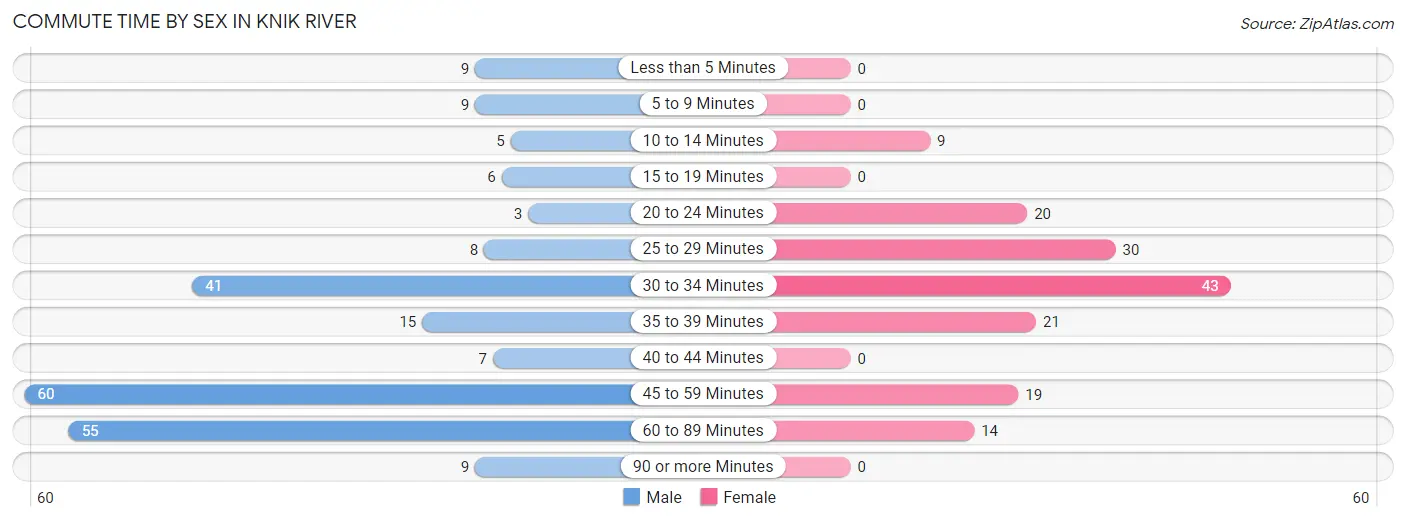
| Commute Time | Male | Female |
| Less than 5 Minutes | 9 (4.0%) | 0 (0.0%) |
| 5 to 9 Minutes | 9 (4.0%) | 0 (0.0%) |
| 10 to 14 Minutes | 5 (2.2%) | 9 (5.8%) |
| 15 to 19 Minutes | 6 (2.6%) | 0 (0.0%) |
| 20 to 24 Minutes | 3 (1.3%) | 20 (12.8%) |
| 25 to 29 Minutes | 8 (3.5%) | 30 (19.2%) |
| 30 to 34 Minutes | 41 (18.1%) | 43 (27.6%) |
| 35 to 39 Minutes | 15 (6.6%) | 21 (13.5%) |
| 40 to 44 Minutes | 7 (3.1%) | 0 (0.0%) |
| 45 to 59 Minutes | 60 (26.4%) | 19 (12.2%) |
| 60 to 89 Minutes | 55 (24.2%) | 14 (9.0%) |
| 90 or more Minutes | 9 (4.0%) | 0 (0.0%) |
Time of Departure to Work by Sex in Knik River
The most frequent times of departure to work in Knik River are 6:30 AM to 6:59 AM (46, 20.3%) for males and 6:30 AM to 6:59 AM (34, 21.8%) for females.
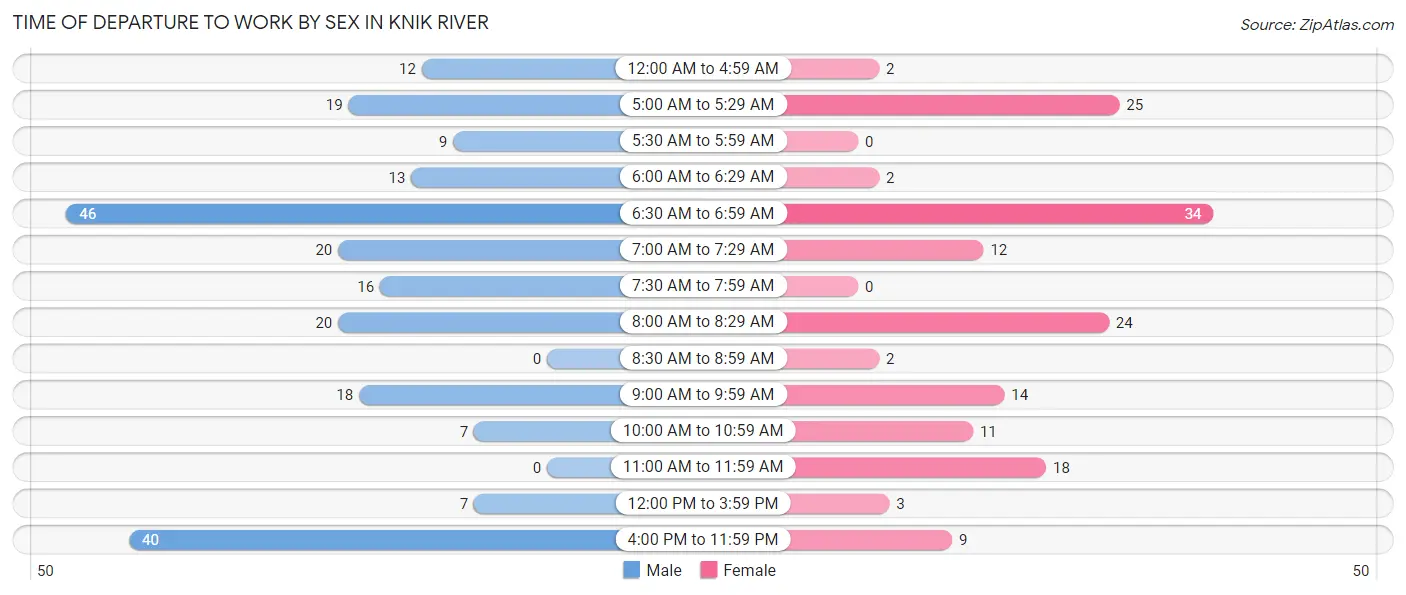
| Time of Departure | Male | Female |
| 12:00 AM to 4:59 AM | 12 (5.3%) | 2 (1.3%) |
| 5:00 AM to 5:29 AM | 19 (8.4%) | 25 (16.0%) |
| 5:30 AM to 5:59 AM | 9 (4.0%) | 0 (0.0%) |
| 6:00 AM to 6:29 AM | 13 (5.7%) | 2 (1.3%) |
| 6:30 AM to 6:59 AM | 46 (20.3%) | 34 (21.8%) |
| 7:00 AM to 7:29 AM | 20 (8.8%) | 12 (7.7%) |
| 7:30 AM to 7:59 AM | 16 (7.0%) | 0 (0.0%) |
| 8:00 AM to 8:29 AM | 20 (8.8%) | 24 (15.4%) |
| 8:30 AM to 8:59 AM | 0 (0.0%) | 2 (1.3%) |
| 9:00 AM to 9:59 AM | 18 (7.9%) | 14 (9.0%) |
| 10:00 AM to 10:59 AM | 7 (3.1%) | 11 (7.0%) |
| 11:00 AM to 11:59 AM | 0 (0.0%) | 18 (11.5%) |
| 12:00 PM to 3:59 PM | 7 (3.1%) | 3 (1.9%) |
| 4:00 PM to 11:59 PM | 40 (17.6%) | 9 (5.8%) |
| Total | 227 (100.0%) | 156 (100.0%) |
Housing Occupancy in Knik River
Occupancy by Ownership in Knik River
Of the total 316 dwellings in Knik River, owner-occupied units account for 285 (90.2%), while renter-occupied units make up 31 (9.8%).
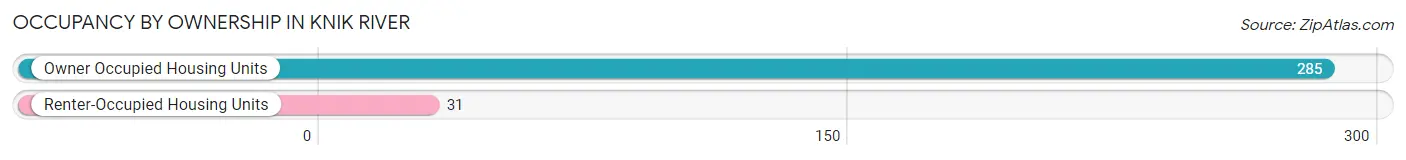
| Occupancy | # Housing Units | % Housing Units |
| Owner Occupied Housing Units | 285 | 90.2% |
| Renter-Occupied Housing Units | 31 | 9.8% |
| Total Occupied Housing Units | 316 | 100.0% |
Occupancy by Household Size in Knik River
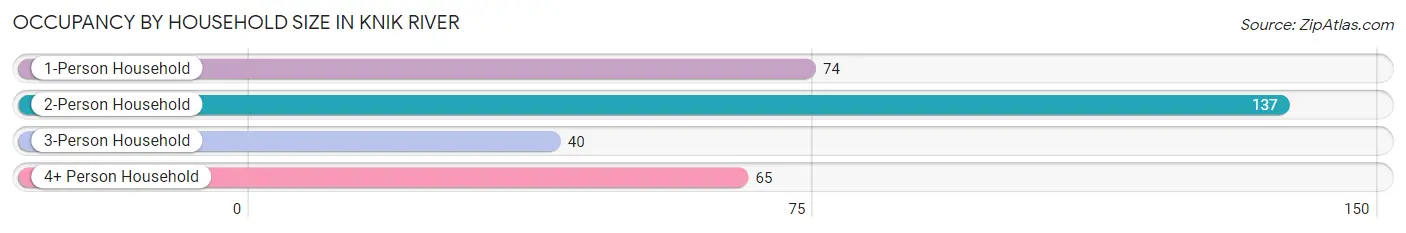
| Household Size | # Housing Units | % Housing Units |
| 1-Person Household | 74 | 23.4% |
| 2-Person Household | 137 | 43.3% |
| 3-Person Household | 40 | 12.7% |
| 4+ Person Household | 65 | 20.6% |
| Total Housing Units | 316 | 100.0% |
Occupancy by Ownership by Household Size in Knik River
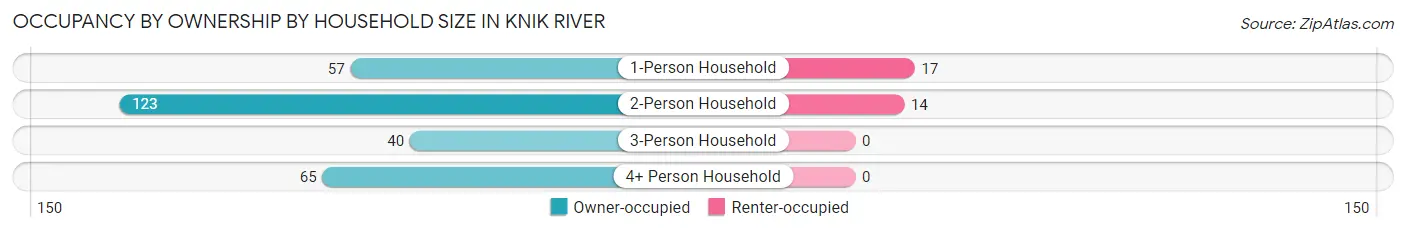
| Household Size | Owner-occupied | Renter-occupied |
| 1-Person Household | 57 (77.0%) | 17 (23.0%) |
| 2-Person Household | 123 (89.8%) | 14 (10.2%) |
| 3-Person Household | 40 (100.0%) | 0 (0.0%) |
| 4+ Person Household | 65 (100.0%) | 0 (0.0%) |
| Total Housing Units | 285 (90.2%) | 31 (9.8%) |
Occupancy by Educational Attainment in Knik River
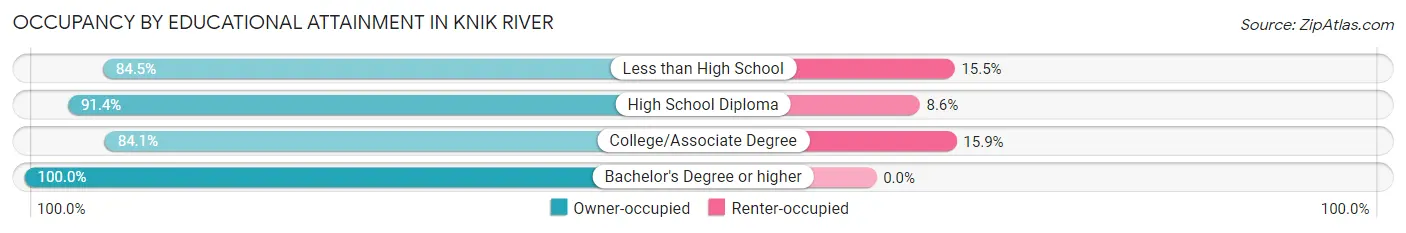
| Household Size | Owner-occupied | Renter-occupied |
| Less than High School | 49 (84.5%) | 9 (15.5%) |
| High School Diploma | 85 (91.4%) | 8 (8.6%) |
| College/Associate Degree | 74 (84.1%) | 14 (15.9%) |
| Bachelor's Degree or higher | 77 (100.0%) | 0 (0.0%) |
Occupancy by Age of Householder in Knik River
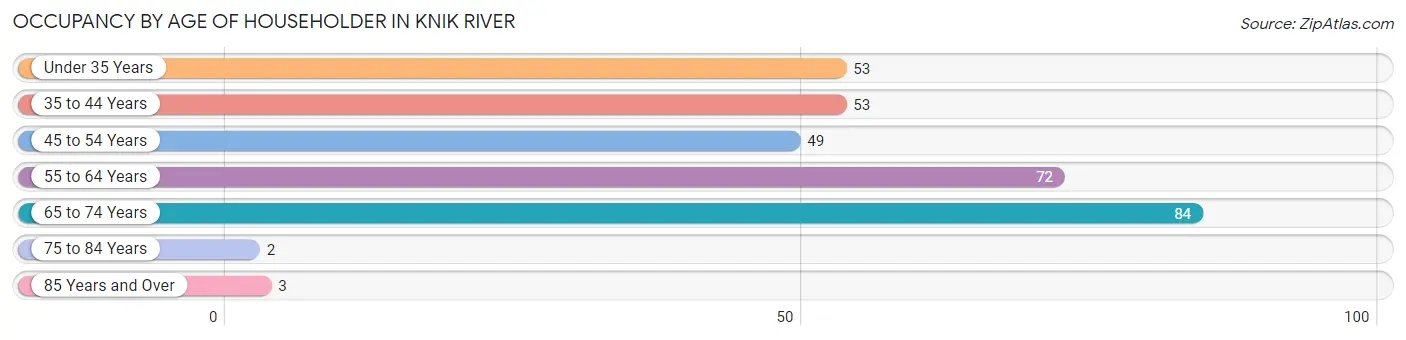
| Age Bracket | # Households | % Households |
| Under 35 Years | 53 | 16.8% |
| 35 to 44 Years | 53 | 16.8% |
| 45 to 54 Years | 49 | 15.5% |
| 55 to 64 Years | 72 | 22.8% |
| 65 to 74 Years | 84 | 26.6% |
| 75 to 84 Years | 2 | 0.6% |
| 85 Years and Over | 3 | 0.9% |
| Total | 316 | 100.0% |
Housing Finances in Knik River
Median Income by Occupancy in Knik River
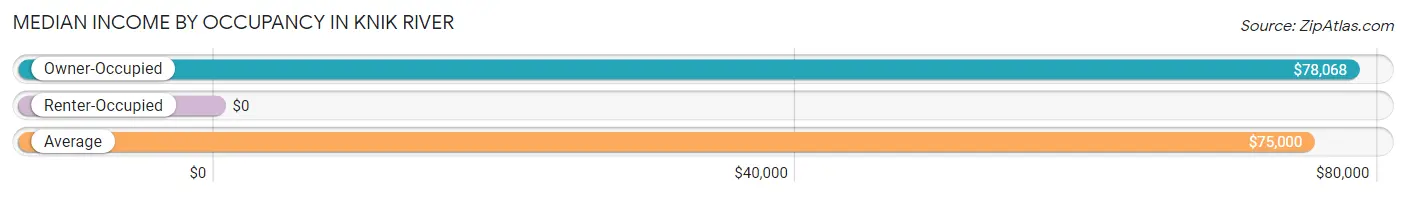
| Occupancy Type | # Households | Median Income |
| Owner-Occupied | 285 (90.2%) | $78,068 |
| Renter-Occupied | 31 (9.8%) | $0 |
| Average | 316 (100.0%) | $75,000 |
Occupancy by Householder Income Bracket in Knik River
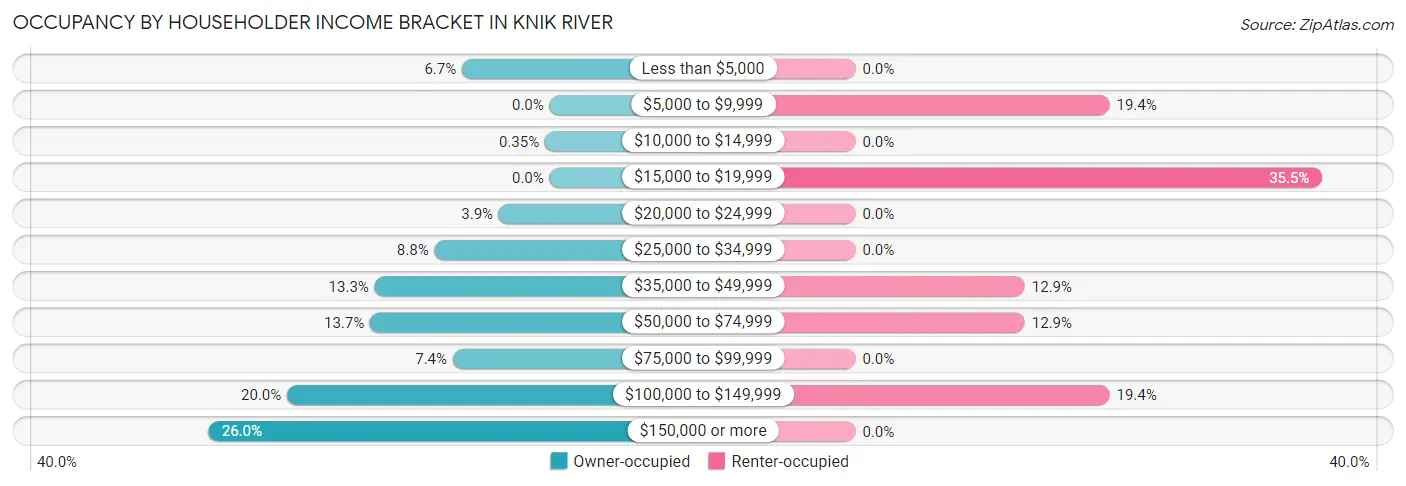
| Income Bracket | Owner-occupied | Renter-occupied |
| Less than $5,000 | 19 (6.7%) | 0 (0.0%) |
| $5,000 to $9,999 | 0 (0.0%) | 6 (19.4%) |
| $10,000 to $14,999 | 1 (0.4%) | 0 (0.0%) |
| $15,000 to $19,999 | 0 (0.0%) | 11 (35.5%) |
| $20,000 to $24,999 | 11 (3.9%) | 0 (0.0%) |
| $25,000 to $34,999 | 25 (8.8%) | 0 (0.0%) |
| $35,000 to $49,999 | 38 (13.3%) | 4 (12.9%) |
| $50,000 to $74,999 | 39 (13.7%) | 4 (12.9%) |
| $75,000 to $99,999 | 21 (7.4%) | 0 (0.0%) |
| $100,000 to $149,999 | 57 (20.0%) | 6 (19.4%) |
| $150,000 or more | 74 (26.0%) | 0 (0.0%) |
| Total | 285 (100.0%) | 31 (100.0%) |
Monthly Housing Cost Tiers in Knik River
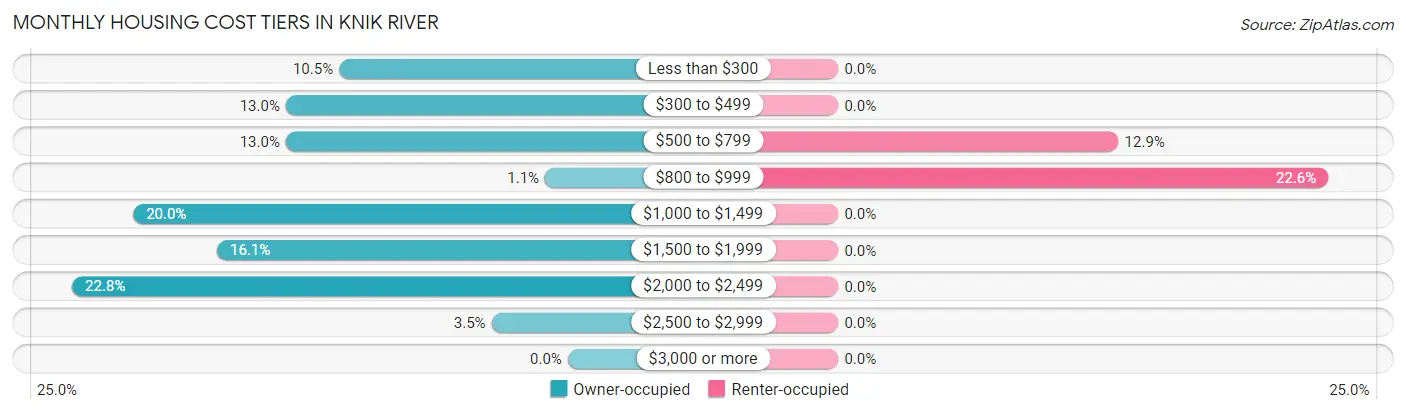
| Monthly Cost | Owner-occupied | Renter-occupied |
| Less than $300 | 30 (10.5%) | 0 (0.0%) |
| $300 to $499 | 37 (13.0%) | 0 (0.0%) |
| $500 to $799 | 37 (13.0%) | 4 (12.9%) |
| $800 to $999 | 3 (1.1%) | 7 (22.6%) |
| $1,000 to $1,499 | 57 (20.0%) | 0 (0.0%) |
| $1,500 to $1,999 | 46 (16.1%) | 0 (0.0%) |
| $2,000 to $2,499 | 65 (22.8%) | 0 (0.0%) |
| $2,500 to $2,999 | 10 (3.5%) | 0 (0.0%) |
| $3,000 or more | 0 (0.0%) | 0 (0.0%) |
| Total | 285 (100.0%) | 31 (100.0%) |
Physical Housing Characteristics in Knik River
Housing Structures in Knik River
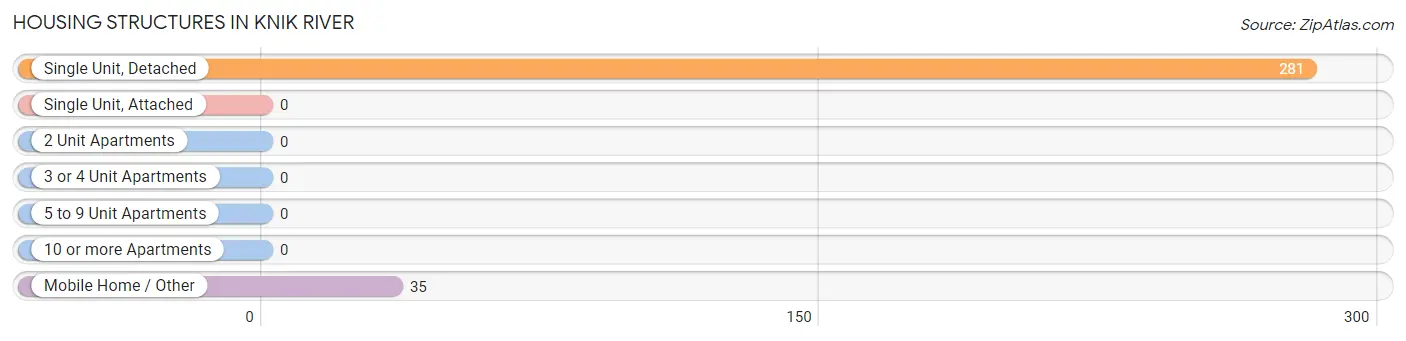
| Structure Type | # Housing Units | % Housing Units |
| Single Unit, Detached | 281 | 88.9% |
| Single Unit, Attached | 0 | 0.0% |
| 2 Unit Apartments | 0 | 0.0% |
| 3 or 4 Unit Apartments | 0 | 0.0% |
| 5 to 9 Unit Apartments | 0 | 0.0% |
| 10 or more Apartments | 0 | 0.0% |
| Mobile Home / Other | 35 | 11.1% |
| Total | 316 | 100.0% |
Housing Structures by Occupancy in Knik River
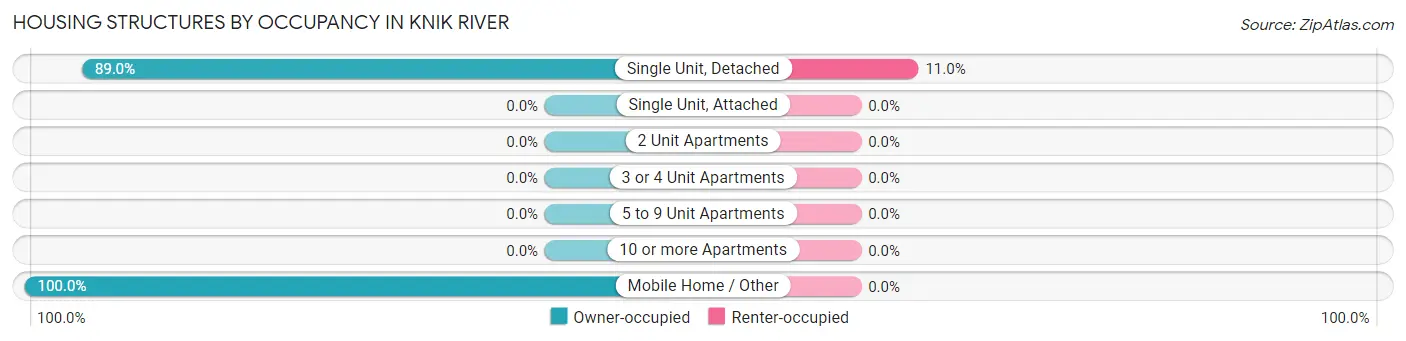
| Structure Type | Owner-occupied | Renter-occupied |
| Single Unit, Detached | 250 (89.0%) | 31 (11.0%) |
| Single Unit, Attached | 0 (0.0%) | 0 (0.0%) |
| 2 Unit Apartments | 0 (0.0%) | 0 (0.0%) |
| 3 or 4 Unit Apartments | 0 (0.0%) | 0 (0.0%) |
| 5 to 9 Unit Apartments | 0 (0.0%) | 0 (0.0%) |
| 10 or more Apartments | 0 (0.0%) | 0 (0.0%) |
| Mobile Home / Other | 35 (100.0%) | 0 (0.0%) |
| Total | 285 (90.2%) | 31 (9.8%) |
Housing Structures by Number of Rooms in Knik River
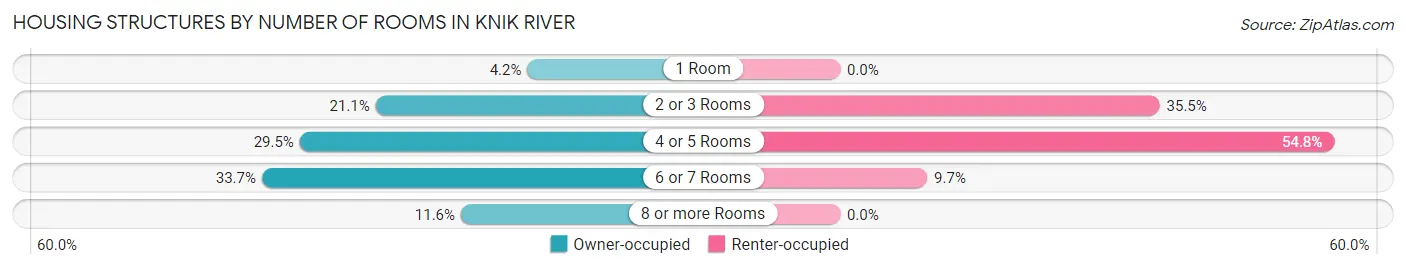
| Number of Rooms | Owner-occupied | Renter-occupied |
| 1 Room | 12 (4.2%) | 0 (0.0%) |
| 2 or 3 Rooms | 60 (21.0%) | 11 (35.5%) |
| 4 or 5 Rooms | 84 (29.5%) | 17 (54.8%) |
| 6 or 7 Rooms | 96 (33.7%) | 3 (9.7%) |
| 8 or more Rooms | 33 (11.6%) | 0 (0.0%) |
| Total | 285 (100.0%) | 31 (100.0%) |
Housing Structure by Heating Type in Knik River
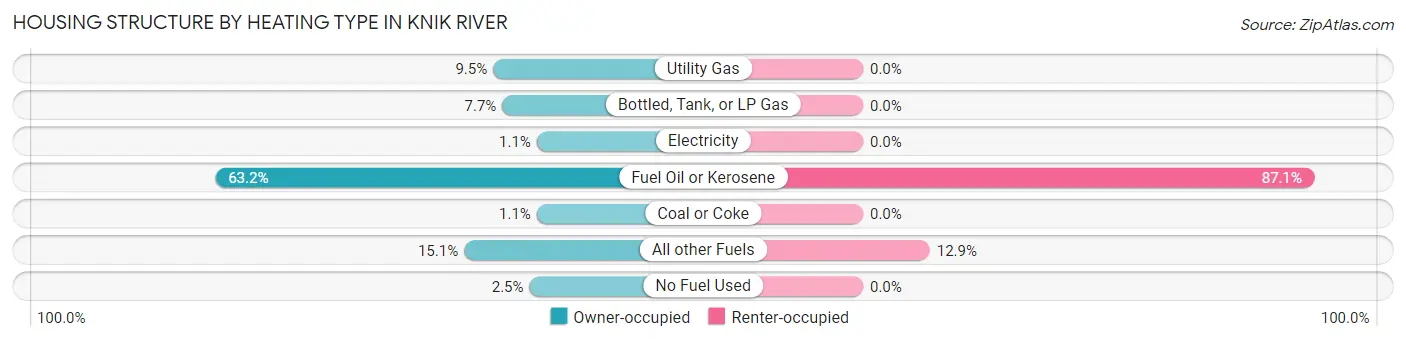
| Heating Type | Owner-occupied | Renter-occupied |
| Utility Gas | 27 (9.5%) | 0 (0.0%) |
| Bottled, Tank, or LP Gas | 22 (7.7%) | 0 (0.0%) |
| Electricity | 3 (1.1%) | 0 (0.0%) |
| Fuel Oil or Kerosene | 180 (63.2%) | 27 (87.1%) |
| Coal or Coke | 3 (1.1%) | 0 (0.0%) |
| All other Fuels | 43 (15.1%) | 4 (12.9%) |
| No Fuel Used | 7 (2.5%) | 0 (0.0%) |
| Total | 285 (100.0%) | 31 (100.0%) |
Household Vehicle Usage in Knik River
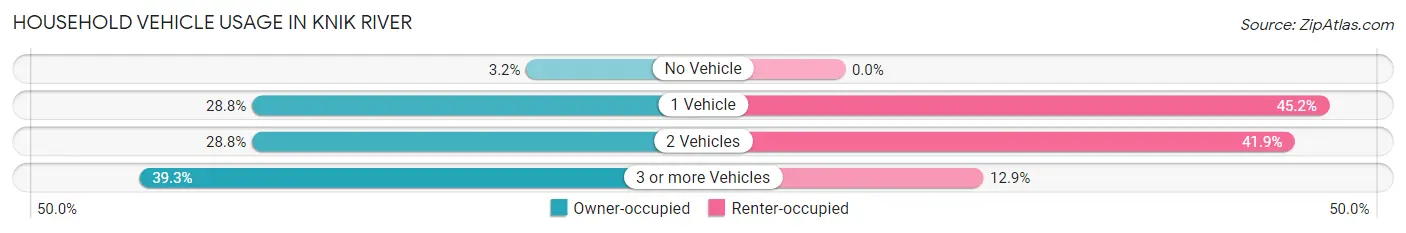
| Vehicles per Household | Owner-occupied | Renter-occupied |
| No Vehicle | 9 (3.2%) | 0 (0.0%) |
| 1 Vehicle | 82 (28.8%) | 14 (45.2%) |
| 2 Vehicles | 82 (28.8%) | 13 (41.9%) |
| 3 or more Vehicles | 112 (39.3%) | 4 (12.9%) |
| Total | 285 (100.0%) | 31 (100.0%) |
Real Estate & Mortgages in Knik River
Real Estate and Mortgage Overview in Knik River
| Characteristic | Without Mortgage | With Mortgage |
| Housing Units | 134 | 151 |
| Median Property Value | $147,700 | $280,100 |
| Median Household Income | - | - |
| Monthly Housing Costs | $500 | $0 |
| Real Estate Taxes | $2,023 | $3 |
Property Value by Mortgage Status in Knik River
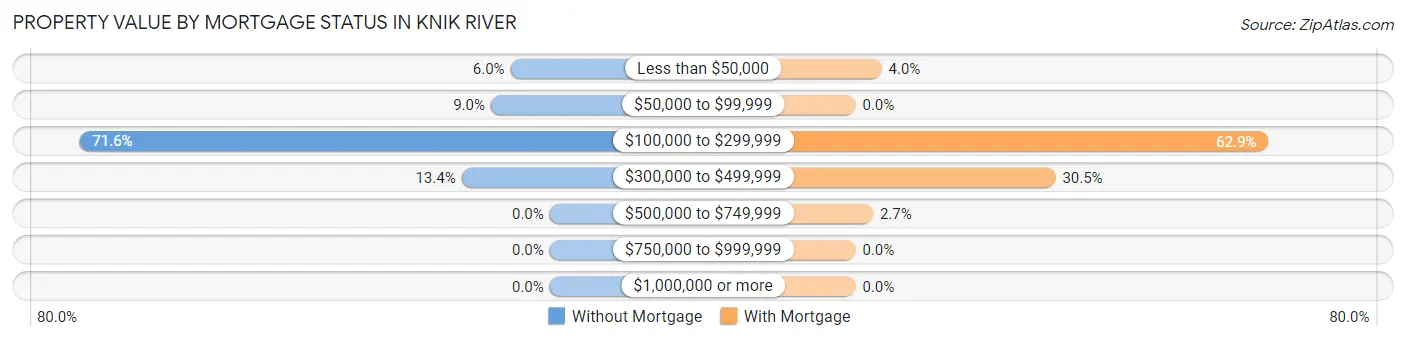
| Property Value | Without Mortgage | With Mortgage |
| Less than $50,000 | 8 (6.0%) | 6 (4.0%) |
| $50,000 to $99,999 | 12 (9.0%) | 0 (0.0%) |
| $100,000 to $299,999 | 96 (71.6%) | 95 (62.9%) |
| $300,000 to $499,999 | 18 (13.4%) | 46 (30.5%) |
| $500,000 to $749,999 | 0 (0.0%) | 4 (2.6%) |
| $750,000 to $999,999 | 0 (0.0%) | 0 (0.0%) |
| $1,000,000 or more | 0 (0.0%) | 0 (0.0%) |
| Total | 134 (100.0%) | 151 (100.0%) |
Household Income by Mortgage Status in Knik River
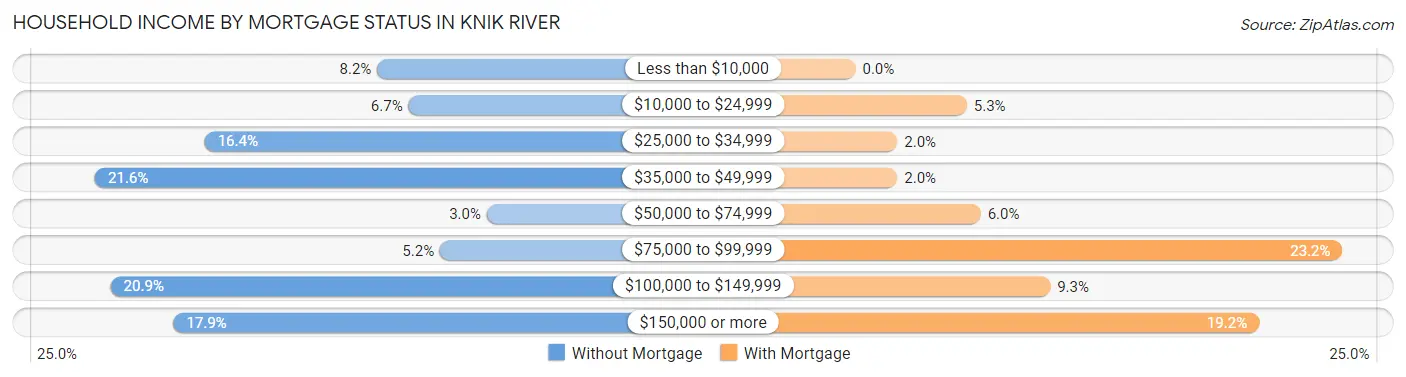
| Household Income | Without Mortgage | With Mortgage |
| Less than $10,000 | 11 (8.2%) | 0 (0.0%) |
| $10,000 to $24,999 | 9 (6.7%) | 8 (5.3%) |
| $25,000 to $34,999 | 22 (16.4%) | 3 (2.0%) |
| $35,000 to $49,999 | 29 (21.6%) | 3 (2.0%) |
| $50,000 to $74,999 | 4 (3.0%) | 9 (6.0%) |
| $75,000 to $99,999 | 7 (5.2%) | 35 (23.2%) |
| $100,000 to $149,999 | 28 (20.9%) | 14 (9.3%) |
| $150,000 or more | 24 (17.9%) | 29 (19.2%) |
| Total | 134 (100.0%) | 151 (100.0%) |
Property Value to Household Income Ratio in Knik River
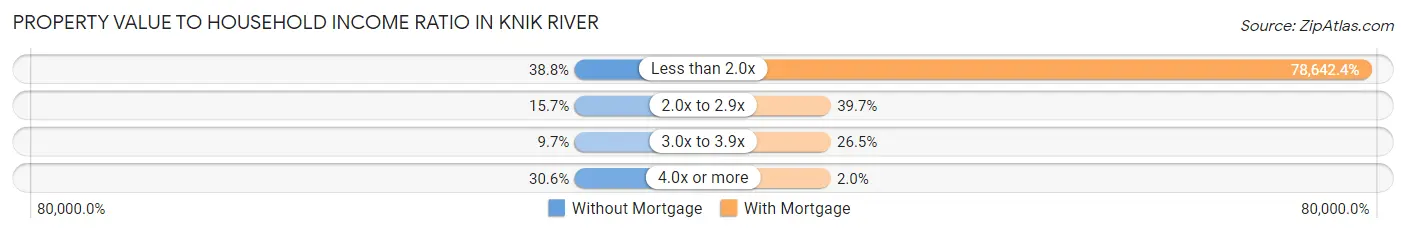
| Value-to-Income Ratio | Without Mortgage | With Mortgage |
| Less than 2.0x | 52 (38.8%) | 118,750 (78,642.4%) |
| 2.0x to 2.9x | 21 (15.7%) | 60 (39.7%) |
| 3.0x to 3.9x | 13 (9.7%) | 40 (26.5%) |
| 4.0x or more | 41 (30.6%) | 3 (2.0%) |
| Total | 134 (100.0%) | 151 (100.0%) |
Real Estate Taxes by Mortgage Status in Knik River
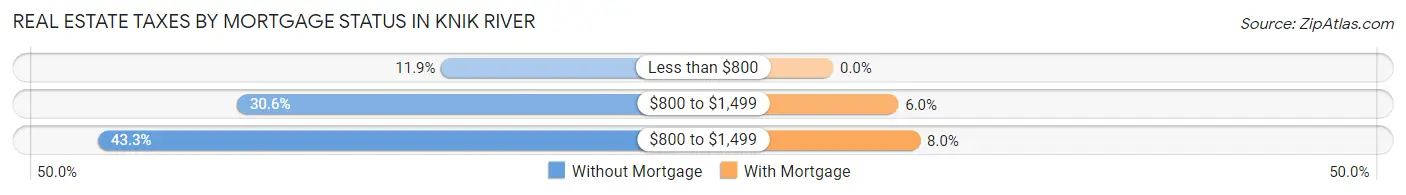
| Property Taxes | Without Mortgage | With Mortgage |
| Less than $800 | 16 (11.9%) | 0 (0.0%) |
| $800 to $1,499 | 41 (30.6%) | 9 (6.0%) |
| $800 to $1,499 | 58 (43.3%) | 12 (8.0%) |
| Total | 134 (100.0%) | 151 (100.0%) |
Health & Disability in Knik River
Health Insurance Coverage by Age in Knik River
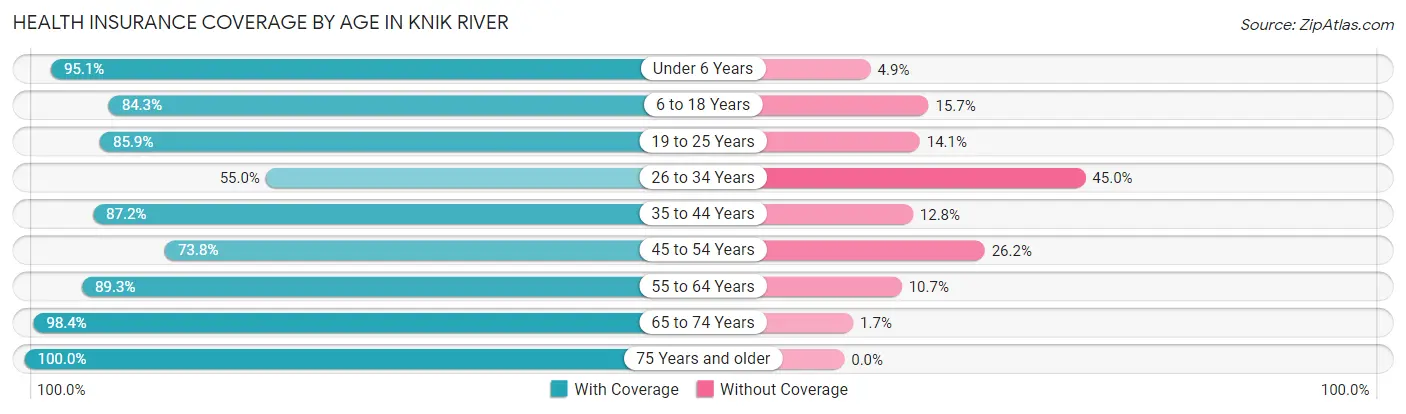
| Age Bracket | With Coverage | Without Coverage |
| Under 6 Years | 58 (95.1%) | 3 (4.9%) |
| 6 to 18 Years | 118 (84.3%) | 22 (15.7%) |
| 19 to 25 Years | 61 (85.9%) | 10 (14.1%) |
| 26 to 34 Years | 71 (55.0%) | 58 (45.0%) |
| 35 to 44 Years | 75 (87.2%) | 11 (12.8%) |
| 45 to 54 Years | 62 (73.8%) | 22 (26.2%) |
| 55 to 64 Years | 100 (89.3%) | 12 (10.7%) |
| 65 to 74 Years | 119 (98.4%) | 2 (1.7%) |
| 75 Years and older | 7 (100.0%) | 0 (0.0%) |
| Total | 671 (82.7%) | 140 (17.3%) |
Health Insurance Coverage by Citizenship Status in Knik River
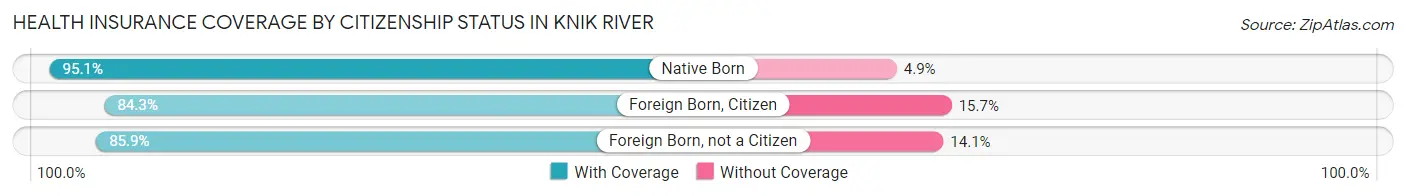
| Citizenship Status | With Coverage | Without Coverage |
| Native Born | 58 (95.1%) | 3 (4.9%) |
| Foreign Born, Citizen | 118 (84.3%) | 22 (15.7%) |
| Foreign Born, not a Citizen | 61 (85.9%) | 10 (14.1%) |
Health Insurance Coverage by Household Income in Knik River
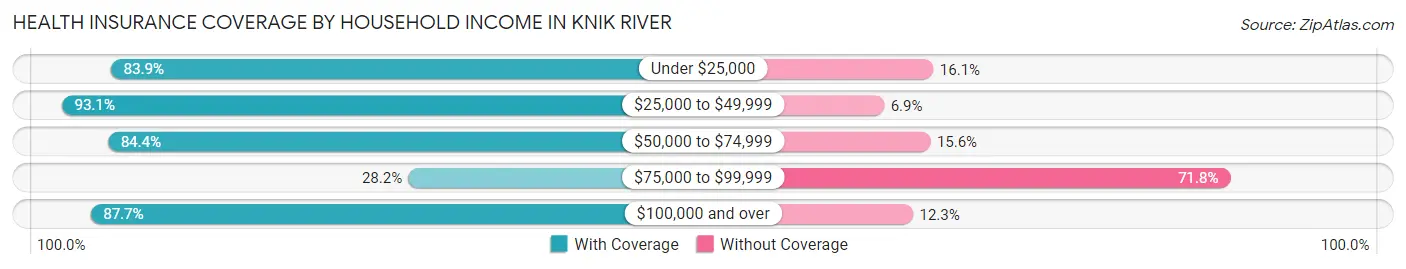
| Household Income | With Coverage | Without Coverage |
| Under $25,000 | 52 (83.9%) | 10 (16.1%) |
| $25,000 to $49,999 | 121 (93.1%) | 9 (6.9%) |
| $50,000 to $74,999 | 65 (84.4%) | 12 (15.6%) |
| $75,000 to $99,999 | 20 (28.2%) | 51 (71.8%) |
| $100,000 and over | 413 (87.7%) | 58 (12.3%) |
Public vs Private Health Insurance Coverage by Age in Knik River
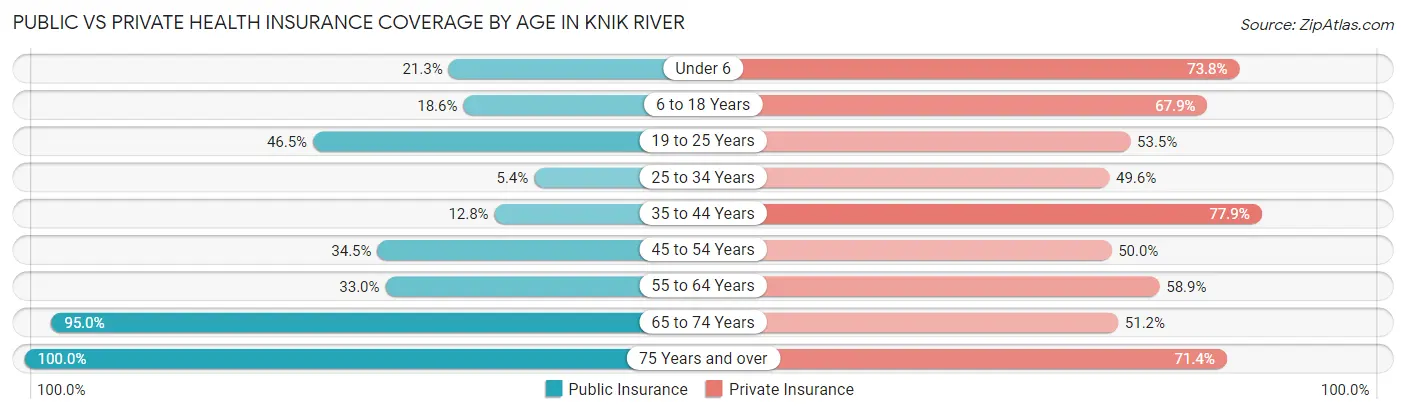
| Age Bracket | Public Insurance | Private Insurance |
| Under 6 | 13 (21.3%) | 45 (73.8%) |
| 6 to 18 Years | 26 (18.6%) | 95 (67.9%) |
| 19 to 25 Years | 33 (46.5%) | 38 (53.5%) |
| 25 to 34 Years | 7 (5.4%) | 64 (49.6%) |
| 35 to 44 Years | 11 (12.8%) | 67 (77.9%) |
| 45 to 54 Years | 29 (34.5%) | 42 (50.0%) |
| 55 to 64 Years | 37 (33.0%) | 66 (58.9%) |
| 65 to 74 Years | 115 (95.0%) | 62 (51.2%) |
| 75 Years and over | 7 (100.0%) | 5 (71.4%) |
| Total | 278 (34.3%) | 484 (59.7%) |
Disability Status by Sex by Age in Knik River
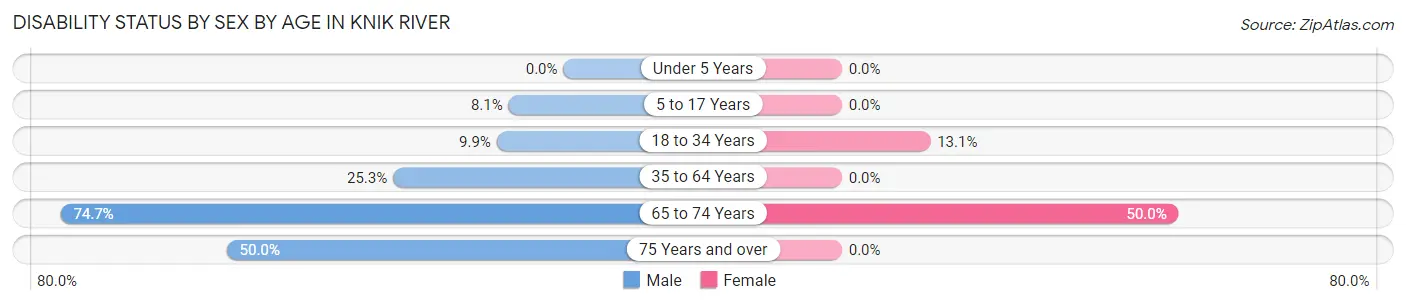
| Age Bracket | Male | Female |
| Under 5 Years | 0 (0.0%) | 0 (0.0%) |
| 5 to 17 Years | 7 (8.1%) | 0 (0.0%) |
| 18 to 34 Years | 10 (9.9%) | 13 (13.1%) |
| 35 to 64 Years | 44 (25.3%) | 0 (0.0%) |
| 65 to 74 Years | 56 (74.7%) | 23 (50.0%) |
| 75 Years and over | 2 (50.0%) | 0 (0.0%) |
Disability Class by Sex by Age in Knik River
Disability Class: Hearing Difficulty
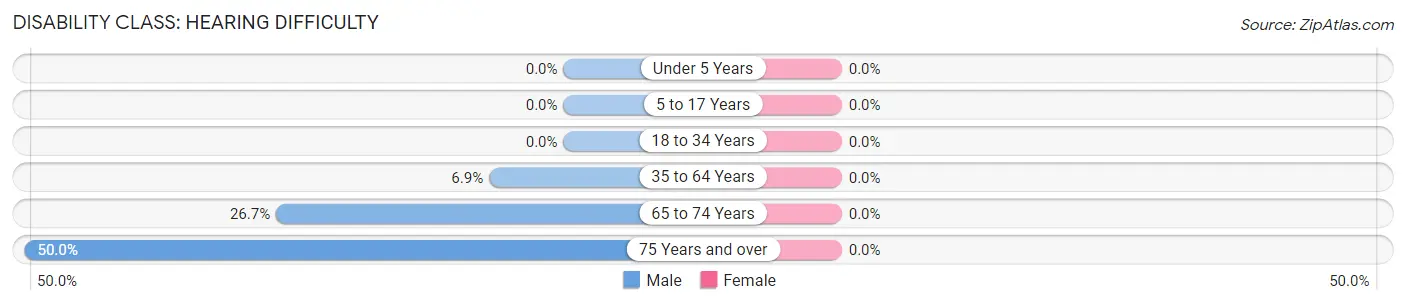
| Age Bracket | Male | Female |
| Under 5 Years | 0 (0.0%) | 0 (0.0%) |
| 5 to 17 Years | 0 (0.0%) | 0 (0.0%) |
| 18 to 34 Years | 0 (0.0%) | 0 (0.0%) |
| 35 to 64 Years | 12 (6.9%) | 0 (0.0%) |
| 65 to 74 Years | 20 (26.7%) | 0 (0.0%) |
| 75 Years and over | 2 (50.0%) | 0 (0.0%) |
Disability Class: Vision Difficulty
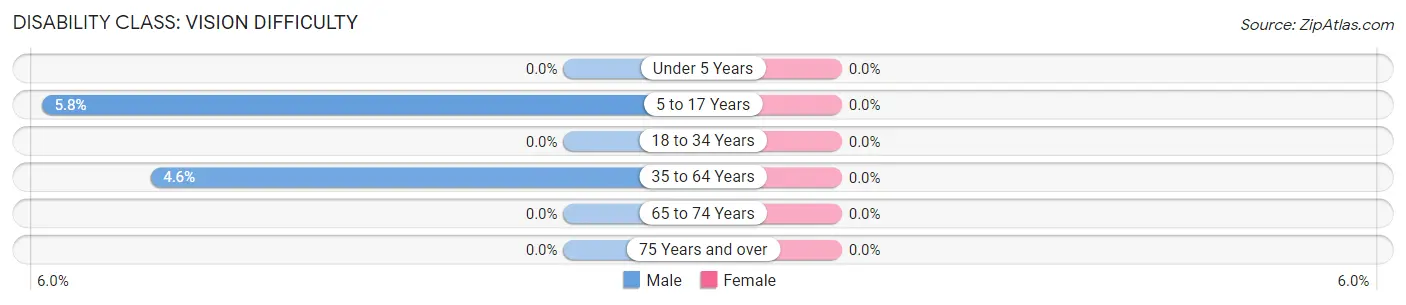
| Age Bracket | Male | Female |
| Under 5 Years | 0 (0.0%) | 0 (0.0%) |
| 5 to 17 Years | 5 (5.8%) | 0 (0.0%) |
| 18 to 34 Years | 0 (0.0%) | 0 (0.0%) |
| 35 to 64 Years | 8 (4.6%) | 0 (0.0%) |
| 65 to 74 Years | 0 (0.0%) | 0 (0.0%) |
| 75 Years and over | 0 (0.0%) | 0 (0.0%) |
Disability Class: Cognitive Difficulty
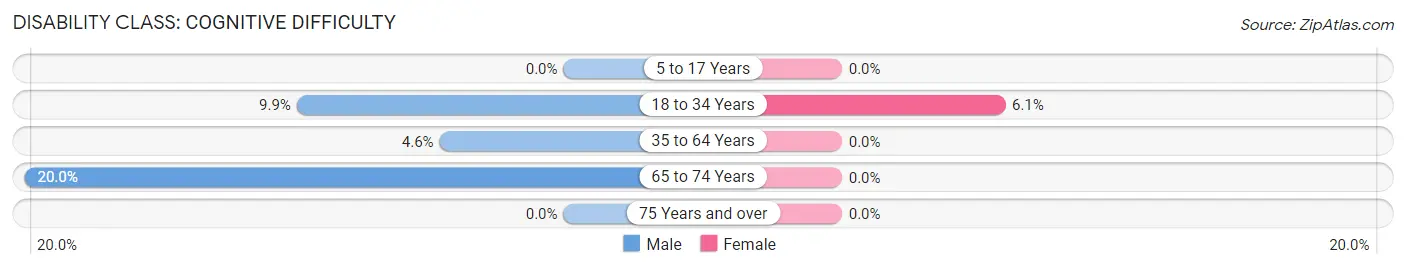
| Age Bracket | Male | Female |
| 5 to 17 Years | 0 (0.0%) | 0 (0.0%) |
| 18 to 34 Years | 10 (9.9%) | 6 (6.1%) |
| 35 to 64 Years | 8 (4.6%) | 0 (0.0%) |
| 65 to 74 Years | 15 (20.0%) | 0 (0.0%) |
| 75 Years and over | 0 (0.0%) | 0 (0.0%) |
Disability Class: Ambulatory Difficulty
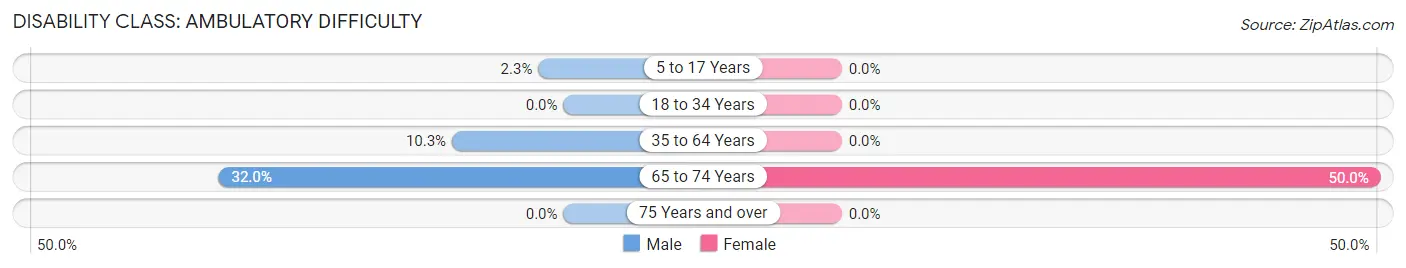
| Age Bracket | Male | Female |
| 5 to 17 Years | 2 (2.3%) | 0 (0.0%) |
| 18 to 34 Years | 0 (0.0%) | 0 (0.0%) |
| 35 to 64 Years | 18 (10.3%) | 0 (0.0%) |
| 65 to 74 Years | 24 (32.0%) | 23 (50.0%) |
| 75 Years and over | 0 (0.0%) | 0 (0.0%) |
Disability Class: Self-Care Difficulty
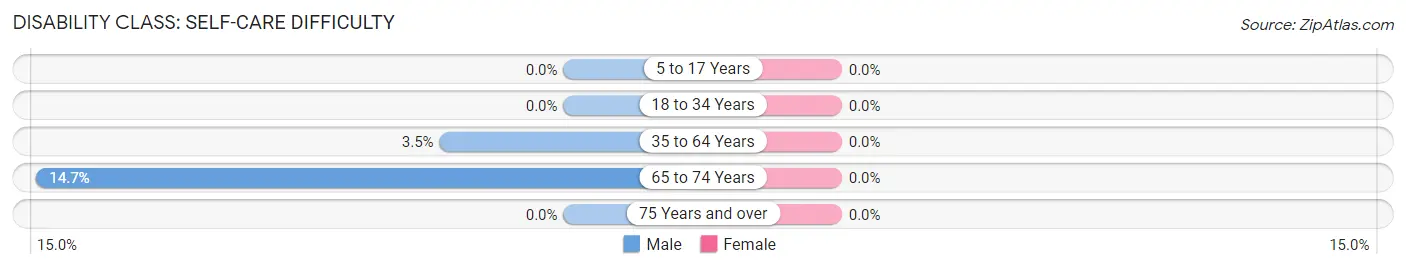
| Age Bracket | Male | Female |
| 5 to 17 Years | 0 (0.0%) | 0 (0.0%) |
| 18 to 34 Years | 0 (0.0%) | 0 (0.0%) |
| 35 to 64 Years | 6 (3.5%) | 0 (0.0%) |
| 65 to 74 Years | 11 (14.7%) | 0 (0.0%) |
| 75 Years and over | 0 (0.0%) | 0 (0.0%) |
Technology Access in Knik River
Computing Device Access in Knik River
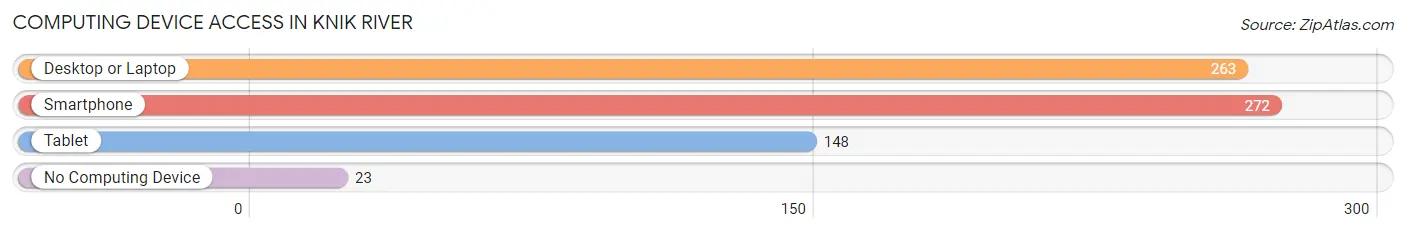
| Device Type | # Households | % Households |
| Desktop or Laptop | 263 | 83.2% |
| Smartphone | 272 | 86.1% |
| Tablet | 148 | 46.8% |
| No Computing Device | 23 | 7.3% |
| Total | 316 | 100.0% |
Internet Access in Knik River
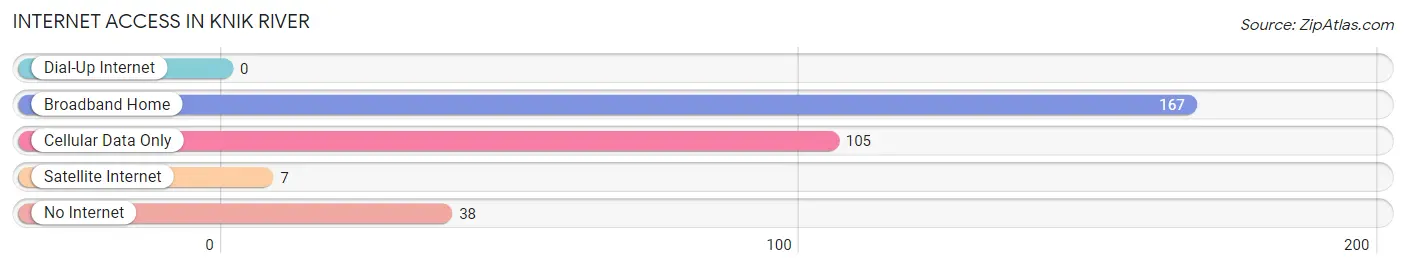
| Internet Type | # Households | % Households |
| Dial-Up Internet | 0 | 0.0% |
| Broadband Home | 167 | 52.8% |
| Cellular Data Only | 105 | 33.2% |
| Satellite Internet | 7 | 2.2% |
| No Internet | 38 | 12.0% |
| Total | 316 | 100.0% |
Knik River Summary
Knik River is a small community located in the Matanuska-Susitna Borough of Alaska. It is situated on the banks of the Knik River, approximately 25 miles northeast of Anchorage. The community is home to approximately 1,000 people, and is a popular destination for outdoor recreation and fishing.
Geography
Knik River is located in the Matanuska-Susitna Borough of Alaska, approximately 25 miles northeast of Anchorage. The community is situated on the banks of the Knik River, which is a tributary of the Susitna River. The Knik River is approximately 40 miles long and is a popular destination for fishing and other outdoor activities. The area is surrounded by mountains, including the Talkeetna Mountains to the north and the Chugach Mountains to the south. The climate in the area is generally mild, with temperatures ranging from the mid-30s in the winter to the mid-60s in the summer.
History
Knik River was first settled by the Dena’ina Athabascan people, who lived in the area for thousands of years before the arrival of European settlers. The first European settlers arrived in the area in the late 1800s, and the community was officially established in the early 1900s. The community was named after the Knik River, which was named after the Dena’ina word for “river”.
In the early 1900s, the community was a popular destination for gold prospectors, and the area was home to several gold mines. The gold rush eventually ended, and the community shifted to a more agricultural-based economy. The community was also home to several sawmills, which provided lumber for the construction of homes and other buildings.
Economy
Knik River’s economy is largely based on tourism and outdoor recreation. The community is a popular destination for fishing, hunting, and other outdoor activities. The area is also home to several small businesses, including restaurants, stores, and lodges. The community is also home to several small farms, which produce a variety of vegetables and fruits.
Demographics
As of the 2010 census, the population of Knik River was 1,000 people. The racial makeup of the community was 95.2% White, 0.7% Native American, 0.7% Asian, 0.3% Pacific Islander, 0.3% from other races, and 2.1% from two or more races. The median household income in the community was $50,000, and the median age was 37.
Conclusion
Knik River is a small community located in the Matanuska-Susitna Borough of Alaska. It is situated on the banks of the Knik River, and is a popular destination for outdoor recreation and fishing. The community was first settled by the Dena’ina Athabascan people, and was later home to several gold mines and sawmills. Today, the economy of Knik River is largely based on tourism and outdoor recreation, and the community is home to several small businesses and farms. The population of Knik River is approximately 1,000 people, and the median household income is $50,000.
Common Questions
What is Per Capita Income in Knik River?
Per Capita income in Knik River is $38,180.
What is the Median Family Income in Knik River?
Median Family Income in Knik River is $118,333.
What is the Median Household income in Knik River?
Median Household Income in Knik River is $75,000.
What is Income or Wage Gap in Knik River?
Income or Wage Gap in Knik River is 17.7%.
Women in Knik River earn 82.3 cents for every dollar earned by a man.
What is Inequality or Gini Index in Knik River?
Inequality or Gini Index in Knik River is 0.42.
What is the Total Population of Knik River?
Total Population of Knik River is 822.
What is the Total Male Population of Knik River?
Total Male Population of Knik River is 485.
What is the Total Female Population of Knik River?
Total Female Population of Knik River is 337.
What is the Ratio of Males per 100 Females in Knik River?
There are 143.92 Males per 100 Females in Knik River.
What is the Ratio of Females per 100 Males in Knik River?
There are 69.48 Females per 100 Males in Knik River.
What is the Median Population Age in Knik River?
Median Population Age in Knik River is 35.0 Years.
What is the Average Family Size in Knik River
Average Family Size in Knik River is 3.1 People.
What is the Average Household Size in Knik River
Average Household Size in Knik River is 2.6 People.
How Large is the Labor Force in Knik River?
There are 436 People in the Labor Forcein in Knik River.
What is the Percentage of People in the Labor Force in Knik River?
68.4% of People are in the Labor Force in Knik River.
What is the Unemployment Rate in Knik River?
Unemployment Rate in Knik River is 2.4%.