South Van Horn, AK Map & Demographics
South Van Horn Map
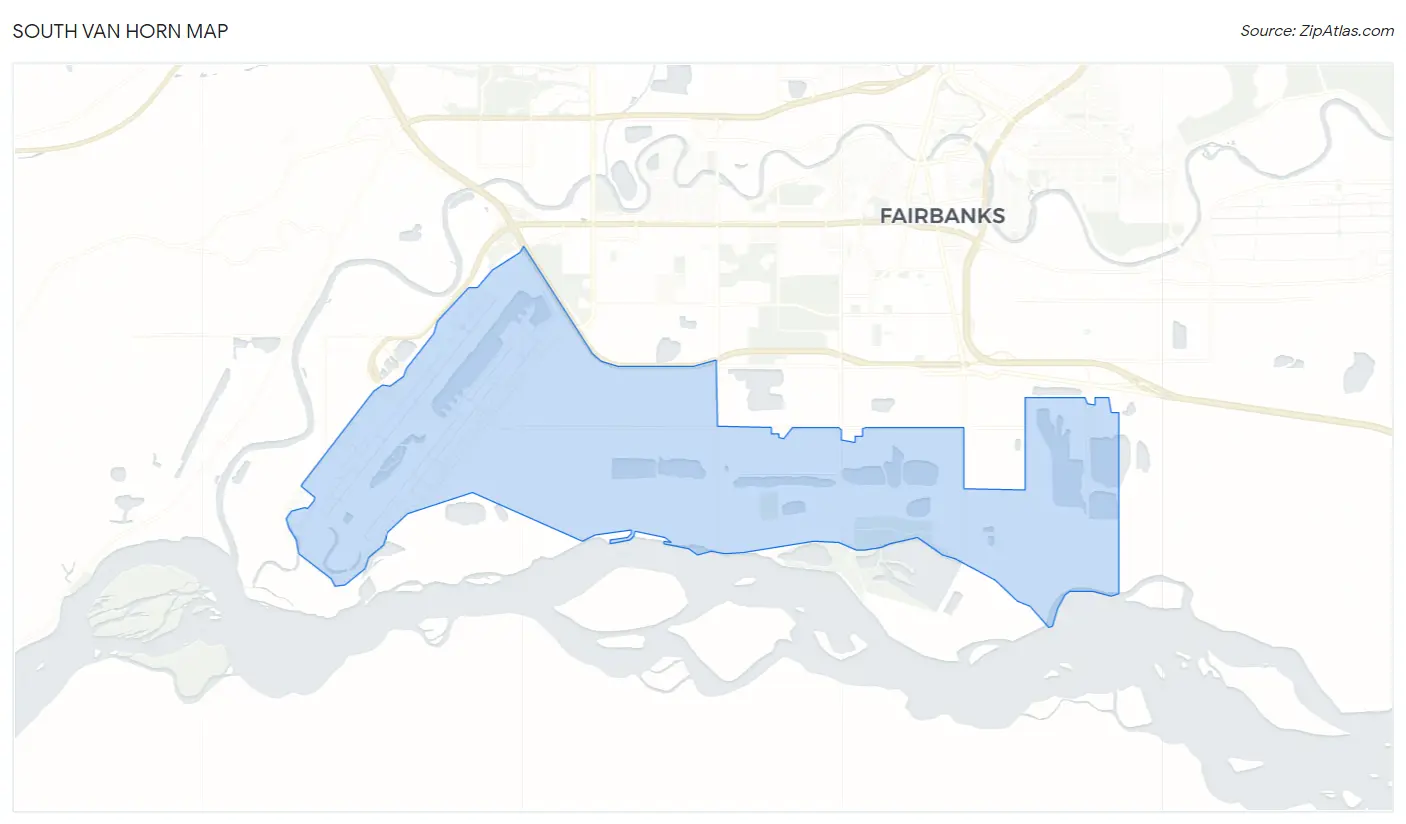
South Van Horn Overview
$39,560
PER CAPITA INCOME
$64,757
AVG HOUSEHOLD INCOME
65.3%
WAGE / INCOME GAP [ % ]
34.7¢/ $1
WAGE / INCOME GAP [ $ ]
0.34
INEQUALITY / GINI INDEX
478
TOTAL POPULATION
260
MALE POPULATION
218
FEMALE POPULATION
119.27
MALES / 100 FEMALES
83.85
FEMALES / 100 MALES
37.7
MEDIAN AGE
3.5
AVG FAMILY SIZE
2.7
AVG HOUSEHOLD SIZE
221
LABOR FORCE [ PEOPLE ]
66.0%
PERCENT IN LABOR FORCE
5.9%
UNEMPLOYMENT RATE
Income in South Van Horn
Income Overview in South Van Horn
| Characteristic | Number | Measure |
| Per Capita Income | 478 | $39,560 |
| Median Family Income | 115 | $0 |
| Mean Family Income | 115 | $116,349 |
| Median Household Income | 173 | $64,757 |
| Mean Household Income | 173 | $95,882 |
| Income Deficit | 115 | $0 |
| Wage / Income Gap (%) | 478 | 65.34% |
| Wage / Income Gap ($) | 478 | 34.66¢ per $1 |
| Gini / Inequality Index | 478 | 0.34 |
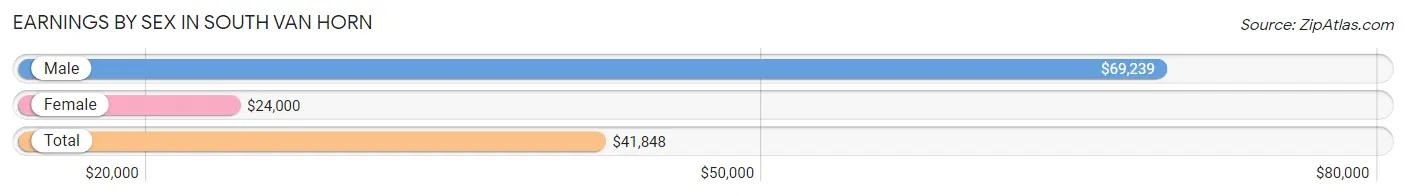
Earnings by Sex in South Van Horn
Average Earnings in South Van Horn are $41,848, $69,239 for men and $24,000 for women, a difference of 65.3%.
| Sex | Number | Average Earnings |
| Male | 152 (58.5%) | $69,239 |
| Female | 108 (41.5%) | $24,000 |
| Total | 260 (100.0%) | $41,848 |
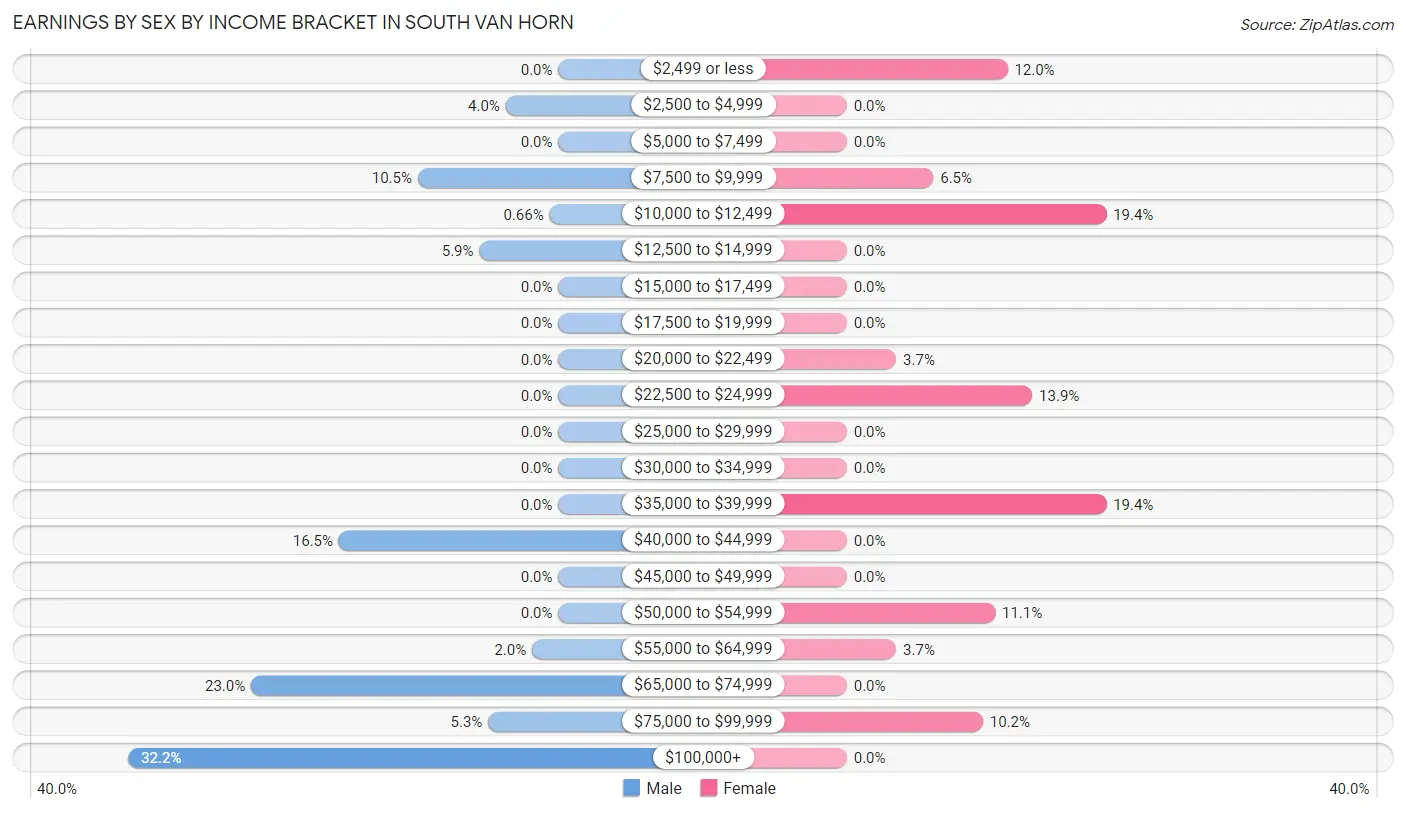
Earnings by Sex by Income Bracket in South Van Horn
The most common earnings brackets in South Van Horn are $100,000+ for men (49 | 32.2%) and $10,000 to $12,499 for women (21 | 19.4%).
| Income | Male | Female |
| $2,499 or less | 0 (0.0%) | 13 (12.0%) |
| $2,500 to $4,999 | 6 (4.0%) | 0 (0.0%) |
| $5,000 to $7,499 | 0 (0.0%) | 0 (0.0%) |
| $7,500 to $9,999 | 16 (10.5%) | 7 (6.5%) |
| $10,000 to $12,499 | 1 (0.7%) | 21 (19.4%) |
| $12,500 to $14,999 | 9 (5.9%) | 0 (0.0%) |
| $15,000 to $17,499 | 0 (0.0%) | 0 (0.0%) |
| $17,500 to $19,999 | 0 (0.0%) | 0 (0.0%) |
| $20,000 to $22,499 | 0 (0.0%) | 4 (3.7%) |
| $22,500 to $24,999 | 0 (0.0%) | 15 (13.9%) |
| $25,000 to $29,999 | 0 (0.0%) | 0 (0.0%) |
| $30,000 to $34,999 | 0 (0.0%) | 0 (0.0%) |
| $35,000 to $39,999 | 0 (0.0%) | 21 (19.4%) |
| $40,000 to $44,999 | 25 (16.5%) | 0 (0.0%) |
| $45,000 to $49,999 | 0 (0.0%) | 0 (0.0%) |
| $50,000 to $54,999 | 0 (0.0%) | 12 (11.1%) |
| $55,000 to $64,999 | 3 (2.0%) | 4 (3.7%) |
| $65,000 to $74,999 | 35 (23.0%) | 0 (0.0%) |
| $75,000 to $99,999 | 8 (5.3%) | 11 (10.2%) |
| $100,000+ | 49 (32.2%) | 0 (0.0%) |
| Total | 152 (100.0%) | 108 (100.0%) |
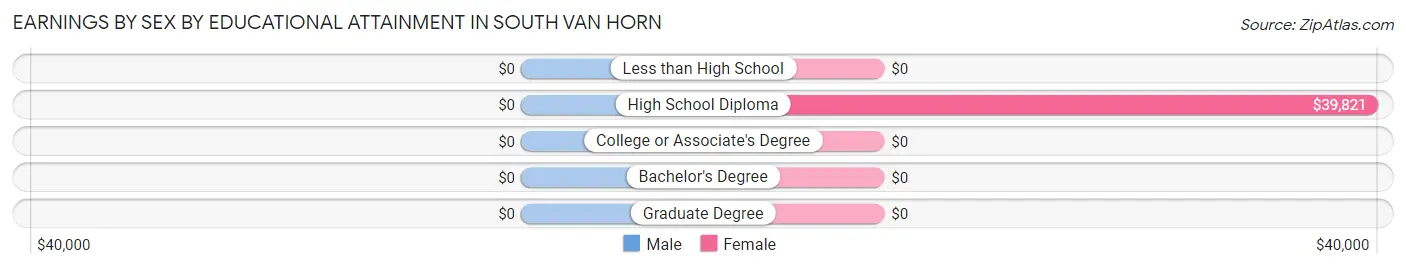
Earnings by Sex by Educational Attainment in South Van Horn
| Educational Attainment | Male Income | Female Income |
| Less than High School | - | - |
| High School Diploma | - | - |
| College or Associate's Degree | - | - |
| Bachelor's Degree | - | - |
| Graduate Degree | - | - |
| Total | $69,783 | $24,000 |
Family Income in South Van Horn
Family Income Brackets in South Van Horn
According to the South Van Horn family income data, there are 41 families falling into the $50,000 to $74,999 income range, which is the most common income bracket and makes up 35.6% of all families.
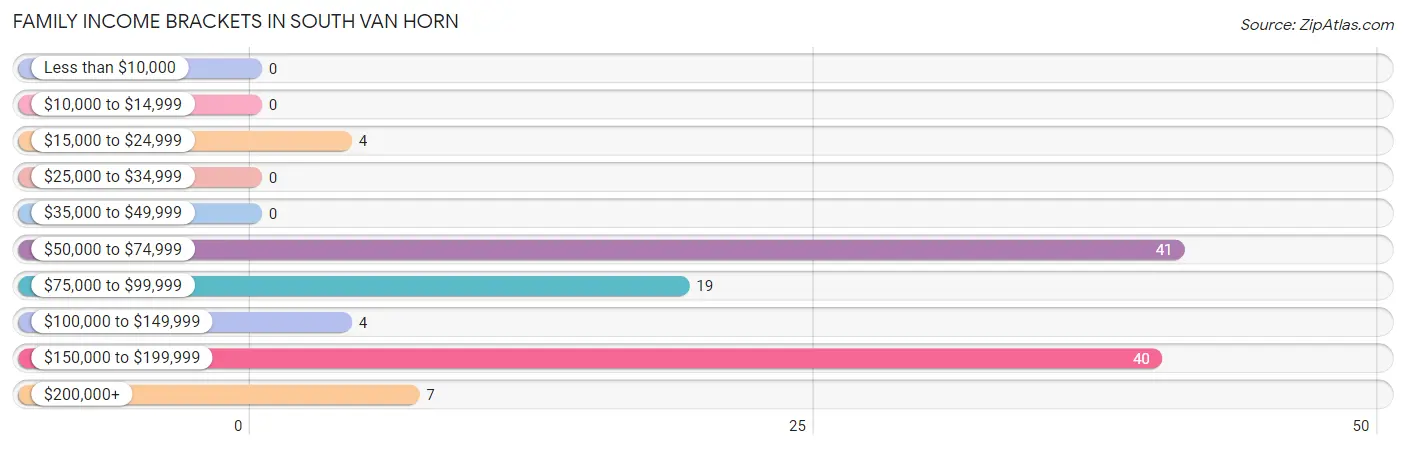
| Income Bracket | # Families | % Families |
| Less than $10,000 | 0 | 0.0% |
| $10,000 to $14,999 | 0 | 0.0% |
| $15,000 to $24,999 | 4 | 3.5% |
| $25,000 to $34,999 | 0 | 0.0% |
| $35,000 to $49,999 | 0 | 0.0% |
| $50,000 to $74,999 | 41 | 35.7% |
| $75,000 to $99,999 | 19 | 16.5% |
| $100,000 to $149,999 | 4 | 3.5% |
| $150,000 to $199,999 | 40 | 34.8% |
| $200,000+ | 7 | 6.1% |
Family Income by Famaliy Size in South Van Horn
4-person families (46 | 40.0%) account for the highest median family income in South Van Horn with $163,333 per family, while 4-person families (46 | 40.0%) have the highest median income of $40,833 per family member.
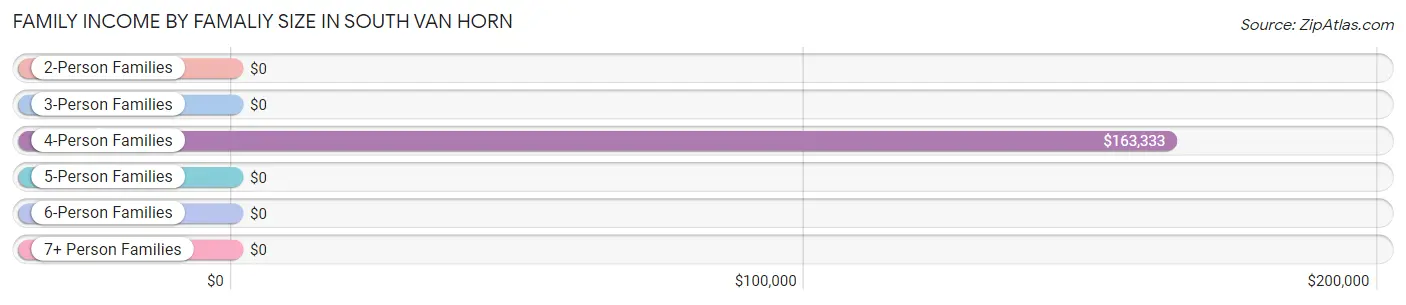
| Income Bracket | # Families | Median Income |
| 2-Person Families | 51 (44.4%) | $0 |
| 3-Person Families | 0 (0.0%) | $0 |
| 4-Person Families | 46 (40.0%) | $163,333 |
| 5-Person Families | 11 (9.6%) | $0 |
| 6-Person Families | 0 (0.0%) | $0 |
| 7+ Person Families | 7 (6.1%) | $0 |
| Total | 115 (100.0%) | $0 |
Family Income by Number of Earners in South Van Horn
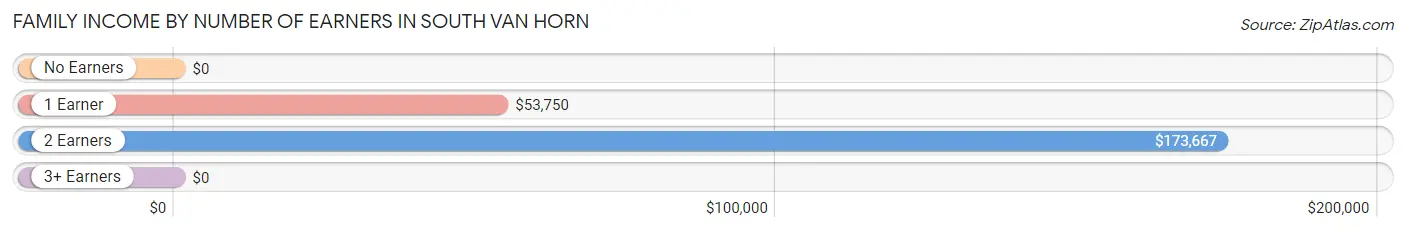
| Number of Earners | # Families | Median Income |
| No Earners | 21 (18.3%) | $0 |
| 1 Earner | 19 (16.5%) | $53,750 |
| 2 Earners | 56 (48.7%) | $173,667 |
| 3+ Earners | 19 (16.5%) | $0 |
| Total | 115 (100.0%) | $0 |
Household Income in South Van Horn
Household Income Brackets in South Van Horn
With 77 households falling in the category, the $50,000 to $74,999 income range is the most frequent in South Van Horn, accounting for 44.5% of all households.
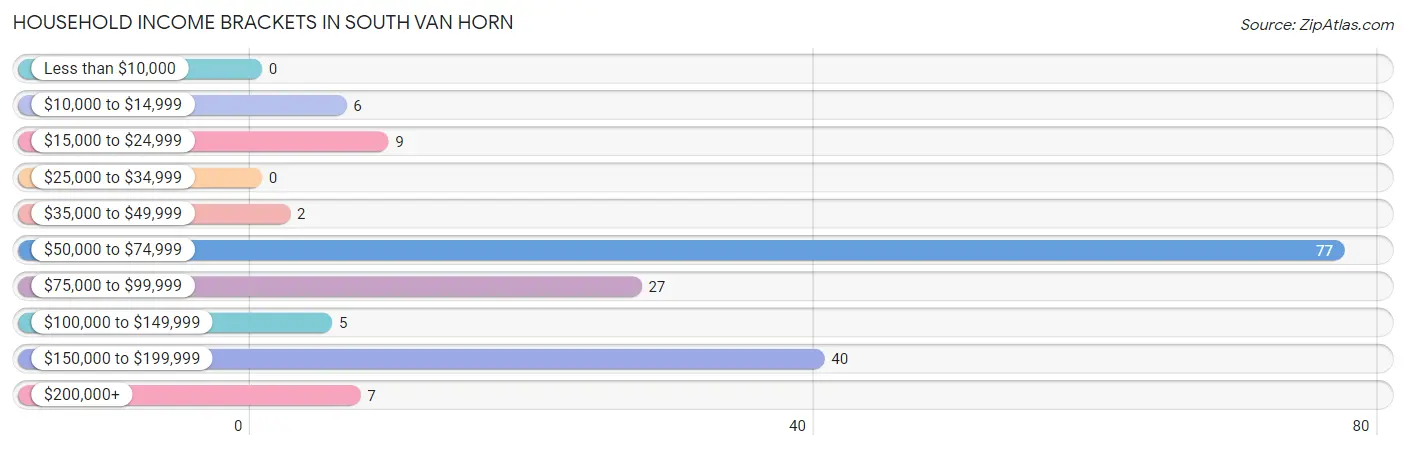
| Income Bracket | # Households | % Households |
| Less than $10,000 | 0 | 0.0% |
| $10,000 to $14,999 | 6 | 3.5% |
| $15,000 to $24,999 | 9 | 5.2% |
| $25,000 to $34,999 | 0 | 0.0% |
| $35,000 to $49,999 | 2 | 1.2% |
| $50,000 to $74,999 | 77 | 44.5% |
| $75,000 to $99,999 | 27 | 15.6% |
| $100,000 to $149,999 | 5 | 2.9% |
| $150,000 to $199,999 | 40 | 23.1% |
| $200,000+ | 7 | 4.0% |
Household Income by Householder Age in South Van Horn
The median household income in South Van Horn is $64,757, with the highest median household income of $86,645 found in the 25 to 44 years age bracket for the primary householder. A total of 59 households (34.1%) fall into this category.
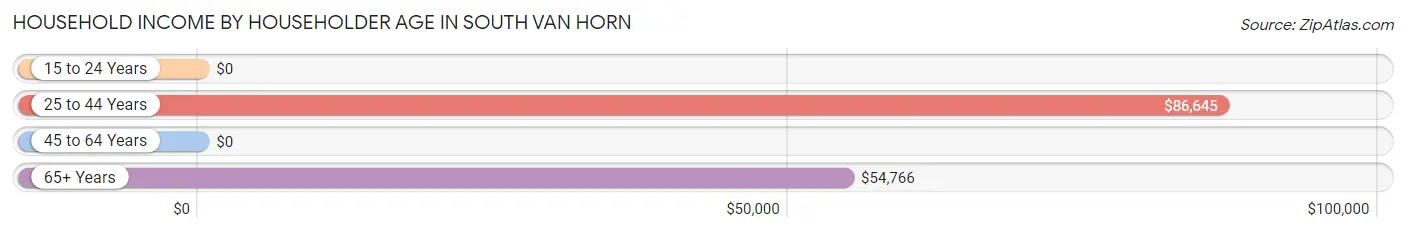
| Income Bracket | # Households | Median Income |
| 15 to 24 Years | 0 (0.0%) | $0 |
| 25 to 44 Years | 59 (34.1%) | $86,645 |
| 45 to 64 Years | 65 (37.6%) | $0 |
| 65+ Years | 49 (28.3%) | $54,766 |
| Total | 173 (100.0%) | $64,757 |
Poverty in South Van Horn
Income Below Poverty by Sex and Age in South Van Horn
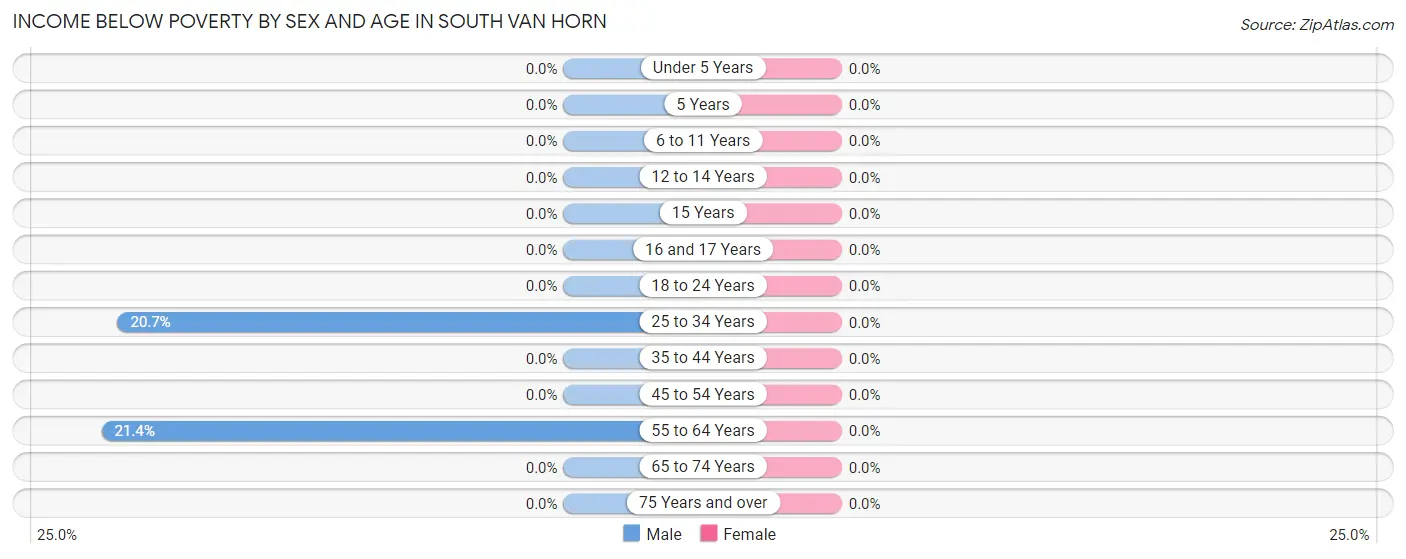
| Age Bracket | Male | Female |
| Under 5 Years | 0 (0.0%) | 0 (0.0%) |
| 5 Years | 0 (0.0%) | 0 (0.0%) |
| 6 to 11 Years | 0 (0.0%) | 0 (0.0%) |
| 12 to 14 Years | 0 (0.0%) | 0 (0.0%) |
| 15 Years | 0 (0.0%) | 0 (0.0%) |
| 16 and 17 Years | 0 (0.0%) | 0 (0.0%) |
| 18 to 24 Years | 0 (0.0%) | 0 (0.0%) |
| 25 to 34 Years | 6 (20.7%) | 0 (0.0%) |
| 35 to 44 Years | 0 (0.0%) | 0 (0.0%) |
| 45 to 54 Years | 0 (0.0%) | 0 (0.0%) |
| 55 to 64 Years | 6 (21.4%) | 0 (0.0%) |
| 65 to 74 Years | 0 (0.0%) | 0 (0.0%) |
| 75 Years and over | 0 (0.0%) | 0 (0.0%) |
| Total | 12 (4.6%) | 0 (0.0%) |
Income Above Poverty by Sex and Age in South Van Horn
According to the poverty statistics in South Van Horn, males aged 5 years and females aged under 5 years are the age groups that are most secure financially, with 100.0% of males and 100.0% of females in these age groups living above the poverty line.
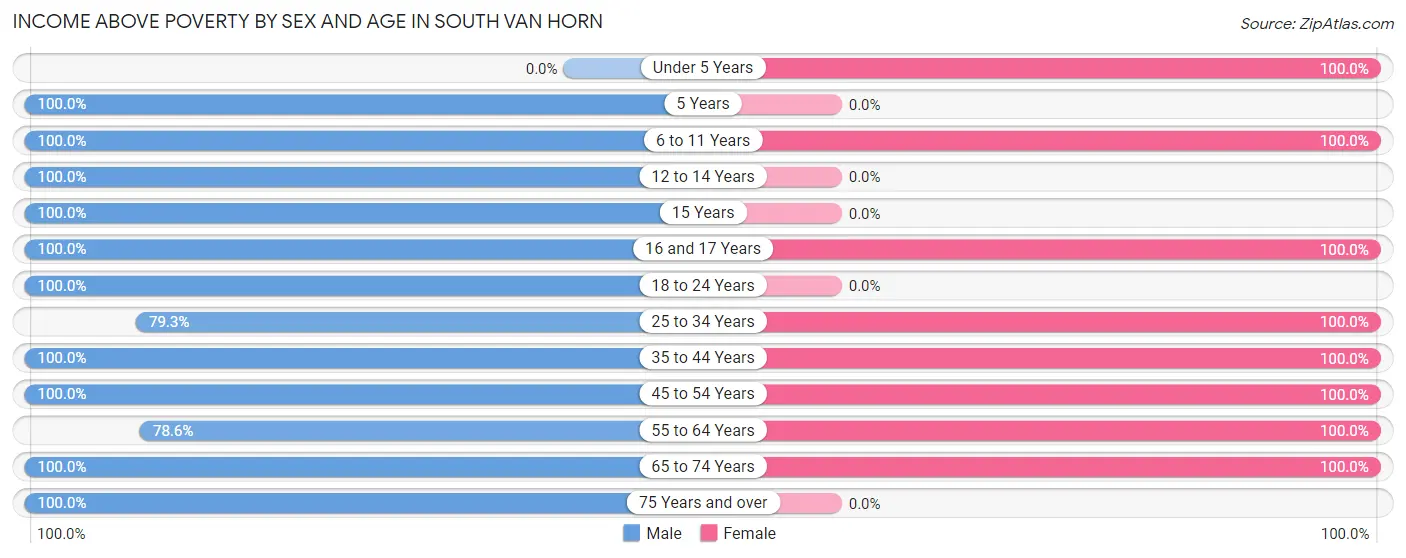
| Age Bracket | Male | Female |
| Under 5 Years | 0 (0.0%) | 12 (100.0%) |
| 5 Years | 16 (100.0%) | 0 (0.0%) |
| 6 to 11 Years | 17 (100.0%) | 55 (100.0%) |
| 12 to 14 Years | 30 (100.0%) | 0 (0.0%) |
| 15 Years | 13 (100.0%) | 0 (0.0%) |
| 16 and 17 Years | 10 (100.0%) | 3 (100.0%) |
| 18 to 24 Years | 8 (100.0%) | 0 (0.0%) |
| 25 to 34 Years | 23 (79.3%) | 11 (100.0%) |
| 35 to 44 Years | 30 (100.0%) | 78 (100.0%) |
| 45 to 54 Years | 36 (100.0%) | 17 (100.0%) |
| 55 to 64 Years | 22 (78.6%) | 1 (100.0%) |
| 65 to 74 Years | 29 (100.0%) | 41 (100.0%) |
| 75 Years and over | 14 (100.0%) | 0 (0.0%) |
| Total | 248 (95.4%) | 218 (100.0%) |
Income Below Poverty Among Married-Couple Families in South Van Horn
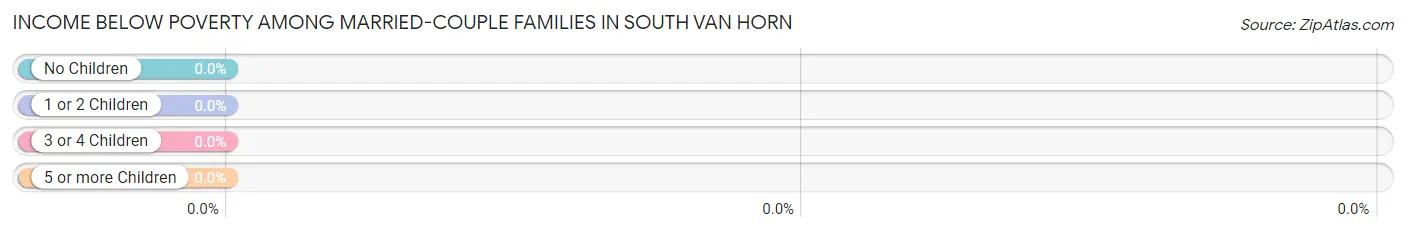
| Children | Above Poverty | Below Poverty |
| No Children | 62 (100.0%) | 0 (0.0%) |
| 1 or 2 Children | 31 (100.0%) | 0 (0.0%) |
| 3 or 4 Children | 0 (0.0%) | 0 (0.0%) |
| 5 or more Children | 7 (100.0%) | 0 (0.0%) |
| Total | 100 (100.0%) | 0 (0.0%) |
Income Below Poverty Among Single-Parent Households in South Van Horn
| Children | Single Father | Single Mother |
| No Children | 0 (0.0%) | 0 (0.0%) |
| 1 or 2 Children | 0 (0.0%) | 0 (0.0%) |
| 3 or 4 Children | 0 (0.0%) | 0 (0.0%) |
| 5 or more Children | 0 (0.0%) | 0 (0.0%) |
| Total | 0 (0.0%) | 0 (0.0%) |
Income Below Poverty Among Married-Couple vs Single-Parent Households in South Van Horn
| Children | Married-Couple Families | Single-Parent Households |
| No Children | 0 (0.0%) | 0 (0.0%) |
| 1 or 2 Children | 0 (0.0%) | 0 (0.0%) |
| 3 or 4 Children | 0 (0.0%) | 0 (0.0%) |
| 5 or more Children | 0 (0.0%) | 0 (0.0%) |
| Total | 0 (0.0%) | 0 (0.0%) |
Race in South Van Horn
The most populous races in South Van Horn are White / Caucasian (381 | 79.7%), Native / Alaskan (39 | 8.2%), and Some other Race (30 | 6.3%).
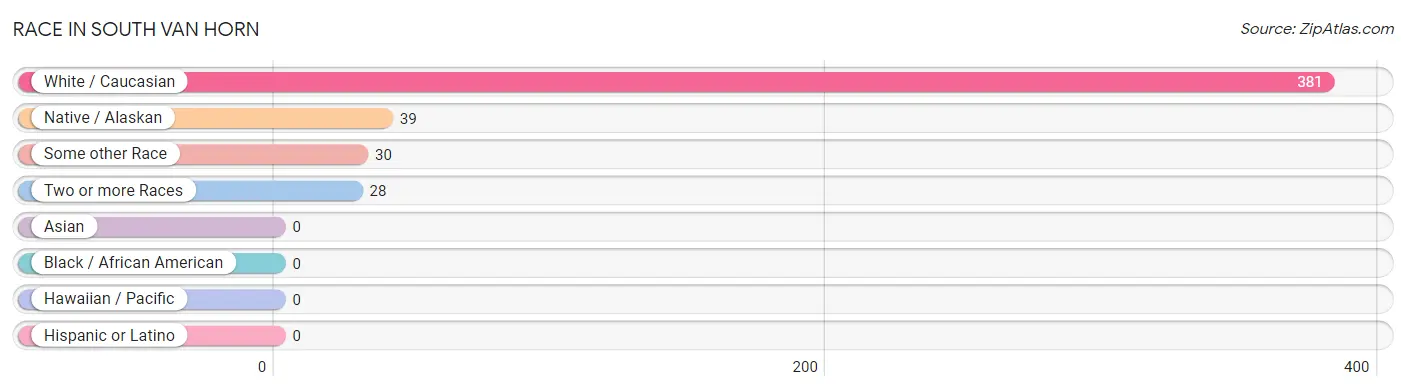
| Race | # Population | % Population |
| Asian | 0 | 0.0% |
| Black / African American | 0 | 0.0% |
| Hawaiian / Pacific | 0 | 0.0% |
| Hispanic or Latino | 0 | 0.0% |
| Native / Alaskan | 39 | 8.2% |
| White / Caucasian | 381 | 79.7% |
| Two or more Races | 28 | 5.9% |
| Some other Race | 30 | 6.3% |
| Total | 478 | 100.0% |
Ancestry in South Van Horn
The most populous ancestries reported in South Van Horn are English (111 | 23.2%), Norwegian (71 | 14.8%), Irish (66 | 13.8%), German (62 | 13.0%), and Italian (56 | 11.7%), together accounting for 76.6% of all South Van Horn residents.
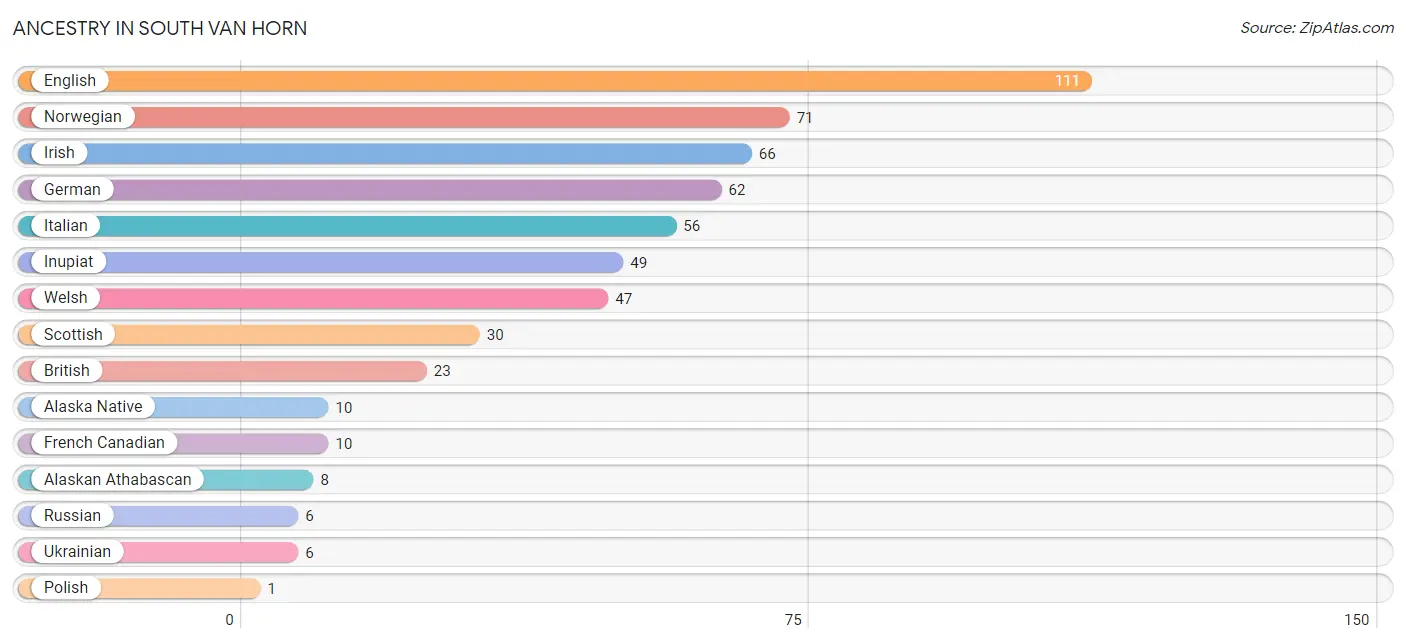
| Ancestry | # Population | % Population |
| Alaska Native | 10 | 2.1% |
| Alaskan Athabascan | 8 | 1.7% |
| British | 23 | 4.8% |
| English | 111 | 23.2% |
| French Canadian | 10 | 2.1% |
| German | 62 | 13.0% |
| Inupiat | 49 | 10.2% |
| Irish | 66 | 13.8% |
| Italian | 56 | 11.7% |
| Norwegian | 71 | 14.8% |
| Polish | 1 | 0.2% |
| Russian | 6 | 1.3% |
| Scottish | 30 | 6.3% |
| Ukrainian | 6 | 1.3% |
| Welsh | 47 | 9.8% | View All 15 Rows |
Immigrants in South Van Horn

| Immigration Origin | # Population | % Population | View All 0 Rows |
Sex and Age in South Van Horn
Sex and Age in South Van Horn
The most populous age groups in South Van Horn are 5 to 9 Years (33 | 12.7%) for men and 35 to 39 Years (45 | 20.6%) for women.
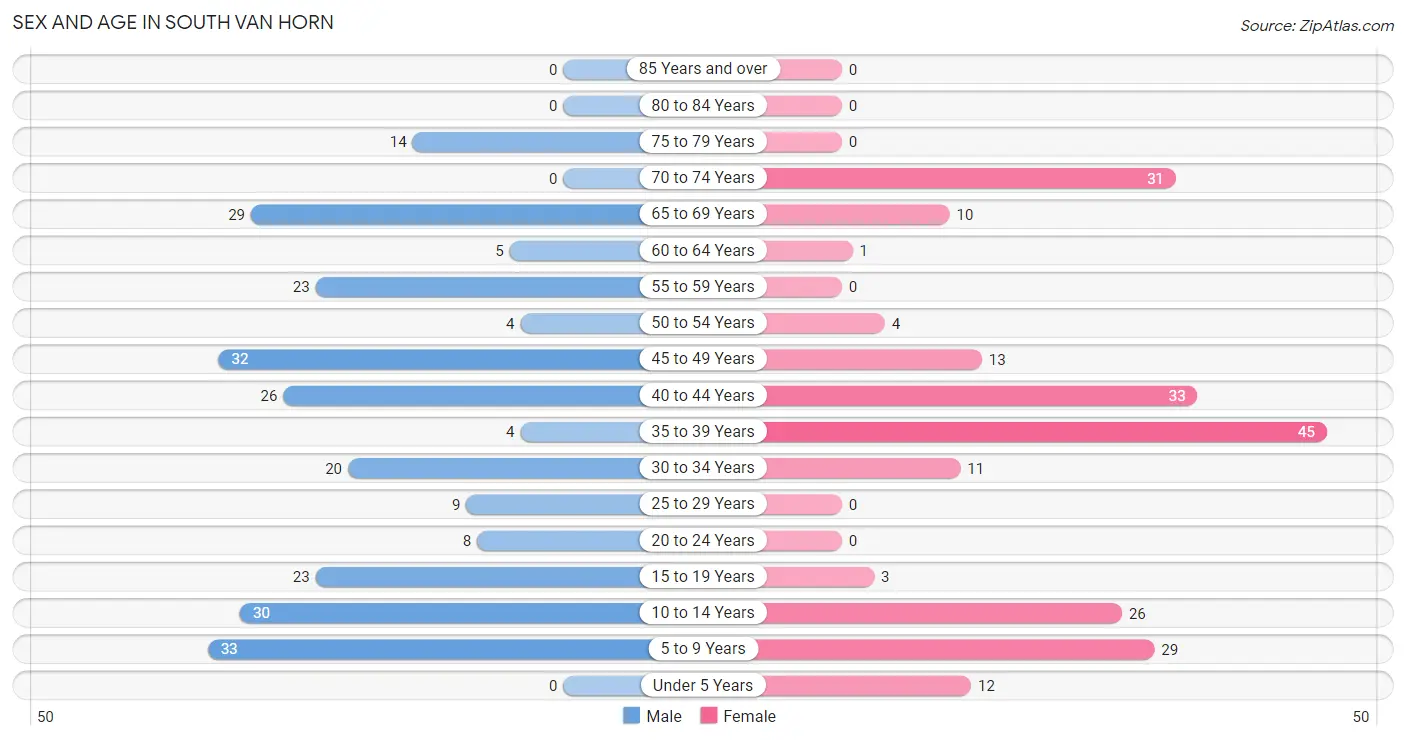
| Age Bracket | Male | Female |
| Under 5 Years | 0 (0.0%) | 12 (5.5%) |
| 5 to 9 Years | 33 (12.7%) | 29 (13.3%) |
| 10 to 14 Years | 30 (11.5%) | 26 (11.9%) |
| 15 to 19 Years | 23 (8.8%) | 3 (1.4%) |
| 20 to 24 Years | 8 (3.1%) | 0 (0.0%) |
| 25 to 29 Years | 9 (3.5%) | 0 (0.0%) |
| 30 to 34 Years | 20 (7.7%) | 11 (5.1%) |
| 35 to 39 Years | 4 (1.5%) | 45 (20.6%) |
| 40 to 44 Years | 26 (10.0%) | 33 (15.1%) |
| 45 to 49 Years | 32 (12.3%) | 13 (6.0%) |
| 50 to 54 Years | 4 (1.5%) | 4 (1.8%) |
| 55 to 59 Years | 23 (8.8%) | 0 (0.0%) |
| 60 to 64 Years | 5 (1.9%) | 1 (0.5%) |
| 65 to 69 Years | 29 (11.2%) | 10 (4.6%) |
| 70 to 74 Years | 0 (0.0%) | 31 (14.2%) |
| 75 to 79 Years | 14 (5.4%) | 0 (0.0%) |
| 80 to 84 Years | 0 (0.0%) | 0 (0.0%) |
| 85 Years and over | 0 (0.0%) | 0 (0.0%) |
| Total | 260 (100.0%) | 218 (100.0%) |
Families and Households in South Van Horn
Median Family Size in South Van Horn
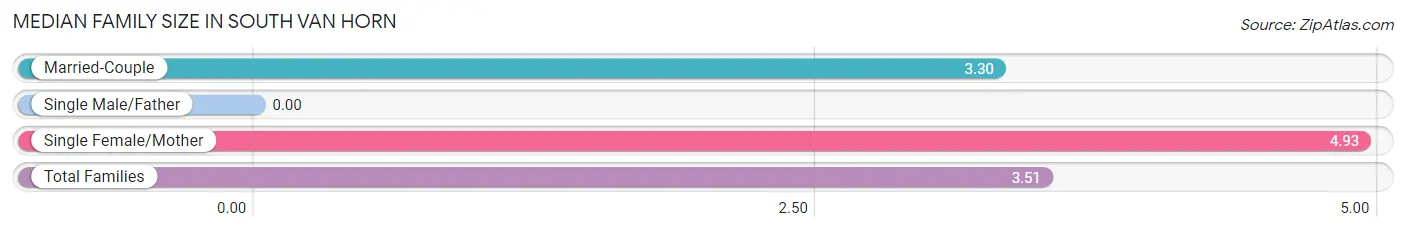
| Family Type | # Families | Family Size |
| Married-Couple | 100 (87.0%) | 3.30 |
| Single Male/Father | 0 (0.0%) | - |
| Single Female/Mother | 15 (13.0%) | 4.93 |
| Total Families | 115 (100.0%) | 3.51 |
Median Household Size in South Van Horn
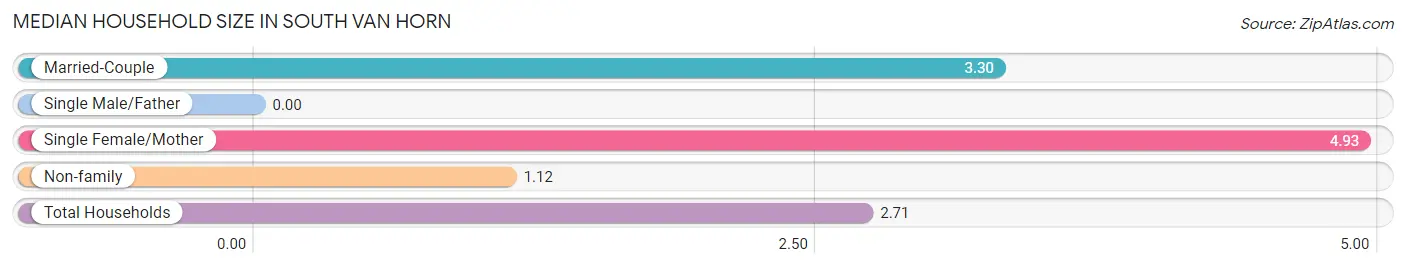
| Household Type | # Households | Household Size |
| Married-Couple | 100 (57.8%) | 3.30 |
| Single Male/Father | 0 (0.0%) | - |
| Single Female/Mother | 15 (8.7%) | 4.93 |
| Non-family | 58 (33.5%) | 1.12 |
| Total Households | 173 (100.0%) | 2.71 |
Household Size by Marriage Status in South Van Horn
Out of a total of 173 households in South Van Horn, 115 (66.5%) are family households, while 58 (33.5%) are nonfamily households. The most numerous type of family households are 2-person households, comprising 51, and the most common type of nonfamily households are 1-person households, comprising 53.
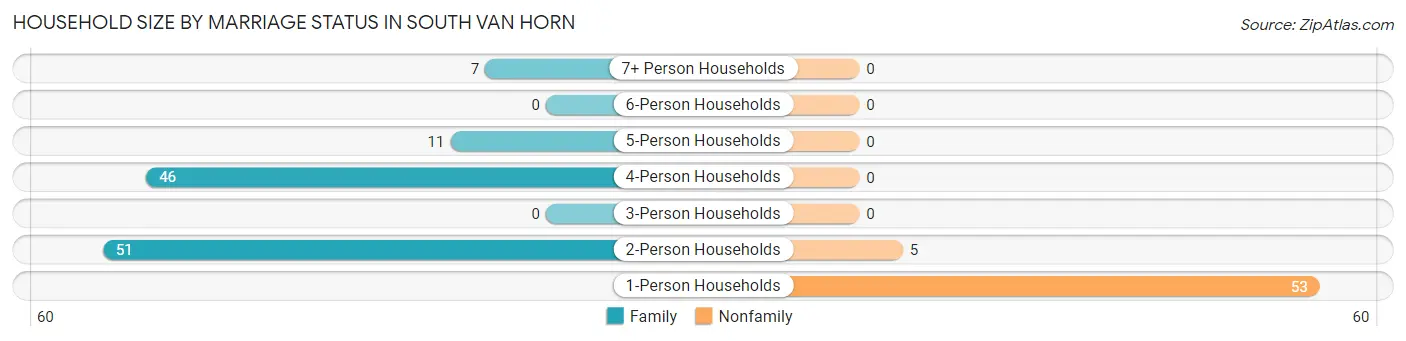
| Household Size | Family Households | Nonfamily Households |
| 1-Person Households | - | 53 (30.6%) |
| 2-Person Households | 51 (29.5%) | 5 (2.9%) |
| 3-Person Households | 0 (0.0%) | 0 (0.0%) |
| 4-Person Households | 46 (26.6%) | 0 (0.0%) |
| 5-Person Households | 11 (6.4%) | 0 (0.0%) |
| 6-Person Households | 0 (0.0%) | 0 (0.0%) |
| 7+ Person Households | 7 (4.1%) | 0 (0.0%) |
| Total | 115 (66.5%) | 58 (33.5%) |
Female Fertility in South Van Horn
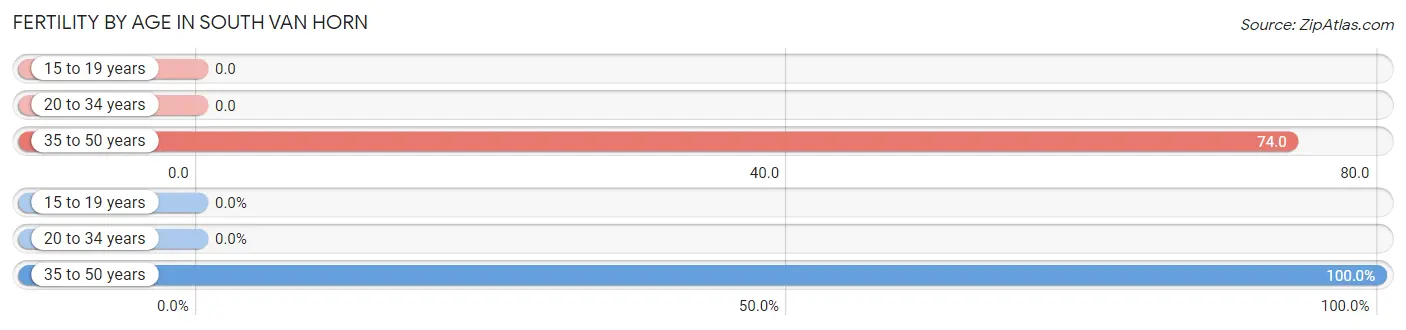
Fertility by Age in South Van Horn
Average fertility rate in South Van Horn is 64.0 births per 1,000 women. Women in the age bracket of 35 to 50 years have the highest fertility rate with 74.0 births per 1,000 women. Women in the age bracket of 35 to 50 years acount for 100.0% of all women with births.
| Age Bracket | Women with Births | Births / 1,000 Women |
| 15 to 19 years | 0 (0.0%) | 0.0 |
| 20 to 34 years | 0 (0.0%) | 0.0 |
| 35 to 50 years | 7 (100.0%) | 74.0 |
| Total | 7 (100.0%) | 64.0 |
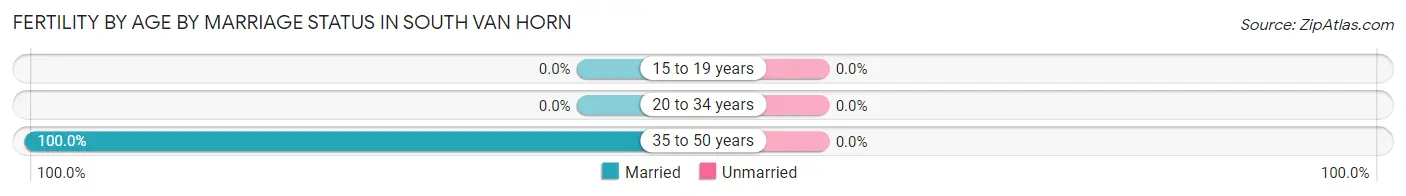
Fertility by Age by Marriage Status in South Van Horn
| Age Bracket | Married | Unmarried |
| 15 to 19 years | 0 (0.0%) | 0 (0.0%) |
| 20 to 34 years | 0 (0.0%) | 0 (0.0%) |
| 35 to 50 years | 7 (100.0%) | 0 (0.0%) |
| Total | 7 (100.0%) | 0 (0.0%) |
Fertility by Education in South Van Horn
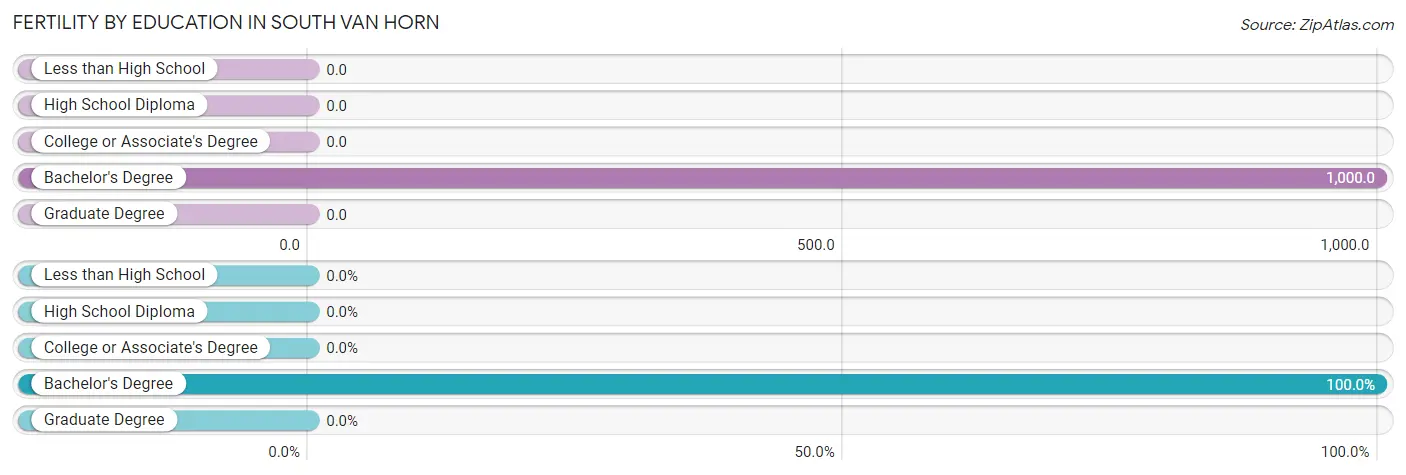
| Educational Attainment | Women with Births | Births / 1,000 Women |
| Less than High School | 0 (0.0%) | 0.0 |
| High School Diploma | 0 (0.0%) | 0.0 |
| College or Associate's Degree | 0 (0.0%) | 0.0 |
| Bachelor's Degree | 7 (100.0%) | 1,000.0 |
| Graduate Degree | 0 (0.0%) | 0.0 |
| Total | 7 (100.0%) | 64.0 |
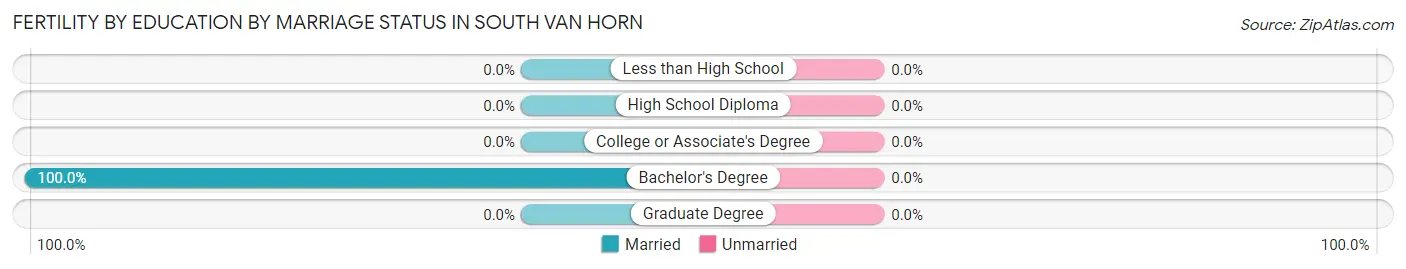
Fertility by Education by Marriage Status in South Van Horn
| Educational Attainment | Married | Unmarried |
| Less than High School | 0 (0.0%) | 0 (0.0%) |
| High School Diploma | 0 (0.0%) | 0 (0.0%) |
| College or Associate's Degree | 0 (0.0%) | 0 (0.0%) |
| Bachelor's Degree | 7 (100.0%) | 0 (0.0%) |
| Graduate Degree | 0 (0.0%) | 0 (0.0%) |
| Total | 7 (100.0%) | 0 (0.0%) |
Employment Characteristics in South Van Horn
Employment by Class of Employer in South Van Horn
Among the 208 employed individuals in South Van Horn, private company employees (157 | 75.5%), not-for-profit organizations (21 | 10.1%), and self-employed (not incorporated) (17 | 8.2%) make up the most common classes of employment.
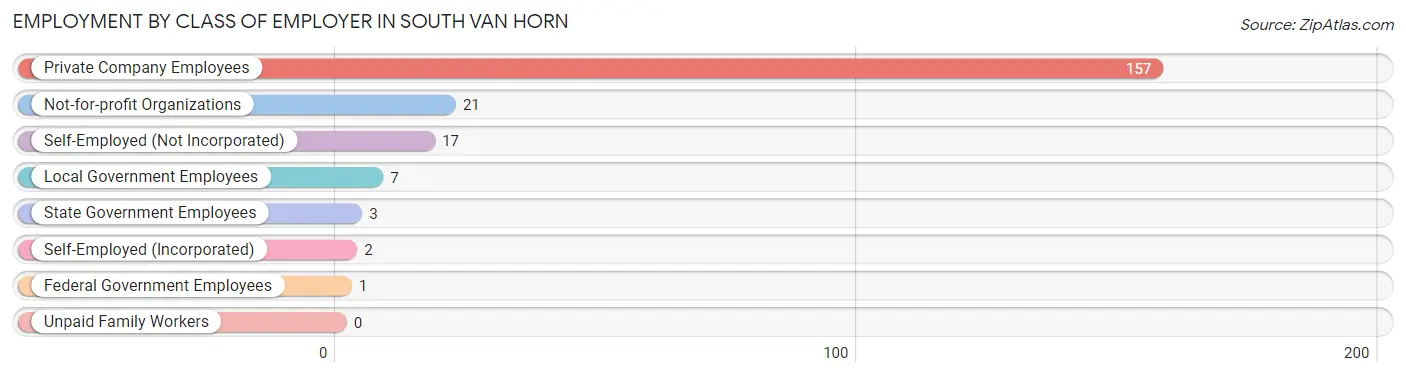
| Employer Class | # Employees | % Employees |
| Private Company Employees | 157 | 75.5% |
| Self-Employed (Incorporated) | 2 | 1.0% |
| Self-Employed (Not Incorporated) | 17 | 8.2% |
| Not-for-profit Organizations | 21 | 10.1% |
| Local Government Employees | 7 | 3.4% |
| State Government Employees | 3 | 1.4% |
| Federal Government Employees | 1 | 0.5% |
| Unpaid Family Workers | 0 | 0.0% |
| Total | 208 | 100.0% |
Employment Status by Age in South Van Horn
According to the labor force statistics for South Van Horn, out of the total population over 16 years of age (335), 66.0% or 221 individuals are in the labor force, with 5.9% or 13 of them unemployed. The age group with the highest labor force participation rate is 16 to 19 years, with 100.0% or 13 individuals in the labor force. Within the labor force, the 25 to 29 years age range has the highest percentage of unemployed individuals, with 66.7% or 6 of them being unemployed.
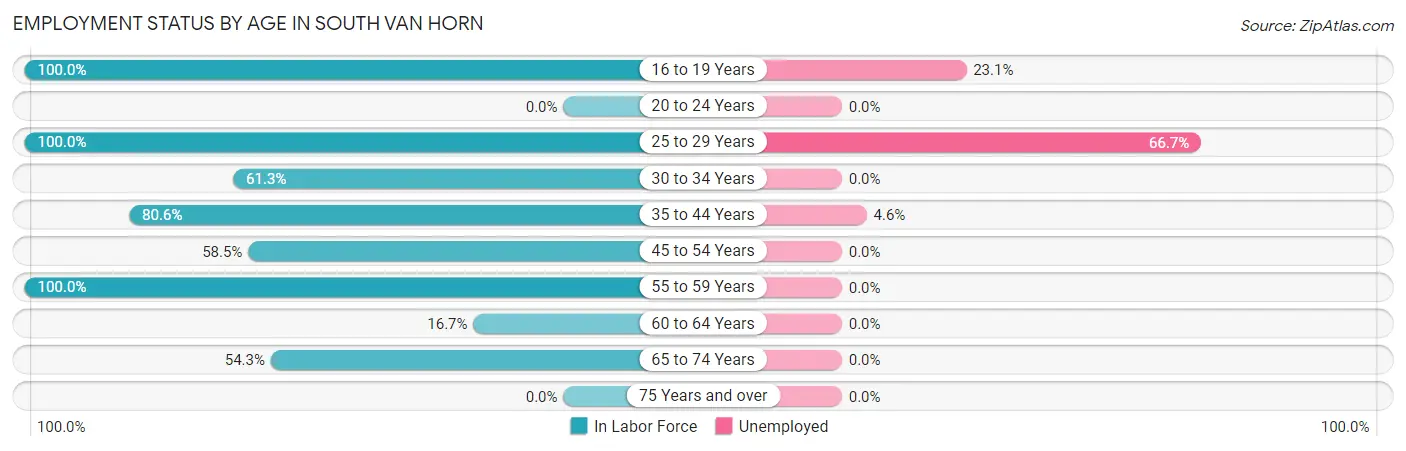
| Age Bracket | In Labor Force | Unemployed |
| 16 to 19 Years | 13 (100.0%) | 3 (23.1%) |
| 20 to 24 Years | 0 (0.0%) | 0 (0.0%) |
| 25 to 29 Years | 9 (100.0%) | 6 (66.7%) |
| 30 to 34 Years | 19 (61.3%) | 0 (0.0%) |
| 35 to 44 Years | 87 (80.6%) | 4 (4.6%) |
| 45 to 54 Years | 31 (58.5%) | 0 (0.0%) |
| 55 to 59 Years | 23 (100.0%) | 0 (0.0%) |
| 60 to 64 Years | 1 (16.7%) | 0 (0.0%) |
| 65 to 74 Years | 38 (54.3%) | 0 (0.0%) |
| 75 Years and over | 0 (0.0%) | 0 (0.0%) |
| Total | 221 (66.0%) | 13 (5.9%) |
Employment Status by Educational Attainment in South Van Horn
According to labor force statistics for South Van Horn, 73.9% of individuals (170) out of the total population between 25 and 64 years of age (230) are in the labor force, with 5.9% or 10 of them being unemployed. The group with the highest labor force participation rate are those with the educational attainment of high school diploma, with 85.6% or 101 individuals in the labor force. Within the labor force, individuals with less than high school education have the highest percentage of unemployment, with 17.4% or 4 of them being unemployed.
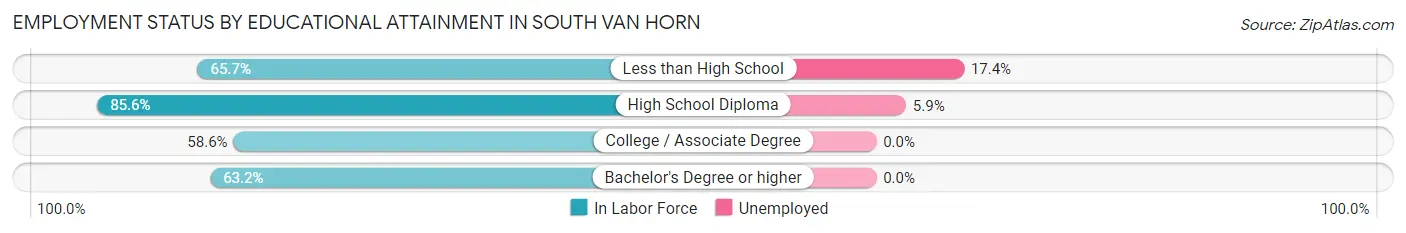
| Educational Attainment | In Labor Force | Unemployed |
| Less than High School | 23 (65.7%) | 6 (17.4%) |
| High School Diploma | 101 (85.6%) | 7 (5.9%) |
| College / Associate Degree | 34 (58.6%) | 0 (0.0%) |
| Bachelor's Degree or higher | 12 (63.2%) | 0 (0.0%) |
| Total | 170 (73.9%) | 14 (5.9%) |
Employment Occupations by Sex in South Van Horn
Management, Business, Science and Arts Occupations
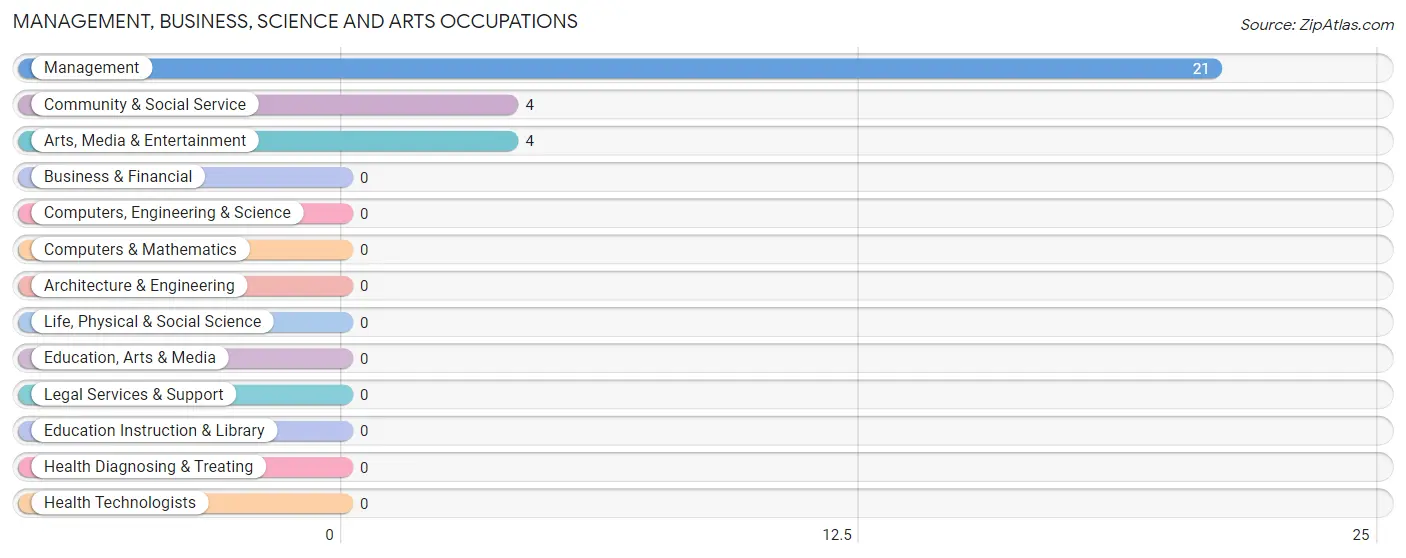
The most common Management, Business, Science and Arts occupations in South Van Horn are Management (21 | 10.1%), Community & Social Service (4 | 1.9%), and Arts, Media & Entertainment (4 | 1.9%).
Management, Business, Science and Arts Occupations by Sex
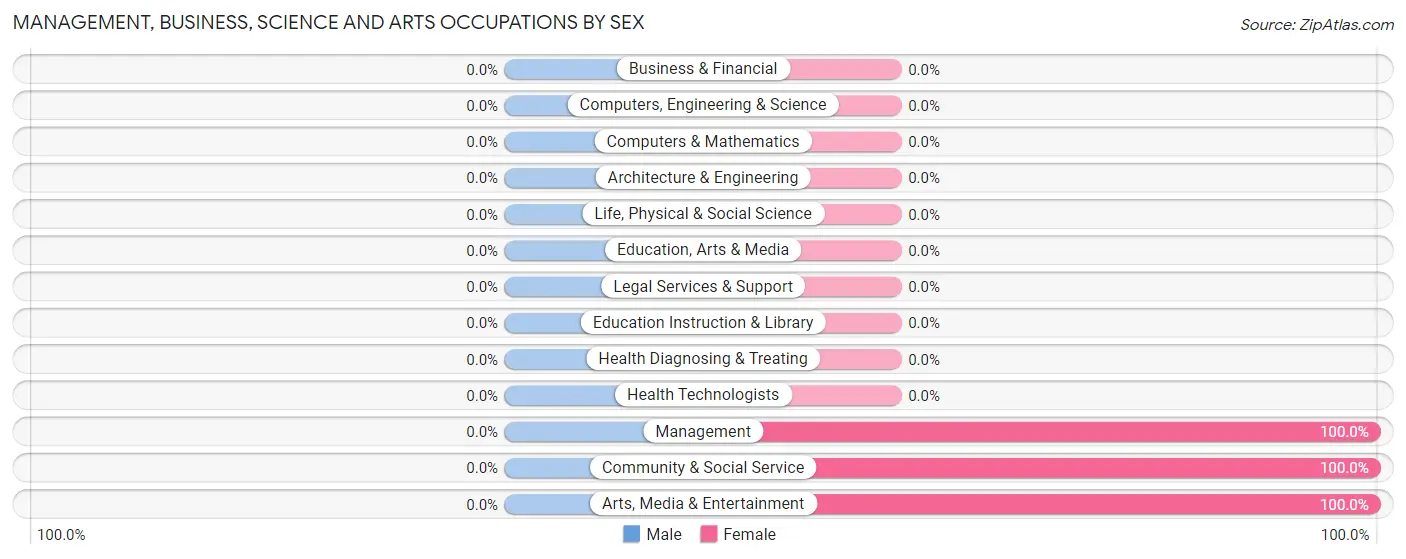
| Occupation | Male | Female |
| Management | 0 (0.0%) | 21 (100.0%) |
| Business & Financial | 0 (0.0%) | 0 (0.0%) |
| Computers, Engineering & Science | 0 (0.0%) | 0 (0.0%) |
| Computers & Mathematics | 0 (0.0%) | 0 (0.0%) |
| Architecture & Engineering | 0 (0.0%) | 0 (0.0%) |
| Life, Physical & Social Science | 0 (0.0%) | 0 (0.0%) |
| Community & Social Service | 0 (0.0%) | 4 (100.0%) |
| Education, Arts & Media | 0 (0.0%) | 0 (0.0%) |
| Legal Services & Support | 0 (0.0%) | 0 (0.0%) |
| Education Instruction & Library | 0 (0.0%) | 0 (0.0%) |
| Arts, Media & Entertainment | 0 (0.0%) | 4 (100.0%) |
| Health Diagnosing & Treating | 0 (0.0%) | 0 (0.0%) |
| Health Technologists | 0 (0.0%) | 0 (0.0%) |
| Total (Category) | 0 (0.0%) | 25 (100.0%) |
| Total (Overall) | 124 (59.6%) | 84 (40.4%) |
Services Occupations
The most common Services occupations in South Van Horn are Food Preparation & Serving (21 | 10.1%), Security & Protection (10 | 4.8%), Law Enforcement (10 | 4.8%), and Cleaning & Maintenance (10 | 4.8%).
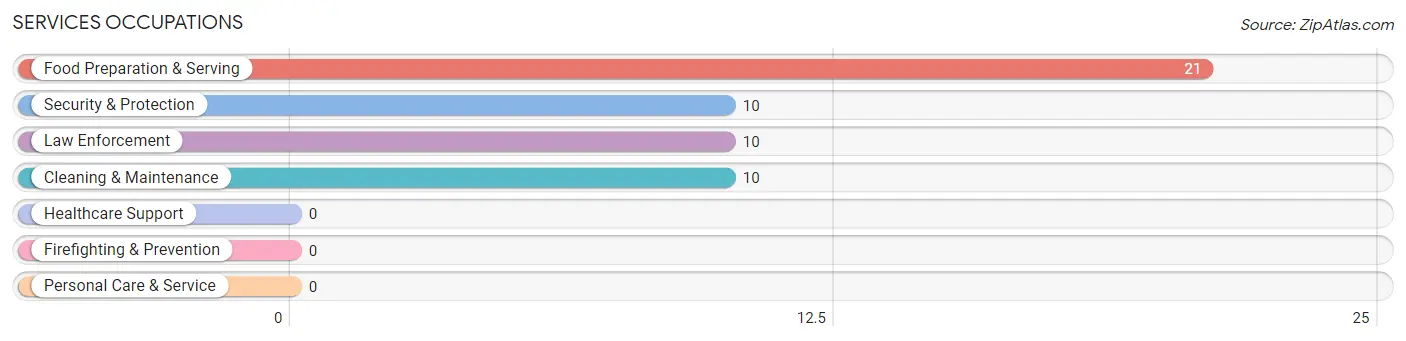
Services Occupations by Sex
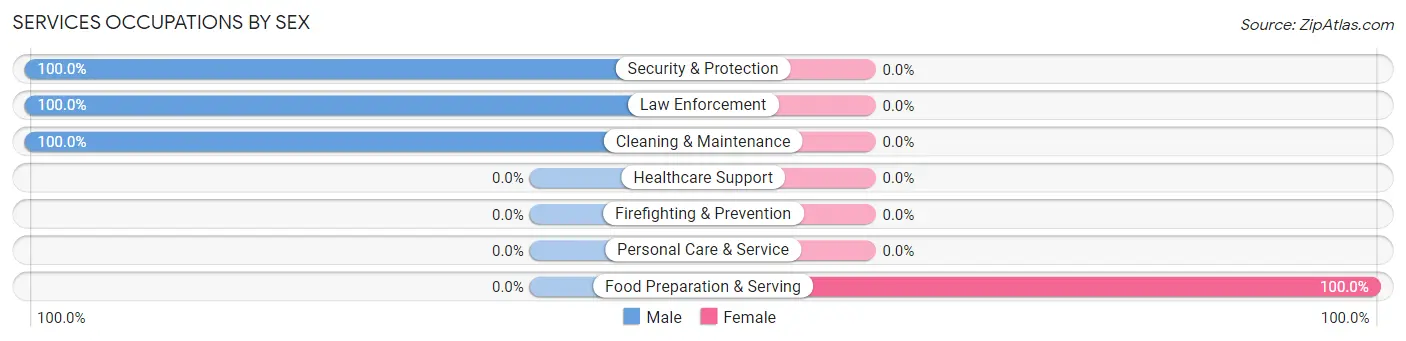
| Occupation | Male | Female |
| Healthcare Support | 0 (0.0%) | 0 (0.0%) |
| Security & Protection | 10 (100.0%) | 0 (0.0%) |
| Firefighting & Prevention | 0 (0.0%) | 0 (0.0%) |
| Law Enforcement | 10 (100.0%) | 0 (0.0%) |
| Food Preparation & Serving | 0 (0.0%) | 21 (100.0%) |
| Cleaning & Maintenance | 10 (100.0%) | 0 (0.0%) |
| Personal Care & Service | 0 (0.0%) | 0 (0.0%) |
| Total (Category) | 20 (48.8%) | 21 (51.2%) |
| Total (Overall) | 124 (59.6%) | 84 (40.4%) |
Sales and Office Occupations
The most common Sales and Office occupations in South Van Horn are Office & Administration (12 | 5.8%), and Sales & Related (8 | 3.8%).
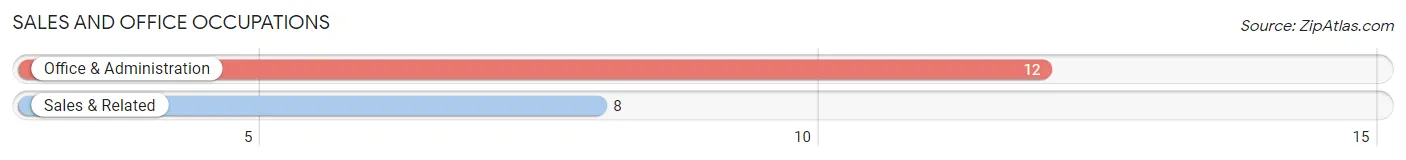
Sales and Office Occupations by Sex
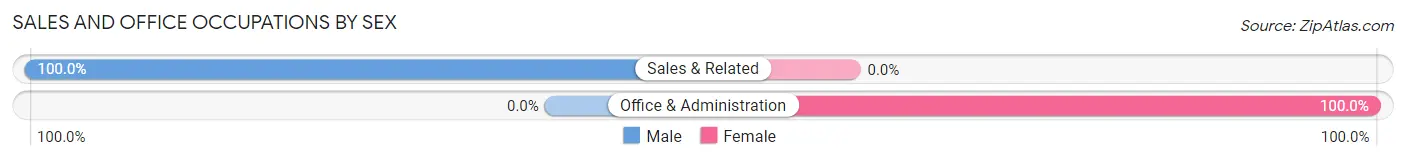
| Occupation | Male | Female |
| Sales & Related | 8 (100.0%) | 0 (0.0%) |
| Office & Administration | 0 (0.0%) | 12 (100.0%) |
| Total (Category) | 8 (40.0%) | 12 (60.0%) |
| Total (Overall) | 124 (59.6%) | 84 (40.4%) |
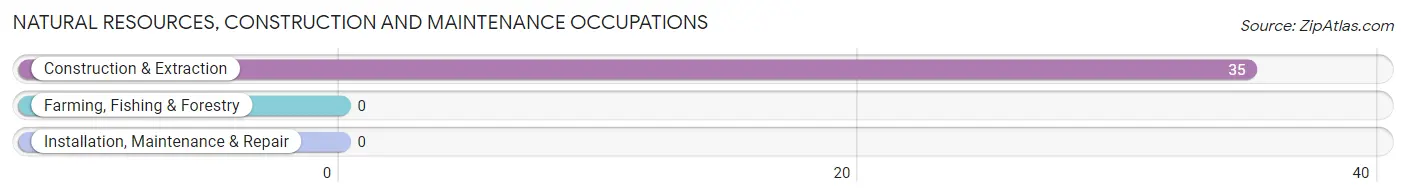
Natural Resources, Construction and Maintenance Occupations
The most common Natural Resources, Construction and Maintenance occupations in South Van Horn are , and Construction & Extraction (35 | 16.8%).
Natural Resources, Construction and Maintenance Occupations by Sex
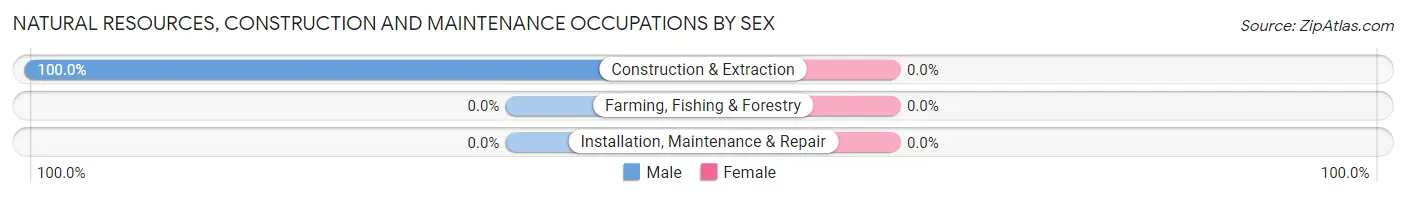
| Occupation | Male | Female |
| Farming, Fishing & Forestry | 0 (0.0%) | 0 (0.0%) |
| Construction & Extraction | 35 (100.0%) | 0 (0.0%) |
| Installation, Maintenance & Repair | 0 (0.0%) | 0 (0.0%) |
| Total (Category) | 35 (100.0%) | 0 (0.0%) |
| Total (Overall) | 124 (59.6%) | 84 (40.4%) |
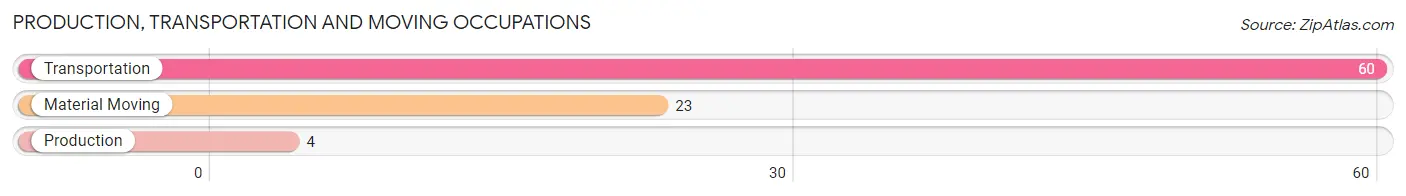
Production, Transportation and Moving Occupations
The most common Production, Transportation and Moving occupations in South Van Horn are Transportation (60 | 28.8%), Material Moving (23 | 11.1%), and Production (4 | 1.9%).
Production, Transportation and Moving Occupations by Sex
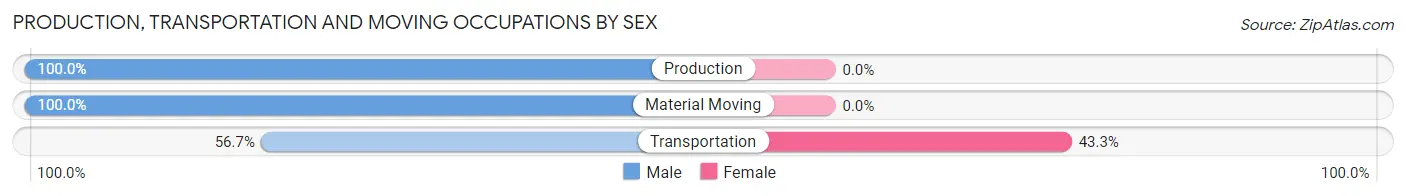
| Occupation | Male | Female |
| Production | 4 (100.0%) | 0 (0.0%) |
| Transportation | 34 (56.7%) | 26 (43.3%) |
| Material Moving | 23 (100.0%) | 0 (0.0%) |
| Total (Category) | 61 (70.1%) | 26 (29.9%) |
| Total (Overall) | 124 (59.6%) | 84 (40.4%) |
Employment Industries by Sex in South Van Horn
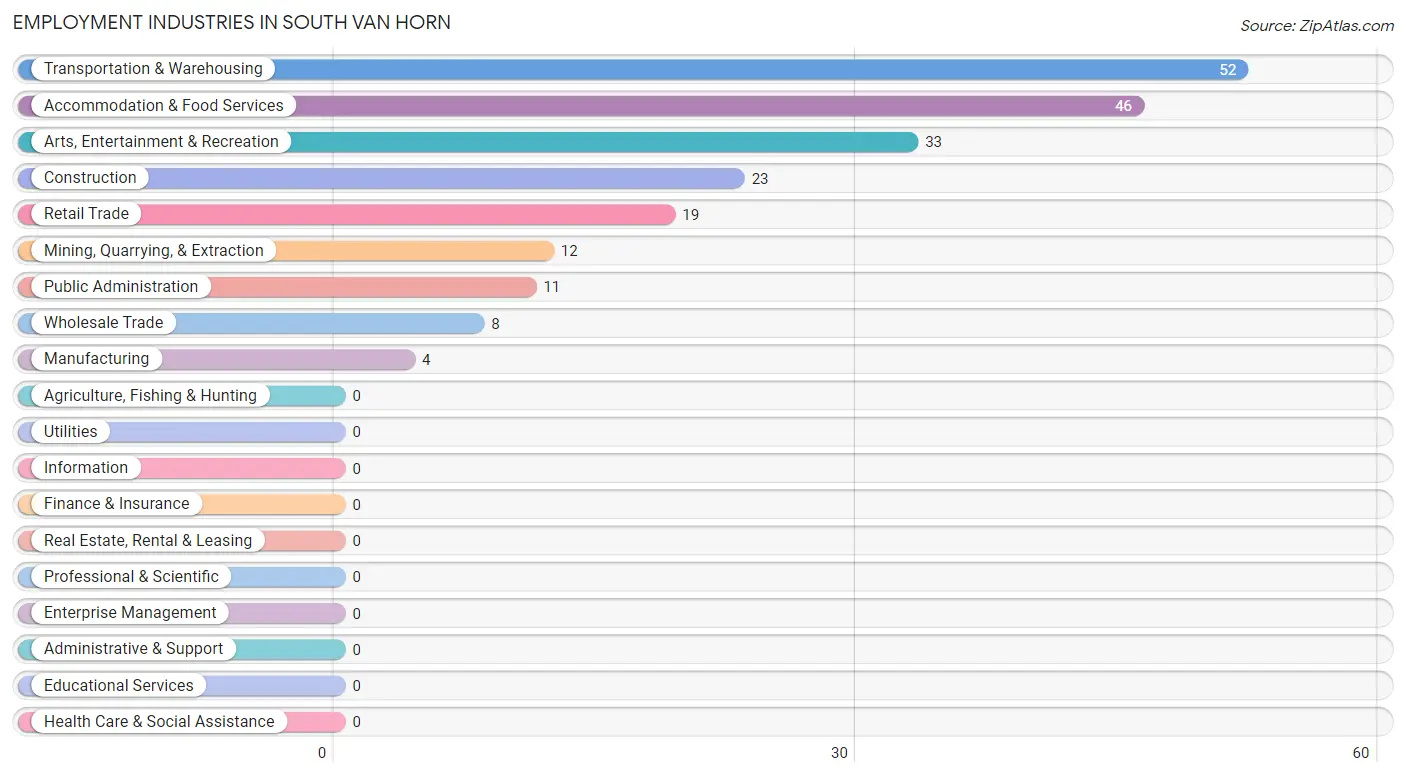
Employment Industries in South Van Horn
The major employment industries in South Van Horn include Transportation & Warehousing (52 | 25.0%), Accommodation & Food Services (46 | 22.1%), Arts, Entertainment & Recreation (33 | 15.9%), Construction (23 | 11.1%), and Retail Trade (19 | 9.1%).
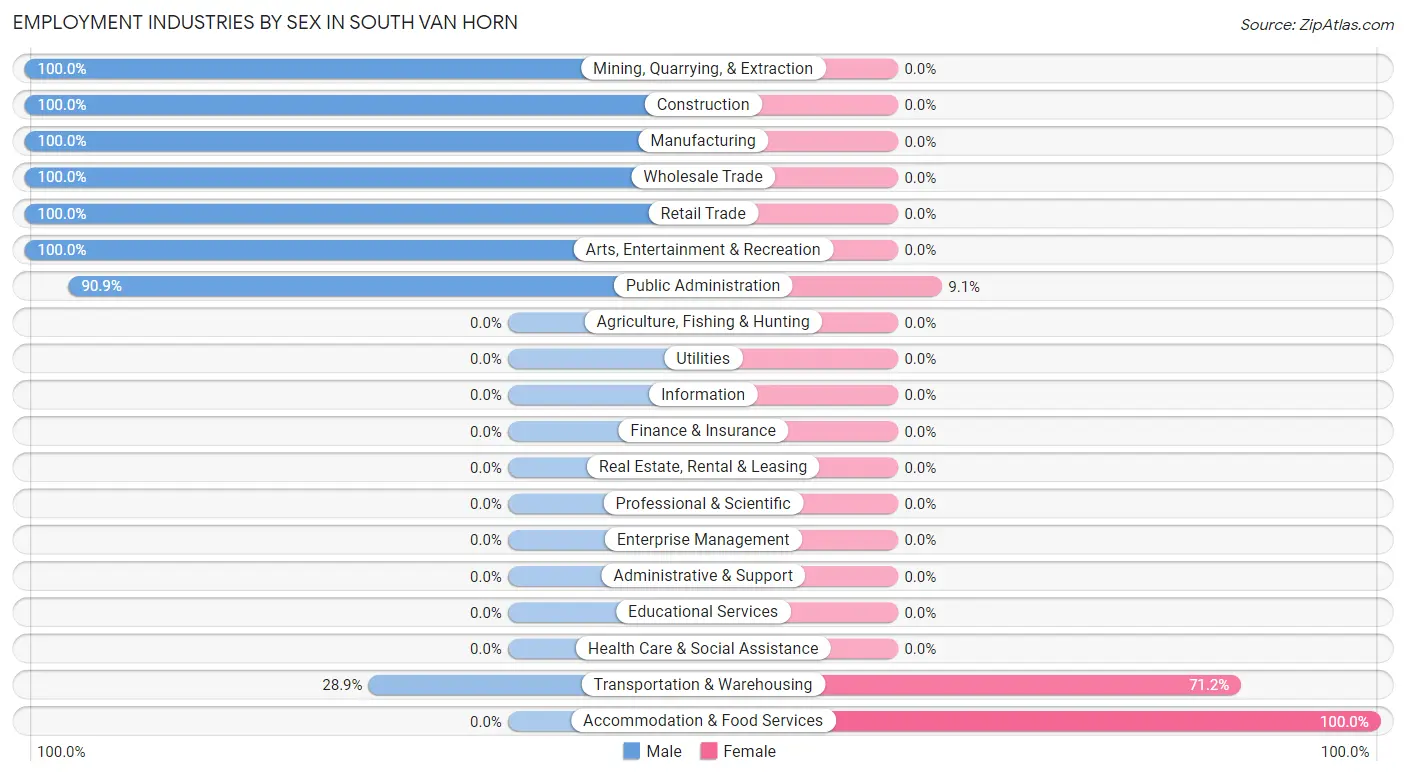
Employment Industries by Sex in South Van Horn
The South Van Horn industries that see more men than women are Mining, Quarrying, & Extraction (100.0%), Construction (100.0%), and Manufacturing (100.0%), whereas the industries that tend to have a higher number of women are Accommodation & Food Services (100.0%), Transportation & Warehousing (71.2%), and Public Administration (9.1%).
| Industry | Male | Female |
| Agriculture, Fishing & Hunting | 0 (0.0%) | 0 (0.0%) |
| Mining, Quarrying, & Extraction | 12 (100.0%) | 0 (0.0%) |
| Construction | 23 (100.0%) | 0 (0.0%) |
| Manufacturing | 4 (100.0%) | 0 (0.0%) |
| Wholesale Trade | 8 (100.0%) | 0 (0.0%) |
| Retail Trade | 19 (100.0%) | 0 (0.0%) |
| Transportation & Warehousing | 15 (28.8%) | 37 (71.2%) |
| Utilities | 0 (0.0%) | 0 (0.0%) |
| Information | 0 (0.0%) | 0 (0.0%) |
| Finance & Insurance | 0 (0.0%) | 0 (0.0%) |
| Real Estate, Rental & Leasing | 0 (0.0%) | 0 (0.0%) |
| Professional & Scientific | 0 (0.0%) | 0 (0.0%) |
| Enterprise Management | 0 (0.0%) | 0 (0.0%) |
| Administrative & Support | 0 (0.0%) | 0 (0.0%) |
| Educational Services | 0 (0.0%) | 0 (0.0%) |
| Health Care & Social Assistance | 0 (0.0%) | 0 (0.0%) |
| Arts, Entertainment & Recreation | 33 (100.0%) | 0 (0.0%) |
| Accommodation & Food Services | 0 (0.0%) | 46 (100.0%) |
| Public Administration | 10 (90.9%) | 1 (9.1%) |
| Total | 124 (59.6%) | 84 (40.4%) |
Education in South Van Horn
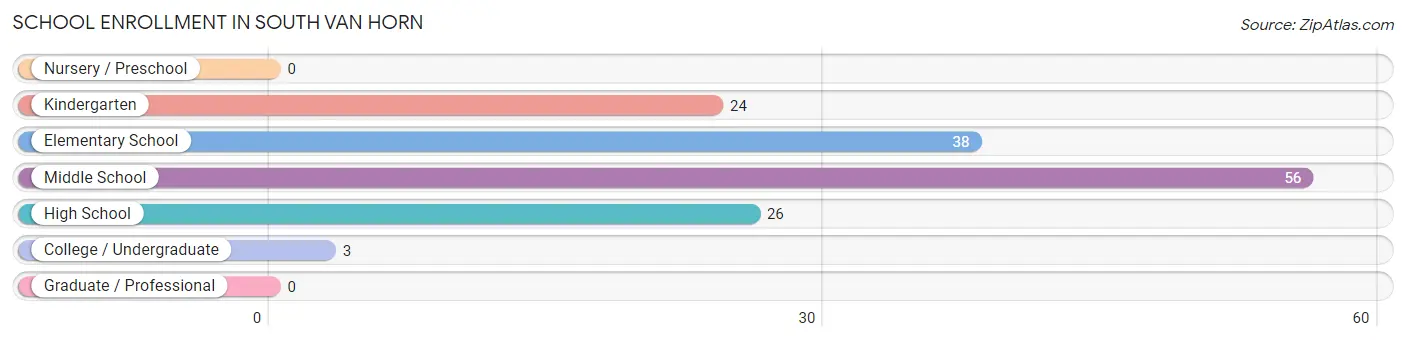
School Enrollment in South Van Horn
The most common levels of schooling among the 147 students in South Van Horn are middle school (56 | 38.1%), elementary school (38 | 25.9%), and high school (26 | 17.7%).
| School Level | # Students | % Students |
| Nursery / Preschool | 0 | 0.0% |
| Kindergarten | 24 | 16.3% |
| Elementary School | 38 | 25.9% |
| Middle School | 56 | 38.1% |
| High School | 26 | 17.7% |
| College / Undergraduate | 3 | 2.0% |
| Graduate / Professional | 0 | 0.0% |
| Total | 147 | 100.0% |
School Enrollment by Age by Funding Source in South Van Horn
Out of a total of 147 students who are enrolled in schools in South Van Horn, 33 (22.4%) attend a private institution, while the remaining 114 (77.6%) are enrolled in public schools. The age group of 5 to 9 year old has the highest likelihood of being enrolled in private schools, with 33 (53.2% in the age bracket) enrolled. Conversely, the age group of 10 to 14 year olds has the lowest likelihood of being enrolled in a private school, with 56 (100.0% in the age bracket) attending a public institution.
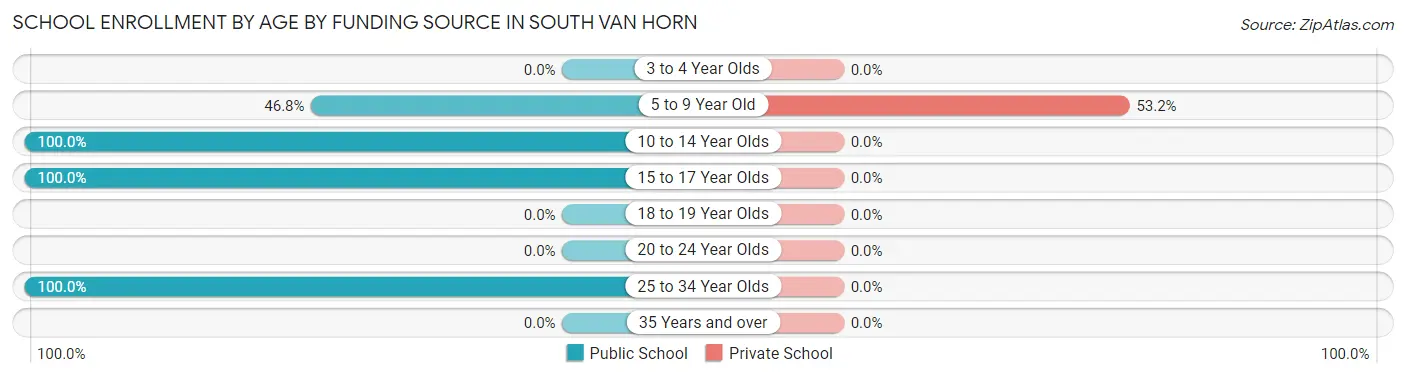
| Age Bracket | Public School | Private School |
| 3 to 4 Year Olds | 0 (0.0%) | 0 (0.0%) |
| 5 to 9 Year Old | 29 (46.8%) | 33 (53.2%) |
| 10 to 14 Year Olds | 56 (100.0%) | 0 (0.0%) |
| 15 to 17 Year Olds | 26 (100.0%) | 0 (0.0%) |
| 18 to 19 Year Olds | 0 (0.0%) | 0 (0.0%) |
| 20 to 24 Year Olds | 0 (0.0%) | 0 (0.0%) |
| 25 to 34 Year Olds | 3 (100.0%) | 0 (0.0%) |
| 35 Years and over | 0 (0.0%) | 0 (0.0%) |
| Total | 114 (77.6%) | 33 (22.4%) |
Educational Attainment by Field of Study in South Van Horn
Liberal arts & history (11 | 45.8%), social sciences (7 | 29.2%), business (5 | 20.8%), and literature & languages (1 | 4.2%) are the most common fields of study among 24 individuals in South Van Horn who have obtained a bachelor's degree or higher.
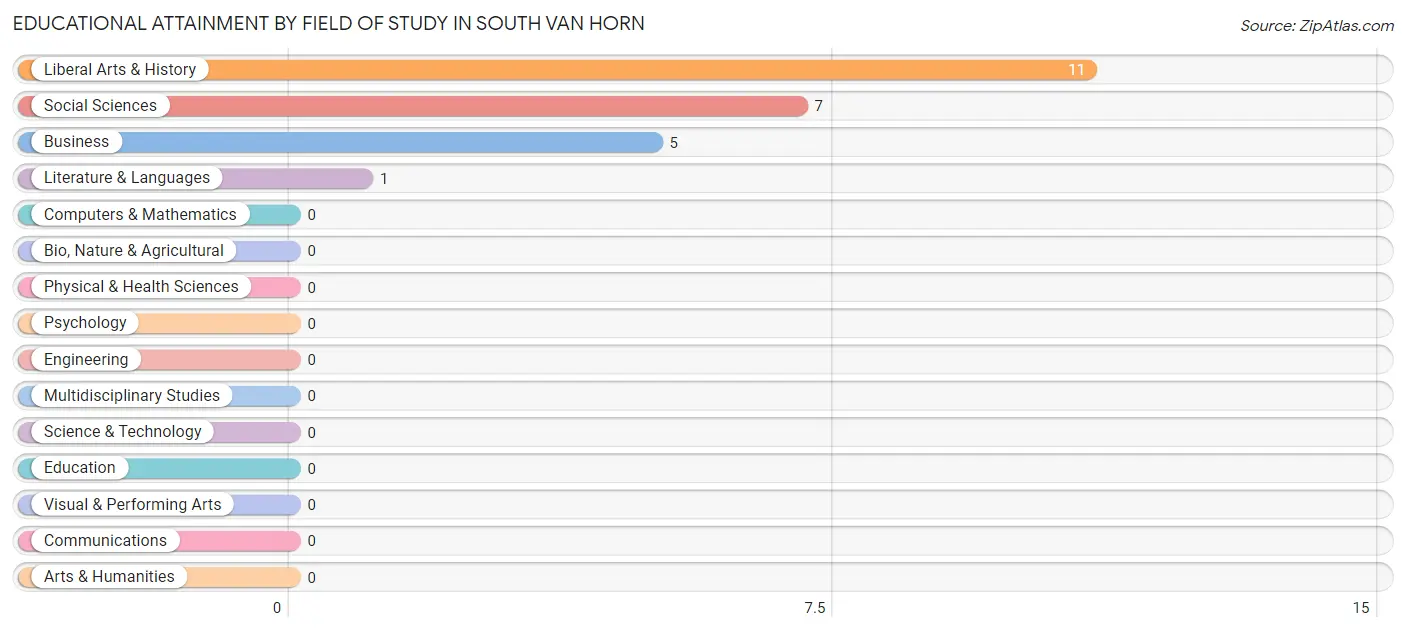
| Field of Study | # Graduates | % Graduates |
| Computers & Mathematics | 0 | 0.0% |
| Bio, Nature & Agricultural | 0 | 0.0% |
| Physical & Health Sciences | 0 | 0.0% |
| Psychology | 0 | 0.0% |
| Social Sciences | 7 | 29.2% |
| Engineering | 0 | 0.0% |
| Multidisciplinary Studies | 0 | 0.0% |
| Science & Technology | 0 | 0.0% |
| Business | 5 | 20.8% |
| Education | 0 | 0.0% |
| Literature & Languages | 1 | 4.2% |
| Liberal Arts & History | 11 | 45.8% |
| Visual & Performing Arts | 0 | 0.0% |
| Communications | 0 | 0.0% |
| Arts & Humanities | 0 | 0.0% |
| Total | 24 | 100.0% |
Transportation & Commute in South Van Horn
Vehicle Availability by Sex in South Van Horn
The most prevalent vehicle ownership categories in South Van Horn are males with 2 vehicles (44, accounting for 38.3%) and females with 2 vehicles (16, making up 52.4%).
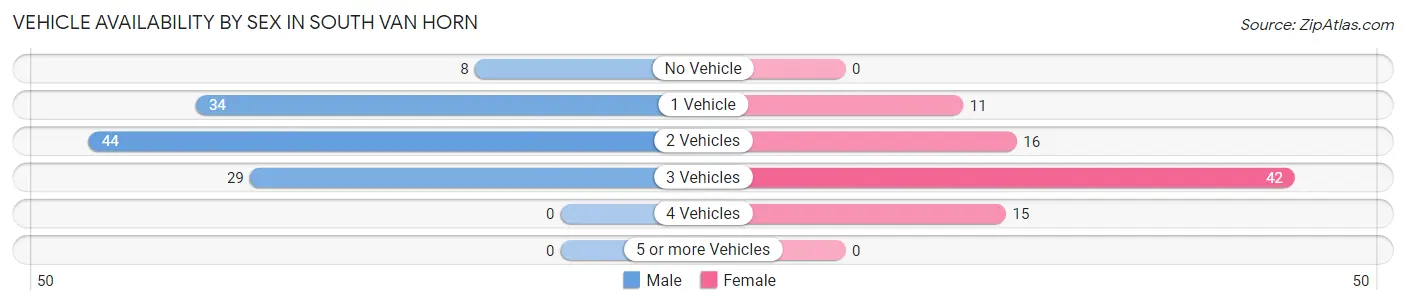
| Vehicles Available | Male | Female |
| No Vehicle | 8 (7.0%) | 0 (0.0%) |
| 1 Vehicle | 34 (29.6%) | 11 (13.1%) |
| 2 Vehicles | 44 (38.3%) | 16 (19.1%) |
| 3 Vehicles | 29 (25.2%) | 42 (50.0%) |
| 4 Vehicles | 0 (0.0%) | 15 (17.9%) |
| 5 or more Vehicles | 0 (0.0%) | 0 (0.0%) |
| Total | 115 (100.0%) | 84 (100.0%) |
Commute Time in South Van Horn
The most frequently occuring commute durations in South Van Horn are 15 to 19 minutes (86 commuters, 41.9%), 5 to 9 minutes (49 commuters, 23.9%), and less than 5 minutes (42 commuters, 20.5%).
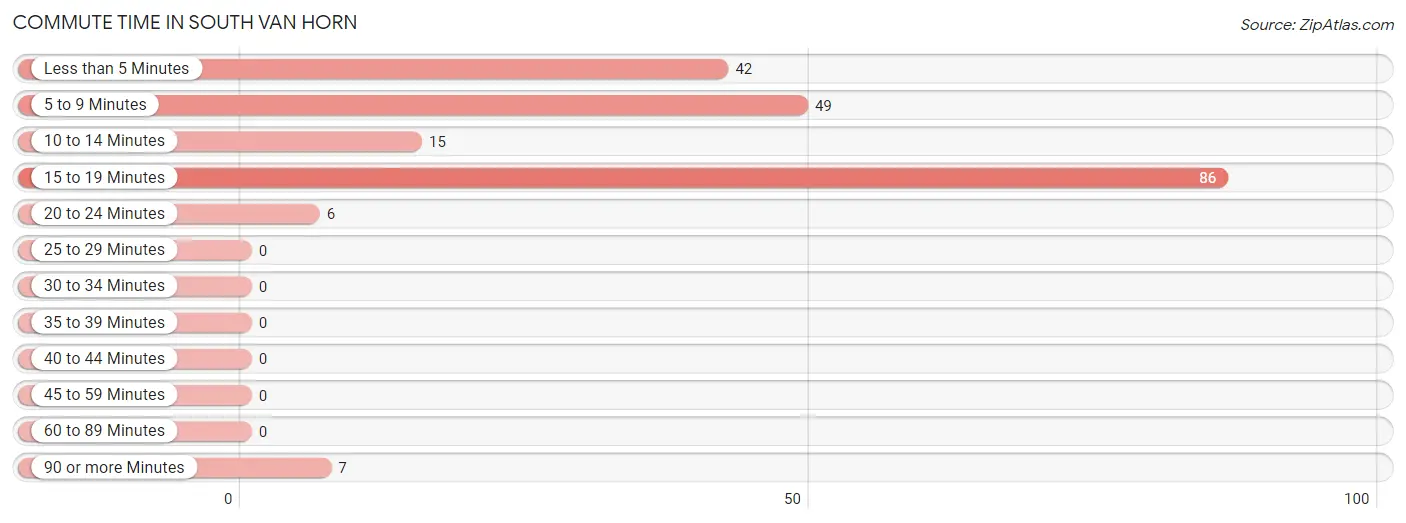
| Commute Time | # Commuters | % Commuters |
| Less than 5 Minutes | 42 | 20.5% |
| 5 to 9 Minutes | 49 | 23.9% |
| 10 to 14 Minutes | 15 | 7.3% |
| 15 to 19 Minutes | 86 | 41.9% |
| 20 to 24 Minutes | 6 | 2.9% |
| 25 to 29 Minutes | 0 | 0.0% |
| 30 to 34 Minutes | 0 | 0.0% |
| 35 to 39 Minutes | 0 | 0.0% |
| 40 to 44 Minutes | 0 | 0.0% |
| 45 to 59 Minutes | 0 | 0.0% |
| 60 to 89 Minutes | 0 | 0.0% |
| 90 or more Minutes | 7 | 3.4% |
Commute Time by Sex in South Van Horn
The most common commute times in South Van Horn are less than 5 minutes (42 commuters, 34.7%) for males and 15 to 19 minutes (57 commuters, 67.9%) for females.
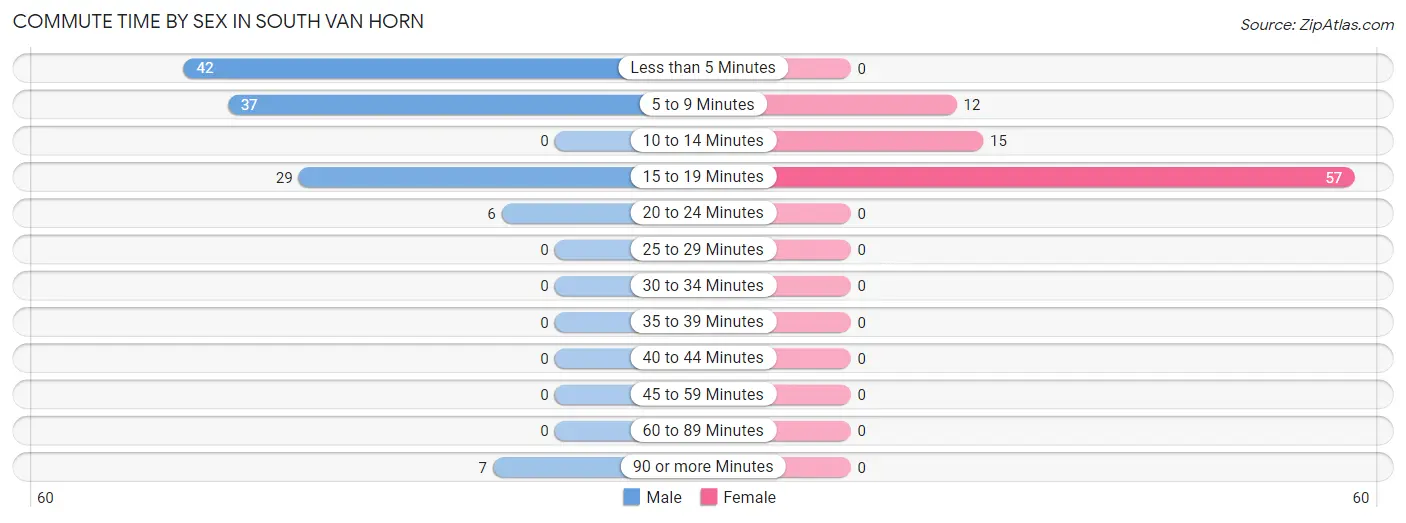
| Commute Time | Male | Female |
| Less than 5 Minutes | 42 (34.7%) | 0 (0.0%) |
| 5 to 9 Minutes | 37 (30.6%) | 12 (14.3%) |
| 10 to 14 Minutes | 0 (0.0%) | 15 (17.9%) |
| 15 to 19 Minutes | 29 (24.0%) | 57 (67.9%) |
| 20 to 24 Minutes | 6 (5.0%) | 0 (0.0%) |
| 25 to 29 Minutes | 0 (0.0%) | 0 (0.0%) |
| 30 to 34 Minutes | 0 (0.0%) | 0 (0.0%) |
| 35 to 39 Minutes | 0 (0.0%) | 0 (0.0%) |
| 40 to 44 Minutes | 0 (0.0%) | 0 (0.0%) |
| 45 to 59 Minutes | 0 (0.0%) | 0 (0.0%) |
| 60 to 89 Minutes | 0 (0.0%) | 0 (0.0%) |
| 90 or more Minutes | 7 (5.8%) | 0 (0.0%) |
Time of Departure to Work by Sex in South Van Horn
The most frequent times of departure to work in South Van Horn are 9:00 AM to 9:59 AM (29, 24.0%) for males and 8:30 AM to 8:59 AM (36, 42.9%) for females.
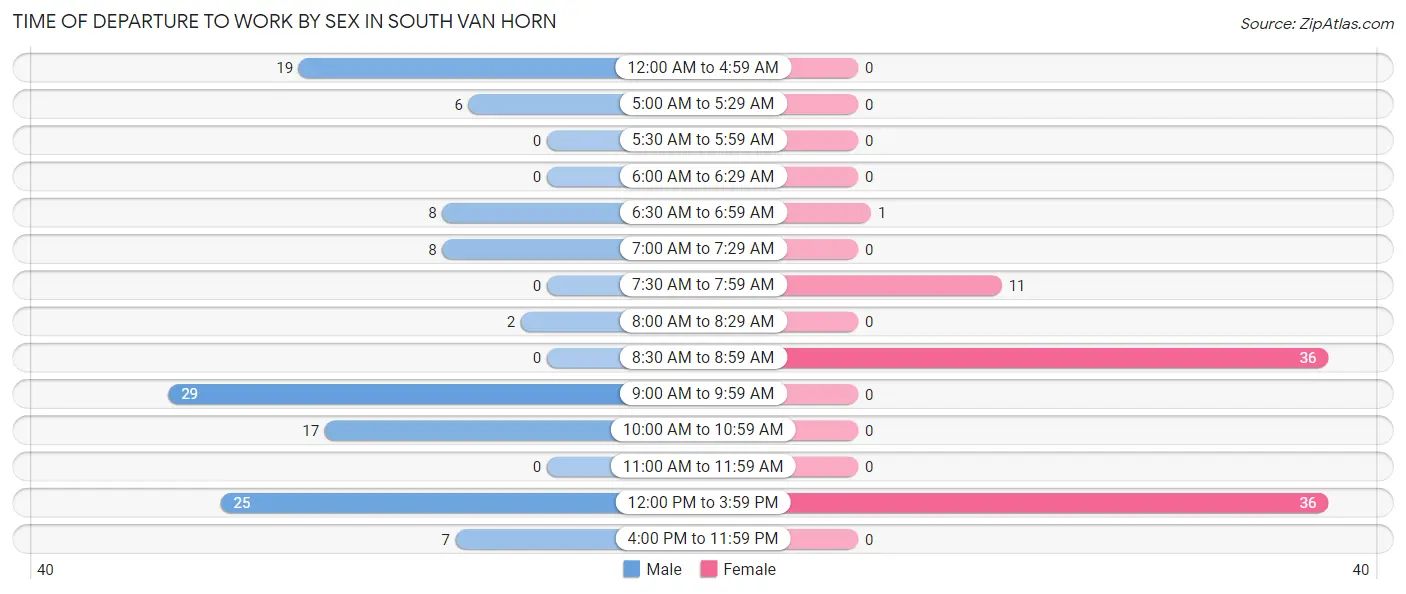
| Time of Departure | Male | Female |
| 12:00 AM to 4:59 AM | 19 (15.7%) | 0 (0.0%) |
| 5:00 AM to 5:29 AM | 6 (5.0%) | 0 (0.0%) |
| 5:30 AM to 5:59 AM | 0 (0.0%) | 0 (0.0%) |
| 6:00 AM to 6:29 AM | 0 (0.0%) | 0 (0.0%) |
| 6:30 AM to 6:59 AM | 8 (6.6%) | 1 (1.2%) |
| 7:00 AM to 7:29 AM | 8 (6.6%) | 0 (0.0%) |
| 7:30 AM to 7:59 AM | 0 (0.0%) | 11 (13.1%) |
| 8:00 AM to 8:29 AM | 2 (1.7%) | 0 (0.0%) |
| 8:30 AM to 8:59 AM | 0 (0.0%) | 36 (42.9%) |
| 9:00 AM to 9:59 AM | 29 (24.0%) | 0 (0.0%) |
| 10:00 AM to 10:59 AM | 17 (14.1%) | 0 (0.0%) |
| 11:00 AM to 11:59 AM | 0 (0.0%) | 0 (0.0%) |
| 12:00 PM to 3:59 PM | 25 (20.7%) | 36 (42.9%) |
| 4:00 PM to 11:59 PM | 7 (5.8%) | 0 (0.0%) |
| Total | 121 (100.0%) | 84 (100.0%) |
Housing Occupancy in South Van Horn
Occupancy by Ownership in South Van Horn
Of the total 173 dwellings in South Van Horn, owner-occupied units account for 167 (96.5%), while renter-occupied units make up 6 (3.5%).
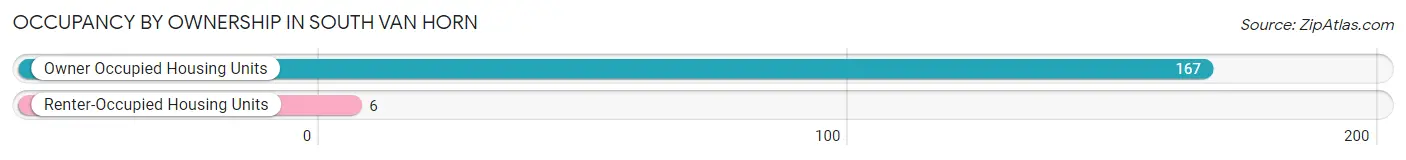
| Occupancy | # Housing Units | % Housing Units |
| Owner Occupied Housing Units | 167 | 96.5% |
| Renter-Occupied Housing Units | 6 | 3.5% |
| Total Occupied Housing Units | 173 | 100.0% |
Occupancy by Household Size in South Van Horn
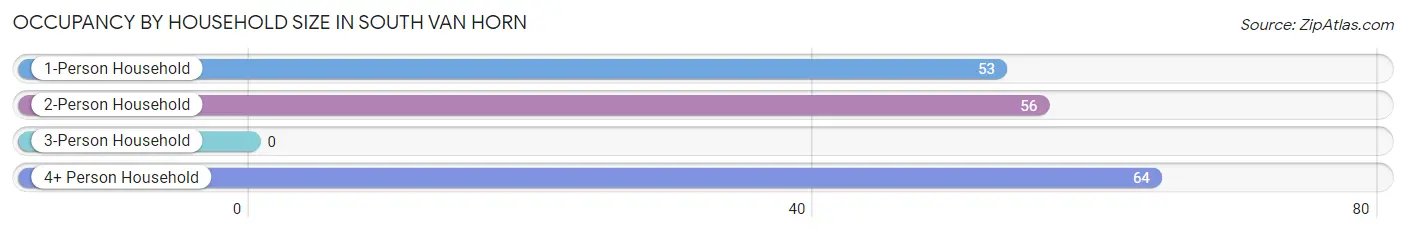
| Household Size | # Housing Units | % Housing Units |
| 1-Person Household | 53 | 30.6% |
| 2-Person Household | 56 | 32.4% |
| 3-Person Household | 0 | 0.0% |
| 4+ Person Household | 64 | 37.0% |
| Total Housing Units | 173 | 100.0% |
Occupancy by Ownership by Household Size in South Van Horn
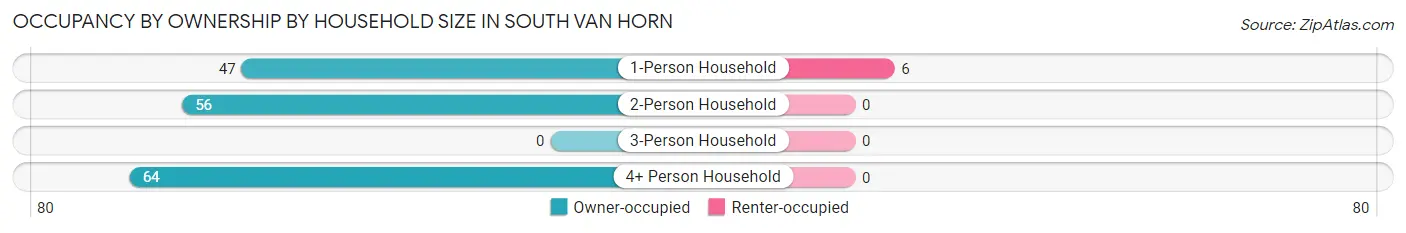
| Household Size | Owner-occupied | Renter-occupied |
| 1-Person Household | 47 (88.7%) | 6 (11.3%) |
| 2-Person Household | 56 (100.0%) | 0 (0.0%) |
| 3-Person Household | 0 (0.0%) | 0 (0.0%) |
| 4+ Person Household | 64 (100.0%) | 0 (0.0%) |
| Total Housing Units | 167 (96.5%) | 6 (3.5%) |
Occupancy by Educational Attainment in South Van Horn
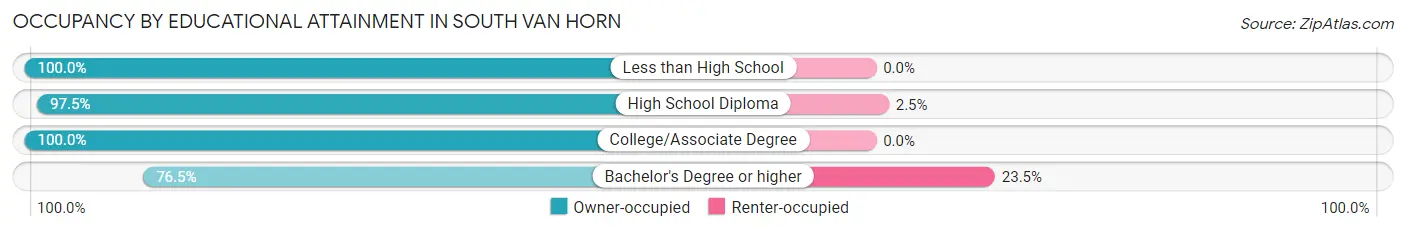
| Household Size | Owner-occupied | Renter-occupied |
| Less than High School | 23 (100.0%) | 0 (0.0%) |
| High School Diploma | 78 (97.5%) | 2 (2.5%) |
| College/Associate Degree | 53 (100.0%) | 0 (0.0%) |
| Bachelor's Degree or higher | 13 (76.5%) | 4 (23.5%) |
Occupancy by Age of Householder in South Van Horn
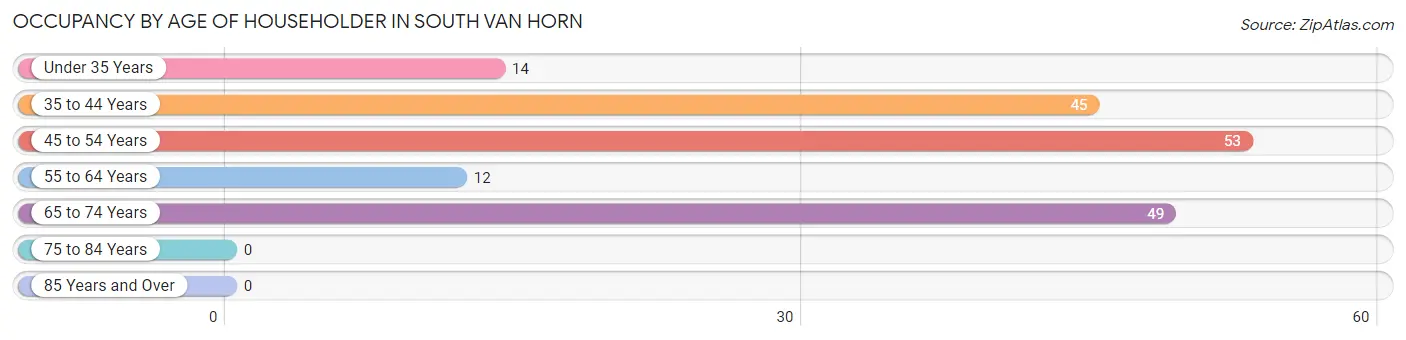
| Age Bracket | # Households | % Households |
| Under 35 Years | 14 | 8.1% |
| 35 to 44 Years | 45 | 26.0% |
| 45 to 54 Years | 53 | 30.6% |
| 55 to 64 Years | 12 | 6.9% |
| 65 to 74 Years | 49 | 28.3% |
| 75 to 84 Years | 0 | 0.0% |
| 85 Years and Over | 0 | 0.0% |
| Total | 173 | 100.0% |
Housing Finances in South Van Horn
Median Income by Occupancy in South Van Horn
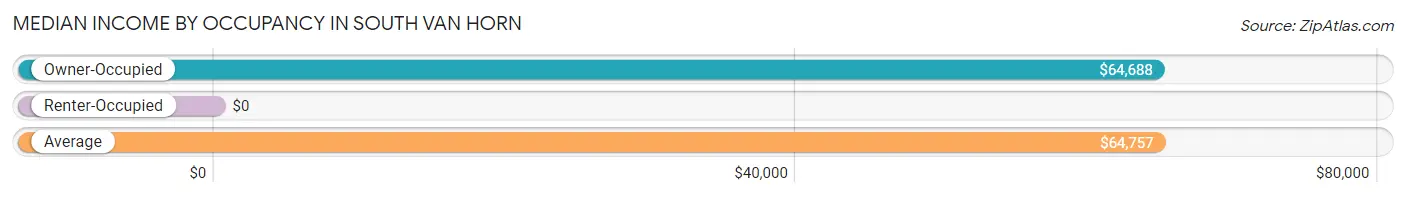
| Occupancy Type | # Households | Median Income |
| Owner-Occupied | 167 (96.5%) | $64,688 |
| Renter-Occupied | 6 (3.5%) | $0 |
| Average | 173 (100.0%) | $64,757 |
Occupancy by Householder Income Bracket in South Van Horn
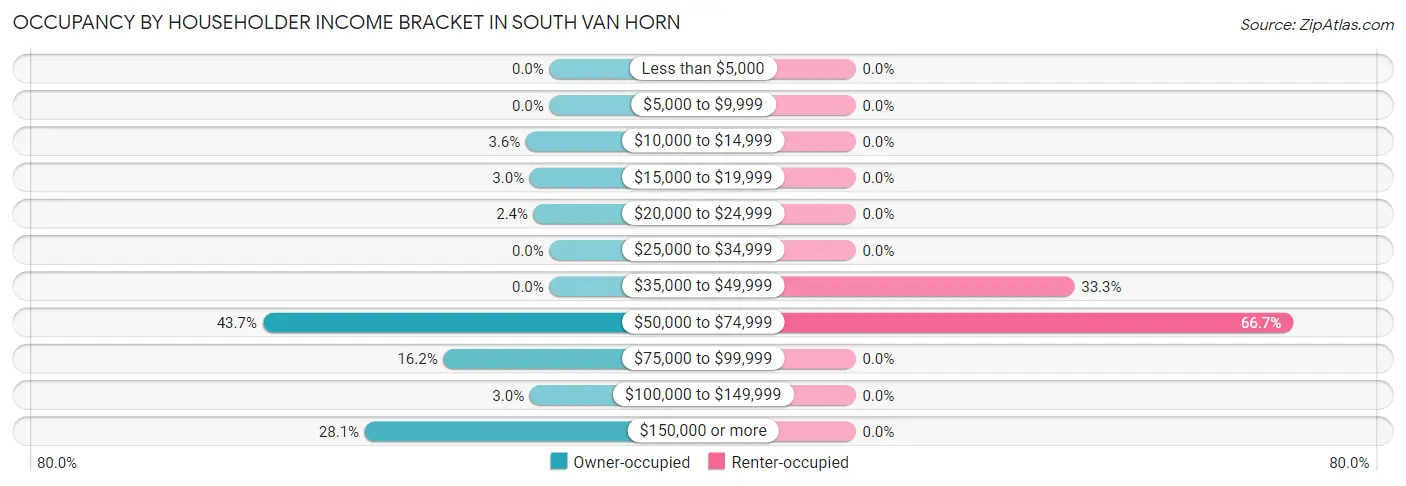
| Income Bracket | Owner-occupied | Renter-occupied |
| Less than $5,000 | 0 (0.0%) | 0 (0.0%) |
| $5,000 to $9,999 | 0 (0.0%) | 0 (0.0%) |
| $10,000 to $14,999 | 6 (3.6%) | 0 (0.0%) |
| $15,000 to $19,999 | 5 (3.0%) | 0 (0.0%) |
| $20,000 to $24,999 | 4 (2.4%) | 0 (0.0%) |
| $25,000 to $34,999 | 0 (0.0%) | 0 (0.0%) |
| $35,000 to $49,999 | 0 (0.0%) | 2 (33.3%) |
| $50,000 to $74,999 | 73 (43.7%) | 4 (66.7%) |
| $75,000 to $99,999 | 27 (16.2%) | 0 (0.0%) |
| $100,000 to $149,999 | 5 (3.0%) | 0 (0.0%) |
| $150,000 or more | 47 (28.1%) | 0 (0.0%) |
| Total | 167 (100.0%) | 6 (100.0%) |
Monthly Housing Cost Tiers in South Van Horn
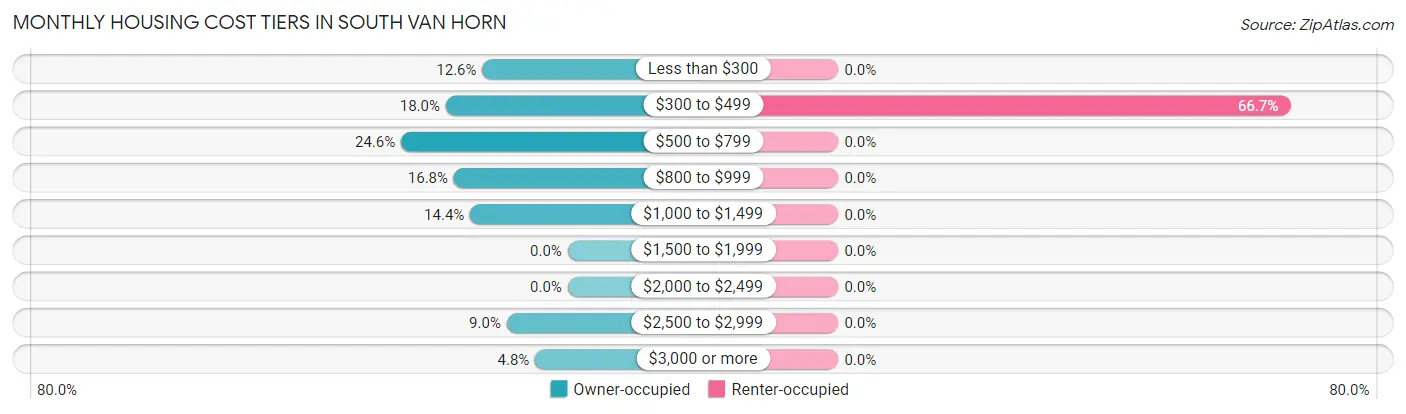
| Monthly Cost | Owner-occupied | Renter-occupied |
| Less than $300 | 21 (12.6%) | 0 (0.0%) |
| $300 to $499 | 30 (18.0%) | 4 (66.7%) |
| $500 to $799 | 41 (24.5%) | 0 (0.0%) |
| $800 to $999 | 28 (16.8%) | 0 (0.0%) |
| $1,000 to $1,499 | 24 (14.4%) | 0 (0.0%) |
| $1,500 to $1,999 | 0 (0.0%) | 0 (0.0%) |
| $2,000 to $2,499 | 0 (0.0%) | 0 (0.0%) |
| $2,500 to $2,999 | 15 (9.0%) | 0 (0.0%) |
| $3,000 or more | 8 (4.8%) | 0 (0.0%) |
| Total | 167 (100.0%) | 6 (100.0%) |
Physical Housing Characteristics in South Van Horn
Housing Structures in South Van Horn
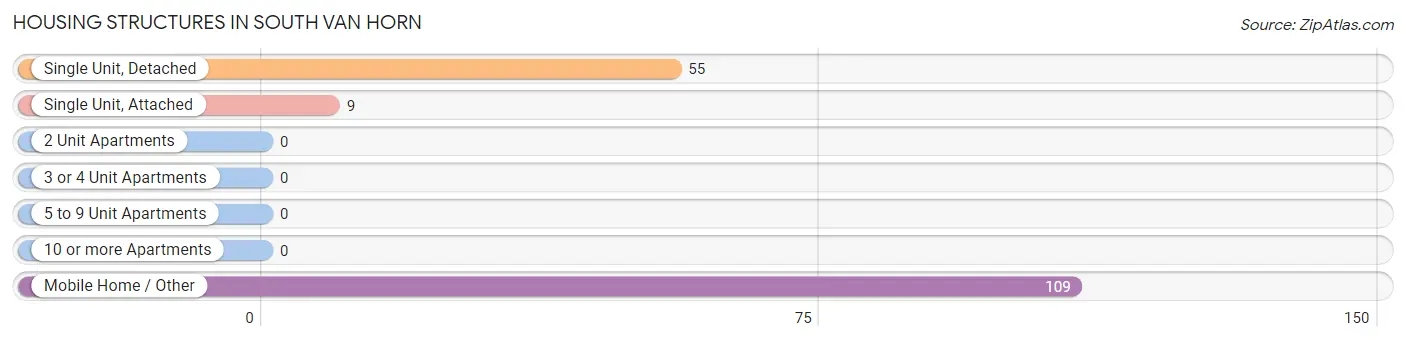
| Structure Type | # Housing Units | % Housing Units |
| Single Unit, Detached | 55 | 31.8% |
| Single Unit, Attached | 9 | 5.2% |
| 2 Unit Apartments | 0 | 0.0% |
| 3 or 4 Unit Apartments | 0 | 0.0% |
| 5 to 9 Unit Apartments | 0 | 0.0% |
| 10 or more Apartments | 0 | 0.0% |
| Mobile Home / Other | 109 | 63.0% |
| Total | 173 | 100.0% |
Housing Structures by Occupancy in South Van Horn
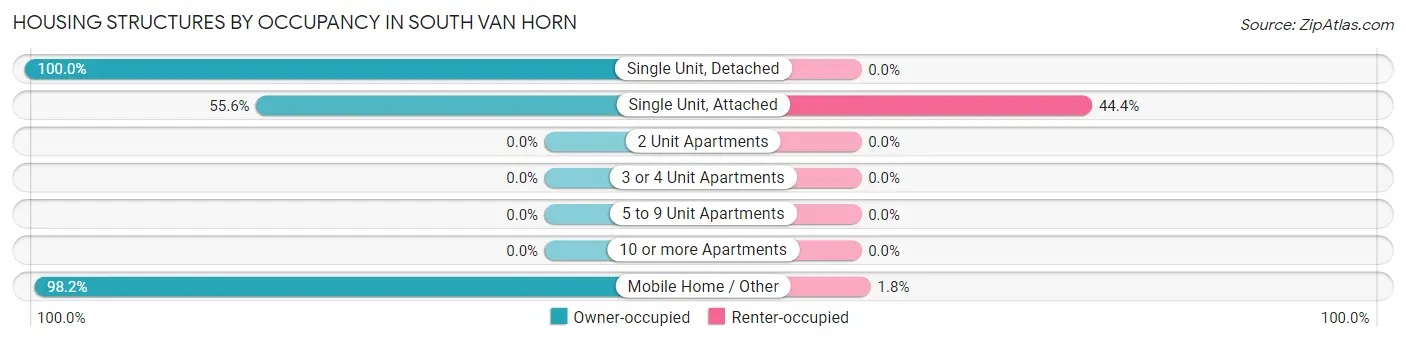
| Structure Type | Owner-occupied | Renter-occupied |
| Single Unit, Detached | 55 (100.0%) | 0 (0.0%) |
| Single Unit, Attached | 5 (55.6%) | 4 (44.4%) |
| 2 Unit Apartments | 0 (0.0%) | 0 (0.0%) |
| 3 or 4 Unit Apartments | 0 (0.0%) | 0 (0.0%) |
| 5 to 9 Unit Apartments | 0 (0.0%) | 0 (0.0%) |
| 10 or more Apartments | 0 (0.0%) | 0 (0.0%) |
| Mobile Home / Other | 107 (98.2%) | 2 (1.8%) |
| Total | 167 (96.5%) | 6 (3.5%) |
Housing Structures by Number of Rooms in South Van Horn
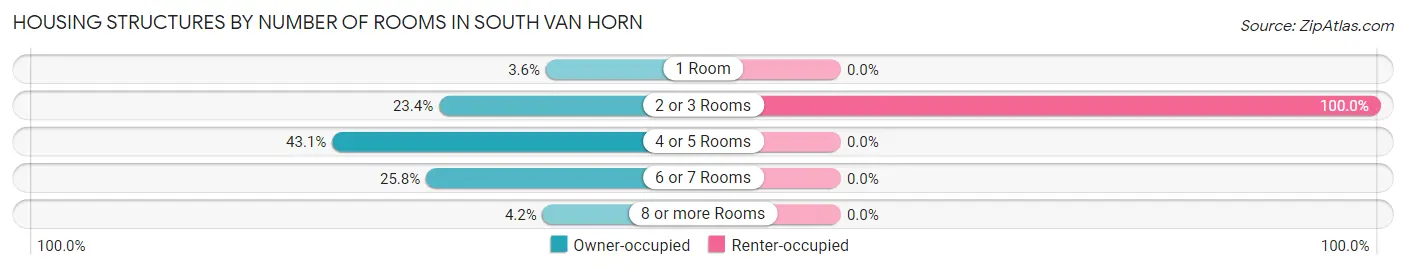
| Number of Rooms | Owner-occupied | Renter-occupied |
| 1 Room | 6 (3.6%) | 0 (0.0%) |
| 2 or 3 Rooms | 39 (23.4%) | 6 (100.0%) |
| 4 or 5 Rooms | 72 (43.1%) | 0 (0.0%) |
| 6 or 7 Rooms | 43 (25.8%) | 0 (0.0%) |
| 8 or more Rooms | 7 (4.2%) | 0 (0.0%) |
| Total | 167 (100.0%) | 6 (100.0%) |
Housing Structure by Heating Type in South Van Horn
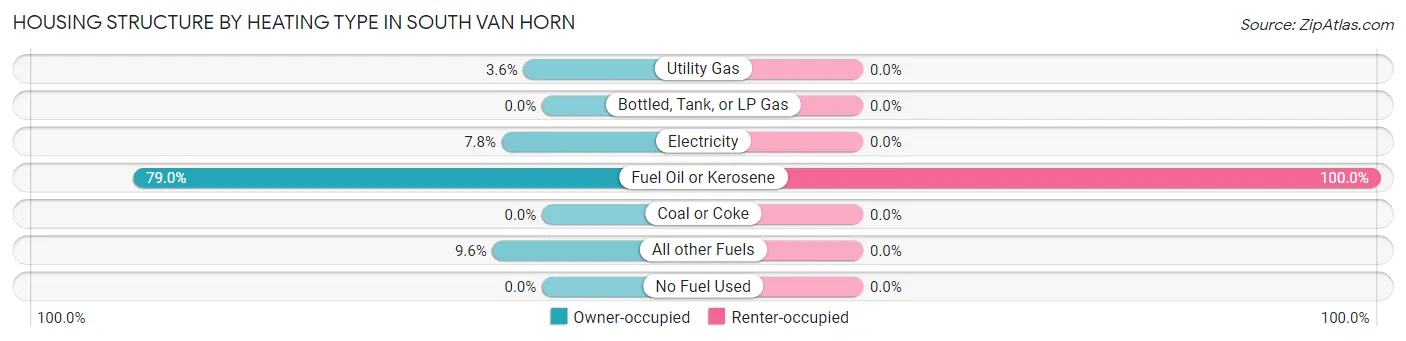
| Heating Type | Owner-occupied | Renter-occupied |
| Utility Gas | 6 (3.6%) | 0 (0.0%) |
| Bottled, Tank, or LP Gas | 0 (0.0%) | 0 (0.0%) |
| Electricity | 13 (7.8%) | 0 (0.0%) |
| Fuel Oil or Kerosene | 132 (79.0%) | 6 (100.0%) |
| Coal or Coke | 0 (0.0%) | 0 (0.0%) |
| All other Fuels | 16 (9.6%) | 0 (0.0%) |
| No Fuel Used | 0 (0.0%) | 0 (0.0%) |
| Total | 167 (100.0%) | 6 (100.0%) |
Household Vehicle Usage in South Van Horn
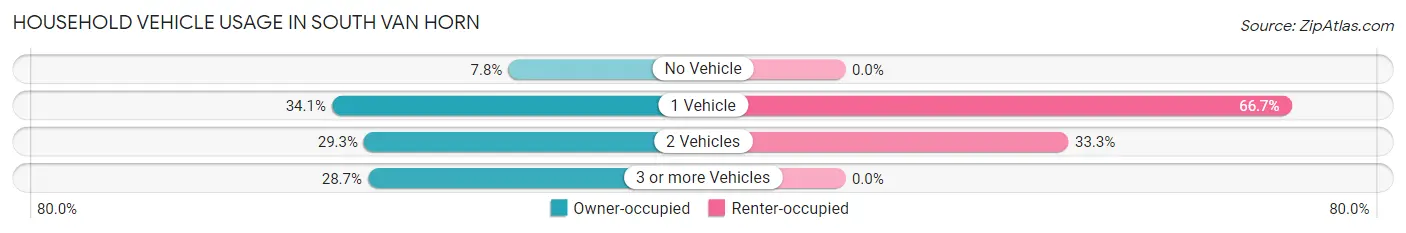
| Vehicles per Household | Owner-occupied | Renter-occupied |
| No Vehicle | 13 (7.8%) | 0 (0.0%) |
| 1 Vehicle | 57 (34.1%) | 4 (66.7%) |
| 2 Vehicles | 49 (29.3%) | 2 (33.3%) |
| 3 or more Vehicles | 48 (28.7%) | 0 (0.0%) |
| Total | 167 (100.0%) | 6 (100.0%) |
Real Estate & Mortgages in South Van Horn
Real Estate and Mortgage Overview in South Van Horn
| Characteristic | Without Mortgage | With Mortgage |
| Housing Units | 135 | 32 |
| Median Property Value | $14,800 | $327,300 |
| Median Household Income | $63,935 | $22 |
| Monthly Housing Costs | $716 | $8 |
| Real Estate Taxes | $291 | $0 |
Property Value by Mortgage Status in South Van Horn
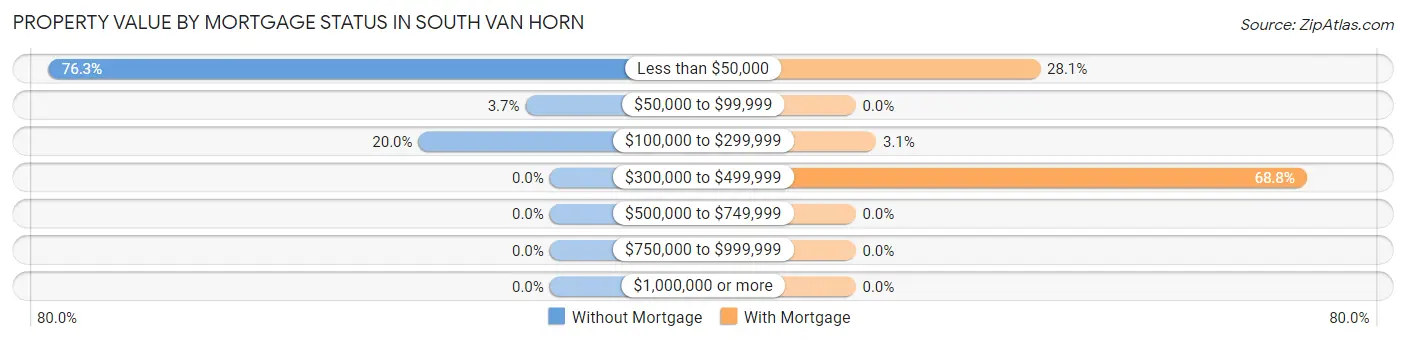
| Property Value | Without Mortgage | With Mortgage |
| Less than $50,000 | 103 (76.3%) | 9 (28.1%) |
| $50,000 to $99,999 | 5 (3.7%) | 0 (0.0%) |
| $100,000 to $299,999 | 27 (20.0%) | 1 (3.1%) |
| $300,000 to $499,999 | 0 (0.0%) | 22 (68.8%) |
| $500,000 to $749,999 | 0 (0.0%) | 0 (0.0%) |
| $750,000 to $999,999 | 0 (0.0%) | 0 (0.0%) |
| $1,000,000 or more | 0 (0.0%) | 0 (0.0%) |
| Total | 135 (100.0%) | 32 (100.0%) |
Household Income by Mortgage Status in South Van Horn
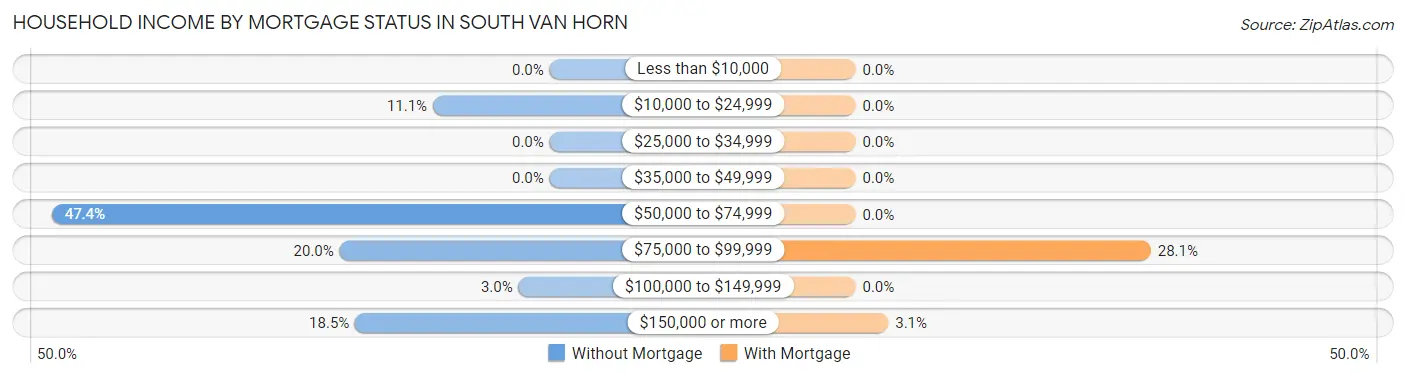
| Household Income | Without Mortgage | With Mortgage |
| Less than $10,000 | 0 (0.0%) | 0 (0.0%) |
| $10,000 to $24,999 | 15 (11.1%) | 0 (0.0%) |
| $25,000 to $34,999 | 0 (0.0%) | 0 (0.0%) |
| $35,000 to $49,999 | 0 (0.0%) | 0 (0.0%) |
| $50,000 to $74,999 | 64 (47.4%) | 0 (0.0%) |
| $75,000 to $99,999 | 27 (20.0%) | 9 (28.1%) |
| $100,000 to $149,999 | 4 (3.0%) | 0 (0.0%) |
| $150,000 or more | 25 (18.5%) | 1 (3.1%) |
| Total | 135 (100.0%) | 32 (100.0%) |
Property Value to Household Income Ratio in South Van Horn
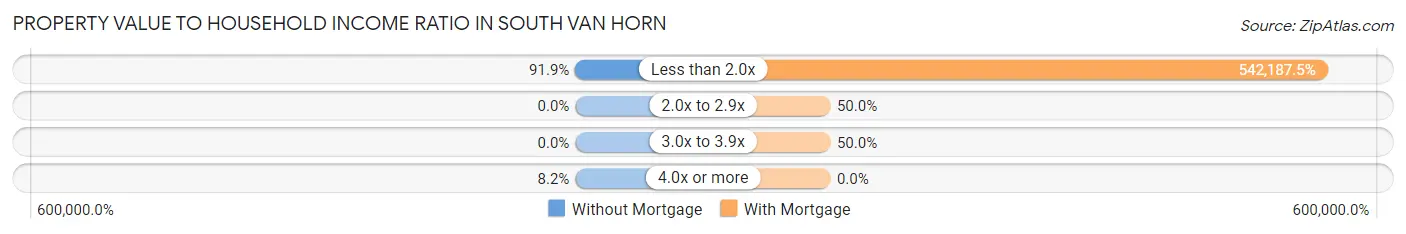
| Value-to-Income Ratio | Without Mortgage | With Mortgage |
| Less than 2.0x | 124 (91.8%) | 173,500 (542,187.5%) |
| 2.0x to 2.9x | 0 (0.0%) | 16 (50.0%) |
| 3.0x to 3.9x | 0 (0.0%) | 16 (50.0%) |
| 4.0x or more | 11 (8.2%) | 0 (0.0%) |
| Total | 135 (100.0%) | 32 (100.0%) |
Real Estate Taxes by Mortgage Status in South Van Horn
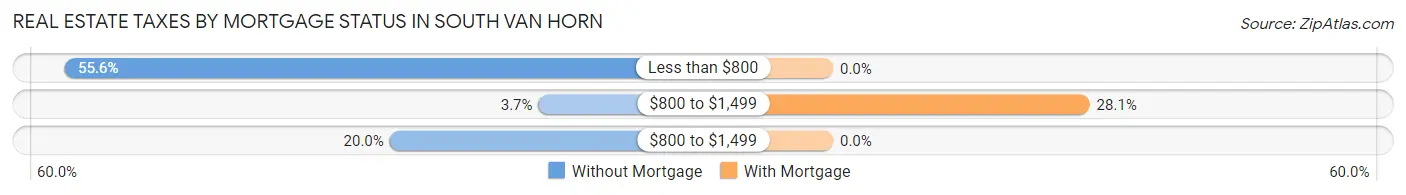
| Property Taxes | Without Mortgage | With Mortgage |
| Less than $800 | 75 (55.6%) | 0 (0.0%) |
| $800 to $1,499 | 5 (3.7%) | 9 (28.1%) |
| $800 to $1,499 | 27 (20.0%) | 0 (0.0%) |
| Total | 135 (100.0%) | 32 (100.0%) |
Health & Disability in South Van Horn
Health Insurance Coverage by Age in South Van Horn
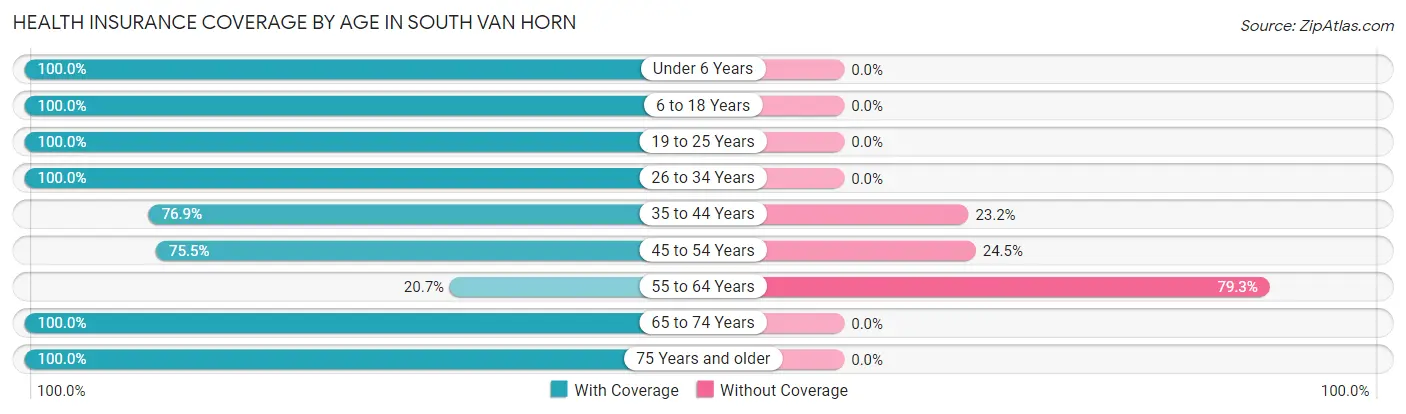
| Age Bracket | With Coverage | Without Coverage |
| Under 6 Years | 28 (100.0%) | 0 (0.0%) |
| 6 to 18 Years | 128 (100.0%) | 0 (0.0%) |
| 19 to 25 Years | 8 (100.0%) | 0 (0.0%) |
| 26 to 34 Years | 40 (100.0%) | 0 (0.0%) |
| 35 to 44 Years | 83 (76.8%) | 25 (23.2%) |
| 45 to 54 Years | 40 (75.5%) | 13 (24.5%) |
| 55 to 64 Years | 6 (20.7%) | 23 (79.3%) |
| 65 to 74 Years | 70 (100.0%) | 0 (0.0%) |
| 75 Years and older | 14 (100.0%) | 0 (0.0%) |
| Total | 417 (87.2%) | 61 (12.8%) |
Health Insurance Coverage by Citizenship Status in South Van Horn
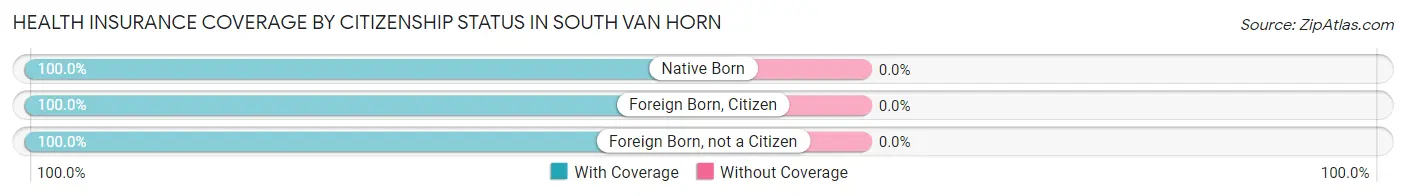
| Citizenship Status | With Coverage | Without Coverage |
| Native Born | 28 (100.0%) | 0 (0.0%) |
| Foreign Born, Citizen | 128 (100.0%) | 0 (0.0%) |
| Foreign Born, not a Citizen | 8 (100.0%) | 0 (0.0%) |
Health Insurance Coverage by Household Income in South Van Horn
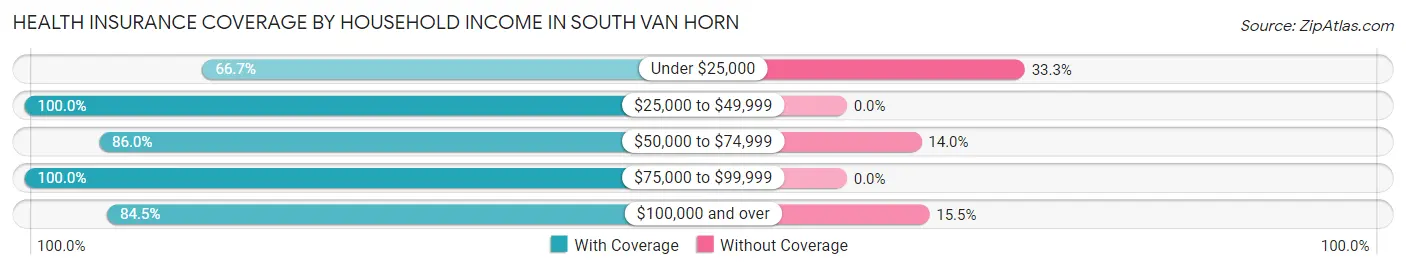
| Household Income | With Coverage | Without Coverage |
| Under $25,000 | 12 (66.7%) | 6 (33.3%) |
| $25,000 to $49,999 | 2 (100.0%) | 0 (0.0%) |
| $50,000 to $74,999 | 154 (86.0%) | 25 (14.0%) |
| $75,000 to $99,999 | 76 (100.0%) | 0 (0.0%) |
| $100,000 and over | 164 (84.5%) | 30 (15.5%) |
Public vs Private Health Insurance Coverage by Age in South Van Horn
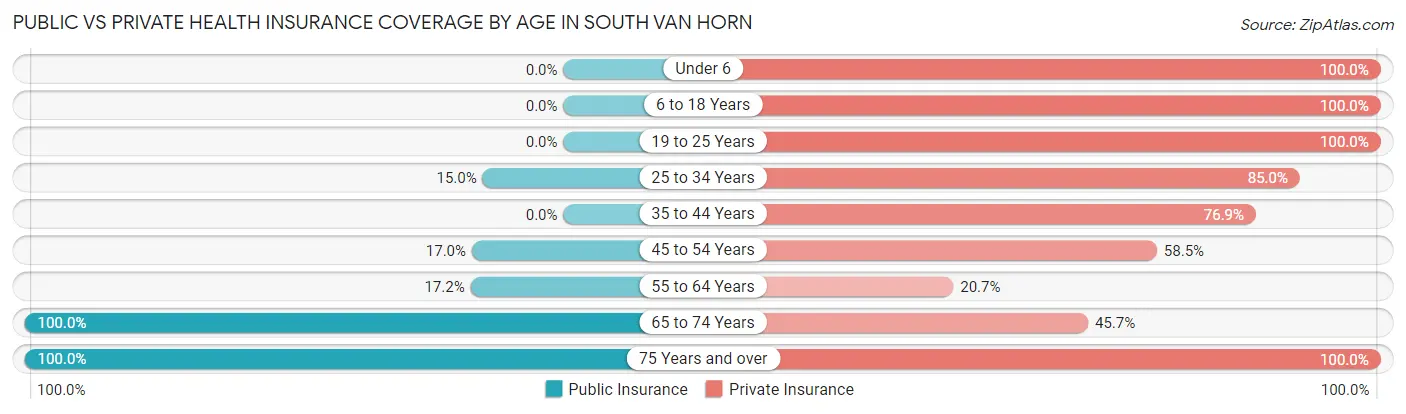
| Age Bracket | Public Insurance | Private Insurance |
| Under 6 | 0 (0.0%) | 28 (100.0%) |
| 6 to 18 Years | 0 (0.0%) | 128 (100.0%) |
| 19 to 25 Years | 0 (0.0%) | 8 (100.0%) |
| 25 to 34 Years | 6 (15.0%) | 34 (85.0%) |
| 35 to 44 Years | 0 (0.0%) | 83 (76.8%) |
| 45 to 54 Years | 9 (17.0%) | 31 (58.5%) |
| 55 to 64 Years | 5 (17.2%) | 6 (20.7%) |
| 65 to 74 Years | 70 (100.0%) | 32 (45.7%) |
| 75 Years and over | 14 (100.0%) | 14 (100.0%) |
| Total | 104 (21.8%) | 364 (76.1%) |
Disability Status by Sex by Age in South Van Horn
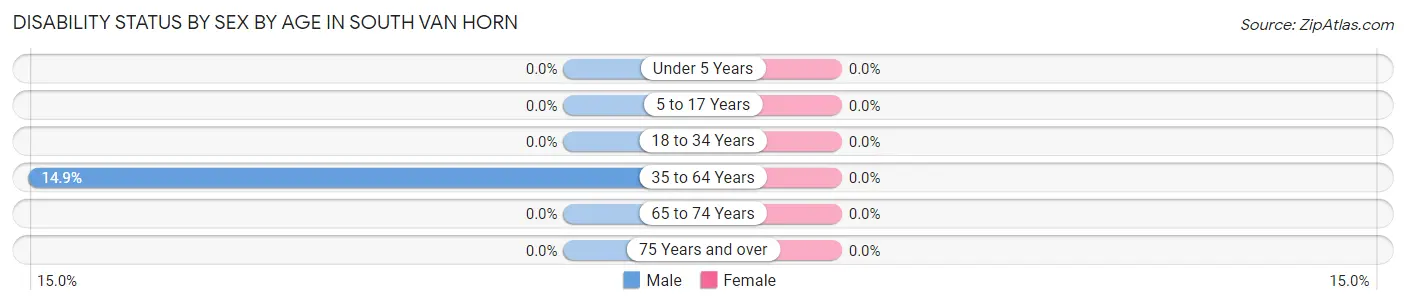
| Age Bracket | Male | Female |
| Under 5 Years | 0 (0.0%) | 0 (0.0%) |
| 5 to 17 Years | 0 (0.0%) | 0 (0.0%) |
| 18 to 34 Years | 0 (0.0%) | 0 (0.0%) |
| 35 to 64 Years | 14 (14.9%) | 0 (0.0%) |
| 65 to 74 Years | 0 (0.0%) | 0 (0.0%) |
| 75 Years and over | 0 (0.0%) | 0 (0.0%) |
Disability Class by Sex by Age in South Van Horn
Disability Class: Hearing Difficulty
| Age Bracket | Male | Female |
| Under 5 Years | 0 (0.0%) | 0 (0.0%) |
| 5 to 17 Years | 0 (0.0%) | 0 (0.0%) |
| 18 to 34 Years | 0 (0.0%) | 0 (0.0%) |
| 35 to 64 Years | 0 (0.0%) | 0 (0.0%) |
| 65 to 74 Years | 0 (0.0%) | 0 (0.0%) |
| 75 Years and over | 0 (0.0%) | 0 (0.0%) |
Disability Class: Vision Difficulty
| Age Bracket | Male | Female |
| Under 5 Years | 0 (0.0%) | 0 (0.0%) |
| 5 to 17 Years | 0 (0.0%) | 0 (0.0%) |
| 18 to 34 Years | 0 (0.0%) | 0 (0.0%) |
| 35 to 64 Years | 0 (0.0%) | 0 (0.0%) |
| 65 to 74 Years | 0 (0.0%) | 0 (0.0%) |
| 75 Years and over | 0 (0.0%) | 0 (0.0%) |
Disability Class: Cognitive Difficulty
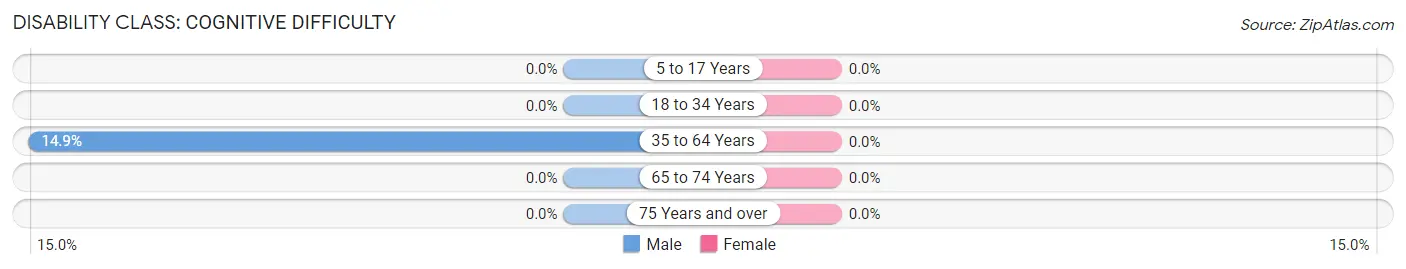
| Age Bracket | Male | Female |
| 5 to 17 Years | 0 (0.0%) | 0 (0.0%) |
| 18 to 34 Years | 0 (0.0%) | 0 (0.0%) |
| 35 to 64 Years | 14 (14.9%) | 0 (0.0%) |
| 65 to 74 Years | 0 (0.0%) | 0 (0.0%) |
| 75 Years and over | 0 (0.0%) | 0 (0.0%) |
Disability Class: Ambulatory Difficulty
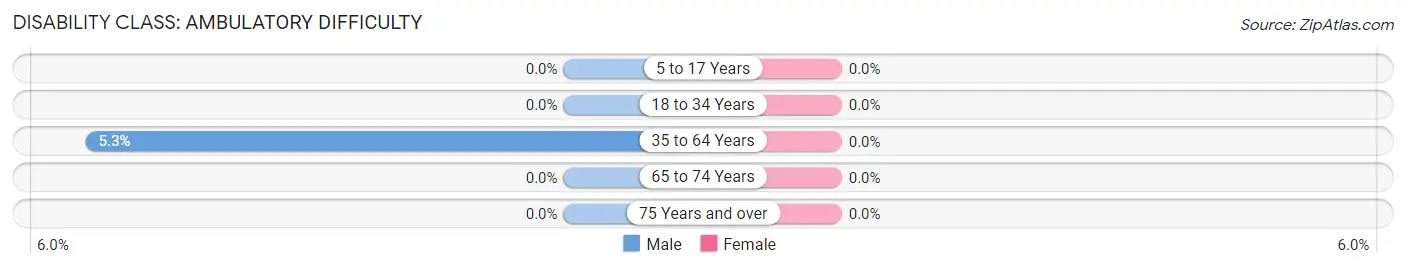
| Age Bracket | Male | Female |
| 5 to 17 Years | 0 (0.0%) | 0 (0.0%) |
| 18 to 34 Years | 0 (0.0%) | 0 (0.0%) |
| 35 to 64 Years | 5 (5.3%) | 0 (0.0%) |
| 65 to 74 Years | 0 (0.0%) | 0 (0.0%) |
| 75 Years and over | 0 (0.0%) | 0 (0.0%) |
Disability Class: Self-Care Difficulty
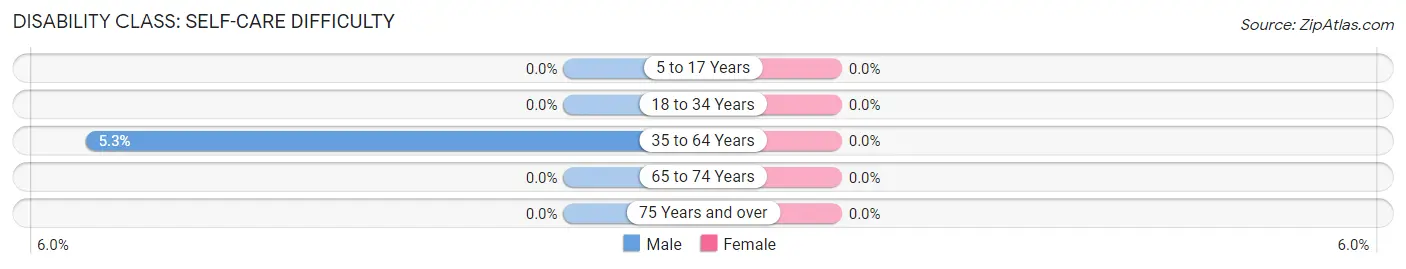
| Age Bracket | Male | Female |
| 5 to 17 Years | 0 (0.0%) | 0 (0.0%) |
| 18 to 34 Years | 0 (0.0%) | 0 (0.0%) |
| 35 to 64 Years | 5 (5.3%) | 0 (0.0%) |
| 65 to 74 Years | 0 (0.0%) | 0 (0.0%) |
| 75 Years and over | 0 (0.0%) | 0 (0.0%) |
Technology Access in South Van Horn
Computing Device Access in South Van Horn
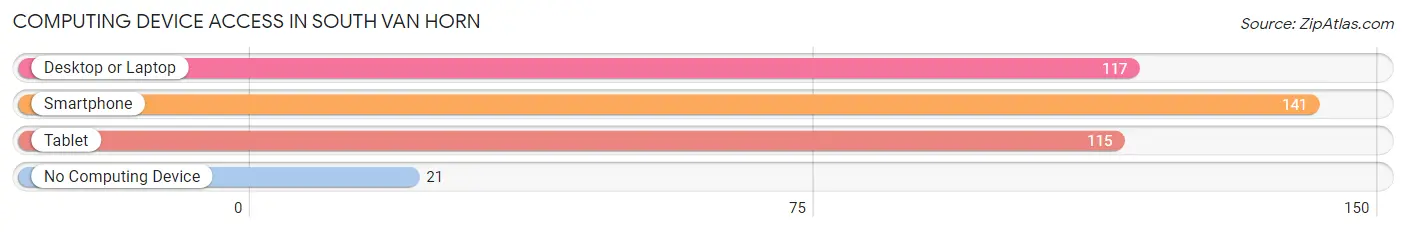
| Device Type | # Households | % Households |
| Desktop or Laptop | 117 | 67.6% |
| Smartphone | 141 | 81.5% |
| Tablet | 115 | 66.5% |
| No Computing Device | 21 | 12.1% |
| Total | 173 | 100.0% |
Internet Access in South Van Horn
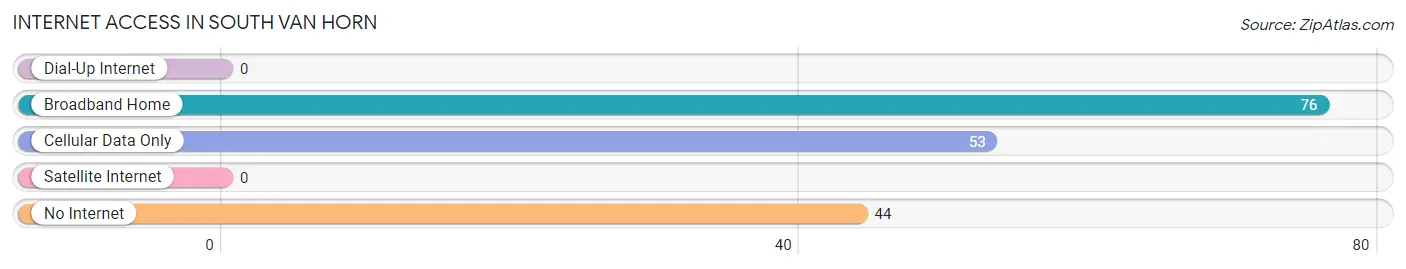
| Internet Type | # Households | % Households |
| Dial-Up Internet | 0 | 0.0% |
| Broadband Home | 76 | 43.9% |
| Cellular Data Only | 53 | 30.6% |
| Satellite Internet | 0 | 0.0% |
| No Internet | 44 | 25.4% |
| Total | 173 | 100.0% |
South Van Horn Summary
Van Horn is a small unincorporated community located in the Matanuska-Susitna Borough of Alaska. It is located on the south side of the Susitna River, approximately 25 miles northeast of Anchorage. The community is named after the Van Horn family, who were among the first settlers in the area.
History
The area around Van Horn has been inhabited for thousands of years by the Dena’ina Athabascan people. The Dena’ina were semi-nomadic, living off the land and trading with other tribes. The first European settlers arrived in the area in the late 1800s, and the Van Horn family was among the first to settle in the area. The family established a homestead and began farming and ranching in the area.
In the early 1900s, the Alaska Railroad was built through the area, connecting Anchorage to Fairbanks. This brought more settlers to the area, and the community of Van Horn began to grow. In the 1950s, the Alaska Highway was built, connecting Van Horn to the rest of Alaska. This allowed for increased trade and commerce in the area, and the population of Van Horn began to grow.
Geography
Van Horn is located in the Matanuska-Susitna Borough of Alaska. It is situated on the south side of the Susitna River, approximately 25 miles northeast of Anchorage. The community is surrounded by mountains and forests, and is located in a valley. The climate in Van Horn is mild, with temperatures ranging from the mid-30s in the winter to the mid-60s in the summer.
Economy
The economy of Van Horn is largely based on tourism and outdoor recreation. The area is popular for fishing, hunting, and camping, and there are several lodges and resorts in the area. The community also has a small retail sector, with several stores and restaurants.
Demographics
As of the 2010 census, the population of Van Horn was 545. The racial makeup of the community was 95.3% White, 0.7% Native American, 0.4% Asian, 0.2% Pacific Islander, and 3.4% from other races. The median household income in Van Horn was $50,000, and the median age was 37.
Conclusion
Van Horn is a small unincorporated community located in the Matanuska-Susitna Borough of Alaska. It has a long history, dating back to the first European settlers in the late 1800s. The economy of Van Horn is largely based on tourism and outdoor recreation, and the population of the community is 545, as of the 2010 census.
Common Questions
What is Per Capita Income in South Van Horn?
Per Capita income in South Van Horn is $39,560.
What is the Median Household income in South Van Horn?
Median Household Income in South Van Horn is $64,757.
What is Income or Wage Gap in South Van Horn?
Income or Wage Gap in South Van Horn is 65.3%.
Women in South Van Horn earn 34.7 cents for every dollar earned by a man.
What is Inequality or Gini Index in South Van Horn?
Inequality or Gini Index in South Van Horn is 0.34.
What is the Total Population of South Van Horn?
Total Population of South Van Horn is 478.
What is the Total Male Population of South Van Horn?
Total Male Population of South Van Horn is 260.
What is the Total Female Population of South Van Horn?
Total Female Population of South Van Horn is 218.
What is the Ratio of Males per 100 Females in South Van Horn?
There are 119.27 Males per 100 Females in South Van Horn.
What is the Ratio of Females per 100 Males in South Van Horn?
There are 83.85 Females per 100 Males in South Van Horn.
What is the Median Population Age in South Van Horn?
Median Population Age in South Van Horn is 37.7 Years.
What is the Average Family Size in South Van Horn
Average Family Size in South Van Horn is 3.5 People.
What is the Average Household Size in South Van Horn
Average Household Size in South Van Horn is 2.7 People.
How Large is the Labor Force in South Van Horn?
There are 221 People in the Labor Forcein in South Van Horn.
What is the Percentage of People in the Labor Force in South Van Horn?
66.0% of People are in the Labor Force in South Van Horn.
What is the Unemployment Rate in South Van Horn?
Unemployment Rate in South Van Horn is 5.9%.