Big Delta, AK Map & Demographics
Big Delta Map
Big Delta Overview
$32,177
PER CAPITA INCOME
$96,708
AVG FAMILY INCOME
$96,125
AVG HOUSEHOLD INCOME
16.4%
WAGE / INCOME GAP [ % ]
83.6¢/ $1
WAGE / INCOME GAP [ $ ]
0.31
INEQUALITY / GINI INDEX
545
TOTAL POPULATION
336
MALE POPULATION
209
FEMALE POPULATION
160.77
MALES / 100 FEMALES
62.20
FEMALES / 100 MALES
54.4
MEDIAN AGE
3.6
AVG FAMILY SIZE
2.8
AVG HOUSEHOLD SIZE
243
LABOR FORCE [ PEOPLE ]
53.1%
PERCENT IN LABOR FORCE
24.7%
UNEMPLOYMENT RATE
Income in Big Delta
Income Overview in Big Delta
Per Capita Income in Big Delta is $32,177, while median incomes of families and households are $96,708 and $96,125 respectively.
| Characteristic | Number | Measure |
| Per Capita Income | 545 | $32,177 |
| Median Family Income | 135 | $96,708 |
| Mean Family Income | 135 | $101,362 |
| Median Household Income | 195 | $96,125 |
| Mean Household Income | 195 | $87,670 |
| Income Deficit | 135 | $0 |
| Wage / Income Gap (%) | 545 | 16.42% |
| Wage / Income Gap ($) | 545 | 83.58¢ per $1 |
| Gini / Inequality Index | 545 | 0.31 |
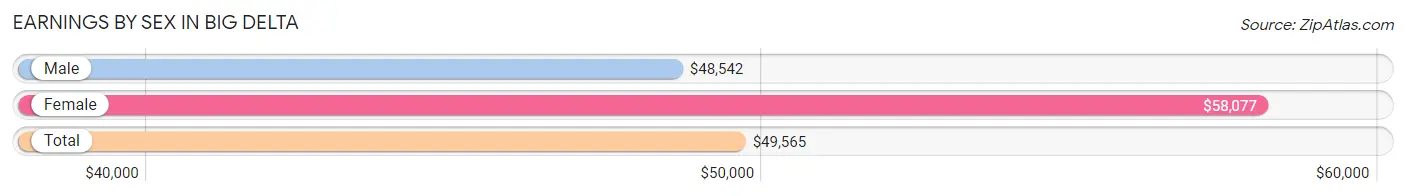
Earnings by Sex in Big Delta
Average Earnings in Big Delta are $49,565, $48,542 for men and $58,077 for women, a difference of 16.4%.
| Sex | Number | Average Earnings |
| Male | 136 (66.7%) | $48,542 |
| Female | 68 (33.3%) | $58,077 |
| Total | 204 (100.0%) | $49,565 |
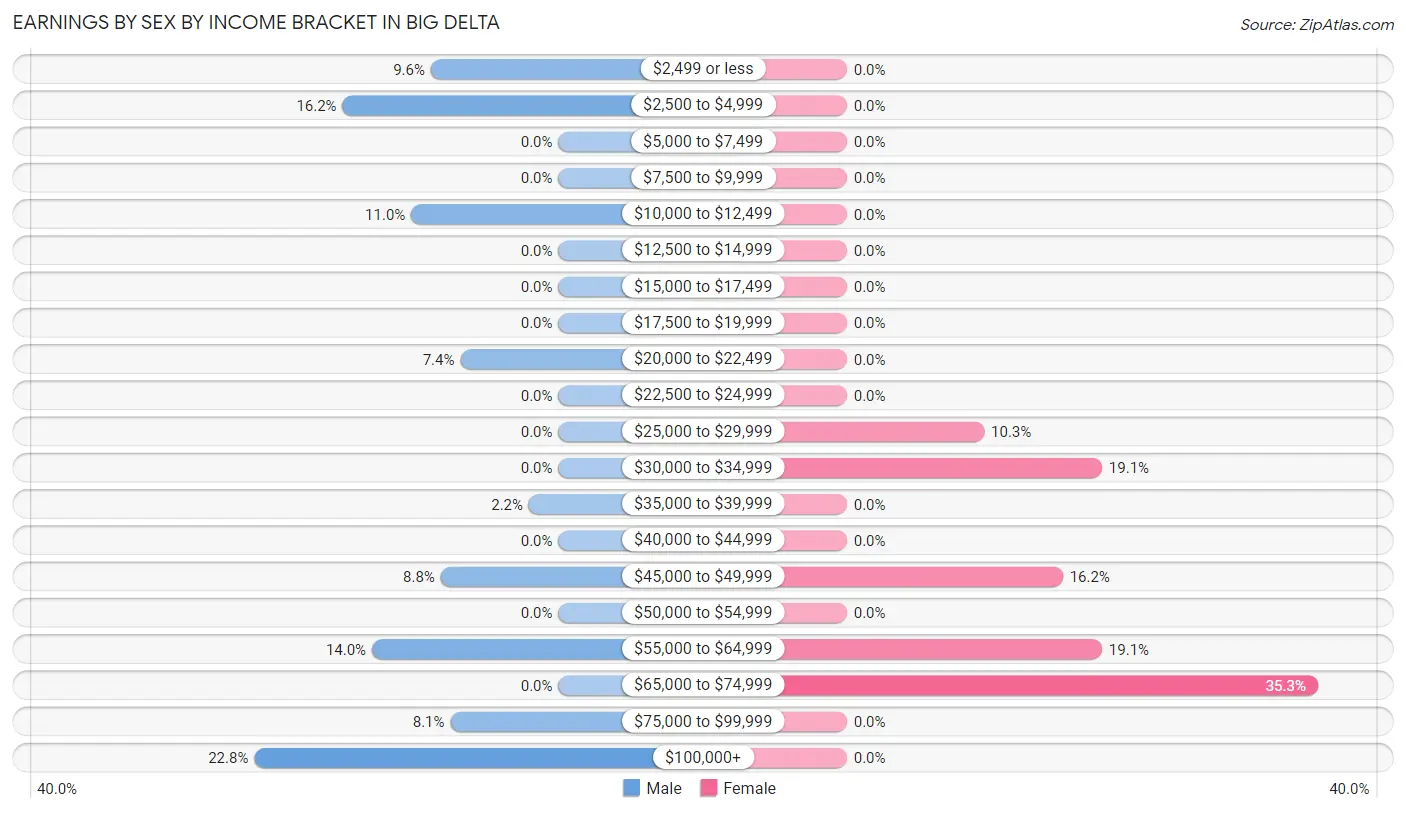
Earnings by Sex by Income Bracket in Big Delta
The most common earnings brackets in Big Delta are $100,000+ for men (31 | 22.8%) and $65,000 to $74,999 for women (24 | 35.3%).
| Income | Male | Female |
| $2,499 or less | 13 (9.6%) | 0 (0.0%) |
| $2,500 to $4,999 | 22 (16.2%) | 0 (0.0%) |
| $5,000 to $7,499 | 0 (0.0%) | 0 (0.0%) |
| $7,500 to $9,999 | 0 (0.0%) | 0 (0.0%) |
| $10,000 to $12,499 | 15 (11.0%) | 0 (0.0%) |
| $12,500 to $14,999 | 0 (0.0%) | 0 (0.0%) |
| $15,000 to $17,499 | 0 (0.0%) | 0 (0.0%) |
| $17,500 to $19,999 | 0 (0.0%) | 0 (0.0%) |
| $20,000 to $22,499 | 10 (7.3%) | 0 (0.0%) |
| $22,500 to $24,999 | 0 (0.0%) | 0 (0.0%) |
| $25,000 to $29,999 | 0 (0.0%) | 7 (10.3%) |
| $30,000 to $34,999 | 0 (0.0%) | 13 (19.1%) |
| $35,000 to $39,999 | 3 (2.2%) | 0 (0.0%) |
| $40,000 to $44,999 | 0 (0.0%) | 0 (0.0%) |
| $45,000 to $49,999 | 12 (8.8%) | 11 (16.2%) |
| $50,000 to $54,999 | 0 (0.0%) | 0 (0.0%) |
| $55,000 to $64,999 | 19 (14.0%) | 13 (19.1%) |
| $65,000 to $74,999 | 0 (0.0%) | 24 (35.3%) |
| $75,000 to $99,999 | 11 (8.1%) | 0 (0.0%) |
| $100,000+ | 31 (22.8%) | 0 (0.0%) |
| Total | 136 (100.0%) | 68 (100.0%) |
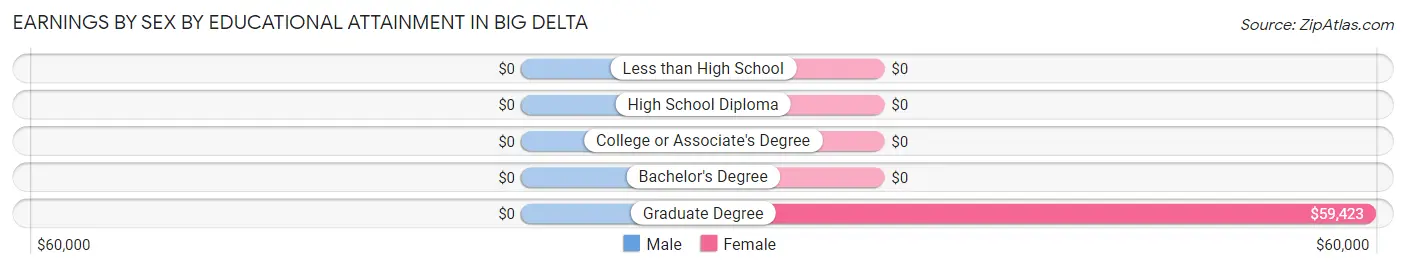
Earnings by Sex by Educational Attainment in Big Delta
| Educational Attainment | Male Income | Female Income |
| Less than High School | - | - |
| High School Diploma | - | - |
| College or Associate's Degree | - | - |
| Bachelor's Degree | - | - |
| Graduate Degree | - | - |
| Total | $59,250 | $58,077 |
Family Income in Big Delta
Family Income Brackets in Big Delta
According to the Big Delta family income data, there are 63 families falling into the $75,000 to $99,999 income range, which is the most common income bracket and makes up 46.7% of all families.
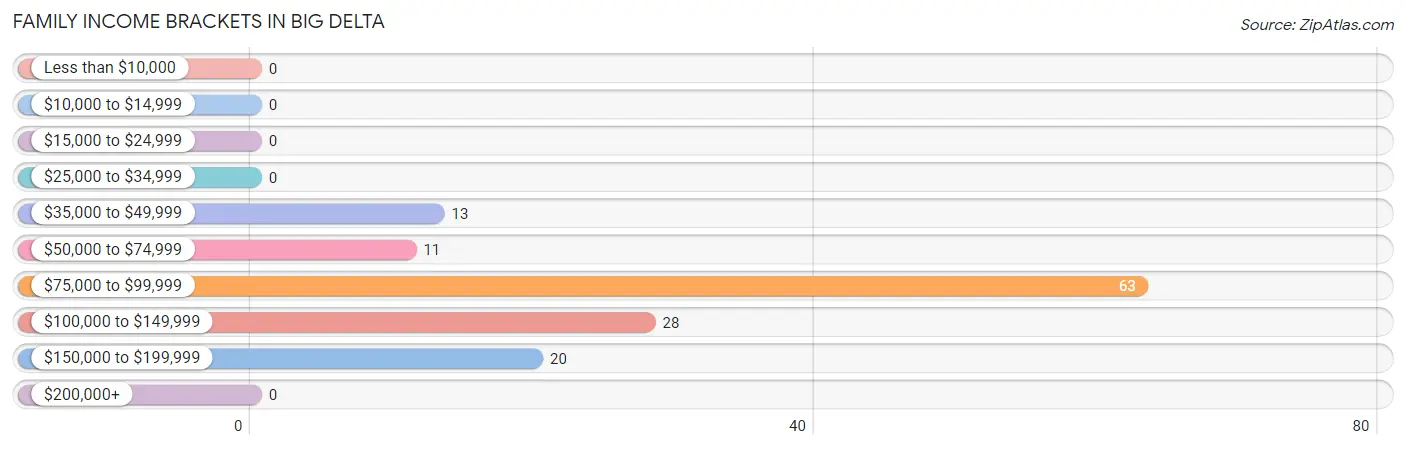
| Income Bracket | # Families | % Families |
| Less than $10,000 | 0 | 0.0% |
| $10,000 to $14,999 | 0 | 0.0% |
| $15,000 to $24,999 | 0 | 0.0% |
| $25,000 to $34,999 | 0 | 0.0% |
| $35,000 to $49,999 | 13 | 9.6% |
| $50,000 to $74,999 | 11 | 8.1% |
| $75,000 to $99,999 | 63 | 46.7% |
| $100,000 to $149,999 | 28 | 20.7% |
| $150,000 to $199,999 | 20 | 14.8% |
| $200,000+ | 0 | 0.0% |
Family Income by Famaliy Size in Big Delta
2-person families (100 | 74.1%) account for the highest median family income in Big Delta with $96,417 per family, while 2-person families (100 | 74.1%) have the highest median income of $48,208 per family member.
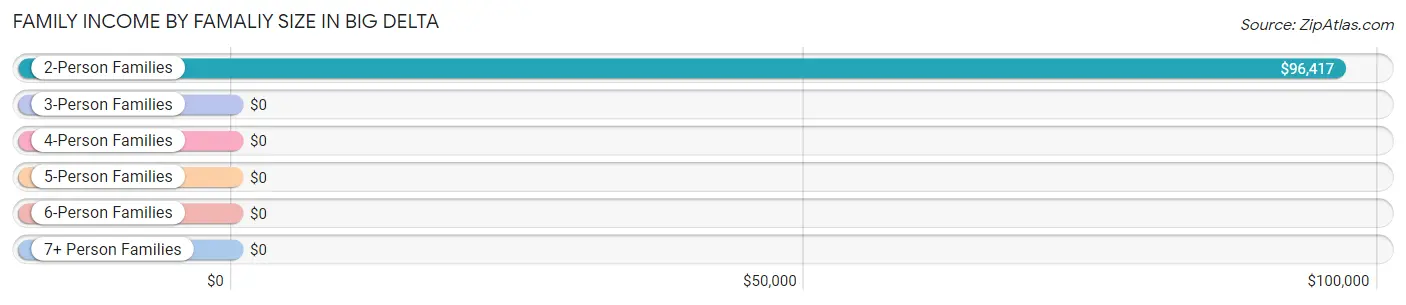
| Income Bracket | # Families | Median Income |
| 2-Person Families | 100 (74.1%) | $96,417 |
| 3-Person Families | 14 (10.4%) | $0 |
| 4-Person Families | 10 (7.4%) | $0 |
| 5-Person Families | 0 (0.0%) | $0 |
| 6-Person Families | 0 (0.0%) | $0 |
| 7+ Person Families | 11 (8.2%) | $0 |
| Total | 135 (100.0%) | $96,708 |
Family Income by Number of Earners in Big Delta
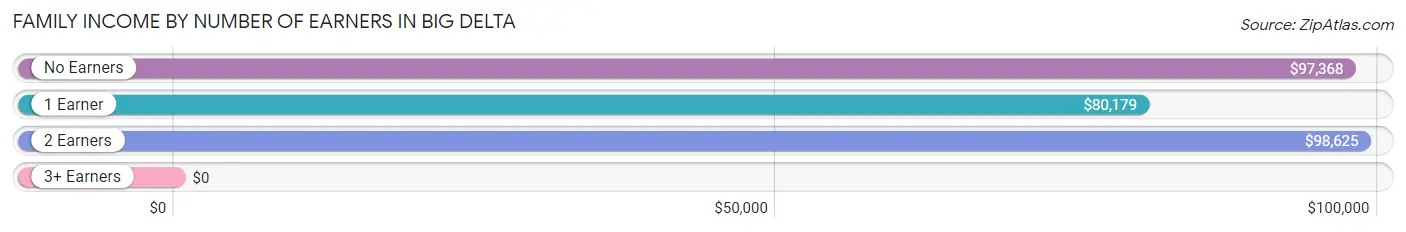
| Number of Earners | # Families | Median Income |
| No Earners | 36 (26.7%) | $97,368 |
| 1 Earner | 50 (37.0%) | $80,179 |
| 2 Earners | 49 (36.3%) | $98,625 |
| 3+ Earners | 0 (0.0%) | $0 |
| Total | 135 (100.0%) | $96,708 |
Household Income in Big Delta
Household Income Brackets in Big Delta
With 63 households falling in the category, the $75,000 to $99,999 income range is the most frequent in Big Delta, accounting for 32.3% of all households.
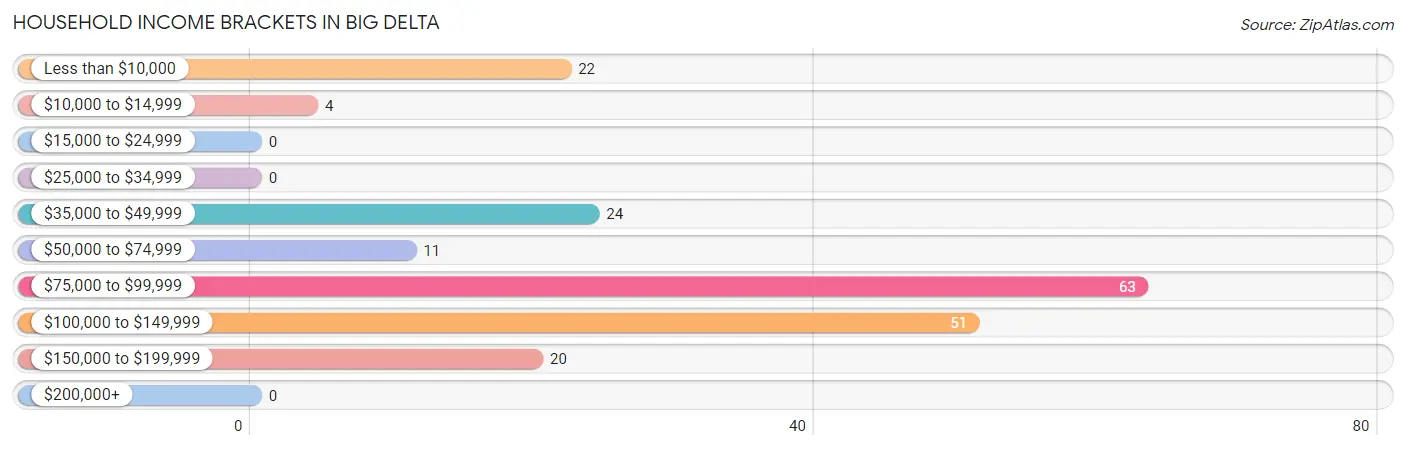
| Income Bracket | # Households | % Households |
| Less than $10,000 | 22 | 11.3% |
| $10,000 to $14,999 | 4 | 2.1% |
| $15,000 to $24,999 | 0 | 0.0% |
| $25,000 to $34,999 | 0 | 0.0% |
| $35,000 to $49,999 | 24 | 12.3% |
| $50,000 to $74,999 | 11 | 5.6% |
| $75,000 to $99,999 | 63 | 32.3% |
| $100,000 to $149,999 | 51 | 26.2% |
| $150,000 to $199,999 | 20 | 10.3% |
| $200,000+ | 0 | 0.0% |
Household Income by Householder Age in Big Delta
The median household income in Big Delta is $96,125, with the highest median household income of $97,434 found in the 65+ years age bracket for the primary householder. A total of 67 households (34.4%) fall into this category.
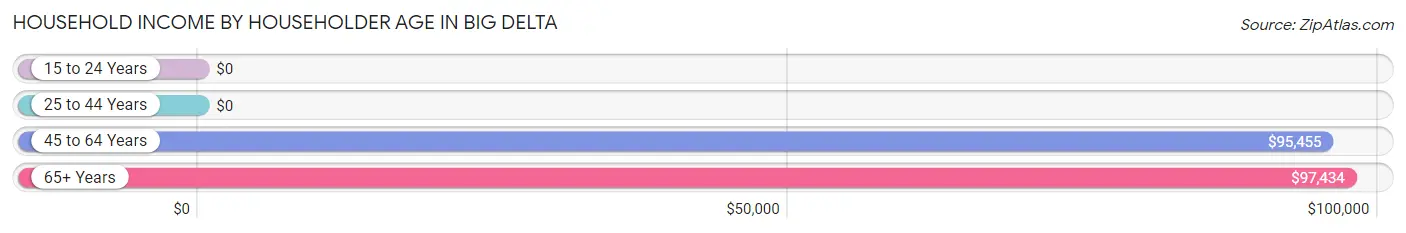
| Income Bracket | # Households | Median Income |
| 15 to 24 Years | 0 (0.0%) | $0 |
| 25 to 44 Years | 14 (7.2%) | $0 |
| 45 to 64 Years | 114 (58.5%) | $95,455 |
| 65+ Years | 67 (34.4%) | $97,434 |
| Total | 195 (100.0%) | $96,125 |
Poverty in Big Delta
Income Below Poverty by Sex and Age in Big Delta
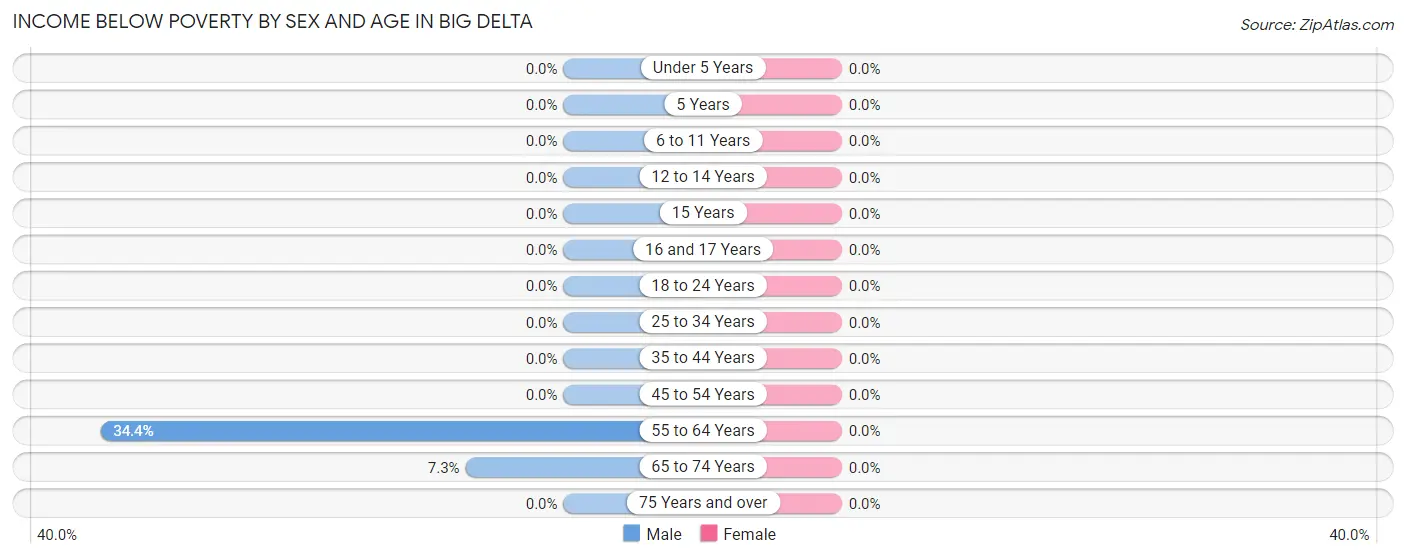
| Age Bracket | Male | Female |
| Under 5 Years | 0 (0.0%) | 0 (0.0%) |
| 5 Years | 0 (0.0%) | 0 (0.0%) |
| 6 to 11 Years | 0 (0.0%) | 0 (0.0%) |
| 12 to 14 Years | 0 (0.0%) | 0 (0.0%) |
| 15 Years | 0 (0.0%) | 0 (0.0%) |
| 16 and 17 Years | 0 (0.0%) | 0 (0.0%) |
| 18 to 24 Years | 0 (0.0%) | 0 (0.0%) |
| 25 to 34 Years | 0 (0.0%) | 0 (0.0%) |
| 35 to 44 Years | 0 (0.0%) | 0 (0.0%) |
| 45 to 54 Years | 0 (0.0%) | 0 (0.0%) |
| 55 to 64 Years | 22 (34.4%) | 0 (0.0%) |
| 65 to 74 Years | 4 (7.3%) | 0 (0.0%) |
| 75 Years and over | 0 (0.0%) | 0 (0.0%) |
| Total | 26 (7.7%) | 0 (0.0%) |
Income Above Poverty by Sex and Age in Big Delta
According to the poverty statistics in Big Delta, males aged under 5 years and females aged 12 to 14 years are the age groups that are most secure financially, with 100.0% of males and 100.0% of females in these age groups living above the poverty line.
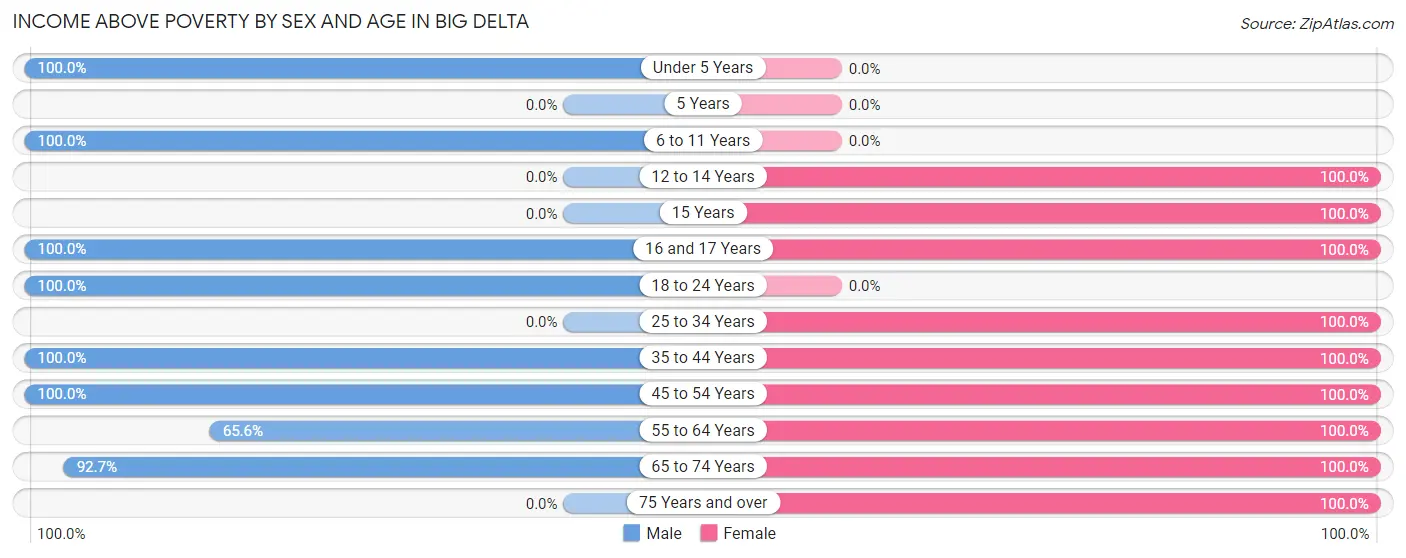
| Age Bracket | Male | Female |
| Under 5 Years | 22 (100.0%) | 0 (0.0%) |
| 5 Years | 0 (0.0%) | 0 (0.0%) |
| 6 to 11 Years | 23 (100.0%) | 0 (0.0%) |
| 12 to 14 Years | 0 (0.0%) | 28 (100.0%) |
| 15 Years | 0 (0.0%) | 14 (100.0%) |
| 16 and 17 Years | 25 (100.0%) | 11 (100.0%) |
| 18 to 24 Years | 67 (100.0%) | 0 (0.0%) |
| 25 to 34 Years | 0 (0.0%) | 10 (100.0%) |
| 35 to 44 Years | 15 (100.0%) | 14 (100.0%) |
| 45 to 54 Years | 65 (100.0%) | 13 (100.0%) |
| 55 to 64 Years | 42 (65.6%) | 60 (100.0%) |
| 65 to 74 Years | 51 (92.7%) | 48 (100.0%) |
| 75 Years and over | 0 (0.0%) | 11 (100.0%) |
| Total | 310 (92.3%) | 209 (100.0%) |
Income Below Poverty Among Married-Couple Families in Big Delta
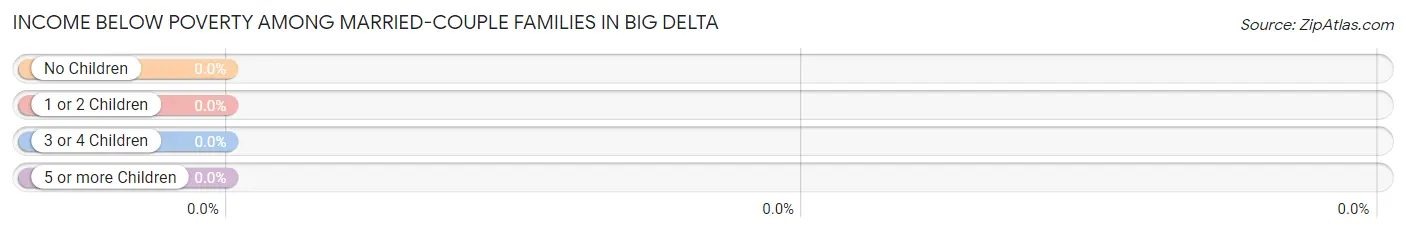
| Children | Above Poverty | Below Poverty |
| No Children | 91 (100.0%) | 0 (0.0%) |
| 1 or 2 Children | 10 (100.0%) | 0 (0.0%) |
| 3 or 4 Children | 11 (100.0%) | 0 (0.0%) |
| 5 or more Children | 0 (0.0%) | 0 (0.0%) |
| Total | 112 (100.0%) | 0 (0.0%) |
Income Below Poverty Among Single-Parent Households in Big Delta
| Children | Single Father | Single Mother |
| No Children | 0 (0.0%) | 0 (0.0%) |
| 1 or 2 Children | 0 (0.0%) | 0 (0.0%) |
| 3 or 4 Children | 0 (0.0%) | 0 (0.0%) |
| 5 or more Children | 0 (0.0%) | 0 (0.0%) |
| Total | 0 (0.0%) | 0 (0.0%) |
Income Below Poverty Among Married-Couple vs Single-Parent Households in Big Delta
| Children | Married-Couple Families | Single-Parent Households |
| No Children | 0 (0.0%) | 0 (0.0%) |
| 1 or 2 Children | 0 (0.0%) | 0 (0.0%) |
| 3 or 4 Children | 0 (0.0%) | 0 (0.0%) |
| 5 or more Children | 0 (0.0%) | 0 (0.0%) |
| Total | 0 (0.0%) | 0 (0.0%) |
Race in Big Delta
The most populous races in Big Delta are White / Caucasian (500 | 91.7%), Native / Alaskan (23 | 4.2%), and Two or more Races (22 | 4.0%).
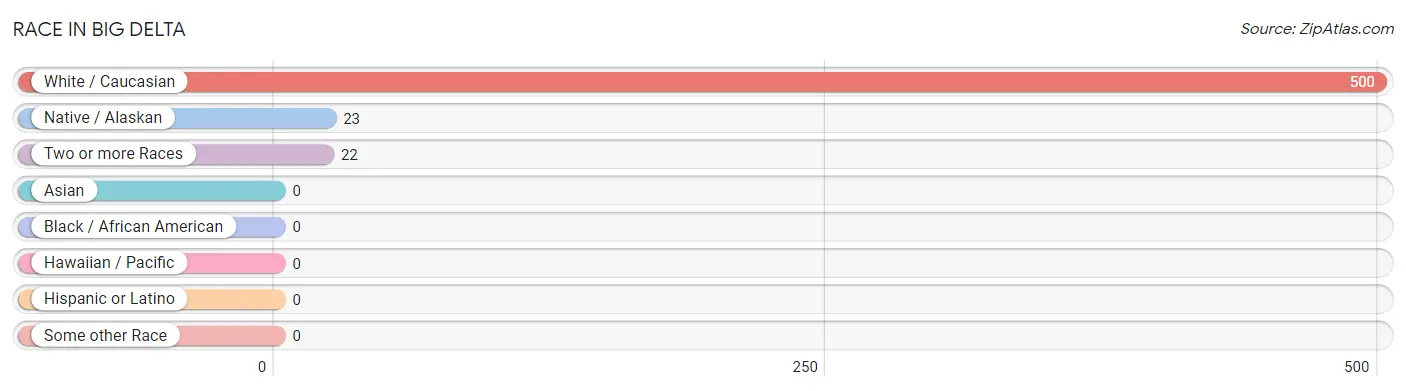
| Race | # Population | % Population |
| Asian | 0 | 0.0% |
| Black / African American | 0 | 0.0% |
| Hawaiian / Pacific | 0 | 0.0% |
| Hispanic or Latino | 0 | 0.0% |
| Native / Alaskan | 23 | 4.2% |
| White / Caucasian | 500 | 91.7% |
| Two or more Races | 22 | 4.0% |
| Some other Race | 0 | 0.0% |
| Total | 545 | 100.0% |
Ancestry in Big Delta
The most populous ancestries reported in Big Delta are Irish (123 | 22.6%), German (37 | 6.8%), Eastern European (26 | 4.8%), French (26 | 4.8%), and Scotch-Irish (25 | 4.6%), together accounting for 43.5% of all Big Delta residents.
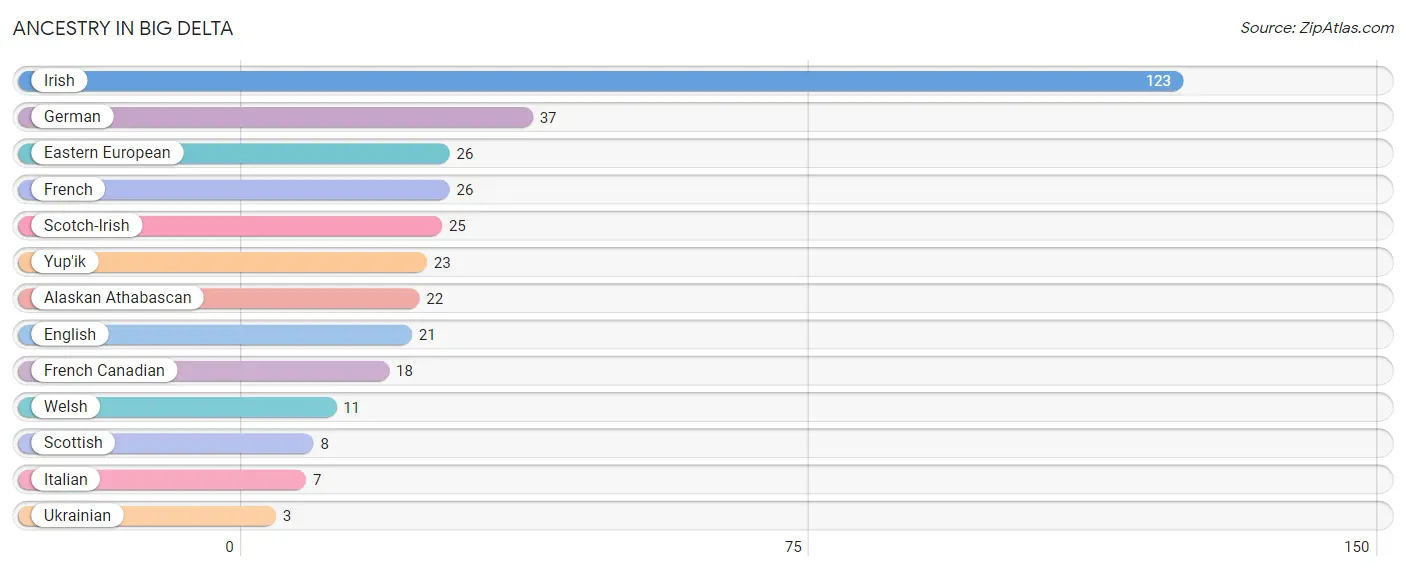
| Ancestry | # Population | % Population |
| Alaskan Athabascan | 22 | 4.0% |
| Eastern European | 26 | 4.8% |
| English | 21 | 3.8% |
| French | 26 | 4.8% |
| French Canadian | 18 | 3.3% |
| German | 37 | 6.8% |
| Irish | 123 | 22.6% |
| Italian | 7 | 1.3% |
| Scotch-Irish | 25 | 4.6% |
| Scottish | 8 | 1.5% |
| Ukrainian | 3 | 0.5% |
| Welsh | 11 | 2.0% |
| Yup'ik | 23 | 4.2% | View All 13 Rows |
Immigrants in Big Delta
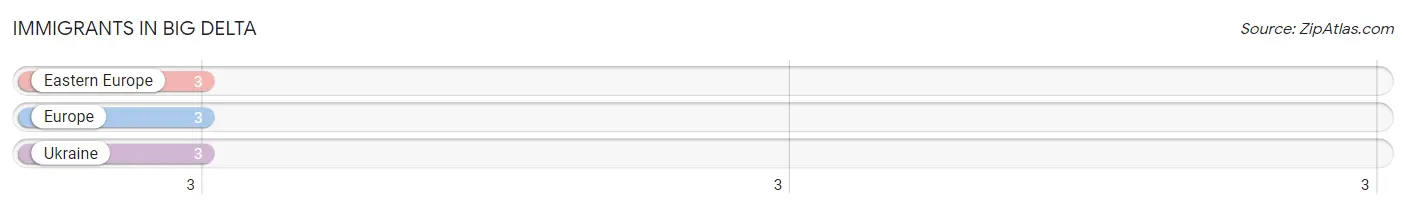
The most numerous immigrant groups reported in Big Delta came from Eastern Europe (3 | 0.5%), Europe (3 | 0.5%), and Ukraine (3 | 0.5%), together accounting for 1.7% of all Big Delta residents.
| Immigration Origin | # Population | % Population |
| Eastern Europe | 3 | 0.5% |
| Europe | 3 | 0.5% |
| Ukraine | 3 | 0.5% | View All 3 Rows |
Sex and Age in Big Delta
Sex and Age in Big Delta
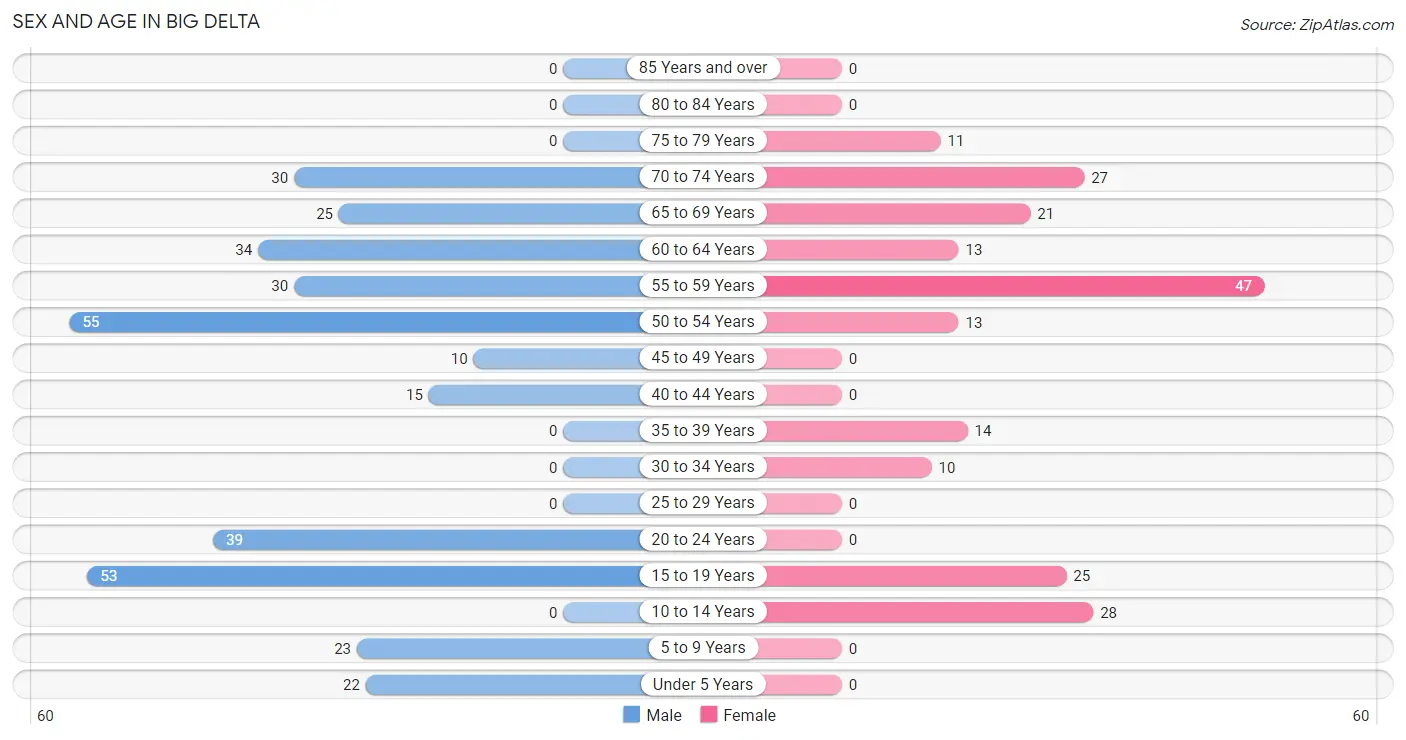
The most populous age groups in Big Delta are 50 to 54 Years (55 | 16.4%) for men and 55 to 59 Years (47 | 22.5%) for women.
| Age Bracket | Male | Female |
| Under 5 Years | 22 (6.6%) | 0 (0.0%) |
| 5 to 9 Years | 23 (6.9%) | 0 (0.0%) |
| 10 to 14 Years | 0 (0.0%) | 28 (13.4%) |
| 15 to 19 Years | 53 (15.8%) | 25 (12.0%) |
| 20 to 24 Years | 39 (11.6%) | 0 (0.0%) |
| 25 to 29 Years | 0 (0.0%) | 0 (0.0%) |
| 30 to 34 Years | 0 (0.0%) | 10 (4.8%) |
| 35 to 39 Years | 0 (0.0%) | 14 (6.7%) |
| 40 to 44 Years | 15 (4.5%) | 0 (0.0%) |
| 45 to 49 Years | 10 (3.0%) | 0 (0.0%) |
| 50 to 54 Years | 55 (16.4%) | 13 (6.2%) |
| 55 to 59 Years | 30 (8.9%) | 47 (22.5%) |
| 60 to 64 Years | 34 (10.1%) | 13 (6.2%) |
| 65 to 69 Years | 25 (7.4%) | 21 (10.1%) |
| 70 to 74 Years | 30 (8.9%) | 27 (12.9%) |
| 75 to 79 Years | 0 (0.0%) | 11 (5.3%) |
| 80 to 84 Years | 0 (0.0%) | 0 (0.0%) |
| 85 Years and over | 0 (0.0%) | 0 (0.0%) |
| Total | 336 (100.0%) | 209 (100.0%) |
Families and Households in Big Delta
Median Family Size in Big Delta
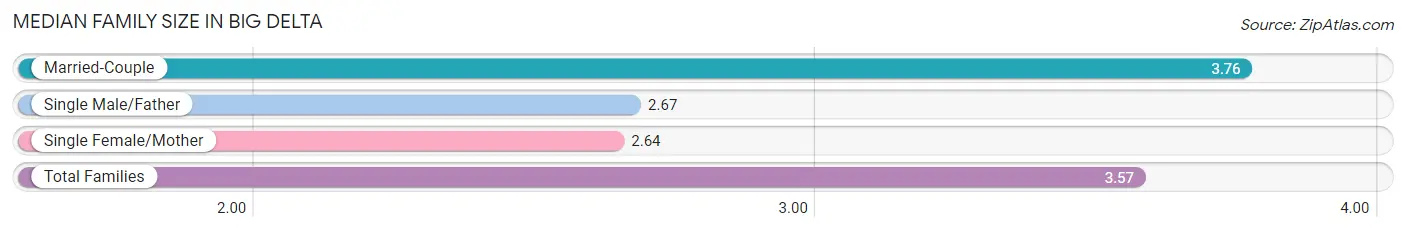
The median family size in Big Delta is 3.57 persons per family, with married-couple families (112 | 83.0%) accounting for the largest median family size of 3.76 persons per family. On the other hand, single female/mother families (14 | 10.4%) represent the smallest median family size with 2.64 persons per family.
| Family Type | # Families | Family Size |
| Married-Couple | 112 (83.0%) | 3.76 |
| Single Male/Father | 9 (6.7%) | 2.67 |
| Single Female/Mother | 14 (10.4%) | 2.64 |
| Total Families | 135 (100.0%) | 3.57 |
Median Household Size in Big Delta
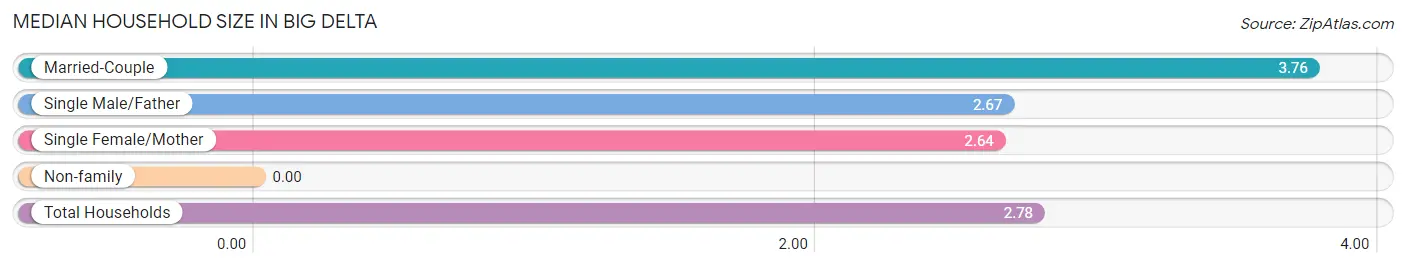
| Household Type | # Households | Household Size |
| Married-Couple | 112 (57.4%) | 3.76 |
| Single Male/Father | 9 (4.6%) | 2.67 |
| Single Female/Mother | 14 (7.2%) | 2.64 |
| Non-family | 60 (30.8%) | - |
| Total Households | 195 (100.0%) | 2.78 |
Household Size by Marriage Status in Big Delta
Out of a total of 195 households in Big Delta, 135 (69.2%) are family households, while 60 (30.8%) are nonfamily households. The most numerous type of family households are 2-person households, comprising 100, and the most common type of nonfamily households are 1-person households, comprising 60.
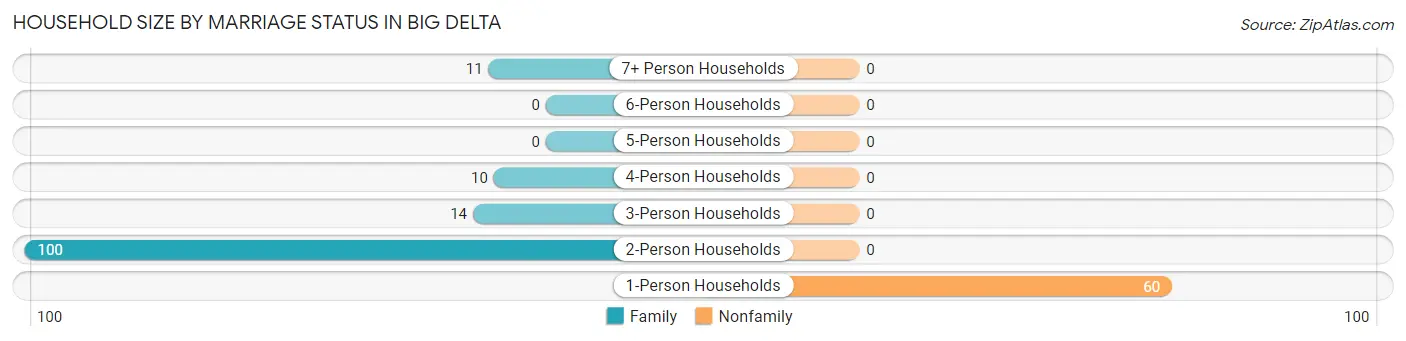
| Household Size | Family Households | Nonfamily Households |
| 1-Person Households | - | 60 (30.8%) |
| 2-Person Households | 100 (51.3%) | 0 (0.0%) |
| 3-Person Households | 14 (7.2%) | 0 (0.0%) |
| 4-Person Households | 10 (5.1%) | 0 (0.0%) |
| 5-Person Households | 0 (0.0%) | 0 (0.0%) |
| 6-Person Households | 0 (0.0%) | 0 (0.0%) |
| 7+ Person Households | 11 (5.6%) | 0 (0.0%) |
| Total | 135 (69.2%) | 60 (30.8%) |
Female Fertility in Big Delta
Fertility by Age in Big Delta
| Age Bracket | Women with Births | Births / 1,000 Women |
| 15 to 19 years | 0 (0.0%) | 0.0 |
| 20 to 34 years | 0 (0.0%) | 0.0 |
| 35 to 50 years | 0 (0.0%) | 0.0 |
| Total | 0 (0.0%) | 0.0 |
Fertility by Age by Marriage Status in Big Delta
| Age Bracket | Married | Unmarried |
| 15 to 19 years | 0 (0.0%) | 0 (0.0%) |
| 20 to 34 years | 0 (0.0%) | 0 (0.0%) |
| 35 to 50 years | 0 (0.0%) | 0 (0.0%) |
| Total | 0 (0.0%) | 0 (0.0%) |
Fertility by Education in Big Delta
| Educational Attainment | Women with Births | Births / 1,000 Women |
| Less than High School | 0 (0.0%) | 0.0 |
| High School Diploma | 0 (0.0%) | 0.0 |
| College or Associate's Degree | 0 (0.0%) | 0.0 |
| Bachelor's Degree | 0 (0.0%) | 0.0 |
| Graduate Degree | 0 (0.0%) | 0.0 |
| Total | 0 (0.0%) | 0.0 |
Fertility by Education by Marriage Status in Big Delta
| Educational Attainment | Married | Unmarried |
| Less than High School | 0 (0.0%) | 0 (0.0%) |
| High School Diploma | 0 (0.0%) | 0 (0.0%) |
| College or Associate's Degree | 0 (0.0%) | 0 (0.0%) |
| Bachelor's Degree | 0 (0.0%) | 0 (0.0%) |
| Graduate Degree | 0 (0.0%) | 0 (0.0%) |
| Total | 0 (0.0%) | 0 (0.0%) |
Employment Characteristics in Big Delta
Employment by Class of Employer in Big Delta
Among the 161 employed individuals in Big Delta, federal government employees (53 | 32.9%), self-employed (not incorporated) (44 | 27.3%), and private company employees (43 | 26.7%) make up the most common classes of employment.
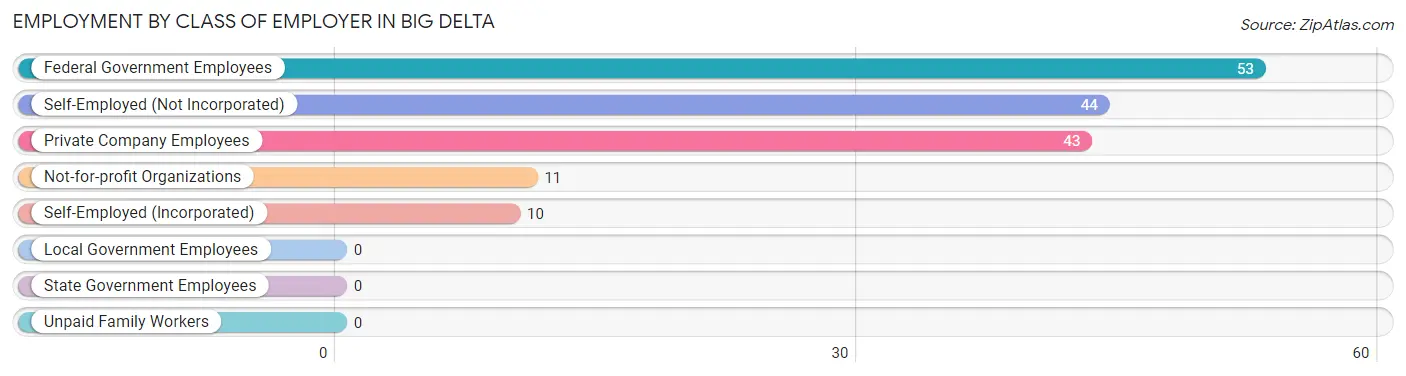
| Employer Class | # Employees | % Employees |
| Private Company Employees | 43 | 26.7% |
| Self-Employed (Incorporated) | 10 | 6.2% |
| Self-Employed (Not Incorporated) | 44 | 27.3% |
| Not-for-profit Organizations | 11 | 6.8% |
| Local Government Employees | 0 | 0.0% |
| State Government Employees | 0 | 0.0% |
| Federal Government Employees | 53 | 32.9% |
| Unpaid Family Workers | 0 | 0.0% |
| Total | 161 | 100.0% |
Employment Status by Age in Big Delta
According to the labor force statistics for Big Delta, out of the total population over 16 years of age (458), 53.1% or 243 individuals are in the labor force, with 24.7% or 60 of them unemployed. The age group with the highest labor force participation rate is 20 to 24 years, with 100.0% or 39 individuals in the labor force. Within the labor force, the 20 to 24 years age range has the highest percentage of unemployed individuals, with 100.0% or 39 of them being unemployed.
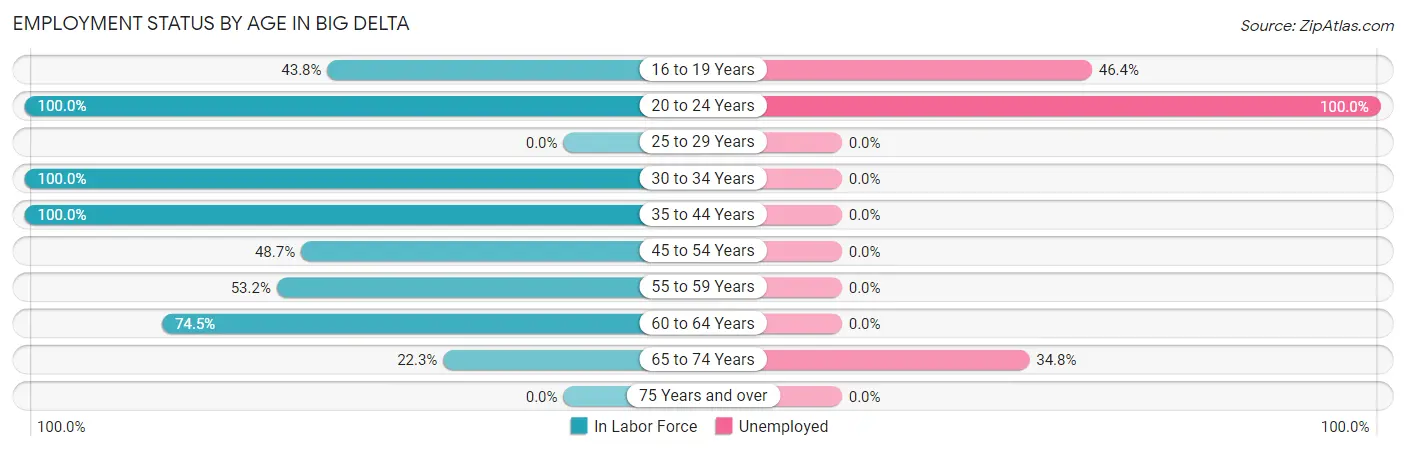
| Age Bracket | In Labor Force | Unemployed |
| 16 to 19 Years | 28 (43.8%) | 13 (46.4%) |
| 20 to 24 Years | 39 (100.0%) | 39 (100.0%) |
| 25 to 29 Years | 0 (0.0%) | 0 (0.0%) |
| 30 to 34 Years | 10 (100.0%) | 0 (0.0%) |
| 35 to 44 Years | 29 (100.0%) | 0 (0.0%) |
| 45 to 54 Years | 38 (48.7%) | 0 (0.0%) |
| 55 to 59 Years | 41 (53.2%) | 0 (0.0%) |
| 60 to 64 Years | 35 (74.5%) | 0 (0.0%) |
| 65 to 74 Years | 23 (22.3%) | 8 (34.8%) |
| 75 Years and over | 0 (0.0%) | 0 (0.0%) |
| Total | 243 (53.1%) | 60 (24.7%) |
Employment Status by Educational Attainment in Big Delta
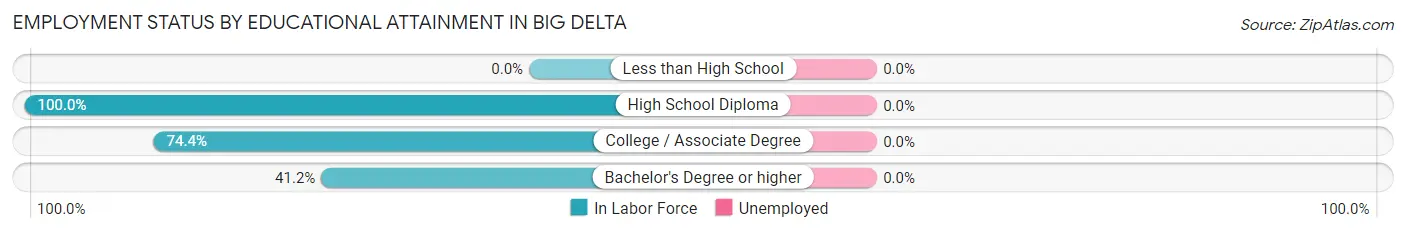
| Educational Attainment | In Labor Force | Unemployed |
| Less than High School | 0 (0.0%) | 0 (0.0%) |
| High School Diploma | 67 (100.0%) | 0 (0.0%) |
| College / Associate Degree | 32 (74.4%) | 0 (0.0%) |
| Bachelor's Degree or higher | 54 (41.2%) | 0 (0.0%) |
| Total | 153 (63.5%) | 0 (0.0%) |
Employment Occupations by Sex in Big Delta
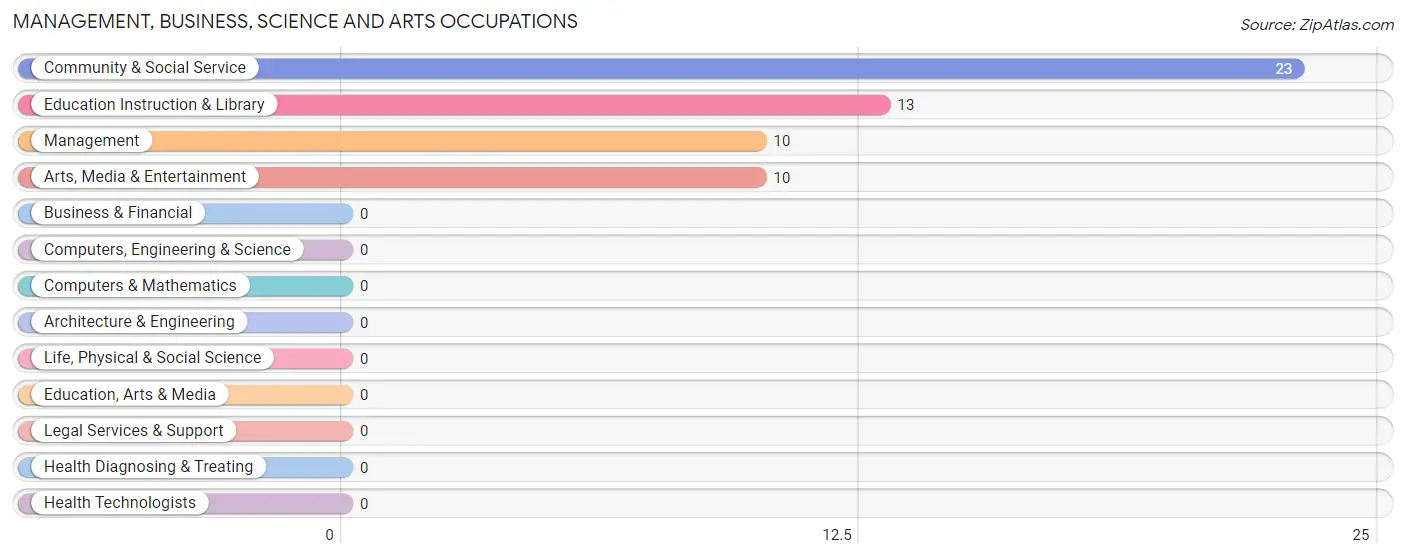
Management, Business, Science and Arts Occupations
The most common Management, Business, Science and Arts occupations in Big Delta are Community & Social Service (23 | 12.6%), Education Instruction & Library (13 | 7.1%), Management (10 | 5.5%), and Arts, Media & Entertainment (10 | 5.5%).
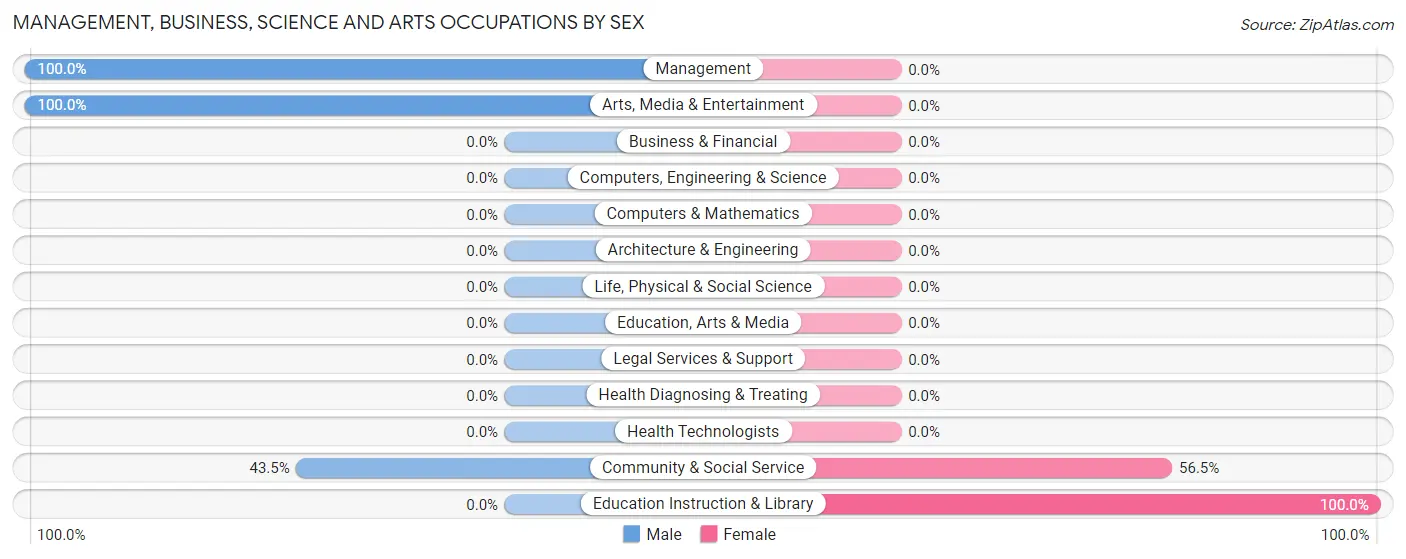
Management, Business, Science and Arts Occupations by Sex
Within the Management, Business, Science and Arts occupations in Big Delta, the most male-oriented occupations are Management (100.0%), Arts, Media & Entertainment (100.0%), and Community & Social Service (43.5%), while the most female-oriented occupations are Education Instruction & Library (100.0%), and Community & Social Service (56.5%).
| Occupation | Male | Female |
| Management | 10 (100.0%) | 0 (0.0%) |
| Business & Financial | 0 (0.0%) | 0 (0.0%) |
| Computers, Engineering & Science | 0 (0.0%) | 0 (0.0%) |
| Computers & Mathematics | 0 (0.0%) | 0 (0.0%) |
| Architecture & Engineering | 0 (0.0%) | 0 (0.0%) |
| Life, Physical & Social Science | 0 (0.0%) | 0 (0.0%) |
| Community & Social Service | 10 (43.5%) | 13 (56.5%) |
| Education, Arts & Media | 0 (0.0%) | 0 (0.0%) |
| Legal Services & Support | 0 (0.0%) | 0 (0.0%) |
| Education Instruction & Library | 0 (0.0%) | 13 (100.0%) |
| Arts, Media & Entertainment | 10 (100.0%) | 0 (0.0%) |
| Health Diagnosing & Treating | 0 (0.0%) | 0 (0.0%) |
| Health Technologists | 0 (0.0%) | 0 (0.0%) |
| Total (Category) | 20 (60.6%) | 13 (39.4%) |
| Total (Overall) | 115 (62.8%) | 68 (37.2%) |
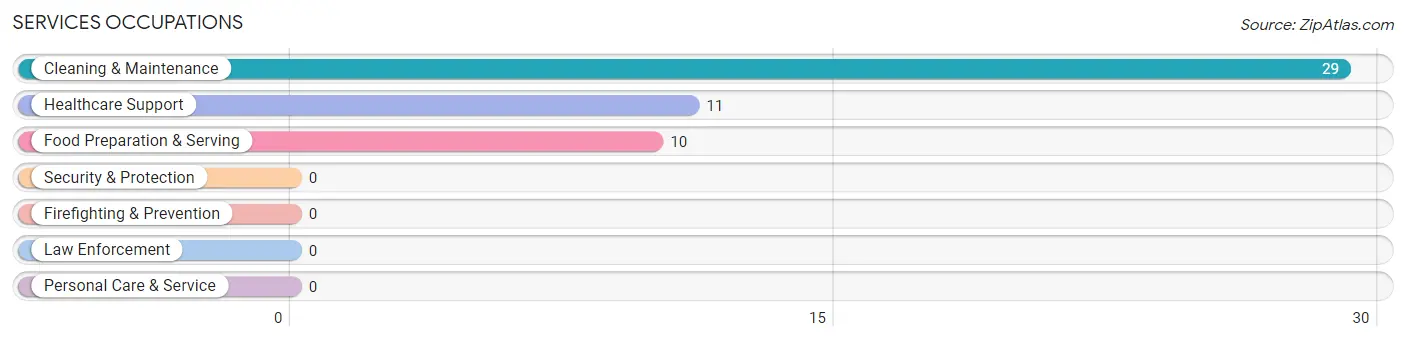
Services Occupations
The most common Services occupations in Big Delta are Cleaning & Maintenance (29 | 15.9%), Healthcare Support (11 | 6.0%), and Food Preparation & Serving (10 | 5.5%).
Services Occupations by Sex
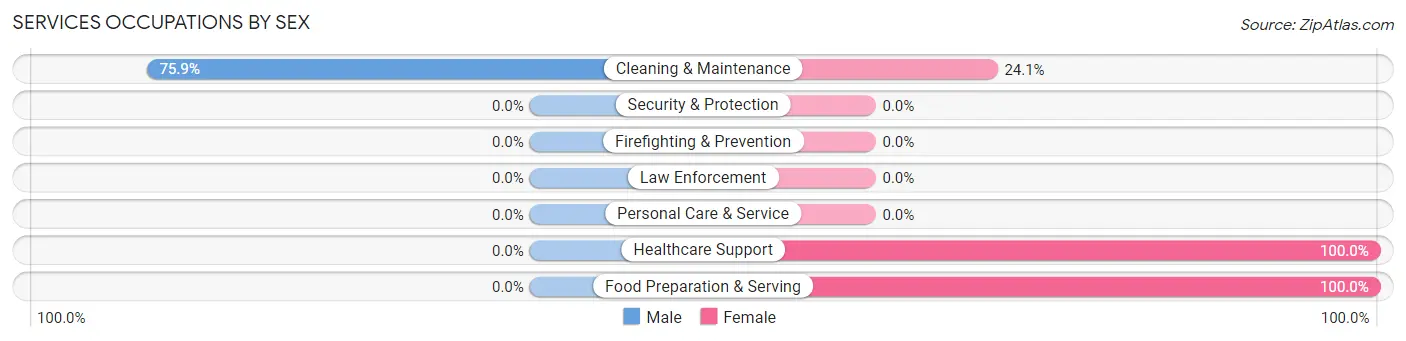
| Occupation | Male | Female |
| Healthcare Support | 0 (0.0%) | 11 (100.0%) |
| Security & Protection | 0 (0.0%) | 0 (0.0%) |
| Firefighting & Prevention | 0 (0.0%) | 0 (0.0%) |
| Law Enforcement | 0 (0.0%) | 0 (0.0%) |
| Food Preparation & Serving | 0 (0.0%) | 10 (100.0%) |
| Cleaning & Maintenance | 22 (75.9%) | 7 (24.1%) |
| Personal Care & Service | 0 (0.0%) | 0 (0.0%) |
| Total (Category) | 22 (44.0%) | 28 (56.0%) |
| Total (Overall) | 115 (62.8%) | 68 (37.2%) |
Sales and Office Occupations
The most common Sales and Office occupations in Big Delta are , and Office & Administration (27 | 14.7%).
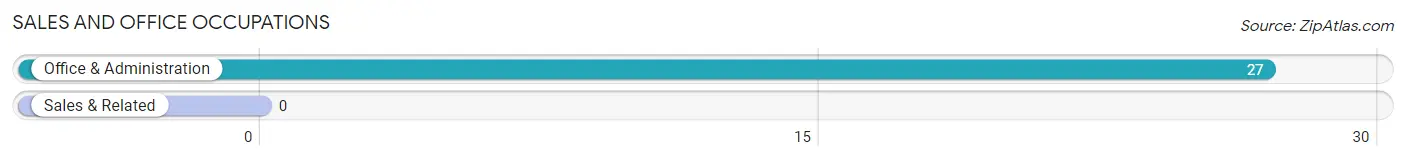
Sales and Office Occupations by Sex

| Occupation | Male | Female |
| Sales & Related | 0 (0.0%) | 0 (0.0%) |
| Office & Administration | 0 (0.0%) | 27 (100.0%) |
| Total (Category) | 0 (0.0%) | 27 (100.0%) |
| Total (Overall) | 115 (62.8%) | 68 (37.2%) |
Natural Resources, Construction and Maintenance Occupations
The most common Natural Resources, Construction and Maintenance occupations in Big Delta are Construction & Extraction (27 | 14.7%), and Installation, Maintenance & Repair (15 | 8.2%).
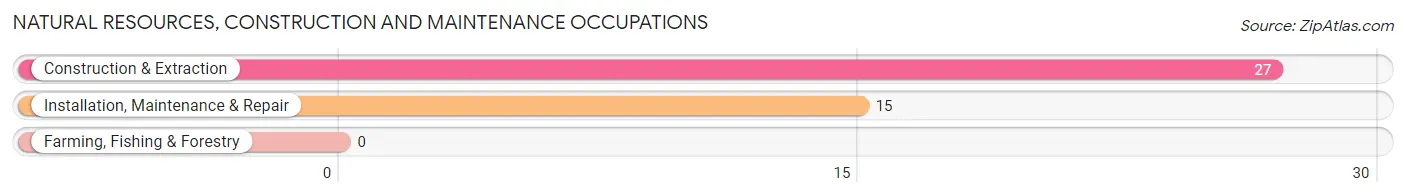
Natural Resources, Construction and Maintenance Occupations by Sex

| Occupation | Male | Female |
| Farming, Fishing & Forestry | 0 (0.0%) | 0 (0.0%) |
| Construction & Extraction | 27 (100.0%) | 0 (0.0%) |
| Installation, Maintenance & Repair | 15 (100.0%) | 0 (0.0%) |
| Total (Category) | 42 (100.0%) | 0 (0.0%) |
| Total (Overall) | 115 (62.8%) | 68 (37.2%) |
Production, Transportation and Moving Occupations
The most common Production, Transportation and Moving occupations in Big Delta are Transportation (28 | 15.3%), and Production (3 | 1.6%).
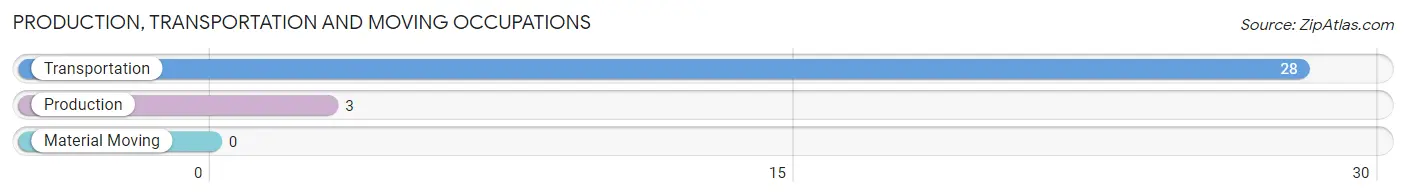
Production, Transportation and Moving Occupations by Sex
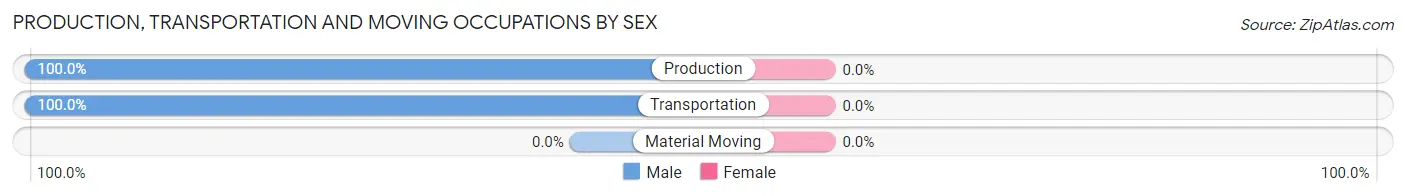
| Occupation | Male | Female |
| Production | 3 (100.0%) | 0 (0.0%) |
| Transportation | 28 (100.0%) | 0 (0.0%) |
| Material Moving | 0 (0.0%) | 0 (0.0%) |
| Total (Category) | 31 (100.0%) | 0 (0.0%) |
| Total (Overall) | 115 (62.8%) | 68 (37.2%) |
Employment Industries by Sex in Big Delta
Employment Industries in Big Delta
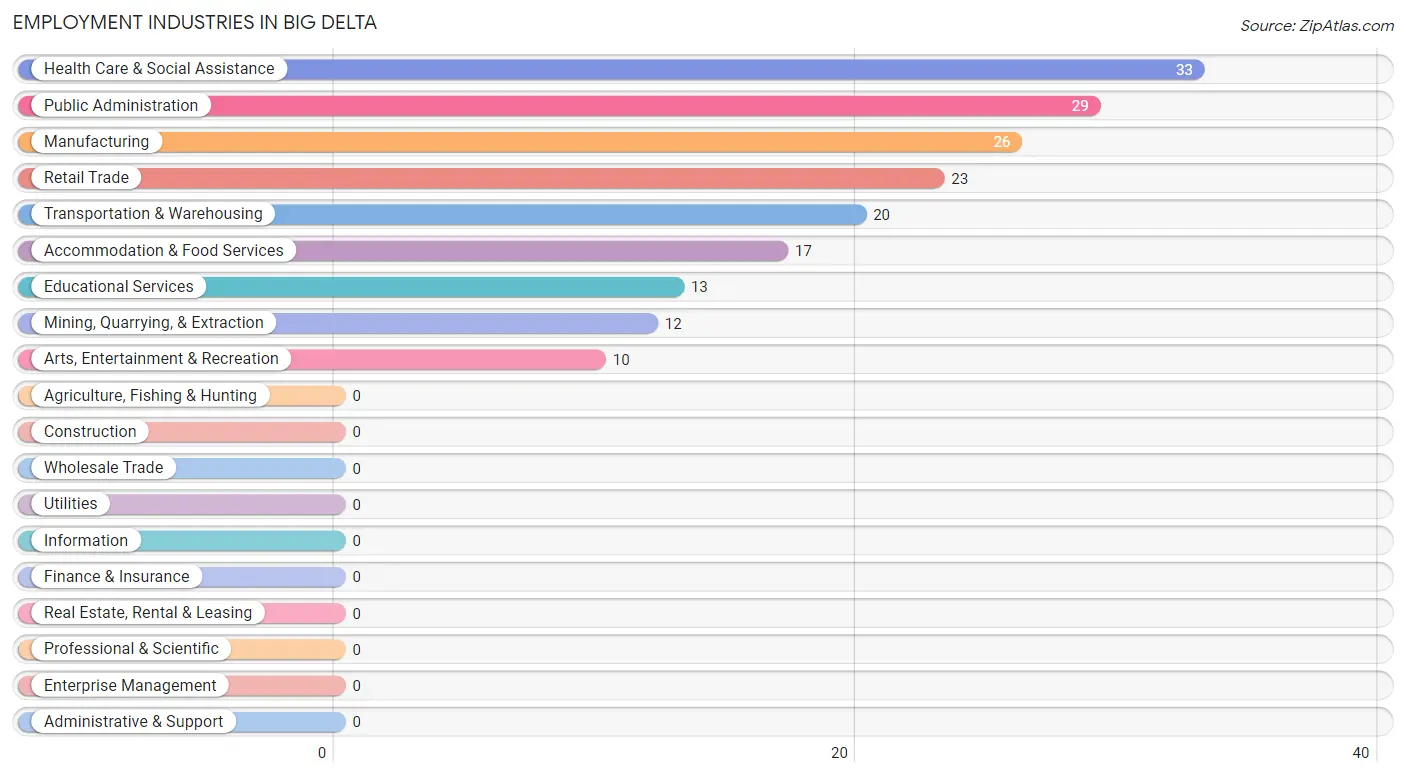
The major employment industries in Big Delta include Health Care & Social Assistance (33 | 18.0%), Public Administration (29 | 15.9%), Manufacturing (26 | 14.2%), Retail Trade (23 | 12.6%), and Transportation & Warehousing (20 | 10.9%).
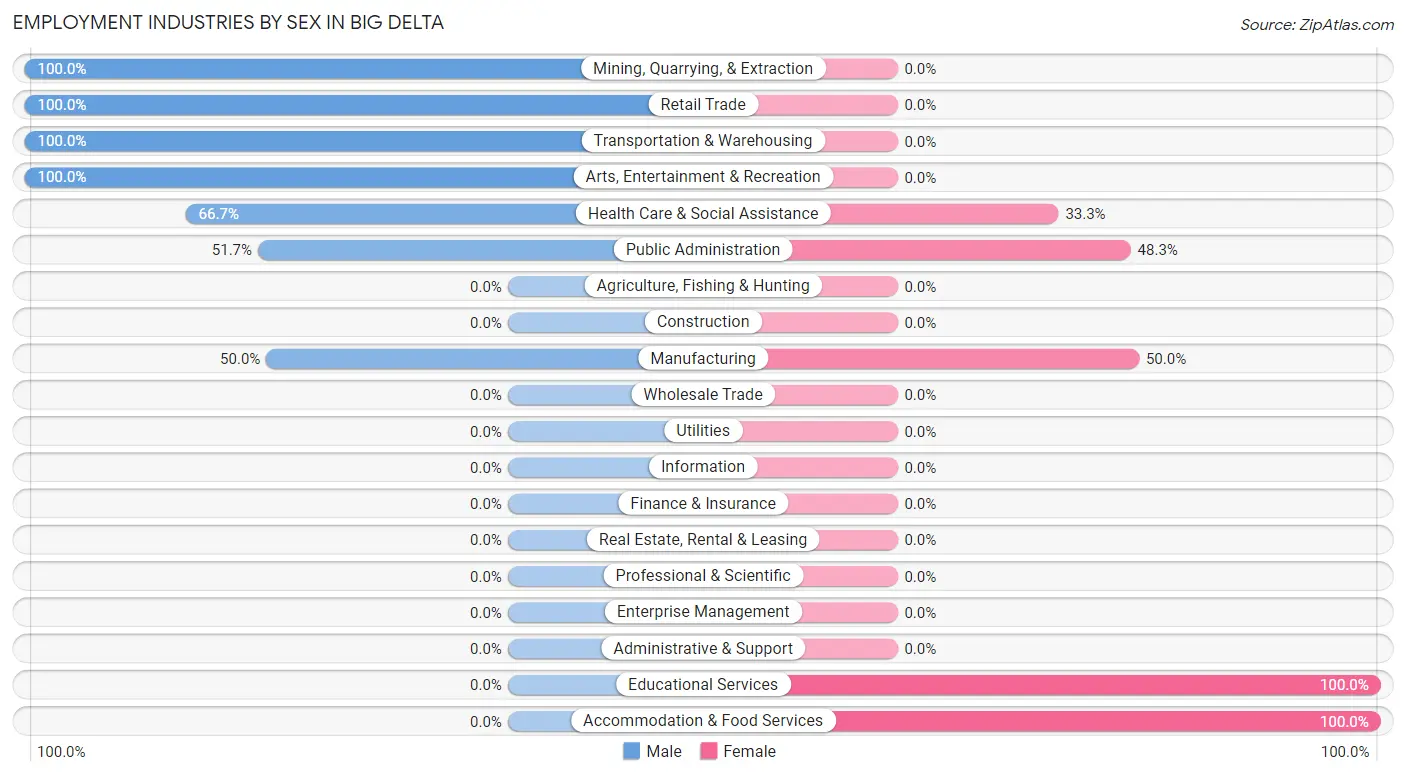
Employment Industries by Sex in Big Delta
The Big Delta industries that see more men than women are Mining, Quarrying, & Extraction (100.0%), Retail Trade (100.0%), and Transportation & Warehousing (100.0%), whereas the industries that tend to have a higher number of women are Educational Services (100.0%), Accommodation & Food Services (100.0%), and Manufacturing (50.0%).
| Industry | Male | Female |
| Agriculture, Fishing & Hunting | 0 (0.0%) | 0 (0.0%) |
| Mining, Quarrying, & Extraction | 12 (100.0%) | 0 (0.0%) |
| Construction | 0 (0.0%) | 0 (0.0%) |
| Manufacturing | 13 (50.0%) | 13 (50.0%) |
| Wholesale Trade | 0 (0.0%) | 0 (0.0%) |
| Retail Trade | 23 (100.0%) | 0 (0.0%) |
| Transportation & Warehousing | 20 (100.0%) | 0 (0.0%) |
| Utilities | 0 (0.0%) | 0 (0.0%) |
| Information | 0 (0.0%) | 0 (0.0%) |
| Finance & Insurance | 0 (0.0%) | 0 (0.0%) |
| Real Estate, Rental & Leasing | 0 (0.0%) | 0 (0.0%) |
| Professional & Scientific | 0 (0.0%) | 0 (0.0%) |
| Enterprise Management | 0 (0.0%) | 0 (0.0%) |
| Administrative & Support | 0 (0.0%) | 0 (0.0%) |
| Educational Services | 0 (0.0%) | 13 (100.0%) |
| Health Care & Social Assistance | 22 (66.7%) | 11 (33.3%) |
| Arts, Entertainment & Recreation | 10 (100.0%) | 0 (0.0%) |
| Accommodation & Food Services | 0 (0.0%) | 17 (100.0%) |
| Public Administration | 15 (51.7%) | 14 (48.3%) |
| Total | 115 (62.8%) | 68 (37.2%) |
Education in Big Delta
School Enrollment in Big Delta
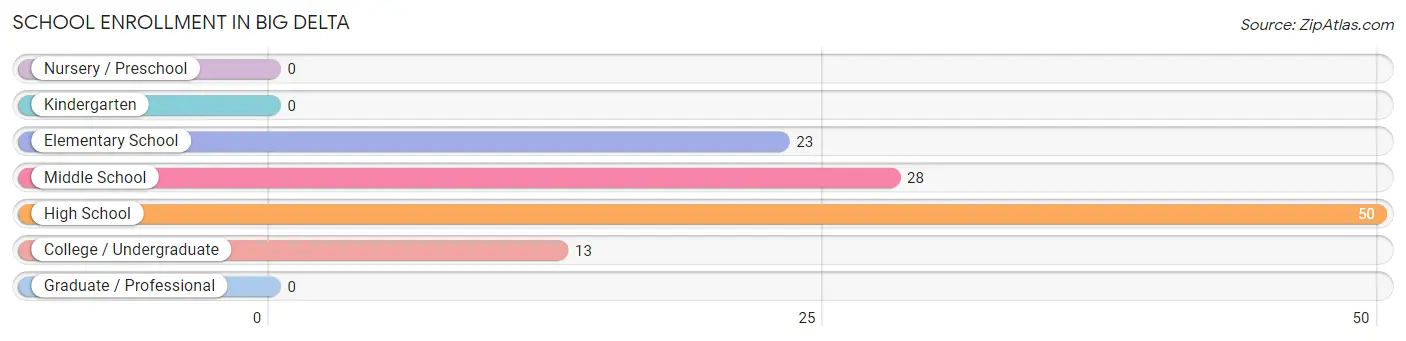
The most common levels of schooling among the 114 students in Big Delta are high school (50 | 43.9%), middle school (28 | 24.6%), and elementary school (23 | 20.2%).
| School Level | # Students | % Students |
| Nursery / Preschool | 0 | 0.0% |
| Kindergarten | 0 | 0.0% |
| Elementary School | 23 | 20.2% |
| Middle School | 28 | 24.6% |
| High School | 50 | 43.9% |
| College / Undergraduate | 13 | 11.4% |
| Graduate / Professional | 0 | 0.0% |
| Total | 114 | 100.0% |
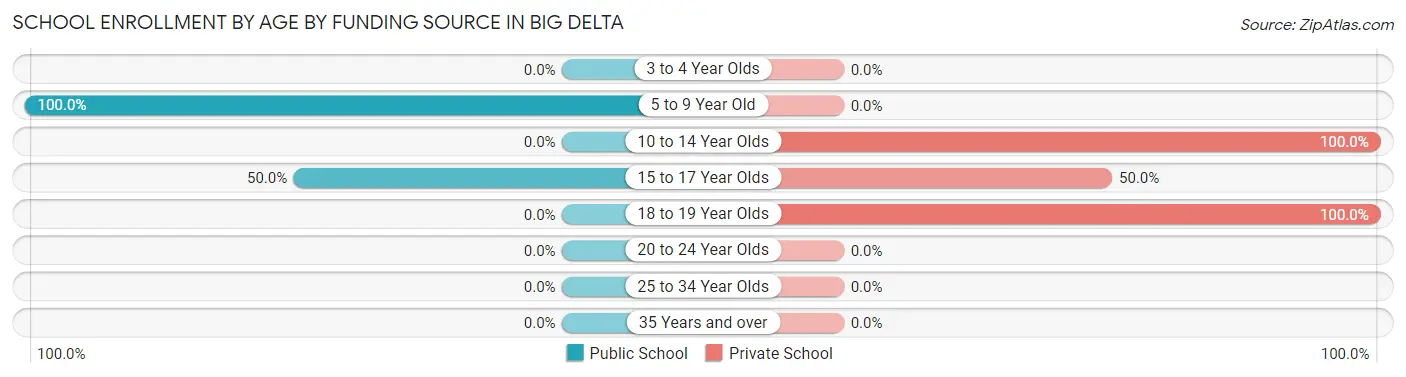
School Enrollment by Age by Funding Source in Big Delta
Out of a total of 114 students who are enrolled in schools in Big Delta, 66 (57.9%) attend a private institution, while the remaining 48 (42.1%) are enrolled in public schools. The age group of 10 to 14 year olds has the highest likelihood of being enrolled in private schools, with 28 (100.0% in the age bracket) enrolled. Conversely, the age group of 5 to 9 year old has the lowest likelihood of being enrolled in a private school, with 23 (100.0% in the age bracket) attending a public institution.
| Age Bracket | Public School | Private School |
| 3 to 4 Year Olds | 0 (0.0%) | 0 (0.0%) |
| 5 to 9 Year Old | 23 (100.0%) | 0 (0.0%) |
| 10 to 14 Year Olds | 0 (0.0%) | 28 (100.0%) |
| 15 to 17 Year Olds | 25 (50.0%) | 25 (50.0%) |
| 18 to 19 Year Olds | 0 (0.0%) | 13 (100.0%) |
| 20 to 24 Year Olds | 0 (0.0%) | 0 (0.0%) |
| 25 to 34 Year Olds | 0 (0.0%) | 0 (0.0%) |
| 35 Years and over | 0 (0.0%) | 0 (0.0%) |
| Total | 48 (42.1%) | 66 (57.9%) |
Educational Attainment by Field of Study in Big Delta
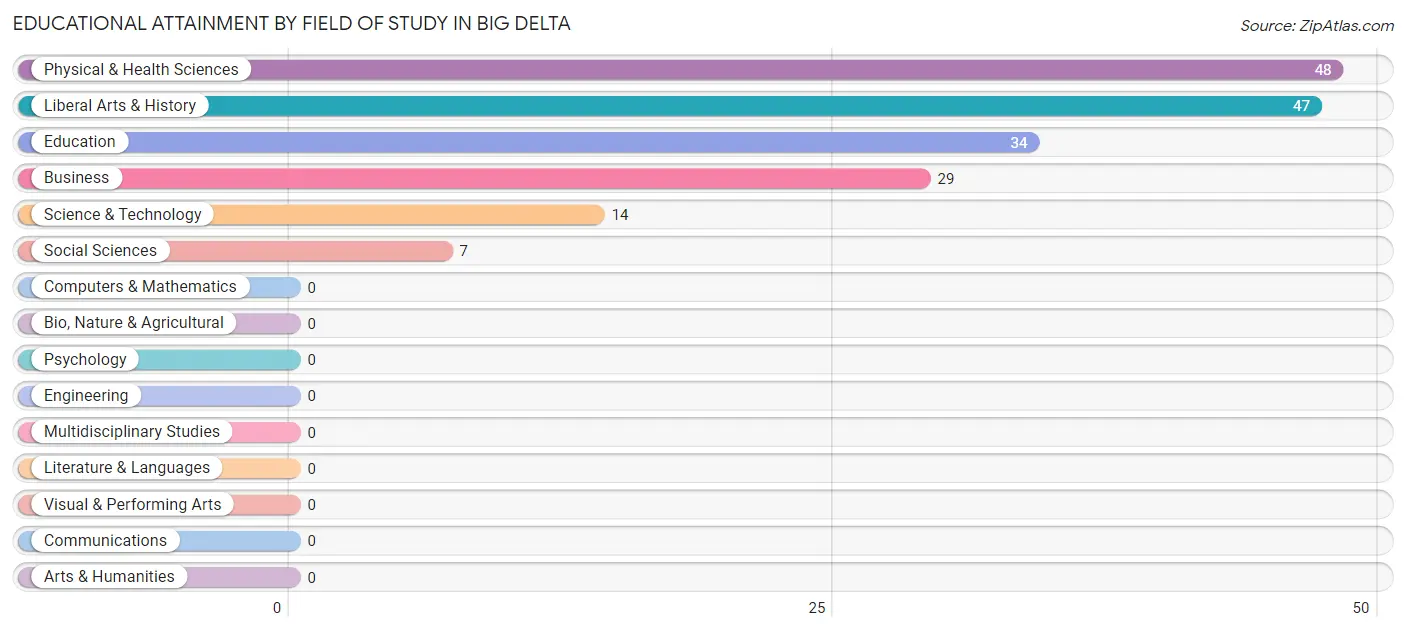
Physical & health sciences (48 | 26.8%), liberal arts & history (47 | 26.3%), education (34 | 19.0%), business (29 | 16.2%), and science & technology (14 | 7.8%) are the most common fields of study among 179 individuals in Big Delta who have obtained a bachelor's degree or higher.
| Field of Study | # Graduates | % Graduates |
| Computers & Mathematics | 0 | 0.0% |
| Bio, Nature & Agricultural | 0 | 0.0% |
| Physical & Health Sciences | 48 | 26.8% |
| Psychology | 0 | 0.0% |
| Social Sciences | 7 | 3.9% |
| Engineering | 0 | 0.0% |
| Multidisciplinary Studies | 0 | 0.0% |
| Science & Technology | 14 | 7.8% |
| Business | 29 | 16.2% |
| Education | 34 | 19.0% |
| Literature & Languages | 0 | 0.0% |
| Liberal Arts & History | 47 | 26.3% |
| Visual & Performing Arts | 0 | 0.0% |
| Communications | 0 | 0.0% |
| Arts & Humanities | 0 | 0.0% |
| Total | 179 | 100.0% |
Transportation & Commute in Big Delta
Vehicle Availability by Sex in Big Delta
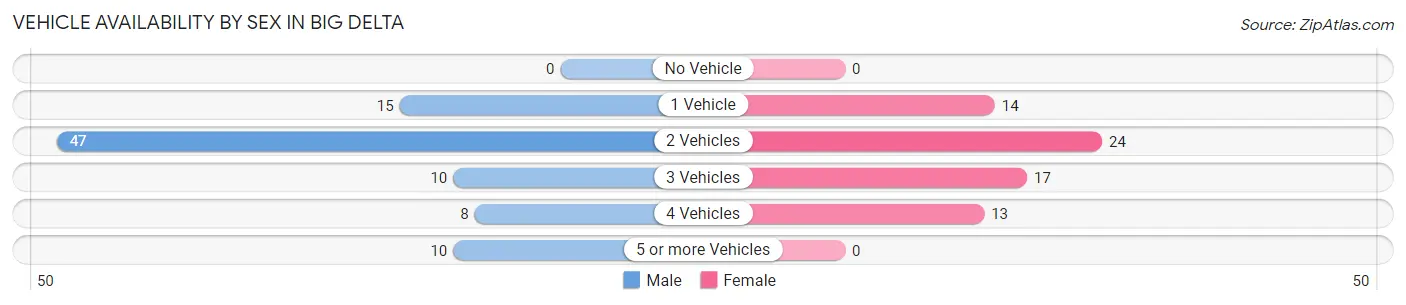
The most prevalent vehicle ownership categories in Big Delta are males with 2 vehicles (47, accounting for 52.2%) and females with 2 vehicles (24, making up 69.1%).
| Vehicles Available | Male | Female |
| No Vehicle | 0 (0.0%) | 0 (0.0%) |
| 1 Vehicle | 15 (16.7%) | 14 (20.6%) |
| 2 Vehicles | 47 (52.2%) | 24 (35.3%) |
| 3 Vehicles | 10 (11.1%) | 17 (25.0%) |
| 4 Vehicles | 8 (8.9%) | 13 (19.1%) |
| 5 or more Vehicles | 10 (11.1%) | 0 (0.0%) |
| Total | 90 (100.0%) | 68 (100.0%) |
Commute Time in Big Delta
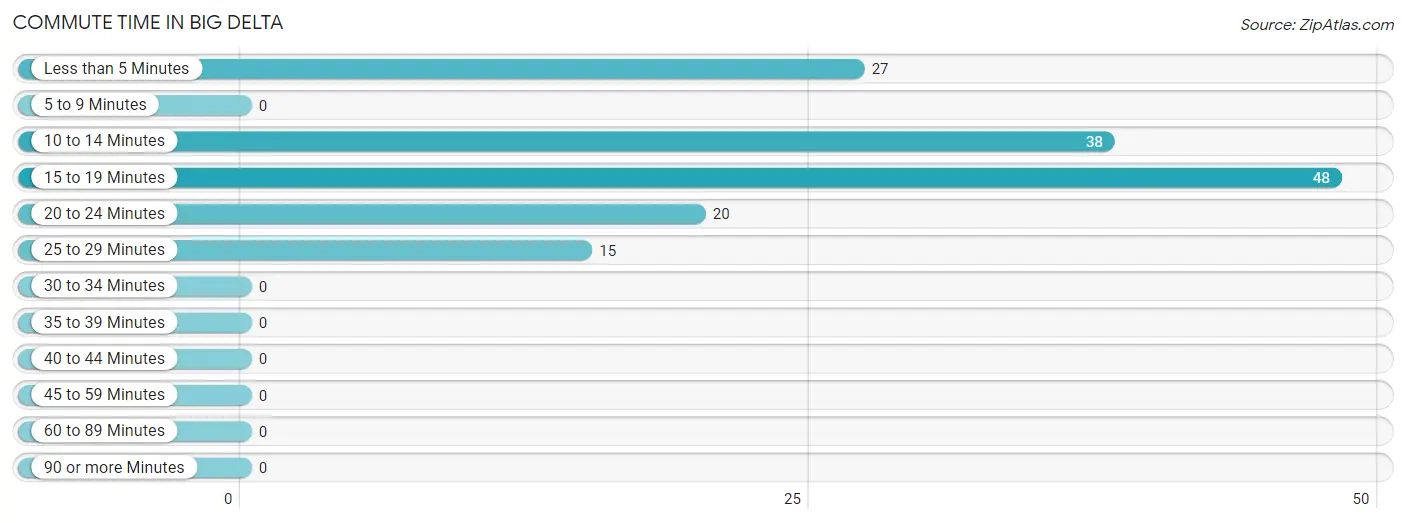
The most frequently occuring commute durations in Big Delta are 15 to 19 minutes (48 commuters, 32.4%), 10 to 14 minutes (38 commuters, 25.7%), and less than 5 minutes (27 commuters, 18.2%).
| Commute Time | # Commuters | % Commuters |
| Less than 5 Minutes | 27 | 18.2% |
| 5 to 9 Minutes | 0 | 0.0% |
| 10 to 14 Minutes | 38 | 25.7% |
| 15 to 19 Minutes | 48 | 32.4% |
| 20 to 24 Minutes | 20 | 13.5% |
| 25 to 29 Minutes | 15 | 10.1% |
| 30 to 34 Minutes | 0 | 0.0% |
| 35 to 39 Minutes | 0 | 0.0% |
| 40 to 44 Minutes | 0 | 0.0% |
| 45 to 59 Minutes | 0 | 0.0% |
| 60 to 89 Minutes | 0 | 0.0% |
| 90 or more Minutes | 0 | 0.0% |
Commute Time by Sex in Big Delta
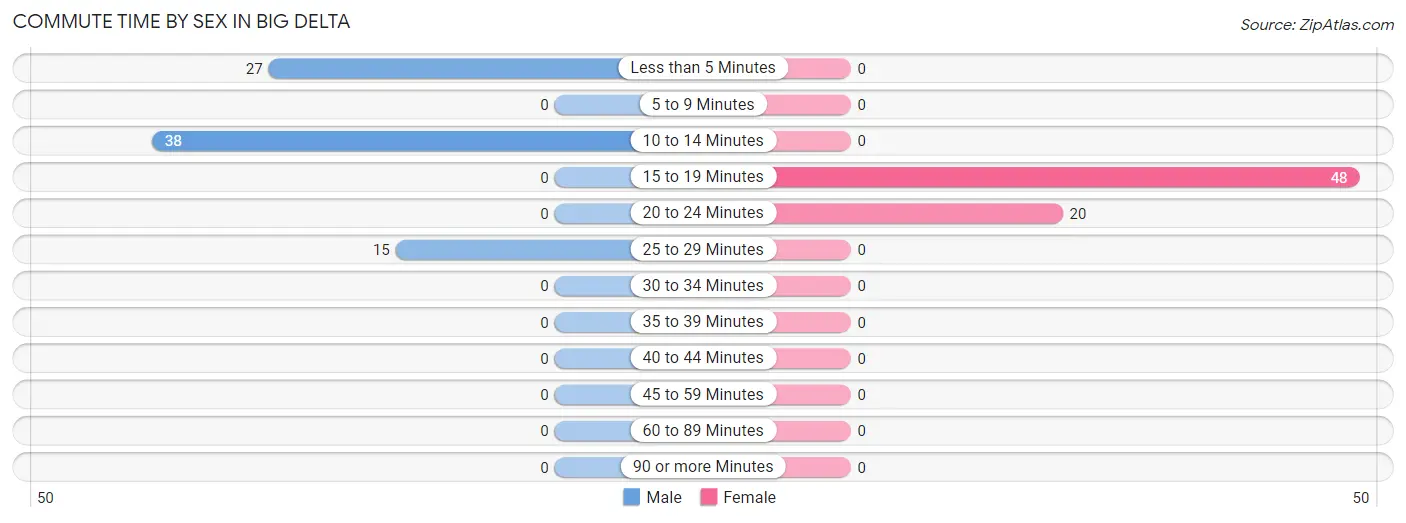
The most common commute times in Big Delta are 10 to 14 minutes (38 commuters, 47.5%) for males and 15 to 19 minutes (48 commuters, 70.6%) for females.
| Commute Time | Male | Female |
| Less than 5 Minutes | 27 (33.8%) | 0 (0.0%) |
| 5 to 9 Minutes | 0 (0.0%) | 0 (0.0%) |
| 10 to 14 Minutes | 38 (47.5%) | 0 (0.0%) |
| 15 to 19 Minutes | 0 (0.0%) | 48 (70.6%) |
| 20 to 24 Minutes | 0 (0.0%) | 20 (29.4%) |
| 25 to 29 Minutes | 15 (18.8%) | 0 (0.0%) |
| 30 to 34 Minutes | 0 (0.0%) | 0 (0.0%) |
| 35 to 39 Minutes | 0 (0.0%) | 0 (0.0%) |
| 40 to 44 Minutes | 0 (0.0%) | 0 (0.0%) |
| 45 to 59 Minutes | 0 (0.0%) | 0 (0.0%) |
| 60 to 89 Minutes | 0 (0.0%) | 0 (0.0%) |
| 90 or more Minutes | 0 (0.0%) | 0 (0.0%) |
Time of Departure to Work by Sex in Big Delta
The most frequent times of departure to work in Big Delta are 12:00 AM to 4:59 AM (20, 25.0%) for males and 8:00 AM to 8:29 AM (14, 20.6%) for females.
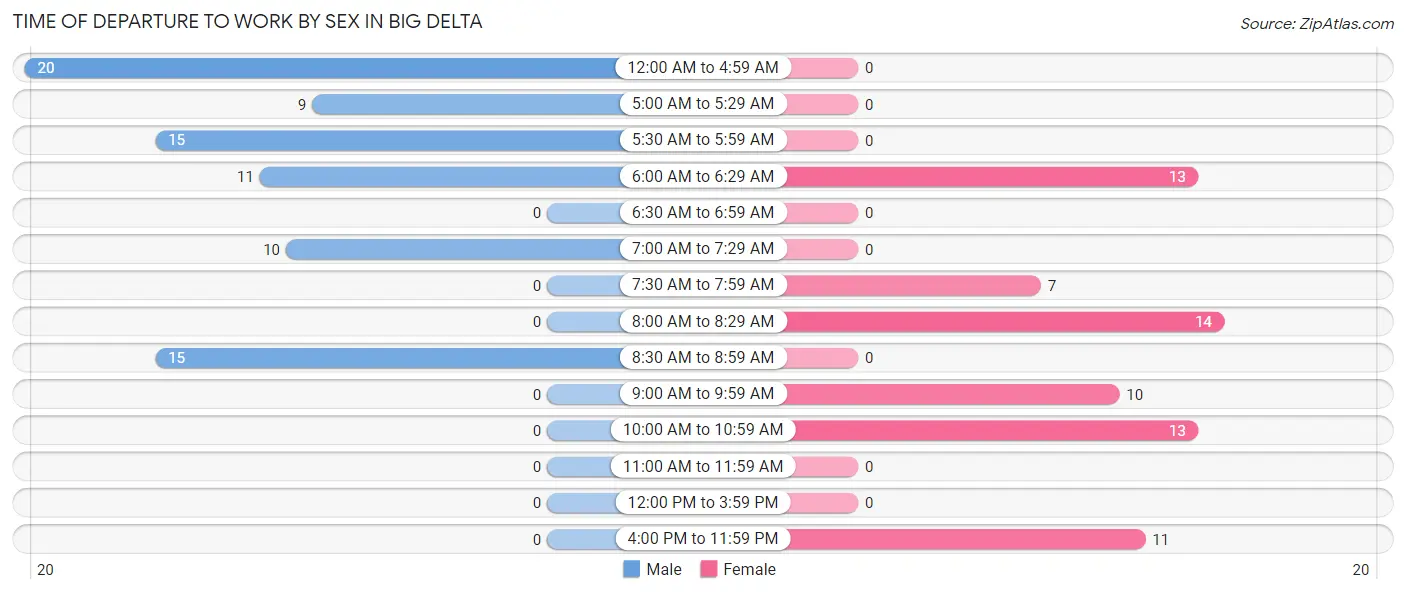
| Time of Departure | Male | Female |
| 12:00 AM to 4:59 AM | 20 (25.0%) | 0 (0.0%) |
| 5:00 AM to 5:29 AM | 9 (11.3%) | 0 (0.0%) |
| 5:30 AM to 5:59 AM | 15 (18.8%) | 0 (0.0%) |
| 6:00 AM to 6:29 AM | 11 (13.8%) | 13 (19.1%) |
| 6:30 AM to 6:59 AM | 0 (0.0%) | 0 (0.0%) |
| 7:00 AM to 7:29 AM | 10 (12.5%) | 0 (0.0%) |
| 7:30 AM to 7:59 AM | 0 (0.0%) | 7 (10.3%) |
| 8:00 AM to 8:29 AM | 0 (0.0%) | 14 (20.6%) |
| 8:30 AM to 8:59 AM | 15 (18.8%) | 0 (0.0%) |
| 9:00 AM to 9:59 AM | 0 (0.0%) | 10 (14.7%) |
| 10:00 AM to 10:59 AM | 0 (0.0%) | 13 (19.1%) |
| 11:00 AM to 11:59 AM | 0 (0.0%) | 0 (0.0%) |
| 12:00 PM to 3:59 PM | 0 (0.0%) | 0 (0.0%) |
| 4:00 PM to 11:59 PM | 0 (0.0%) | 11 (16.2%) |
| Total | 80 (100.0%) | 68 (100.0%) |
Housing Occupancy in Big Delta
Occupancy by Ownership in Big Delta
Of the total 195 dwellings in Big Delta, owner-occupied units account for 159 (81.5%), while renter-occupied units make up 36 (18.5%).
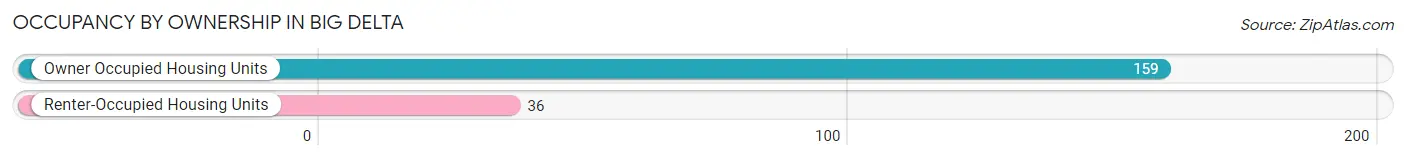
| Occupancy | # Housing Units | % Housing Units |
| Owner Occupied Housing Units | 159 | 81.5% |
| Renter-Occupied Housing Units | 36 | 18.5% |
| Total Occupied Housing Units | 195 | 100.0% |
Occupancy by Household Size in Big Delta
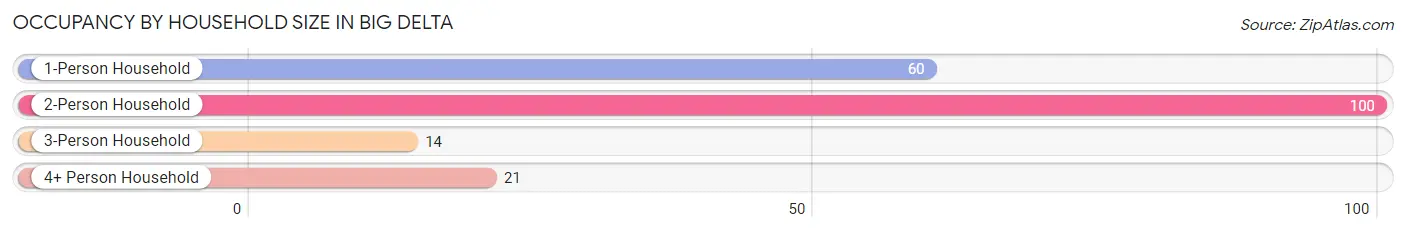
| Household Size | # Housing Units | % Housing Units |
| 1-Person Household | 60 | 30.8% |
| 2-Person Household | 100 | 51.3% |
| 3-Person Household | 14 | 7.2% |
| 4+ Person Household | 21 | 10.8% |
| Total Housing Units | 195 | 100.0% |
Occupancy by Ownership by Household Size in Big Delta
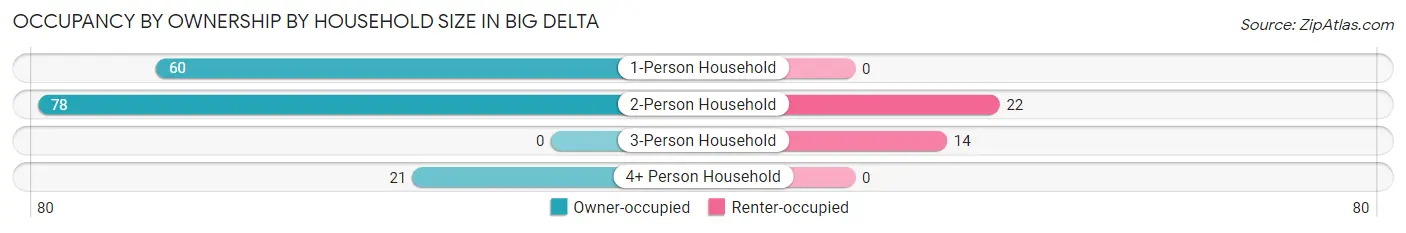
| Household Size | Owner-occupied | Renter-occupied |
| 1-Person Household | 60 (100.0%) | 0 (0.0%) |
| 2-Person Household | 78 (78.0%) | 22 (22.0%) |
| 3-Person Household | 0 (0.0%) | 14 (100.0%) |
| 4+ Person Household | 21 (100.0%) | 0 (0.0%) |
| Total Housing Units | 159 (81.5%) | 36 (18.5%) |
Occupancy by Educational Attainment in Big Delta
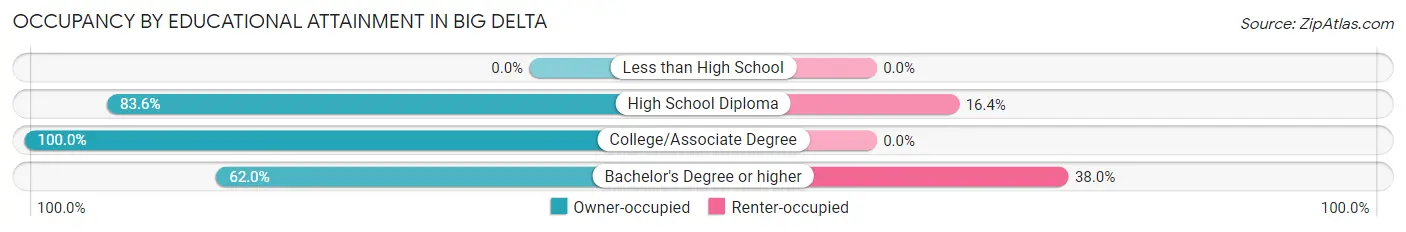
| Household Size | Owner-occupied | Renter-occupied |
| Less than High School | 0 (0.0%) | 0 (0.0%) |
| High School Diploma | 46 (83.6%) | 9 (16.4%) |
| College/Associate Degree | 69 (100.0%) | 0 (0.0%) |
| Bachelor's Degree or higher | 44 (62.0%) | 27 (38.0%) |
Occupancy by Age of Householder in Big Delta
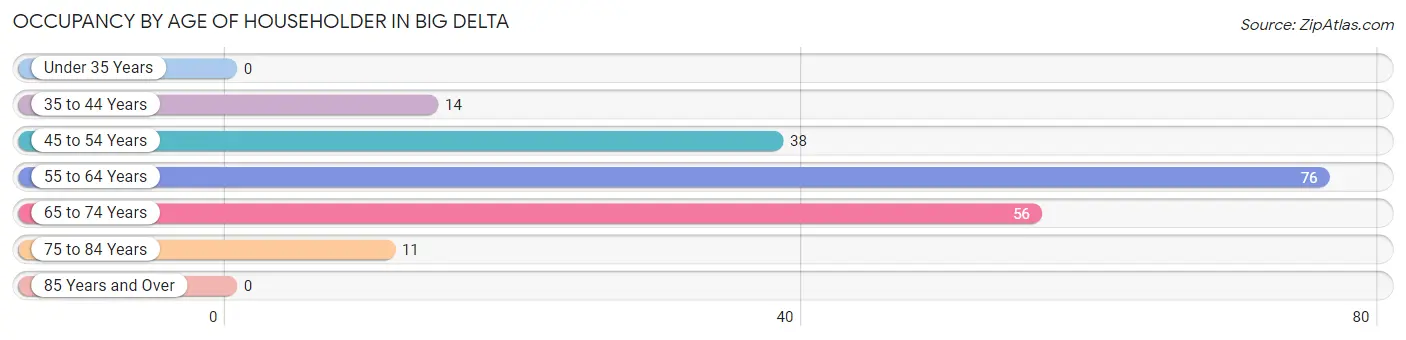
| Age Bracket | # Households | % Households |
| Under 35 Years | 0 | 0.0% |
| 35 to 44 Years | 14 | 7.2% |
| 45 to 54 Years | 38 | 19.5% |
| 55 to 64 Years | 76 | 39.0% |
| 65 to 74 Years | 56 | 28.7% |
| 75 to 84 Years | 11 | 5.6% |
| 85 Years and Over | 0 | 0.0% |
| Total | 195 | 100.0% |
Housing Finances in Big Delta
Median Income by Occupancy in Big Delta
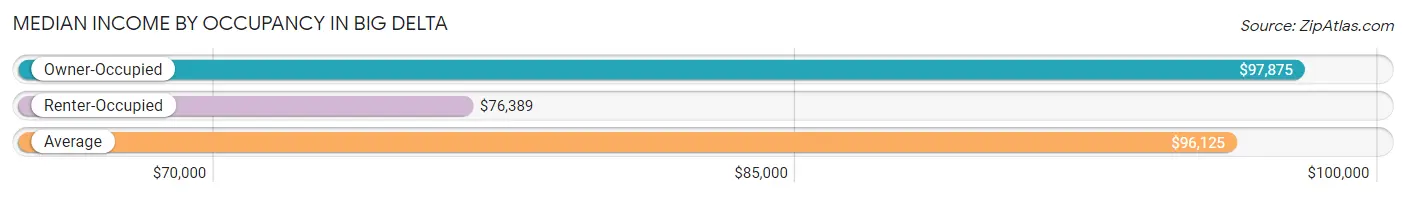
| Occupancy Type | # Households | Median Income |
| Owner-Occupied | 159 (81.5%) | $97,875 |
| Renter-Occupied | 36 (18.5%) | $76,389 |
| Average | 195 (100.0%) | $96,125 |
Occupancy by Householder Income Bracket in Big Delta
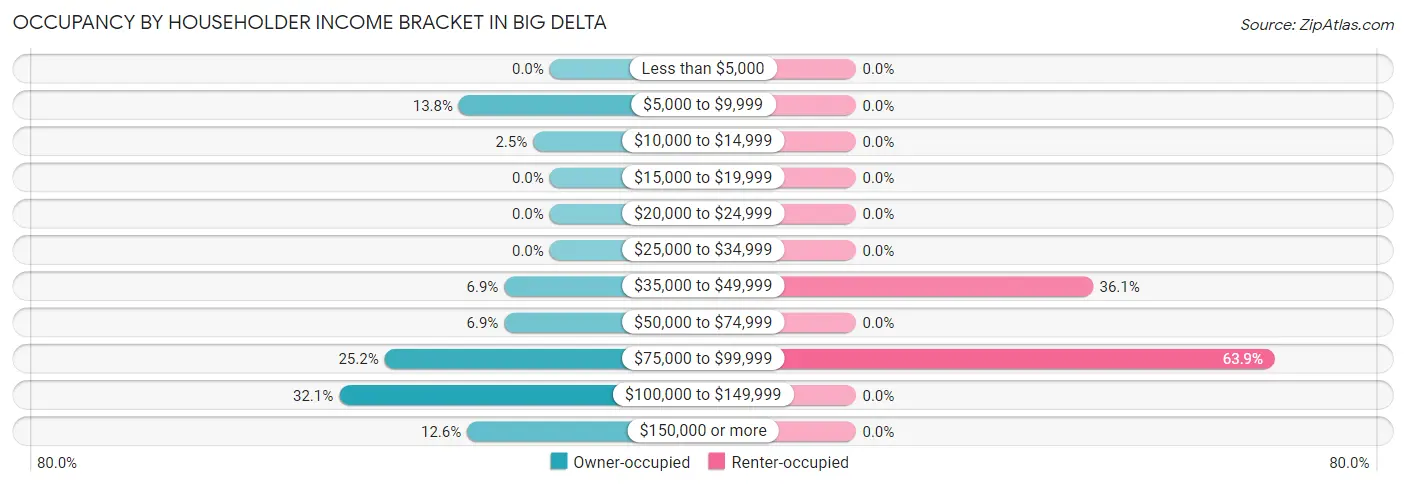
| Income Bracket | Owner-occupied | Renter-occupied |
| Less than $5,000 | 0 (0.0%) | 0 (0.0%) |
| $5,000 to $9,999 | 22 (13.8%) | 0 (0.0%) |
| $10,000 to $14,999 | 4 (2.5%) | 0 (0.0%) |
| $15,000 to $19,999 | 0 (0.0%) | 0 (0.0%) |
| $20,000 to $24,999 | 0 (0.0%) | 0 (0.0%) |
| $25,000 to $34,999 | 0 (0.0%) | 0 (0.0%) |
| $35,000 to $49,999 | 11 (6.9%) | 13 (36.1%) |
| $50,000 to $74,999 | 11 (6.9%) | 0 (0.0%) |
| $75,000 to $99,999 | 40 (25.2%) | 23 (63.9%) |
| $100,000 to $149,999 | 51 (32.1%) | 0 (0.0%) |
| $150,000 or more | 20 (12.6%) | 0 (0.0%) |
| Total | 159 (100.0%) | 36 (100.0%) |
Monthly Housing Cost Tiers in Big Delta
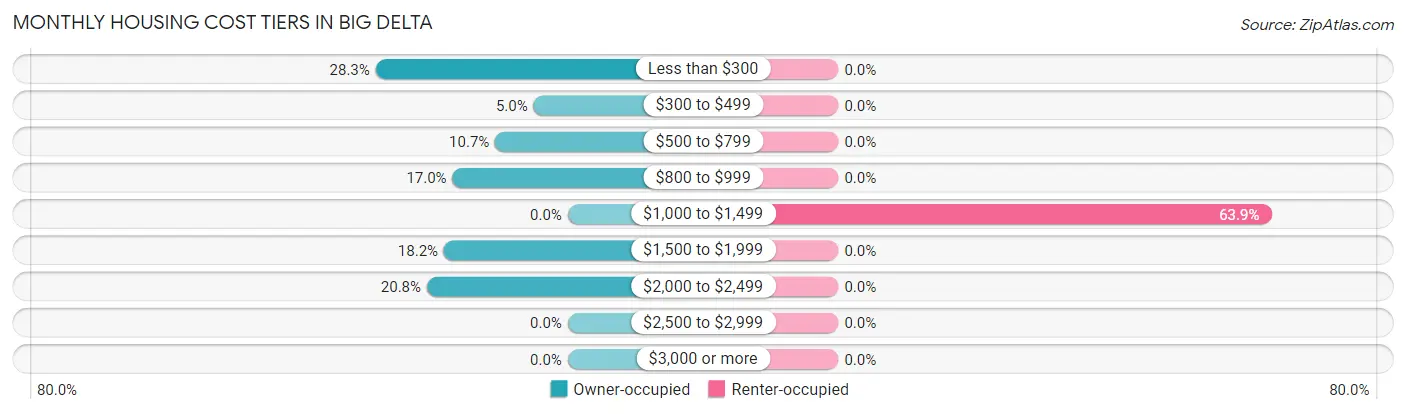
| Monthly Cost | Owner-occupied | Renter-occupied |
| Less than $300 | 45 (28.3%) | 0 (0.0%) |
| $300 to $499 | 8 (5.0%) | 0 (0.0%) |
| $500 to $799 | 17 (10.7%) | 0 (0.0%) |
| $800 to $999 | 27 (17.0%) | 0 (0.0%) |
| $1,000 to $1,499 | 0 (0.0%) | 23 (63.9%) |
| $1,500 to $1,999 | 29 (18.2%) | 0 (0.0%) |
| $2,000 to $2,499 | 33 (20.7%) | 0 (0.0%) |
| $2,500 to $2,999 | 0 (0.0%) | 0 (0.0%) |
| $3,000 or more | 0 (0.0%) | 0 (0.0%) |
| Total | 159 (100.0%) | 36 (100.0%) |
Physical Housing Characteristics in Big Delta
Housing Structures in Big Delta
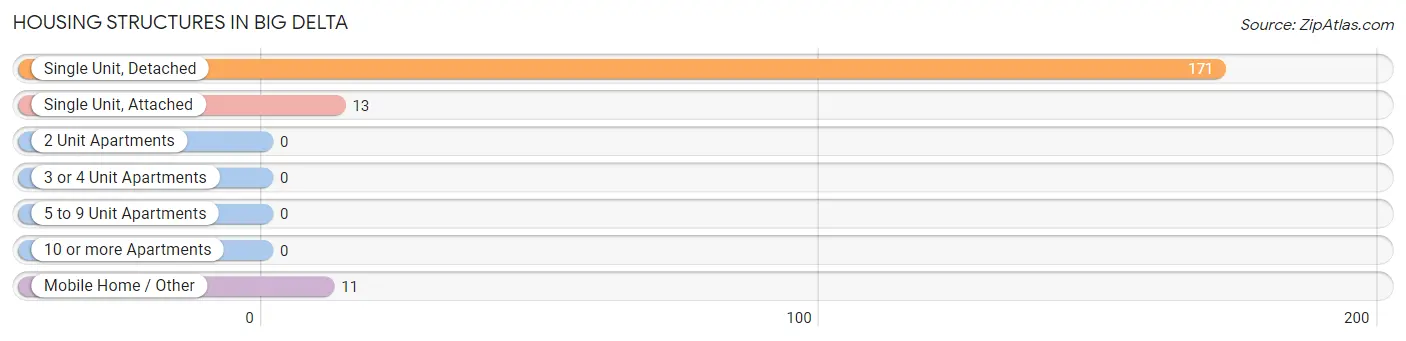
| Structure Type | # Housing Units | % Housing Units |
| Single Unit, Detached | 171 | 87.7% |
| Single Unit, Attached | 13 | 6.7% |
| 2 Unit Apartments | 0 | 0.0% |
| 3 or 4 Unit Apartments | 0 | 0.0% |
| 5 to 9 Unit Apartments | 0 | 0.0% |
| 10 or more Apartments | 0 | 0.0% |
| Mobile Home / Other | 11 | 5.6% |
| Total | 195 | 100.0% |
Housing Structures by Occupancy in Big Delta
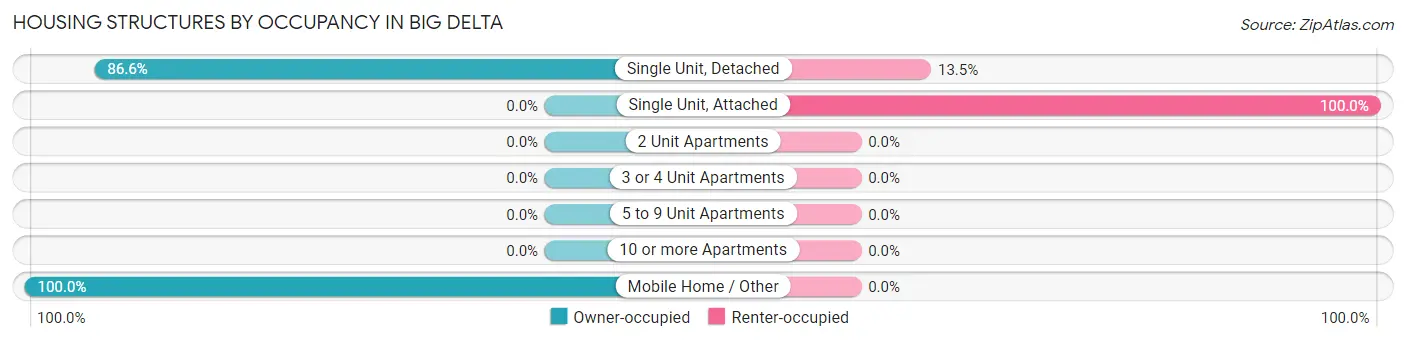
| Structure Type | Owner-occupied | Renter-occupied |
| Single Unit, Detached | 148 (86.6%) | 23 (13.5%) |
| Single Unit, Attached | 0 (0.0%) | 13 (100.0%) |
| 2 Unit Apartments | 0 (0.0%) | 0 (0.0%) |
| 3 or 4 Unit Apartments | 0 (0.0%) | 0 (0.0%) |
| 5 to 9 Unit Apartments | 0 (0.0%) | 0 (0.0%) |
| 10 or more Apartments | 0 (0.0%) | 0 (0.0%) |
| Mobile Home / Other | 11 (100.0%) | 0 (0.0%) |
| Total | 159 (81.5%) | 36 (18.5%) |
Housing Structures by Number of Rooms in Big Delta
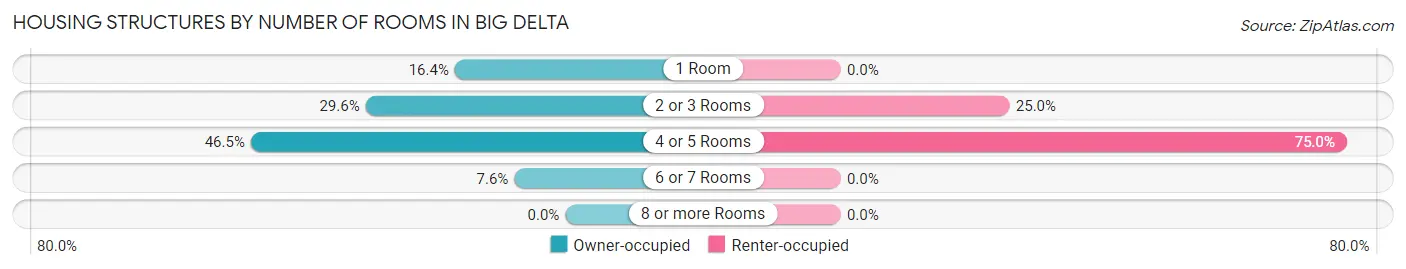
| Number of Rooms | Owner-occupied | Renter-occupied |
| 1 Room | 26 (16.4%) | 0 (0.0%) |
| 2 or 3 Rooms | 47 (29.6%) | 9 (25.0%) |
| 4 or 5 Rooms | 74 (46.5%) | 27 (75.0%) |
| 6 or 7 Rooms | 12 (7.5%) | 0 (0.0%) |
| 8 or more Rooms | 0 (0.0%) | 0 (0.0%) |
| Total | 159 (100.0%) | 36 (100.0%) |
Housing Structure by Heating Type in Big Delta
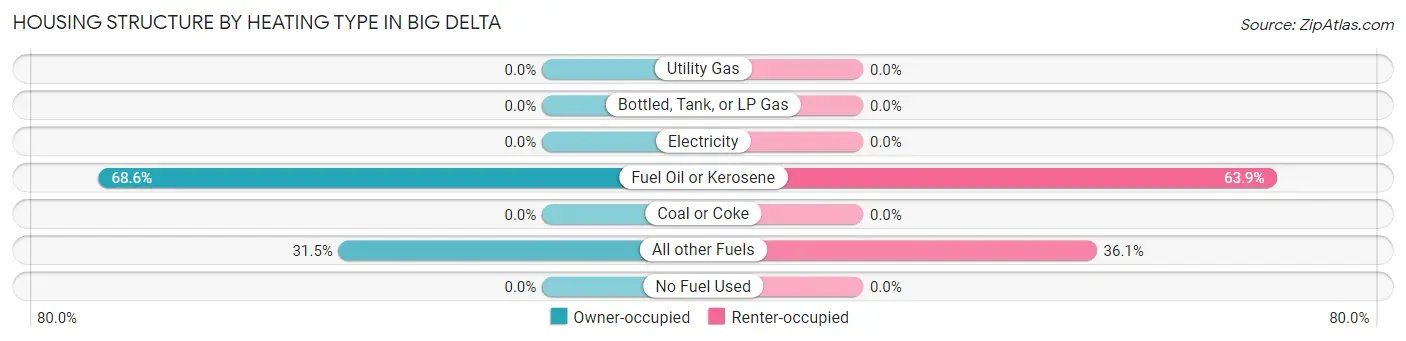
| Heating Type | Owner-occupied | Renter-occupied |
| Utility Gas | 0 (0.0%) | 0 (0.0%) |
| Bottled, Tank, or LP Gas | 0 (0.0%) | 0 (0.0%) |
| Electricity | 0 (0.0%) | 0 (0.0%) |
| Fuel Oil or Kerosene | 109 (68.5%) | 23 (63.9%) |
| Coal or Coke | 0 (0.0%) | 0 (0.0%) |
| All other Fuels | 50 (31.5%) | 13 (36.1%) |
| No Fuel Used | 0 (0.0%) | 0 (0.0%) |
| Total | 159 (100.0%) | 36 (100.0%) |
Household Vehicle Usage in Big Delta
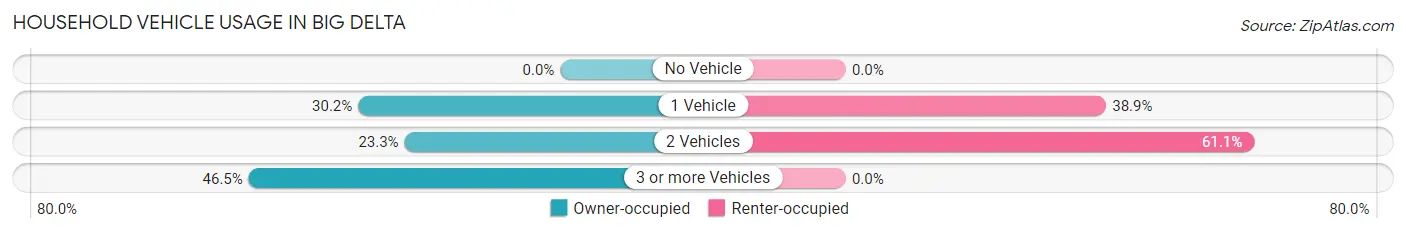
| Vehicles per Household | Owner-occupied | Renter-occupied |
| No Vehicle | 0 (0.0%) | 0 (0.0%) |
| 1 Vehicle | 48 (30.2%) | 14 (38.9%) |
| 2 Vehicles | 37 (23.3%) | 22 (61.1%) |
| 3 or more Vehicles | 74 (46.5%) | 0 (0.0%) |
| Total | 159 (100.0%) | 36 (100.0%) |
Real Estate & Mortgages in Big Delta
Real Estate and Mortgage Overview in Big Delta
| Characteristic | Without Mortgage | With Mortgage |
| Housing Units | 82 | 77 |
| Median Property Value | - | - |
| Median Household Income | - | - |
| Monthly Housing Costs | $488 | $0 |
| Real Estate Taxes | - | - |
Property Value by Mortgage Status in Big Delta
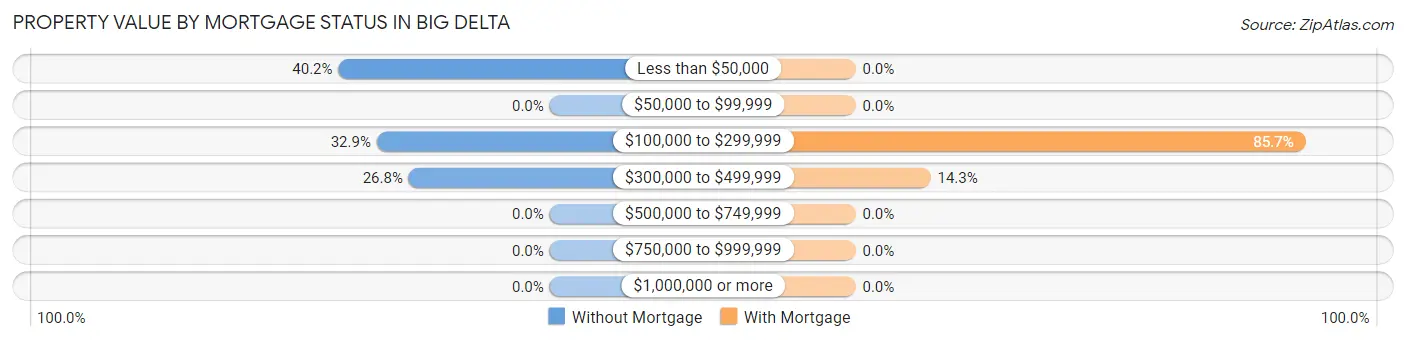
| Property Value | Without Mortgage | With Mortgage |
| Less than $50,000 | 33 (40.2%) | 0 (0.0%) |
| $50,000 to $99,999 | 0 (0.0%) | 0 (0.0%) |
| $100,000 to $299,999 | 27 (32.9%) | 66 (85.7%) |
| $300,000 to $499,999 | 22 (26.8%) | 11 (14.3%) |
| $500,000 to $749,999 | 0 (0.0%) | 0 (0.0%) |
| $750,000 to $999,999 | 0 (0.0%) | 0 (0.0%) |
| $1,000,000 or more | 0 (0.0%) | 0 (0.0%) |
| Total | 82 (100.0%) | 77 (100.0%) |
Household Income by Mortgage Status in Big Delta
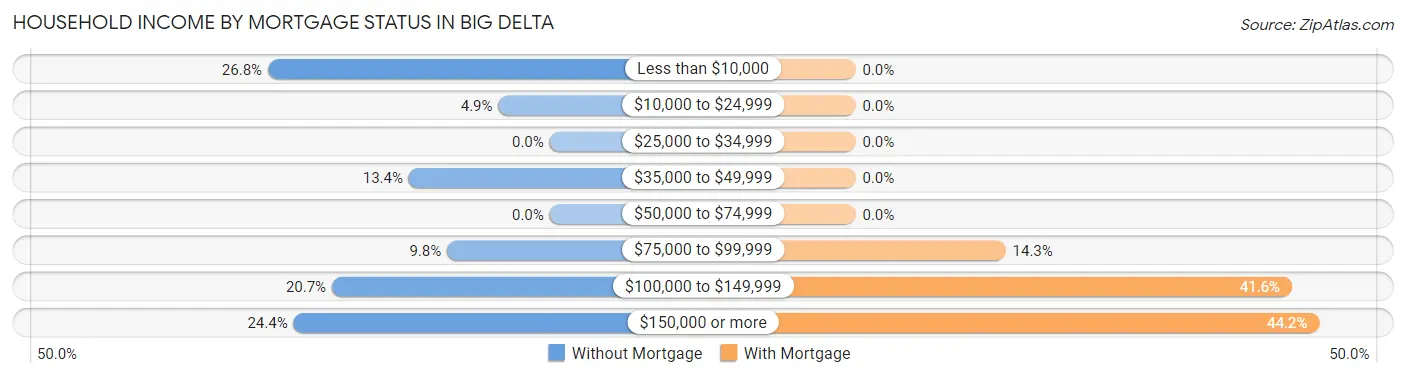
| Household Income | Without Mortgage | With Mortgage |
| Less than $10,000 | 22 (26.8%) | 0 (0.0%) |
| $10,000 to $24,999 | 4 (4.9%) | 0 (0.0%) |
| $25,000 to $34,999 | 0 (0.0%) | 0 (0.0%) |
| $35,000 to $49,999 | 11 (13.4%) | 0 (0.0%) |
| $50,000 to $74,999 | 0 (0.0%) | 0 (0.0%) |
| $75,000 to $99,999 | 8 (9.8%) | 11 (14.3%) |
| $100,000 to $149,999 | 17 (20.7%) | 32 (41.6%) |
| $150,000 or more | 20 (24.4%) | 34 (44.2%) |
| Total | 82 (100.0%) | 77 (100.0%) |
Property Value to Household Income Ratio in Big Delta
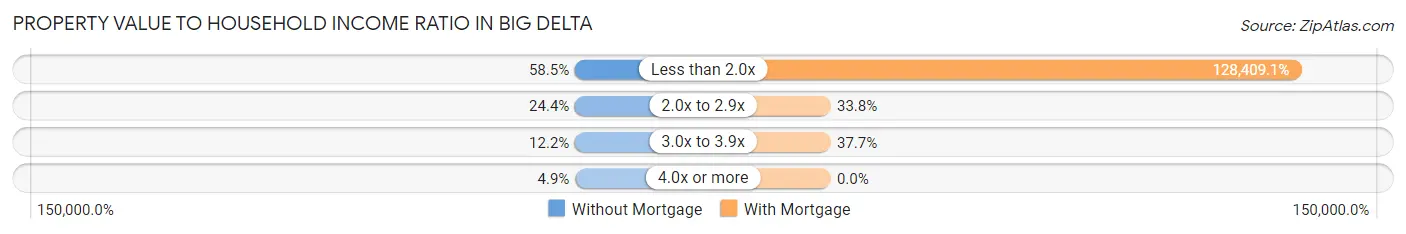
| Value-to-Income Ratio | Without Mortgage | With Mortgage |
| Less than 2.0x | 48 (58.5%) | 98,875 (128,409.1%) |
| 2.0x to 2.9x | 20 (24.4%) | 26 (33.8%) |
| 3.0x to 3.9x | 10 (12.2%) | 29 (37.7%) |
| 4.0x or more | 4 (4.9%) | 0 (0.0%) |
| Total | 82 (100.0%) | 77 (100.0%) |
Real Estate Taxes by Mortgage Status in Big Delta
| Property Taxes | Without Mortgage | With Mortgage |
| Less than $800 | 0 (0.0%) | 0 (0.0%) |
| $800 to $1,499 | 0 (0.0%) | 0 (0.0%) |
| $800 to $1,499 | 0 (0.0%) | 0 (0.0%) |
| Total | 82 (100.0%) | 77 (100.0%) |
Health & Disability in Big Delta
Health Insurance Coverage by Age in Big Delta
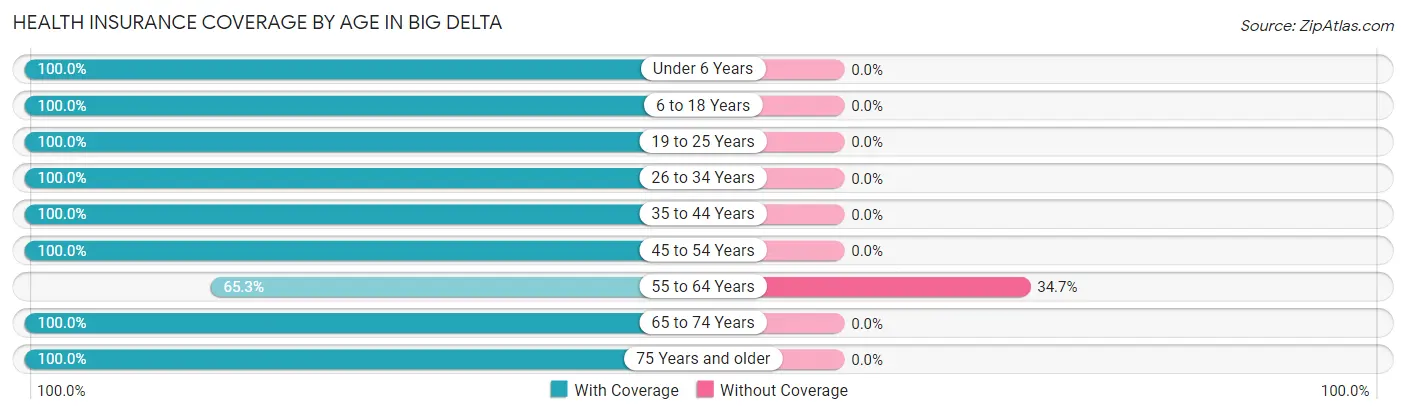
| Age Bracket | With Coverage | Without Coverage |
| Under 6 Years | 22 (100.0%) | 0 (0.0%) |
| 6 to 18 Years | 116 (100.0%) | 0 (0.0%) |
| 19 to 25 Years | 52 (100.0%) | 0 (0.0%) |
| 26 to 34 Years | 10 (100.0%) | 0 (0.0%) |
| 35 to 44 Years | 29 (100.0%) | 0 (0.0%) |
| 45 to 54 Years | 78 (100.0%) | 0 (0.0%) |
| 55 to 64 Years | 81 (65.3%) | 43 (34.7%) |
| 65 to 74 Years | 103 (100.0%) | 0 (0.0%) |
| 75 Years and older | 11 (100.0%) | 0 (0.0%) |
| Total | 502 (92.1%) | 43 (7.9%) |
Health Insurance Coverage by Citizenship Status in Big Delta
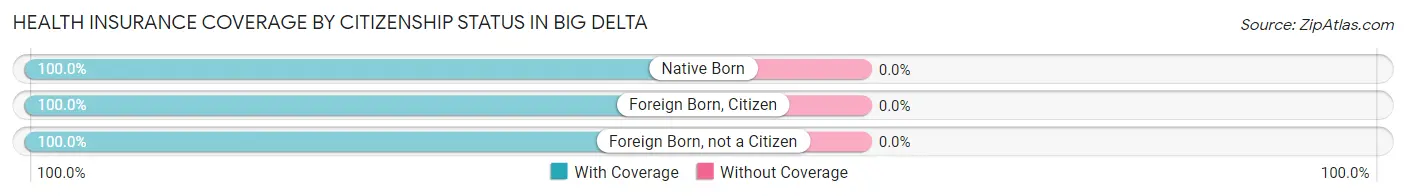
| Citizenship Status | With Coverage | Without Coverage |
| Native Born | 22 (100.0%) | 0 (0.0%) |
| Foreign Born, Citizen | 116 (100.0%) | 0 (0.0%) |
| Foreign Born, not a Citizen | 52 (100.0%) | 0 (0.0%) |
Health Insurance Coverage by Household Income in Big Delta
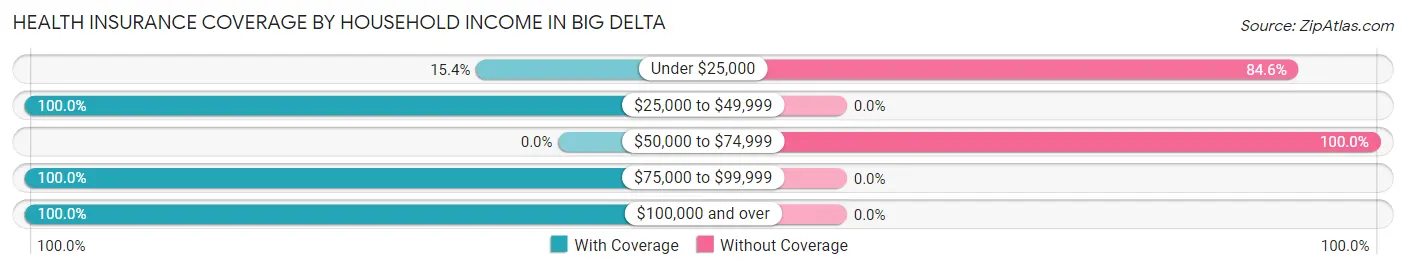
| Household Income | With Coverage | Without Coverage |
| Under $25,000 | 4 (15.4%) | 22 (84.6%) |
| $25,000 to $49,999 | 64 (100.0%) | 0 (0.0%) |
| $50,000 to $74,999 | 0 (0.0%) | 21 (100.0%) |
| $75,000 to $99,999 | 167 (100.0%) | 0 (0.0%) |
| $100,000 and over | 264 (100.0%) | 0 (0.0%) |
Public vs Private Health Insurance Coverage by Age in Big Delta
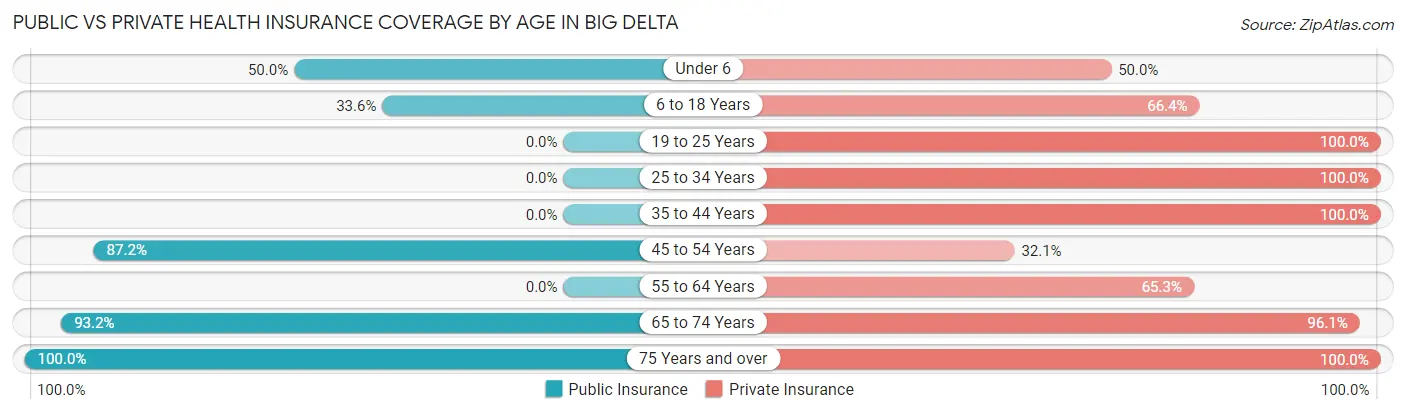
| Age Bracket | Public Insurance | Private Insurance |
| Under 6 | 11 (50.0%) | 11 (50.0%) |
| 6 to 18 Years | 39 (33.6%) | 77 (66.4%) |
| 19 to 25 Years | 0 (0.0%) | 52 (100.0%) |
| 25 to 34 Years | 0 (0.0%) | 10 (100.0%) |
| 35 to 44 Years | 0 (0.0%) | 29 (100.0%) |
| 45 to 54 Years | 68 (87.2%) | 25 (32.1%) |
| 55 to 64 Years | 0 (0.0%) | 81 (65.3%) |
| 65 to 74 Years | 96 (93.2%) | 99 (96.1%) |
| 75 Years and over | 11 (100.0%) | 11 (100.0%) |
| Total | 225 (41.3%) | 395 (72.5%) |
Disability Status by Sex by Age in Big Delta
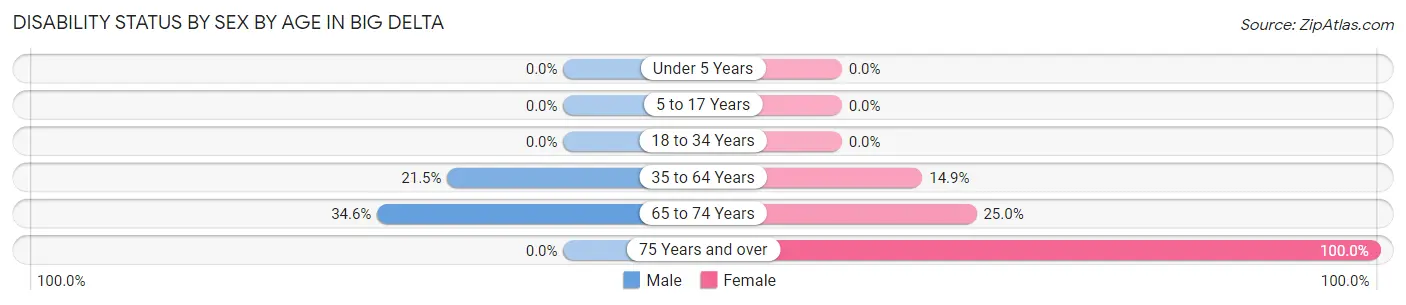
| Age Bracket | Male | Female |
| Under 5 Years | 0 (0.0%) | 0 (0.0%) |
| 5 to 17 Years | 0 (0.0%) | 0 (0.0%) |
| 18 to 34 Years | 0 (0.0%) | 0 (0.0%) |
| 35 to 64 Years | 31 (21.5%) | 13 (14.9%) |
| 65 to 74 Years | 19 (34.5%) | 12 (25.0%) |
| 75 Years and over | 0 (0.0%) | 11 (100.0%) |
Disability Class by Sex by Age in Big Delta
Disability Class: Hearing Difficulty
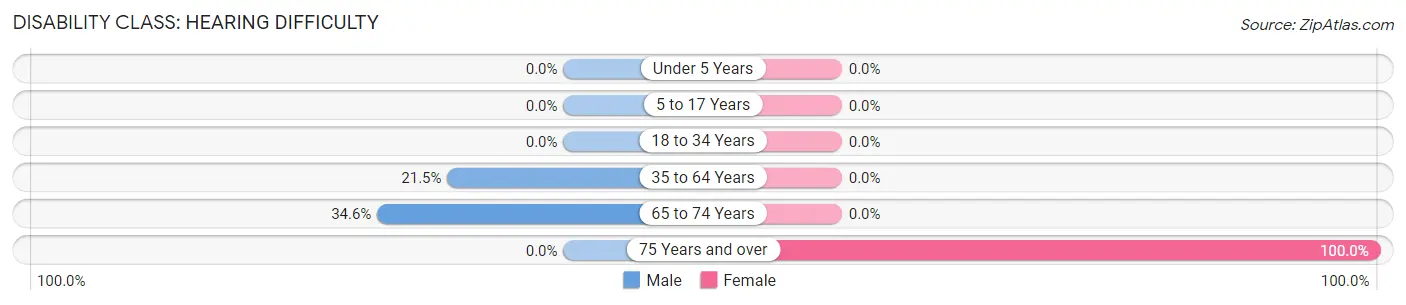
| Age Bracket | Male | Female |
| Under 5 Years | 0 (0.0%) | 0 (0.0%) |
| 5 to 17 Years | 0 (0.0%) | 0 (0.0%) |
| 18 to 34 Years | 0 (0.0%) | 0 (0.0%) |
| 35 to 64 Years | 31 (21.5%) | 0 (0.0%) |
| 65 to 74 Years | 19 (34.5%) | 0 (0.0%) |
| 75 Years and over | 0 (0.0%) | 11 (100.0%) |
Disability Class: Vision Difficulty
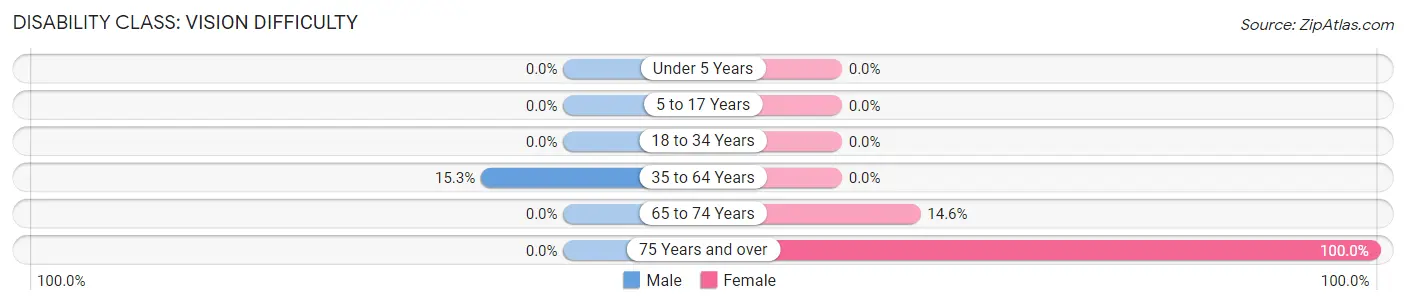
| Age Bracket | Male | Female |
| Under 5 Years | 0 (0.0%) | 0 (0.0%) |
| 5 to 17 Years | 0 (0.0%) | 0 (0.0%) |
| 18 to 34 Years | 0 (0.0%) | 0 (0.0%) |
| 35 to 64 Years | 22 (15.3%) | 0 (0.0%) |
| 65 to 74 Years | 0 (0.0%) | 7 (14.6%) |
| 75 Years and over | 0 (0.0%) | 11 (100.0%) |
Disability Class: Cognitive Difficulty

| Age Bracket | Male | Female |
| 5 to 17 Years | 0 (0.0%) | 0 (0.0%) |
| 18 to 34 Years | 0 (0.0%) | 0 (0.0%) |
| 35 to 64 Years | 22 (15.3%) | 0 (0.0%) |
| 65 to 74 Years | 0 (0.0%) | 0 (0.0%) |
| 75 Years and over | 0 (0.0%) | 11 (100.0%) |
Disability Class: Ambulatory Difficulty
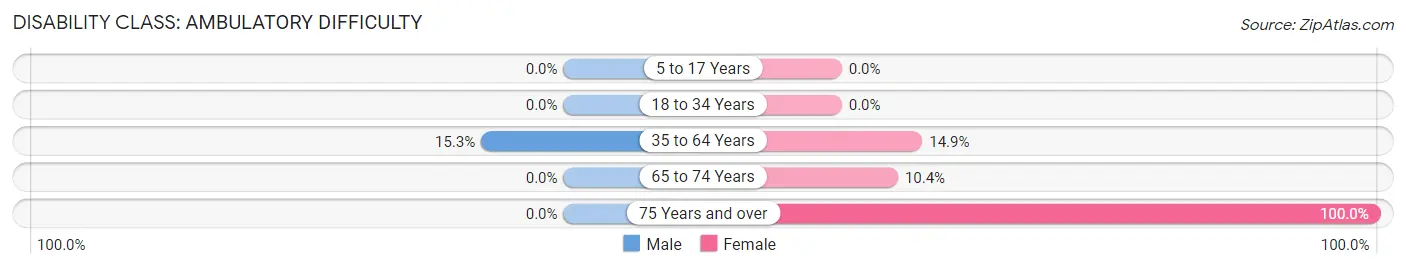
| Age Bracket | Male | Female |
| 5 to 17 Years | 0 (0.0%) | 0 (0.0%) |
| 18 to 34 Years | 0 (0.0%) | 0 (0.0%) |
| 35 to 64 Years | 22 (15.3%) | 13 (14.9%) |
| 65 to 74 Years | 0 (0.0%) | 5 (10.4%) |
| 75 Years and over | 0 (0.0%) | 11 (100.0%) |
Disability Class: Self-Care Difficulty
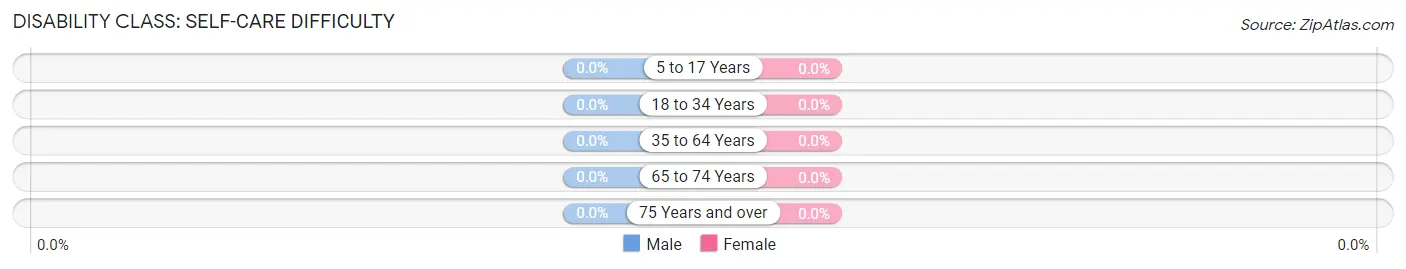
| Age Bracket | Male | Female |
| 5 to 17 Years | 0 (0.0%) | 0 (0.0%) |
| 18 to 34 Years | 0 (0.0%) | 0 (0.0%) |
| 35 to 64 Years | 0 (0.0%) | 0 (0.0%) |
| 65 to 74 Years | 0 (0.0%) | 0 (0.0%) |
| 75 Years and over | 0 (0.0%) | 0 (0.0%) |
Technology Access in Big Delta
Computing Device Access in Big Delta
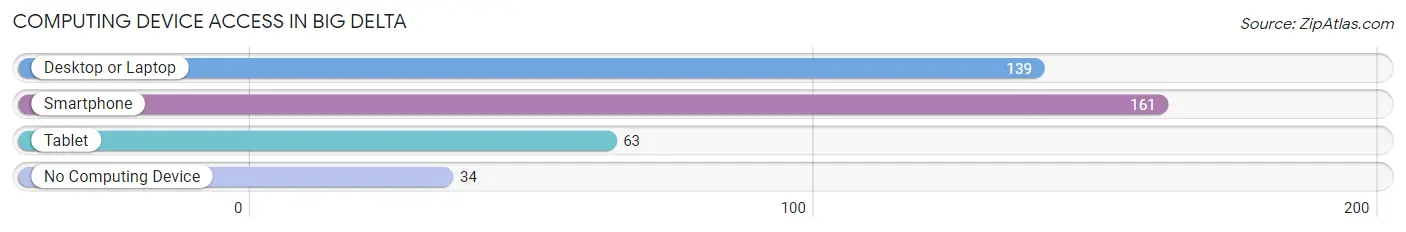
| Device Type | # Households | % Households |
| Desktop or Laptop | 139 | 71.3% |
| Smartphone | 161 | 82.6% |
| Tablet | 63 | 32.3% |
| No Computing Device | 34 | 17.4% |
| Total | 195 | 100.0% |
Internet Access in Big Delta
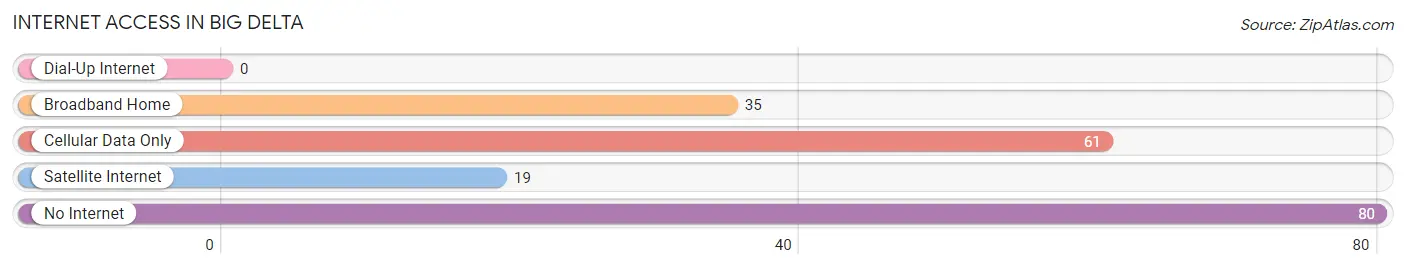
| Internet Type | # Households | % Households |
| Dial-Up Internet | 0 | 0.0% |
| Broadband Home | 35 | 17.9% |
| Cellular Data Only | 61 | 31.3% |
| Satellite Internet | 19 | 9.7% |
| No Internet | 80 | 41.0% |
| Total | 195 | 100.0% |
Big Delta Summary
Big Delta, Alaska is a small unincorporated community located in the southeastern part of the state. It is situated on the banks of the Tanana River, approximately 100 miles southeast of Fairbanks. The population of Big Delta was estimated to be around 200 people in 2020.
History
Big Delta was originally inhabited by the Athabascan people, who lived in the area for thousands of years before the arrival of Europeans. The first Europeans to visit the area were Russian fur traders in the late 18th century. The area was later explored by American prospectors in the late 19th century, who established a trading post in the area.
The town of Big Delta was officially established in 1902, when the Alaska Central Railroad was built through the area. The railroad brought an influx of settlers to the area, and the town quickly grew. By 1910, the population had grown to over 500 people.
The town was named after the nearby Big Delta River, which was named by the explorer Robert Kennicott in 1866. The river was so named because of its large delta, which is formed by the confluence of the Tanana and Delta Rivers.
Geography
Big Delta is located in the southeastern part of Alaska, approximately 100 miles southeast of Fairbanks. It is situated on the banks of the Tanana River, which is part of the Yukon River system. The town is surrounded by the White Mountains to the east and the Alaska Range to the west.
The climate in Big Delta is subarctic, with cold winters and mild summers. The average temperature in January is -15°F (-26°C), and the average temperature in July is 65°F (18°C). The average annual precipitation is 11 inches (279 mm).
Economy
The economy of Big Delta is largely based on tourism and subsistence activities. The town is a popular destination for hunters, fishermen, and other outdoor enthusiasts. There are several lodges and cabins in the area that cater to tourists.
The town also has a small commercial fishing industry, which is centered around the nearby Tanana River. The river is home to several species of salmon, as well as whitefish, grayling, and other fish.
Demographics
The population of Big Delta was estimated to be around 200 people in 2020. The majority of the population is of Native American descent, with the largest ethnic group being the Athabascan people. The town also has a small population of non-Native Americans, mostly of European descent.
The town is served by the Big Delta School District, which operates one elementary school and one high school. The town also has a small library and a post office.
Conclusion
Big Delta is a small unincorporated community located in the southeastern part of Alaska. It is situated on the banks of the Tanana River, and is a popular destination for hunters, fishermen, and other outdoor enthusiasts. The population of Big Delta was estimated to be around 200 people in 2020, and the majority of the population is of Native American descent. The town is served by the Big Delta School District, and has a small commercial fishing industry.
Common Questions
What is Per Capita Income in Big Delta?
Per Capita income in Big Delta is $32,177.
What is the Median Family Income in Big Delta?
Median Family Income in Big Delta is $96,708.
What is the Median Household income in Big Delta?
Median Household Income in Big Delta is $96,125.
What is Income or Wage Gap in Big Delta?
Income or Wage Gap in Big Delta is 16.4%.
Women in Big Delta earn 83.6 cents for every dollar earned by a man.
What is Inequality or Gini Index in Big Delta?
Inequality or Gini Index in Big Delta is 0.31.
What is the Total Population of Big Delta?
Total Population of Big Delta is 545.
What is the Total Male Population of Big Delta?
Total Male Population of Big Delta is 336.
What is the Total Female Population of Big Delta?
Total Female Population of Big Delta is 209.
What is the Ratio of Males per 100 Females in Big Delta?
There are 160.77 Males per 100 Females in Big Delta.
What is the Ratio of Females per 100 Males in Big Delta?
There are 62.20 Females per 100 Males in Big Delta.
What is the Median Population Age in Big Delta?
Median Population Age in Big Delta is 54.4 Years.
What is the Average Family Size in Big Delta
Average Family Size in Big Delta is 3.6 People.
What is the Average Household Size in Big Delta
Average Household Size in Big Delta is 2.8 People.
How Large is the Labor Force in Big Delta?
There are 243 People in the Labor Forcein in Big Delta.
What is the Percentage of People in the Labor Force in Big Delta?
53.1% of People are in the Labor Force in Big Delta.
What is the Unemployment Rate in Big Delta?
Unemployment Rate in Big Delta is 24.7%.