Napaskiak, AK Map & Demographics
Napaskiak Map
Napaskiak Overview
$11,874
PER CAPITA INCOME
$35,417
AVG FAMILY INCOME
$34,569
AVG HOUSEHOLD INCOME
35.1%
WAGE / INCOME GAP [ % ]
64.9¢/ $1
WAGE / INCOME GAP [ $ ]
$15,264
FAMILY INCOME DEFICIT
0.46
INEQUALITY / GINI INDEX
582
TOTAL POPULATION
314
MALE POPULATION
268
FEMALE POPULATION
117.16
MALES / 100 FEMALES
85.35
FEMALES / 100 MALES
22.5
MEDIAN AGE
5.0
AVG FAMILY SIZE
4.8
AVG HOUSEHOLD SIZE
151
LABOR FORCE [ PEOPLE ]
41.9%
PERCENT IN LABOR FORCE
26.5%
UNEMPLOYMENT RATE
Napaskiak Area Codes
Income in Napaskiak
Income Overview in Napaskiak
Per Capita Income in Napaskiak is $11,874, while median incomes of families and households are $35,417 and $34,569 respectively.
| Characteristic | Number | Measure |
| Per Capita Income | 582 | $11,874 |
| Median Family Income | 111 | $35,417 |
| Mean Family Income | 111 | $55,486 |
| Median Household Income | 122 | $34,569 |
| Mean Household Income | 122 | $53,136 |
| Income Deficit | 111 | $15,264 |
| Wage / Income Gap (%) | 582 | 35.12% |
| Wage / Income Gap ($) | 582 | 64.88¢ per $1 |
| Gini / Inequality Index | 582 | 0.46 |
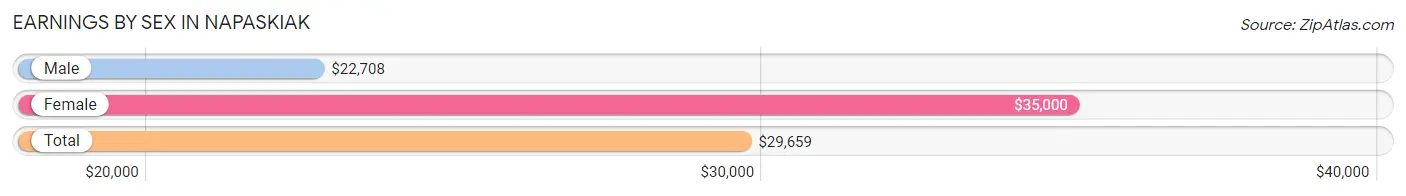
Earnings by Sex in Napaskiak
Average Earnings in Napaskiak are $29,659, $22,708 for men and $35,000 for women, a difference of 35.1%.
| Sex | Number | Average Earnings |
| Male | 65 (46.8%) | $22,708 |
| Female | 74 (53.2%) | $35,000 |
| Total | 139 (100.0%) | $29,659 |
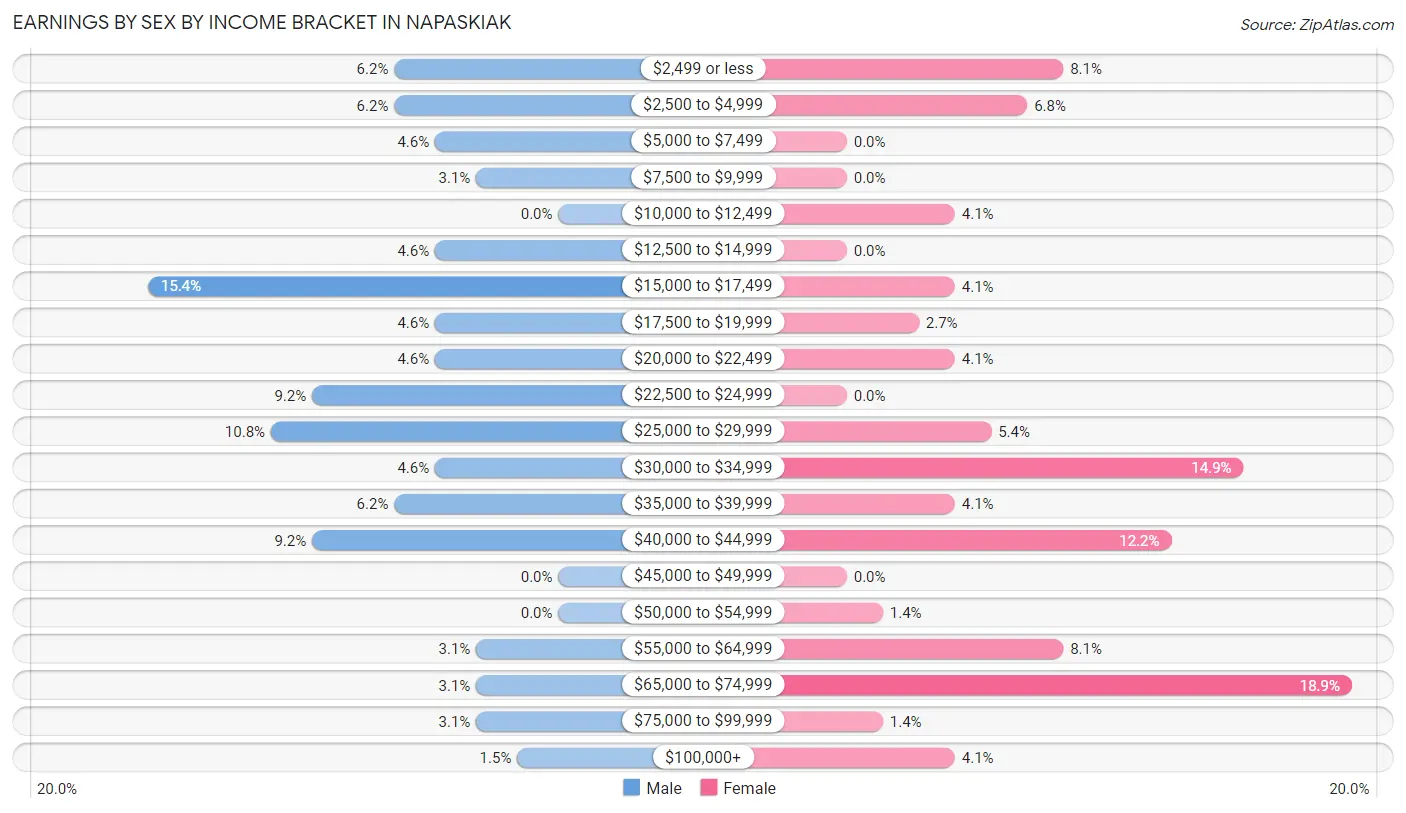
Earnings by Sex by Income Bracket in Napaskiak
The most common earnings brackets in Napaskiak are $15,000 to $17,499 for men (10 | 15.4%) and $65,000 to $74,999 for women (14 | 18.9%).
| Income | Male | Female |
| $2,499 or less | 4 (6.1%) | 6 (8.1%) |
| $2,500 to $4,999 | 4 (6.1%) | 5 (6.8%) |
| $5,000 to $7,499 | 3 (4.6%) | 0 (0.0%) |
| $7,500 to $9,999 | 2 (3.1%) | 0 (0.0%) |
| $10,000 to $12,499 | 0 (0.0%) | 3 (4.1%) |
| $12,500 to $14,999 | 3 (4.6%) | 0 (0.0%) |
| $15,000 to $17,499 | 10 (15.4%) | 3 (4.1%) |
| $17,500 to $19,999 | 3 (4.6%) | 2 (2.7%) |
| $20,000 to $22,499 | 3 (4.6%) | 3 (4.1%) |
| $22,500 to $24,999 | 6 (9.2%) | 0 (0.0%) |
| $25,000 to $29,999 | 7 (10.8%) | 4 (5.4%) |
| $30,000 to $34,999 | 3 (4.6%) | 11 (14.9%) |
| $35,000 to $39,999 | 4 (6.1%) | 3 (4.1%) |
| $40,000 to $44,999 | 6 (9.2%) | 9 (12.2%) |
| $45,000 to $49,999 | 0 (0.0%) | 0 (0.0%) |
| $50,000 to $54,999 | 0 (0.0%) | 1 (1.3%) |
| $55,000 to $64,999 | 2 (3.1%) | 6 (8.1%) |
| $65,000 to $74,999 | 2 (3.1%) | 14 (18.9%) |
| $75,000 to $99,999 | 2 (3.1%) | 1 (1.3%) |
| $100,000+ | 1 (1.5%) | 3 (4.1%) |
| Total | 65 (100.0%) | 74 (100.0%) |
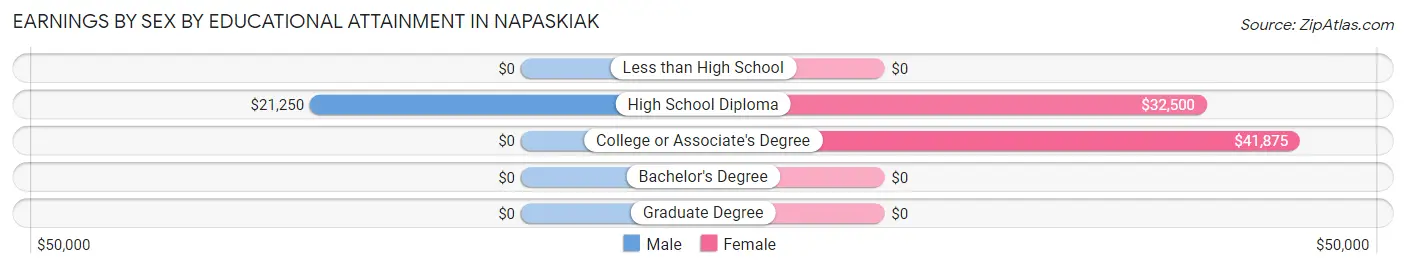
Earnings by Sex by Educational Attainment in Napaskiak
Average earnings in Napaskiak are $23,542 for men and $35,833 for women, a difference of 34.3%. Men with an educational attainment of high school diploma enjoy the highest average annual earnings of $21,250, while those with high school diploma education earn the least with $21,250. Women with an educational attainment of college or associate's degree earn the most with the average annual earnings of $41,875, while those with high school diploma education have the smallest earnings of $32,500.
| Educational Attainment | Male Income | Female Income |
| Less than High School | - | - |
| High School Diploma | $21,250 | $32,500 |
| College or Associate's Degree | - | - |
| Bachelor's Degree | - | - |
| Graduate Degree | - | - |
| Total | $23,542 | $35,833 |
Family Income in Napaskiak
Family Income Brackets in Napaskiak
According to the Napaskiak family income data, there are 32 families falling into the $25,000 to $34,999 income range, which is the most common income bracket and makes up 28.8% of all families.
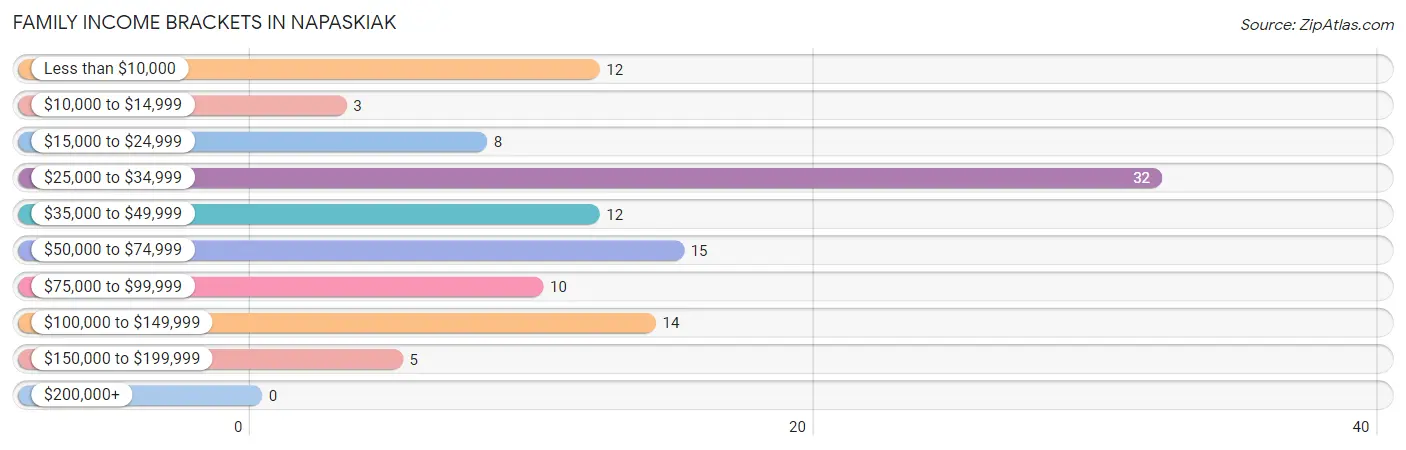
| Income Bracket | # Families | % Families |
| Less than $10,000 | 12 | 10.8% |
| $10,000 to $14,999 | 3 | 2.7% |
| $15,000 to $24,999 | 8 | 7.2% |
| $25,000 to $34,999 | 32 | 28.8% |
| $35,000 to $49,999 | 12 | 10.8% |
| $50,000 to $74,999 | 15 | 13.5% |
| $75,000 to $99,999 | 10 | 9.0% |
| $100,000 to $149,999 | 14 | 12.6% |
| $150,000 to $199,999 | 5 | 4.5% |
| $200,000+ | 0 | 0.0% |
Family Income by Famaliy Size in Napaskiak
6-person families (17 | 15.3%) account for the highest median family income in Napaskiak with $92,917 per family, while 3-person families (20 | 18.0%) have the highest median income of $18,542 per family member.
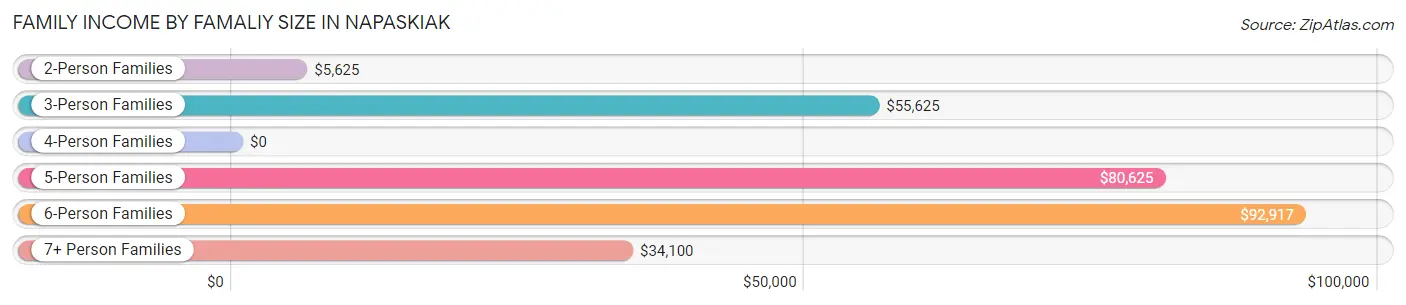
| Income Bracket | # Families | Median Income |
| 2-Person Families | 9 (8.1%) | $5,625 |
| 3-Person Families | 20 (18.0%) | $55,625 |
| 4-Person Families | 12 (10.8%) | $0 |
| 5-Person Families | 15 (13.5%) | $80,625 |
| 6-Person Families | 17 (15.3%) | $92,917 |
| 7+ Person Families | 38 (34.2%) | $34,100 |
| Total | 111 (100.0%) | $35,417 |
Family Income by Number of Earners in Napaskiak
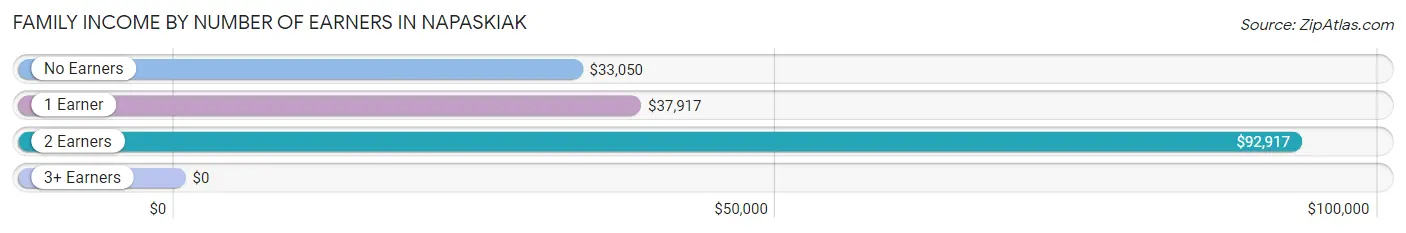
| Number of Earners | # Families | Median Income |
| No Earners | 39 (35.1%) | $33,050 |
| 1 Earner | 33 (29.7%) | $37,917 |
| 2 Earners | 29 (26.1%) | $92,917 |
| 3+ Earners | 10 (9.0%) | $0 |
| Total | 111 (100.0%) | $35,417 |
Household Income in Napaskiak
Household Income Brackets in Napaskiak
With 32 households falling in the category, the $25,000 to $34,999 income range is the most frequent in Napaskiak, accounting for 26.2% of all households.
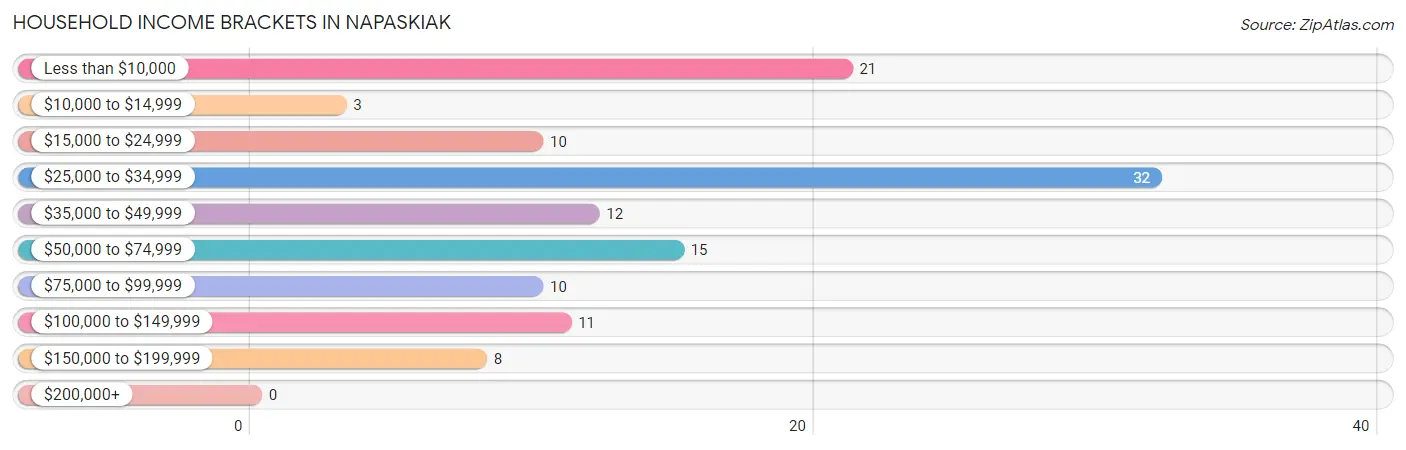
| Income Bracket | # Households | % Households |
| Less than $10,000 | 21 | 17.2% |
| $10,000 to $14,999 | 3 | 2.5% |
| $15,000 to $24,999 | 10 | 8.2% |
| $25,000 to $34,999 | 32 | 26.2% |
| $35,000 to $49,999 | 12 | 9.8% |
| $50,000 to $74,999 | 15 | 12.3% |
| $75,000 to $99,999 | 10 | 8.2% |
| $100,000 to $149,999 | 11 | 9.0% |
| $150,000 to $199,999 | 8 | 6.6% |
| $200,000+ | 0 | 0.0% |
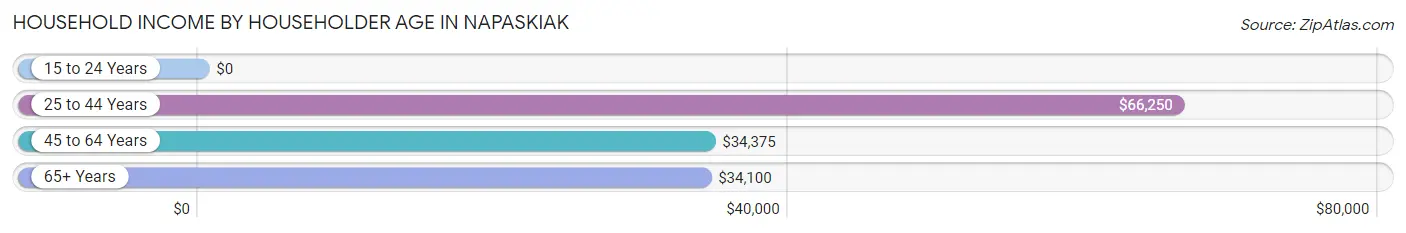
Household Income by Householder Age in Napaskiak
The median household income in Napaskiak is $34,569, with the highest median household income of $66,250 found in the 25 to 44 years age bracket for the primary householder. A total of 32 households (26.2%) fall into this category.
| Income Bracket | # Households | Median Income |
| 15 to 24 Years | 0 (0.0%) | $0 |
| 25 to 44 Years | 32 (26.2%) | $66,250 |
| 45 to 64 Years | 38 (31.1%) | $34,375 |
| 65+ Years | 52 (42.6%) | $34,100 |
| Total | 122 (100.0%) | $34,569 |
Poverty in Napaskiak
Income Below Poverty by Sex and Age in Napaskiak
With 51.0% poverty level for males and 43.3% for females among the residents of Napaskiak, 65 to 74 year old males and 16 and 17 year old females are the most vulnerable to poverty, with 30 males (88.2%) and 8 females (72.7%) in their respective age groups living below the poverty level.
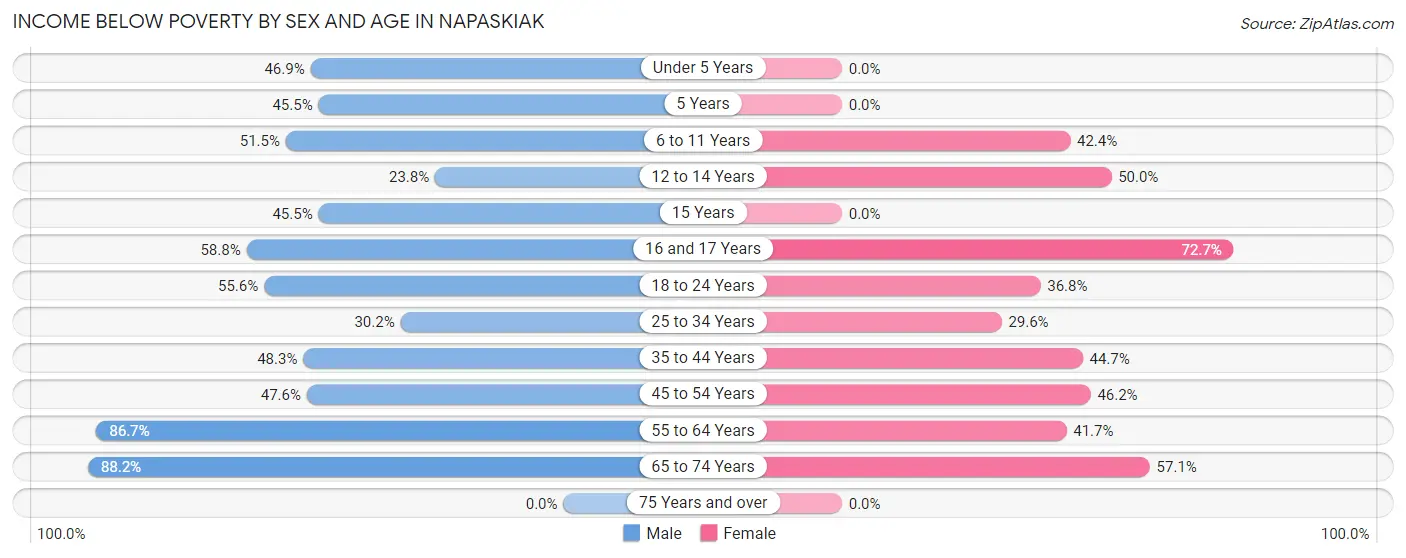
| Age Bracket | Male | Female |
| Under 5 Years | 23 (46.9%) | 0 (0.0%) |
| 5 Years | 5 (45.5%) | 0 (0.0%) |
| 6 to 11 Years | 17 (51.5%) | 25 (42.4%) |
| 12 to 14 Years | 5 (23.8%) | 12 (50.0%) |
| 15 Years | 5 (45.5%) | 0 (0.0%) |
| 16 and 17 Years | 10 (58.8%) | 8 (72.7%) |
| 18 to 24 Years | 15 (55.6%) | 7 (36.8%) |
| 25 to 34 Years | 13 (30.2%) | 8 (29.6%) |
| 35 to 44 Years | 14 (48.3%) | 21 (44.7%) |
| 45 to 54 Years | 10 (47.6%) | 6 (46.2%) |
| 55 to 64 Years | 13 (86.7%) | 5 (41.7%) |
| 65 to 74 Years | 30 (88.2%) | 24 (57.1%) |
| 75 Years and over | 0 (0.0%) | 0 (0.0%) |
| Total | 160 (51.0%) | 116 (43.3%) |
Income Above Poverty by Sex and Age in Napaskiak
According to the poverty statistics in Napaskiak, males aged 75 years and over and females aged under 5 years are the age groups that are most secure financially, with 100.0% of males and 100.0% of females in these age groups living above the poverty line.
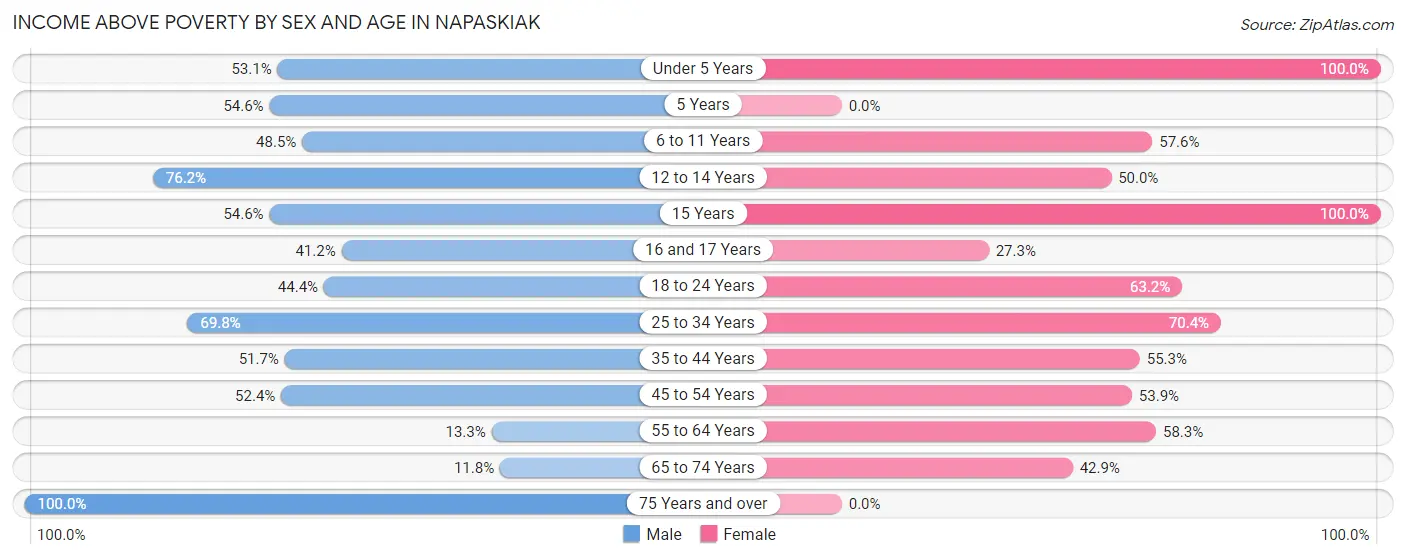
| Age Bracket | Male | Female |
| Under 5 Years | 26 (53.1%) | 11 (100.0%) |
| 5 Years | 6 (54.5%) | 0 (0.0%) |
| 6 to 11 Years | 16 (48.5%) | 34 (57.6%) |
| 12 to 14 Years | 16 (76.2%) | 12 (50.0%) |
| 15 Years | 6 (54.5%) | 3 (100.0%) |
| 16 and 17 Years | 7 (41.2%) | 3 (27.3%) |
| 18 to 24 Years | 12 (44.4%) | 12 (63.2%) |
| 25 to 34 Years | 30 (69.8%) | 19 (70.4%) |
| 35 to 44 Years | 15 (51.7%) | 26 (55.3%) |
| 45 to 54 Years | 11 (52.4%) | 7 (53.8%) |
| 55 to 64 Years | 2 (13.3%) | 7 (58.3%) |
| 65 to 74 Years | 4 (11.8%) | 18 (42.9%) |
| 75 Years and over | 3 (100.0%) | 0 (0.0%) |
| Total | 154 (49.0%) | 152 (56.7%) |
Income Below Poverty Among Married-Couple Families in Napaskiak
The poverty statistics for married-couple families in Napaskiak show that 66.7% or 34 of the total 51 families live below the poverty line. Families with 5 or more children have the highest poverty rate of 100.0%, comprising of 25 families. On the other hand, families with no children have the lowest poverty rate of 0.0%, which includes 0 families.
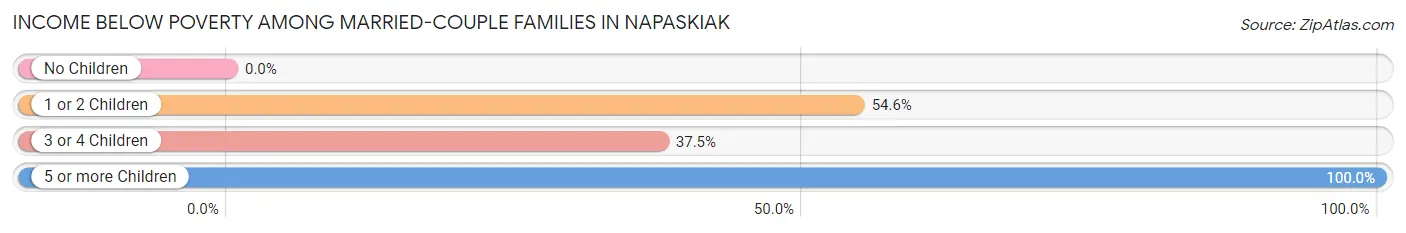
| Children | Above Poverty | Below Poverty |
| No Children | 7 (100.0%) | 0 (0.0%) |
| 1 or 2 Children | 5 (45.5%) | 6 (54.5%) |
| 3 or 4 Children | 5 (62.5%) | 3 (37.5%) |
| 5 or more Children | 0 (0.0%) | 25 (100.0%) |
| Total | 17 (33.3%) | 34 (66.7%) |
Income Below Poverty Among Single-Parent Households in Napaskiak
According to the poverty data in Napaskiak, 100.0% or 13 single-father households and 23.4% or 11 single-mother households are living below the poverty line. Among single-father households, those with no children have the highest poverty rate, with 9 households (100.0%) experiencing poverty. Likewise, among single-mother households, those with 5 or more children have the highest poverty rate, with 3 households (33.3%) falling below the poverty line.
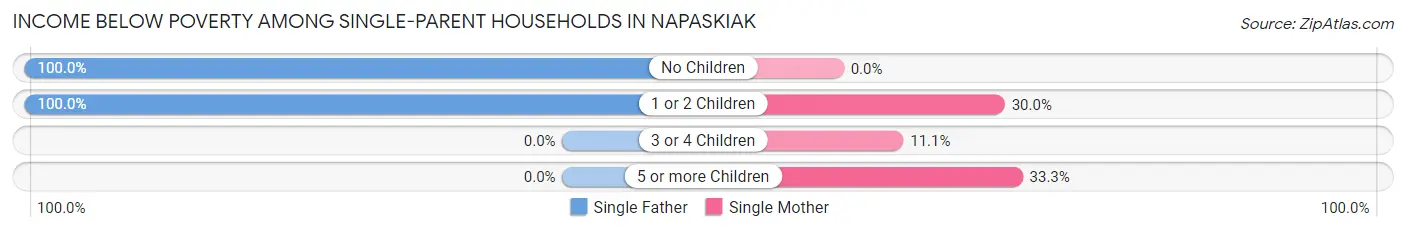
| Children | Single Father | Single Mother |
| No Children | 9 (100.0%) | 0 (0.0%) |
| 1 or 2 Children | 4 (100.0%) | 6 (30.0%) |
| 3 or 4 Children | 0 (0.0%) | 2 (11.1%) |
| 5 or more Children | 0 (0.0%) | 3 (33.3%) |
| Total | 13 (100.0%) | 11 (23.4%) |
Income Below Poverty Among Married-Couple vs Single-Parent Households in Napaskiak
The poverty data for Napaskiak shows that 34 of the married-couple family households (66.7%) and 24 of the single-parent households (40.0%) are living below the poverty level. Within the married-couple family households, those with 5 or more children have the highest poverty rate, with 25 households (100.0%) falling below the poverty line. Among the single-parent households, those with no children have the highest poverty rate, with 9 household (100.0%) living below poverty.
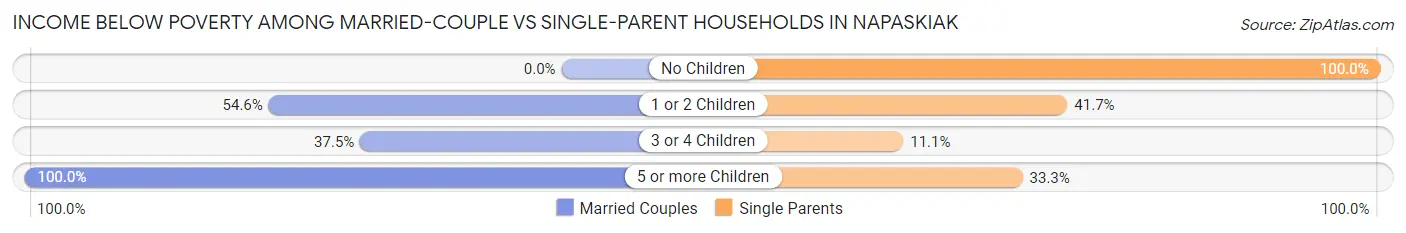
| Children | Married-Couple Families | Single-Parent Households |
| No Children | 0 (0.0%) | 9 (100.0%) |
| 1 or 2 Children | 6 (54.5%) | 10 (41.7%) |
| 3 or 4 Children | 3 (37.5%) | 2 (11.1%) |
| 5 or more Children | 25 (100.0%) | 3 (33.3%) |
| Total | 34 (66.7%) | 24 (40.0%) |
Race in Napaskiak
The most populous races in Napaskiak are Native / Alaskan (564 | 96.9%), Two or more Races (17 | 2.9%), and Hispanic or Latino (11 | 1.9%).
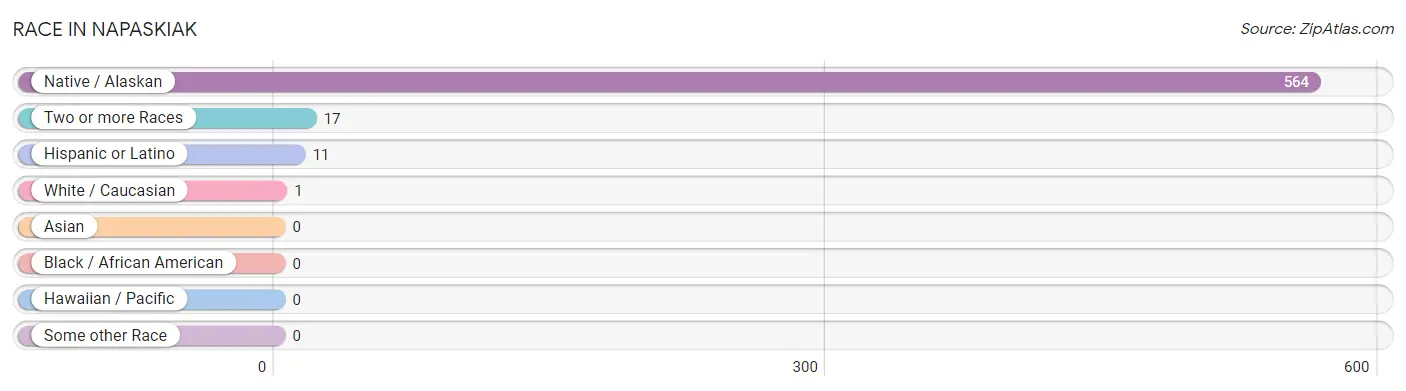
| Race | # Population | % Population |
| Asian | 0 | 0.0% |
| Black / African American | 0 | 0.0% |
| Hawaiian / Pacific | 0 | 0.0% |
| Hispanic or Latino | 11 | 1.9% |
| Native / Alaskan | 564 | 96.9% |
| White / Caucasian | 1 | 0.2% |
| Two or more Races | 17 | 2.9% |
| Some other Race | 0 | 0.0% |
| Total | 582 | 100.0% |
Ancestry in Napaskiak
The most populous ancestries reported in Napaskiak are Yup'ik (500 | 85.9%), Alaska Native (75 | 12.9%), Mexican (11 | 1.9%), Indian (Asian) (3 | 0.5%), and Tlingit-Haida (3 | 0.5%), together accounting for 101.7% of all Napaskiak residents.
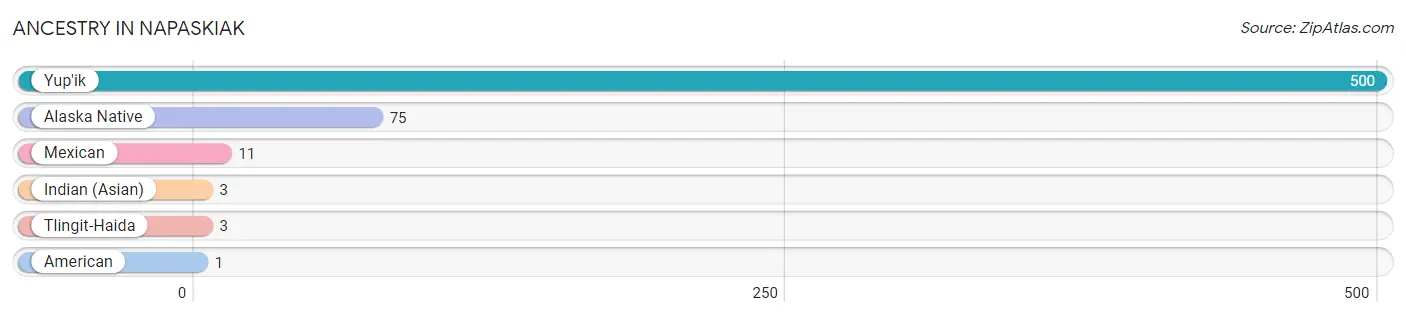
| Ancestry | # Population | % Population |
| Alaska Native | 75 | 12.9% |
| American | 1 | 0.2% |
| Indian (Asian) | 3 | 0.5% |
| Mexican | 11 | 1.9% |
| Tlingit-Haida | 3 | 0.5% |
| Yup'ik | 500 | 85.9% | View All 6 Rows |
Immigrants in Napaskiak

| Immigration Origin | # Population | % Population | View All 0 Rows |
Sex and Age in Napaskiak
Sex and Age in Napaskiak
The most populous age groups in Napaskiak are Under 5 Years (49 | 15.6%) for men and 10 to 14 Years (61 | 22.8%) for women.
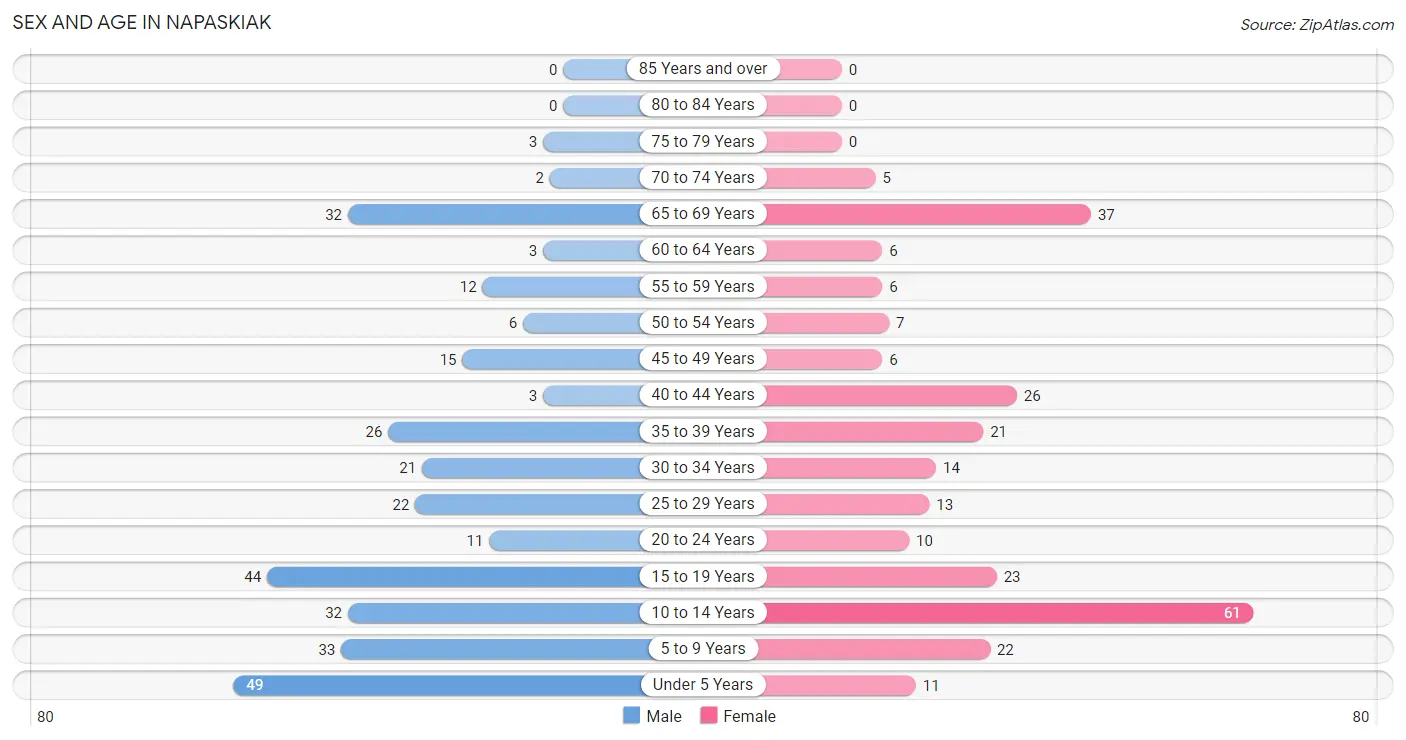
| Age Bracket | Male | Female |
| Under 5 Years | 49 (15.6%) | 11 (4.1%) |
| 5 to 9 Years | 33 (10.5%) | 22 (8.2%) |
| 10 to 14 Years | 32 (10.2%) | 61 (22.8%) |
| 15 to 19 Years | 44 (14.0%) | 23 (8.6%) |
| 20 to 24 Years | 11 (3.5%) | 10 (3.7%) |
| 25 to 29 Years | 22 (7.0%) | 13 (4.9%) |
| 30 to 34 Years | 21 (6.7%) | 14 (5.2%) |
| 35 to 39 Years | 26 (8.3%) | 21 (7.8%) |
| 40 to 44 Years | 3 (1.0%) | 26 (9.7%) |
| 45 to 49 Years | 15 (4.8%) | 6 (2.2%) |
| 50 to 54 Years | 6 (1.9%) | 7 (2.6%) |
| 55 to 59 Years | 12 (3.8%) | 6 (2.2%) |
| 60 to 64 Years | 3 (1.0%) | 6 (2.2%) |
| 65 to 69 Years | 32 (10.2%) | 37 (13.8%) |
| 70 to 74 Years | 2 (0.6%) | 5 (1.9%) |
| 75 to 79 Years | 3 (1.0%) | 0 (0.0%) |
| 80 to 84 Years | 0 (0.0%) | 0 (0.0%) |
| 85 Years and over | 0 (0.0%) | 0 (0.0%) |
| Total | 314 (100.0%) | 268 (100.0%) |
Families and Households in Napaskiak
Median Family Size in Napaskiak
The median family size in Napaskiak is 4.96 persons per family, with single female/mother families (47 | 42.3%) accounting for the largest median family size of 5.43 persons per family. On the other hand, single male/father families (13 | 11.7%) represent the smallest median family size with 3.46 persons per family.
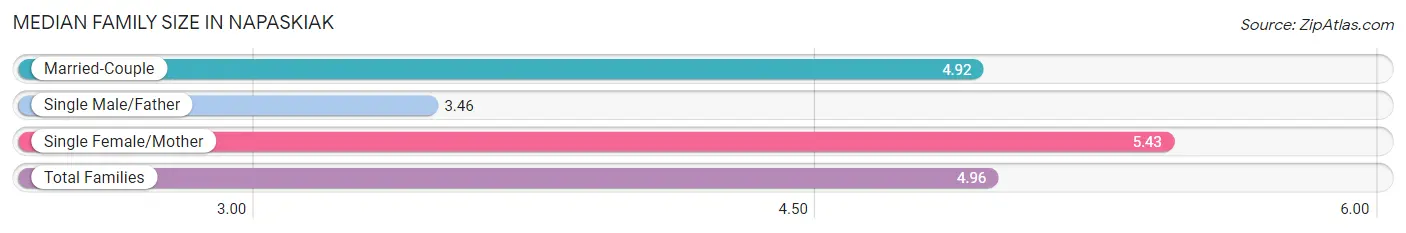
| Family Type | # Families | Family Size |
| Married-Couple | 51 (46.0%) | 4.92 |
| Single Male/Father | 13 (11.7%) | 3.46 |
| Single Female/Mother | 47 (42.3%) | 5.43 |
| Total Families | 111 (100.0%) | 4.96 |
Median Household Size in Napaskiak
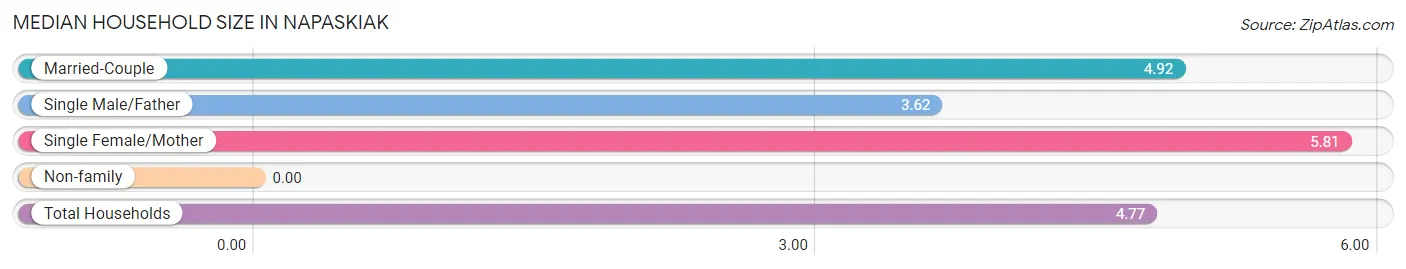
| Household Type | # Households | Household Size |
| Married-Couple | 51 (41.8%) | 4.92 |
| Single Male/Father | 13 (10.7%) | 3.62 |
| Single Female/Mother | 47 (38.5%) | 5.81 |
| Non-family | 11 (9.0%) | - |
| Total Households | 122 (100.0%) | 4.77 |
Household Size by Marriage Status in Napaskiak
Out of a total of 122 households in Napaskiak, 111 (91.0%) are family households, while 11 (9.0%) are nonfamily households. The most numerous type of family households are 7+ person households, comprising 44, and the most common type of nonfamily households are 1-person households, comprising 11.
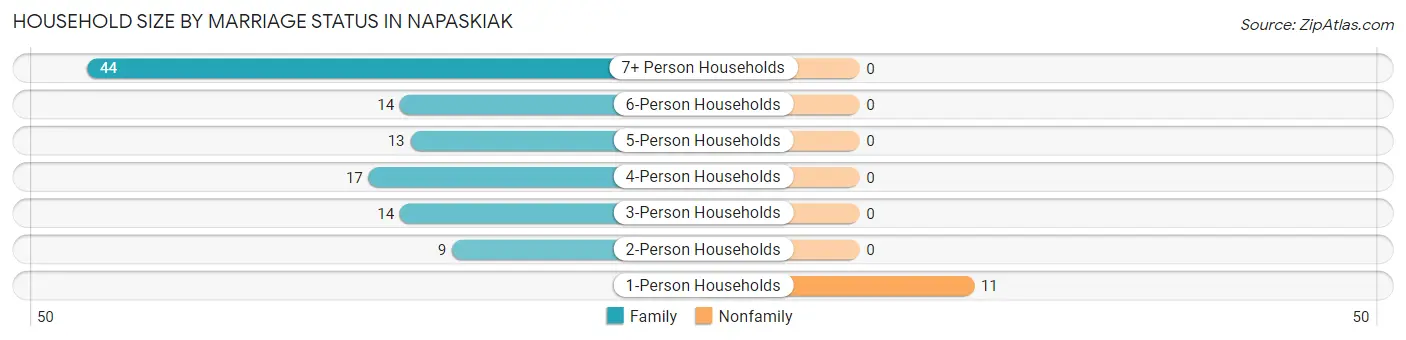
| Household Size | Family Households | Nonfamily Households |
| 1-Person Households | - | 11 (9.0%) |
| 2-Person Households | 9 (7.4%) | 0 (0.0%) |
| 3-Person Households | 14 (11.5%) | 0 (0.0%) |
| 4-Person Households | 17 (13.9%) | 0 (0.0%) |
| 5-Person Households | 13 (10.7%) | 0 (0.0%) |
| 6-Person Households | 14 (11.5%) | 0 (0.0%) |
| 7+ Person Households | 44 (36.1%) | 0 (0.0%) |
| Total | 111 (91.0%) | 11 (9.0%) |
Female Fertility in Napaskiak
Fertility by Age in Napaskiak
| Age Bracket | Women with Births | Births / 1,000 Women |
| 15 to 19 years | 0 (0.0%) | 0.0 |
| 20 to 34 years | 0 (0.0%) | 0.0 |
| 35 to 50 years | 0 (0.0%) | 0.0 |
| Total | 0 (0.0%) | 0.0 |
Fertility by Age by Marriage Status in Napaskiak
| Age Bracket | Married | Unmarried |
| 15 to 19 years | 0 (0.0%) | 0 (0.0%) |
| 20 to 34 years | 0 (0.0%) | 0 (0.0%) |
| 35 to 50 years | 0 (0.0%) | 0 (0.0%) |
| Total | 0 (0.0%) | 0 (0.0%) |
Fertility by Education in Napaskiak
| Educational Attainment | Women with Births | Births / 1,000 Women |
| Less than High School | 0 (0.0%) | 0.0 |
| High School Diploma | 0 (0.0%) | 0.0 |
| College or Associate's Degree | 0 (0.0%) | 0.0 |
| Bachelor's Degree | 0 (0.0%) | 0.0 |
| Graduate Degree | 0 (0.0%) | 0.0 |
| Total | 0 (0.0%) | 0.0 |
Fertility by Education by Marriage Status in Napaskiak
| Educational Attainment | Married | Unmarried |
| Less than High School | 0 (0.0%) | 0 (0.0%) |
| High School Diploma | 0 (0.0%) | 0 (0.0%) |
| College or Associate's Degree | 0 (0.0%) | 0 (0.0%) |
| Bachelor's Degree | 0 (0.0%) | 0 (0.0%) |
| Graduate Degree | 0 (0.0%) | 0 (0.0%) |
| Total | 0 (0.0%) | 0 (0.0%) |
Employment Characteristics in Napaskiak
Employment by Class of Employer in Napaskiak
Among the 102 employed individuals in Napaskiak, local government employees (45 | 44.1%), federal government employees (20 | 19.6%), and private company employees (17 | 16.7%) make up the most common classes of employment.
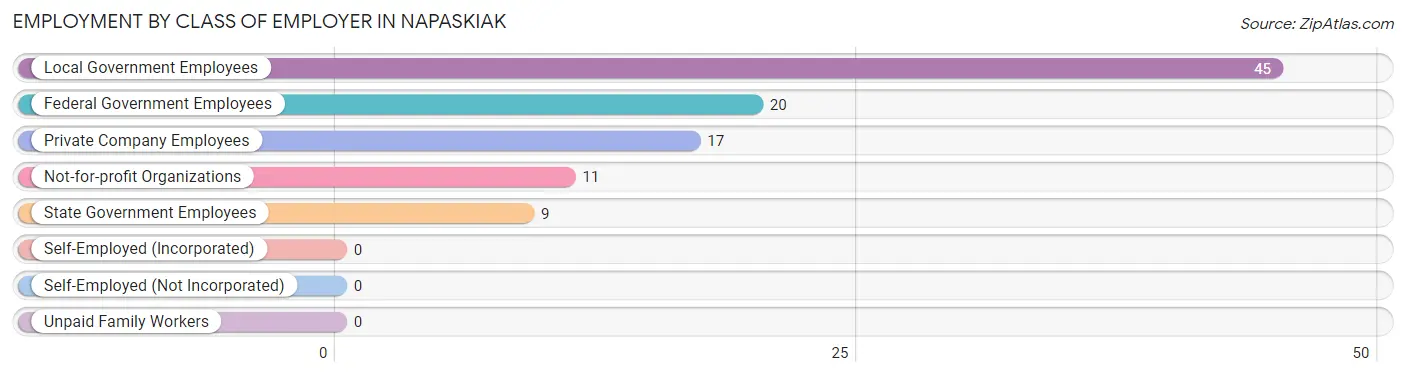
| Employer Class | # Employees | % Employees |
| Private Company Employees | 17 | 16.7% |
| Self-Employed (Incorporated) | 0 | 0.0% |
| Self-Employed (Not Incorporated) | 0 | 0.0% |
| Not-for-profit Organizations | 11 | 10.8% |
| Local Government Employees | 45 | 44.1% |
| State Government Employees | 9 | 8.8% |
| Federal Government Employees | 20 | 19.6% |
| Unpaid Family Workers | 0 | 0.0% |
| Total | 102 | 100.0% |
Employment Status by Age in Napaskiak
According to the labor force statistics for Napaskiak, out of the total population over 16 years of age (360), 41.9% or 151 individuals are in the labor force, with 26.5% or 40 of them unemployed. The age group with the highest labor force participation rate is 60 to 64 years, with 100.0% or 9 individuals in the labor force. Within the labor force, the 16 to 19 years age range has the highest percentage of unemployed individuals, with 100.0% or 11 of them being unemployed.
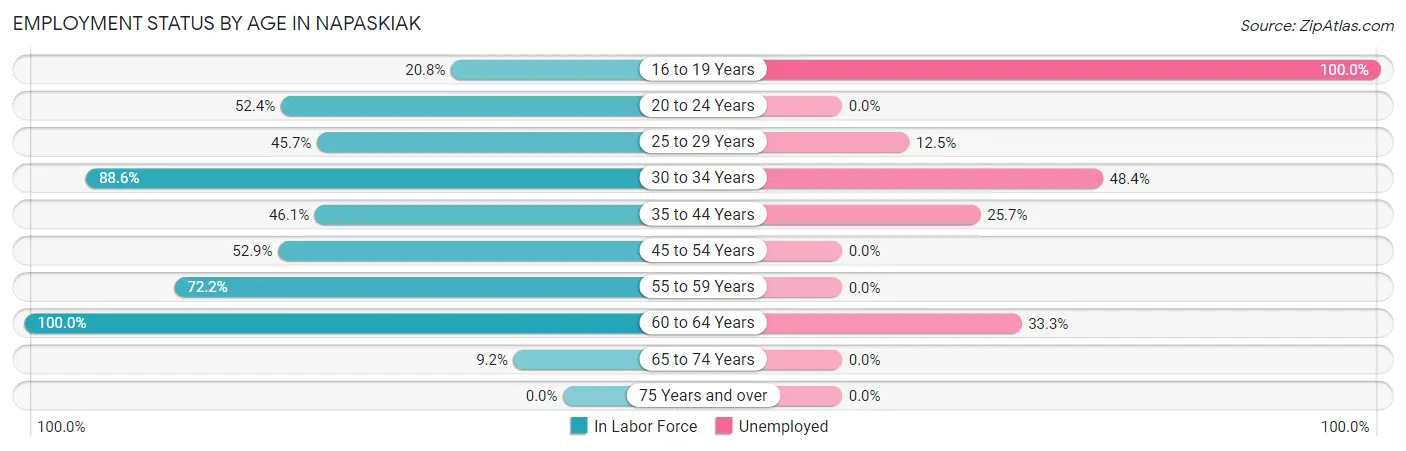
| Age Bracket | In Labor Force | Unemployed |
| 16 to 19 Years | 11 (20.8%) | 11 (100.0%) |
| 20 to 24 Years | 11 (52.4%) | 0 (0.0%) |
| 25 to 29 Years | 16 (45.7%) | 2 (12.5%) |
| 30 to 34 Years | 31 (88.6%) | 15 (48.4%) |
| 35 to 44 Years | 35 (46.1%) | 9 (25.7%) |
| 45 to 54 Years | 18 (52.9%) | 0 (0.0%) |
| 55 to 59 Years | 13 (72.2%) | 0 (0.0%) |
| 60 to 64 Years | 9 (100.0%) | 3 (33.3%) |
| 65 to 74 Years | 7 (9.2%) | 0 (0.0%) |
| 75 Years and over | 0 (0.0%) | 0 (0.0%) |
| Total | 151 (41.9%) | 40 (26.5%) |
Employment Status by Educational Attainment in Napaskiak
According to labor force statistics for Napaskiak, 58.9% of individuals (122) out of the total population between 25 and 64 years of age (207) are in the labor force, with 23.8% or 29 of them being unemployed. The group with the highest labor force participation rate are those with the educational attainment of less than high school, with 75.0% or 18 individuals in the labor force. Within the labor force, individuals with less than high school education have the highest percentage of unemployment, with 33.3% or 6 of them being unemployed.
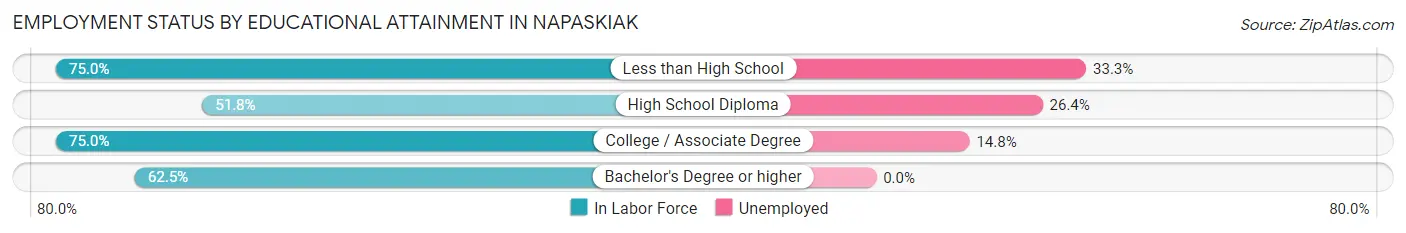
| Educational Attainment | In Labor Force | Unemployed |
| Less than High School | 18 (75.0%) | 8 (33.3%) |
| High School Diploma | 72 (51.8%) | 37 (26.4%) |
| College / Associate Degree | 27 (75.0%) | 5 (14.8%) |
| Bachelor's Degree or higher | 5 (62.5%) | 0 (0.0%) |
| Total | 122 (58.9%) | 49 (23.8%) |
Employment Occupations by Sex in Napaskiak
Management, Business, Science and Arts Occupations
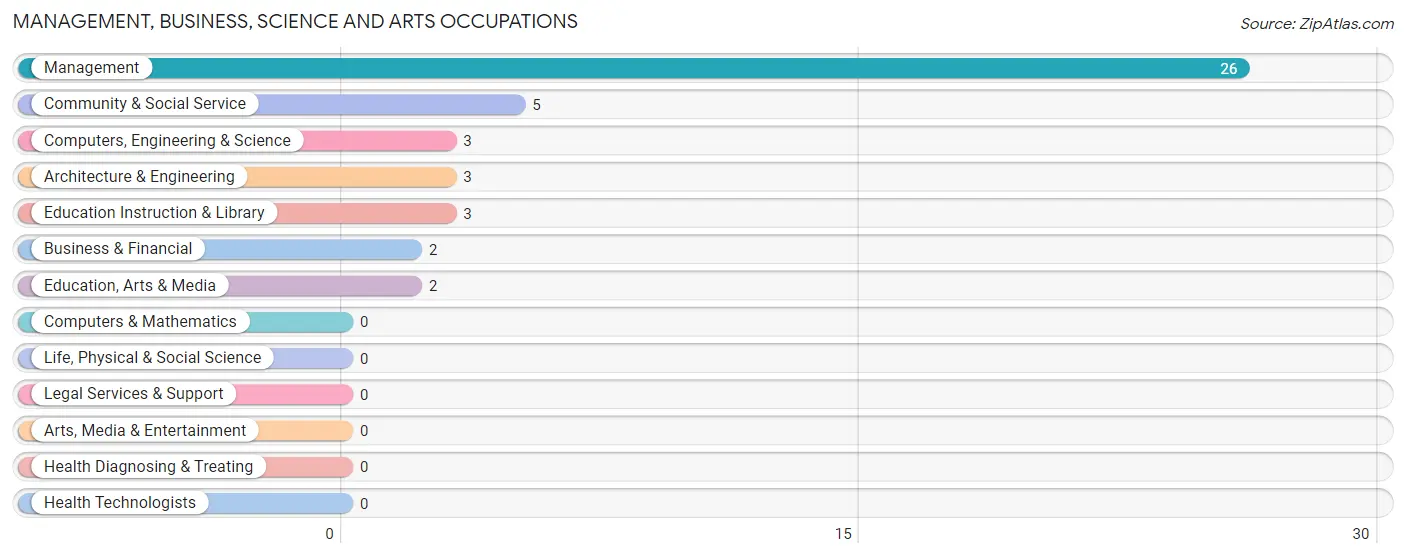
The most common Management, Business, Science and Arts occupations in Napaskiak are Management (26 | 23.4%), Community & Social Service (5 | 4.5%), Computers, Engineering & Science (3 | 2.7%), Architecture & Engineering (3 | 2.7%), and Education Instruction & Library (3 | 2.7%).
Management, Business, Science and Arts Occupations by Sex
Within the Management, Business, Science and Arts occupations in Napaskiak, the most male-oriented occupations are Business & Financial (100.0%), and Management (15.4%), while the most female-oriented occupations are Computers, Engineering & Science (100.0%), Architecture & Engineering (100.0%), and Community & Social Service (100.0%).
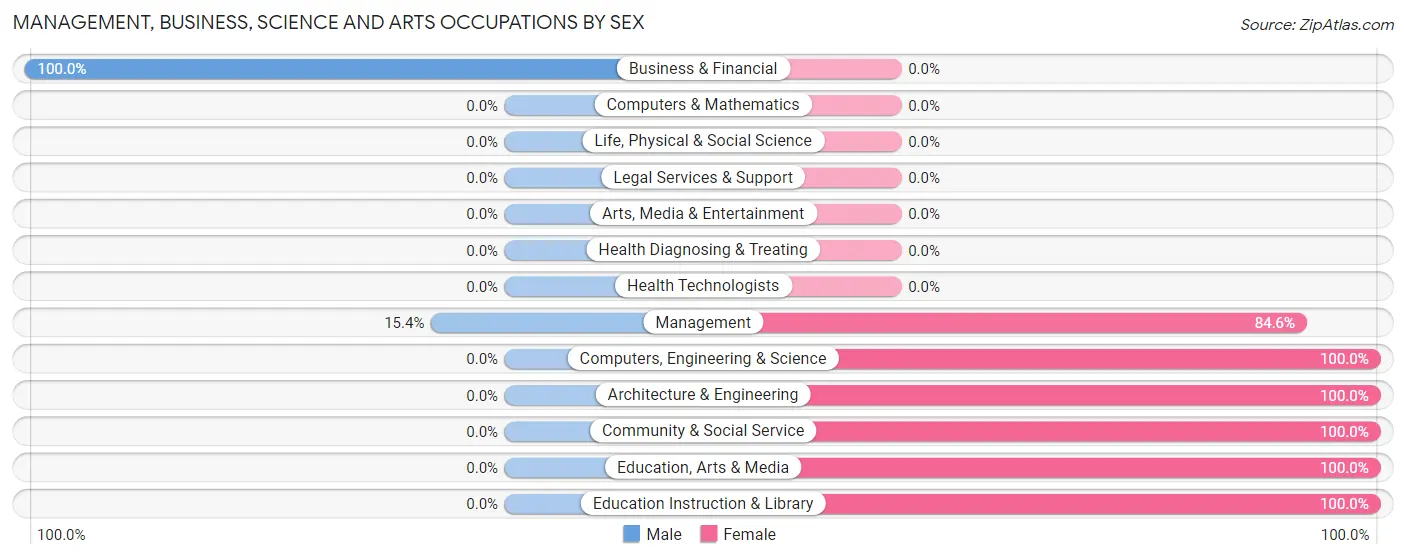
| Occupation | Male | Female |
| Management | 4 (15.4%) | 22 (84.6%) |
| Business & Financial | 2 (100.0%) | 0 (0.0%) |
| Computers, Engineering & Science | 0 (0.0%) | 3 (100.0%) |
| Computers & Mathematics | 0 (0.0%) | 0 (0.0%) |
| Architecture & Engineering | 0 (0.0%) | 3 (100.0%) |
| Life, Physical & Social Science | 0 (0.0%) | 0 (0.0%) |
| Community & Social Service | 0 (0.0%) | 5 (100.0%) |
| Education, Arts & Media | 0 (0.0%) | 2 (100.0%) |
| Legal Services & Support | 0 (0.0%) | 0 (0.0%) |
| Education Instruction & Library | 0 (0.0%) | 3 (100.0%) |
| Arts, Media & Entertainment | 0 (0.0%) | 0 (0.0%) |
| Health Diagnosing & Treating | 0 (0.0%) | 0 (0.0%) |
| Health Technologists | 0 (0.0%) | 0 (0.0%) |
| Total (Category) | 6 (16.7%) | 30 (83.3%) |
| Total (Overall) | 43 (38.7%) | 68 (61.3%) |
Services Occupations
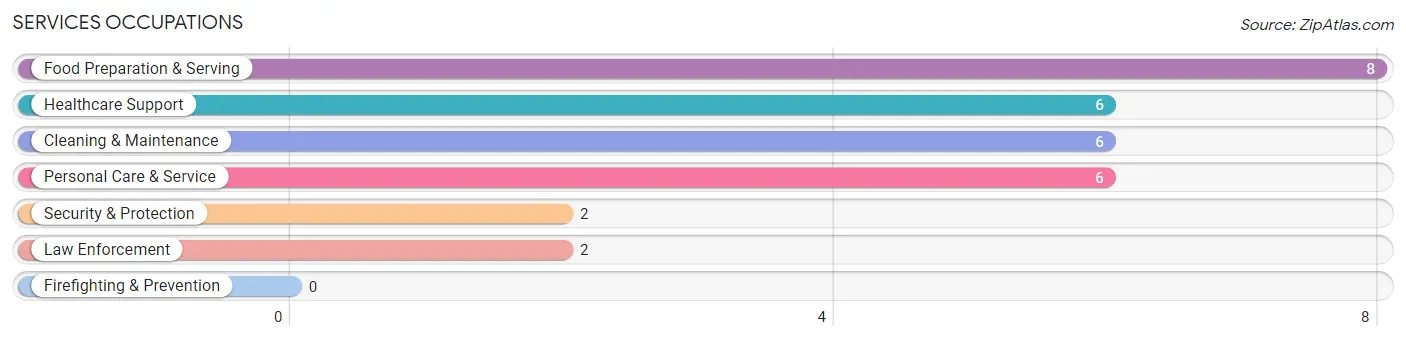
The most common Services occupations in Napaskiak are Food Preparation & Serving (8 | 7.2%), Healthcare Support (6 | 5.4%), Cleaning & Maintenance (6 | 5.4%), Personal Care & Service (6 | 5.4%), and Security & Protection (2 | 1.8%).
Services Occupations by Sex
Within the Services occupations in Napaskiak, the most male-oriented occupations are Security & Protection (100.0%), Law Enforcement (100.0%), and Cleaning & Maintenance (100.0%), while the most female-oriented occupations are Healthcare Support (100.0%), Personal Care & Service (100.0%), and Food Preparation & Serving (75.0%).
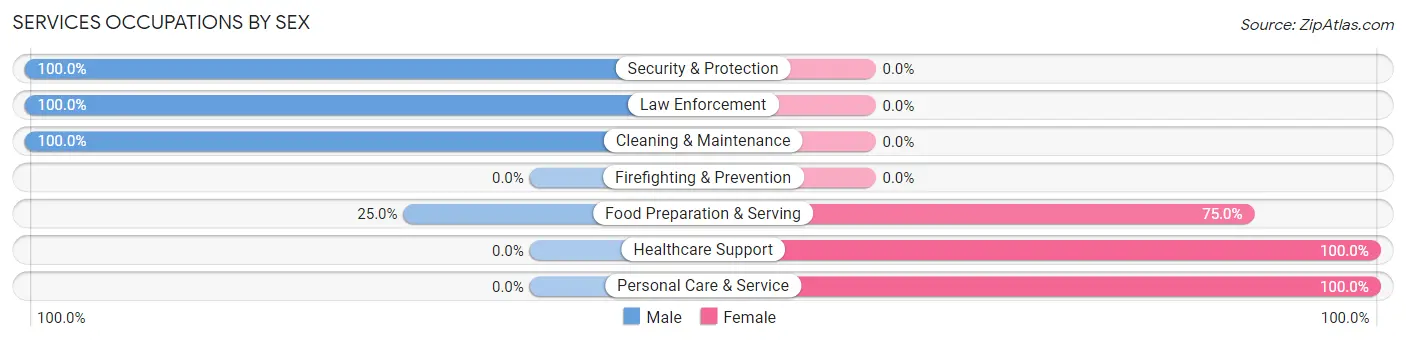
| Occupation | Male | Female |
| Healthcare Support | 0 (0.0%) | 6 (100.0%) |
| Security & Protection | 2 (100.0%) | 0 (0.0%) |
| Firefighting & Prevention | 0 (0.0%) | 0 (0.0%) |
| Law Enforcement | 2 (100.0%) | 0 (0.0%) |
| Food Preparation & Serving | 2 (25.0%) | 6 (75.0%) |
| Cleaning & Maintenance | 6 (100.0%) | 0 (0.0%) |
| Personal Care & Service | 0 (0.0%) | 6 (100.0%) |
| Total (Category) | 10 (35.7%) | 18 (64.3%) |
| Total (Overall) | 43 (38.7%) | 68 (61.3%) |
Sales and Office Occupations
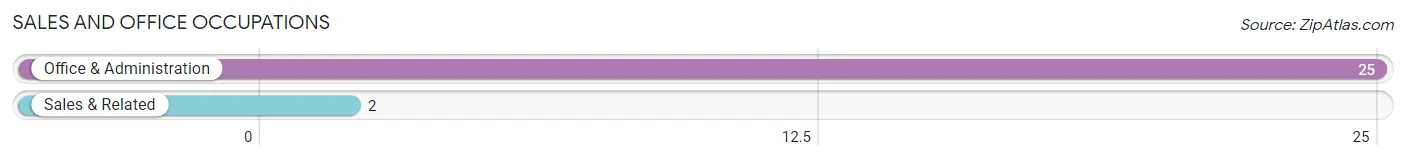
The most common Sales and Office occupations in Napaskiak are Office & Administration (25 | 22.5%), and Sales & Related (2 | 1.8%).
Sales and Office Occupations by Sex

| Occupation | Male | Female |
| Sales & Related | 2 (100.0%) | 0 (0.0%) |
| Office & Administration | 5 (20.0%) | 20 (80.0%) |
| Total (Category) | 7 (25.9%) | 20 (74.1%) |
| Total (Overall) | 43 (38.7%) | 68 (61.3%) |
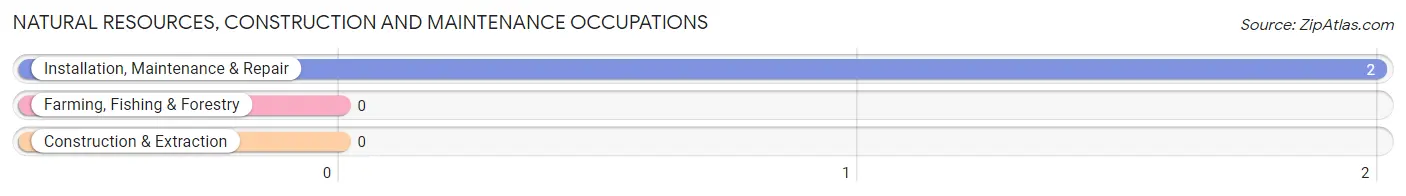
Natural Resources, Construction and Maintenance Occupations
The most common Natural Resources, Construction and Maintenance occupations in Napaskiak are , and Installation, Maintenance & Repair (2 | 1.8%).
Natural Resources, Construction and Maintenance Occupations by Sex
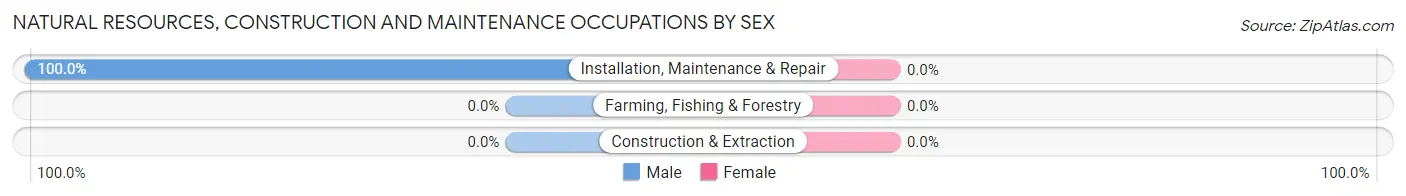
| Occupation | Male | Female |
| Farming, Fishing & Forestry | 0 (0.0%) | 0 (0.0%) |
| Construction & Extraction | 0 (0.0%) | 0 (0.0%) |
| Installation, Maintenance & Repair | 2 (100.0%) | 0 (0.0%) |
| Total (Category) | 2 (100.0%) | 0 (0.0%) |
| Total (Overall) | 43 (38.7%) | 68 (61.3%) |
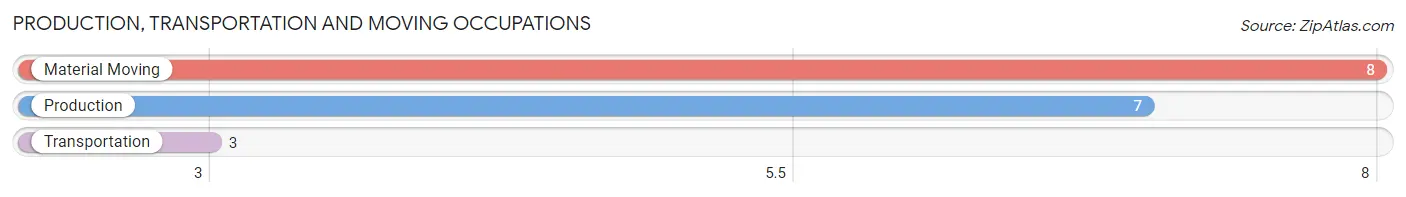
Production, Transportation and Moving Occupations
The most common Production, Transportation and Moving occupations in Napaskiak are Material Moving (8 | 7.2%), Production (7 | 6.3%), and Transportation (3 | 2.7%).
Production, Transportation and Moving Occupations by Sex
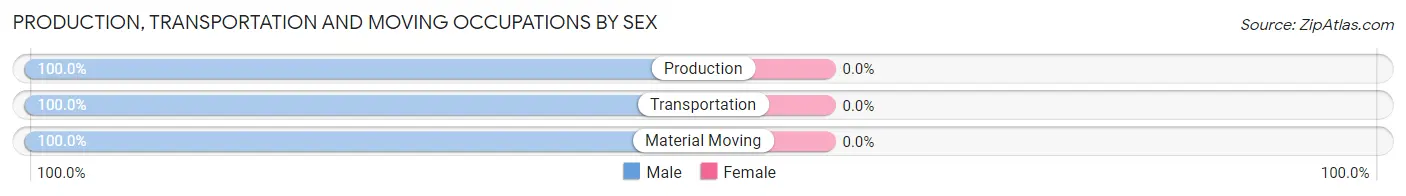
| Occupation | Male | Female |
| Production | 7 (100.0%) | 0 (0.0%) |
| Transportation | 3 (100.0%) | 0 (0.0%) |
| Material Moving | 8 (100.0%) | 0 (0.0%) |
| Total (Category) | 18 (100.0%) | 0 (0.0%) |
| Total (Overall) | 43 (38.7%) | 68 (61.3%) |
Employment Industries by Sex in Napaskiak
Employment Industries in Napaskiak
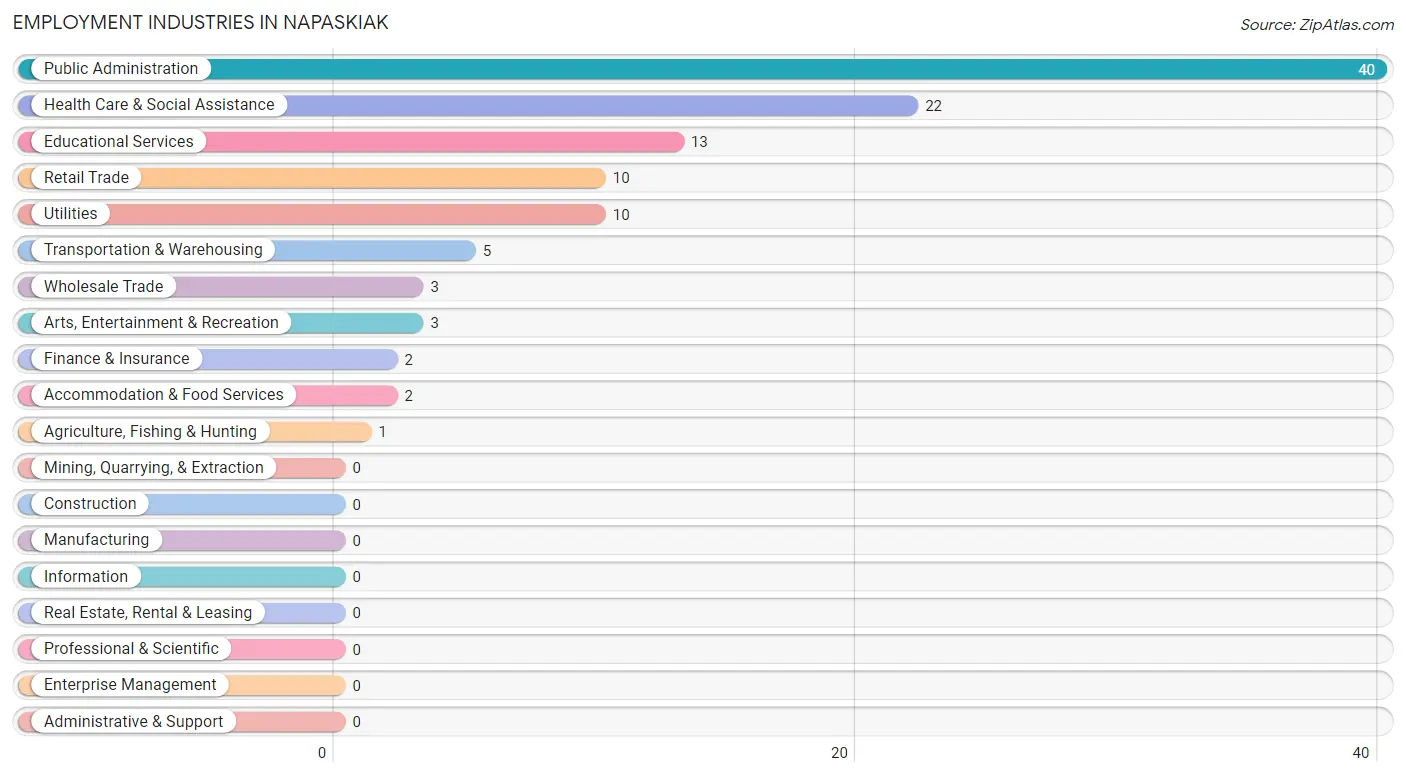
The major employment industries in Napaskiak include Public Administration (40 | 36.0%), Health Care & Social Assistance (22 | 19.8%), Educational Services (13 | 11.7%), Retail Trade (10 | 9.0%), and Utilities (10 | 9.0%).
Employment Industries by Sex in Napaskiak
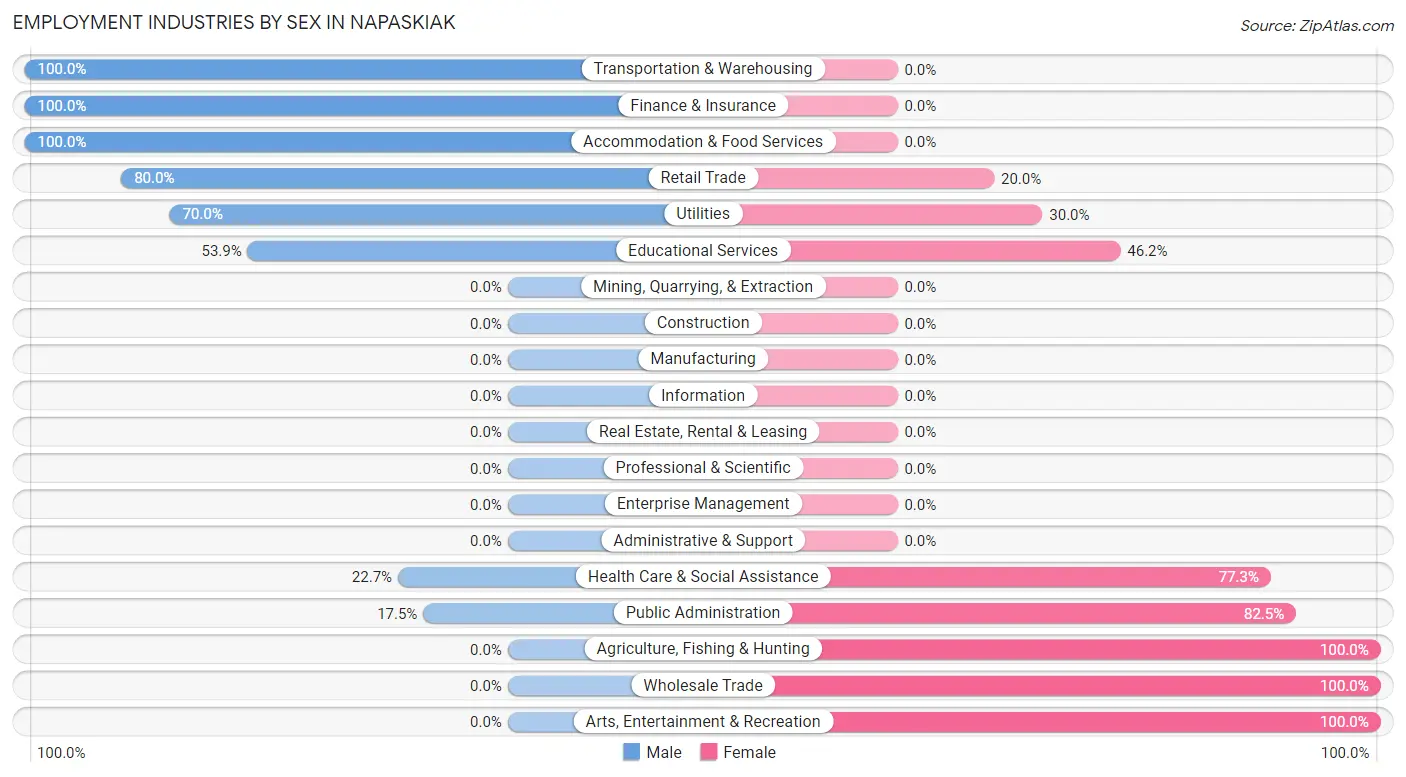
The Napaskiak industries that see more men than women are Transportation & Warehousing (100.0%), Finance & Insurance (100.0%), and Accommodation & Food Services (100.0%), whereas the industries that tend to have a higher number of women are Agriculture, Fishing & Hunting (100.0%), Wholesale Trade (100.0%), and Arts, Entertainment & Recreation (100.0%).
| Industry | Male | Female |
| Agriculture, Fishing & Hunting | 0 (0.0%) | 1 (100.0%) |
| Mining, Quarrying, & Extraction | 0 (0.0%) | 0 (0.0%) |
| Construction | 0 (0.0%) | 0 (0.0%) |
| Manufacturing | 0 (0.0%) | 0 (0.0%) |
| Wholesale Trade | 0 (0.0%) | 3 (100.0%) |
| Retail Trade | 8 (80.0%) | 2 (20.0%) |
| Transportation & Warehousing | 5 (100.0%) | 0 (0.0%) |
| Utilities | 7 (70.0%) | 3 (30.0%) |
| Information | 0 (0.0%) | 0 (0.0%) |
| Finance & Insurance | 2 (100.0%) | 0 (0.0%) |
| Real Estate, Rental & Leasing | 0 (0.0%) | 0 (0.0%) |
| Professional & Scientific | 0 (0.0%) | 0 (0.0%) |
| Enterprise Management | 0 (0.0%) | 0 (0.0%) |
| Administrative & Support | 0 (0.0%) | 0 (0.0%) |
| Educational Services | 7 (53.8%) | 6 (46.2%) |
| Health Care & Social Assistance | 5 (22.7%) | 17 (77.3%) |
| Arts, Entertainment & Recreation | 0 (0.0%) | 3 (100.0%) |
| Accommodation & Food Services | 2 (100.0%) | 0 (0.0%) |
| Public Administration | 7 (17.5%) | 33 (82.5%) |
| Total | 43 (38.7%) | 68 (61.3%) |
Education in Napaskiak
School Enrollment in Napaskiak
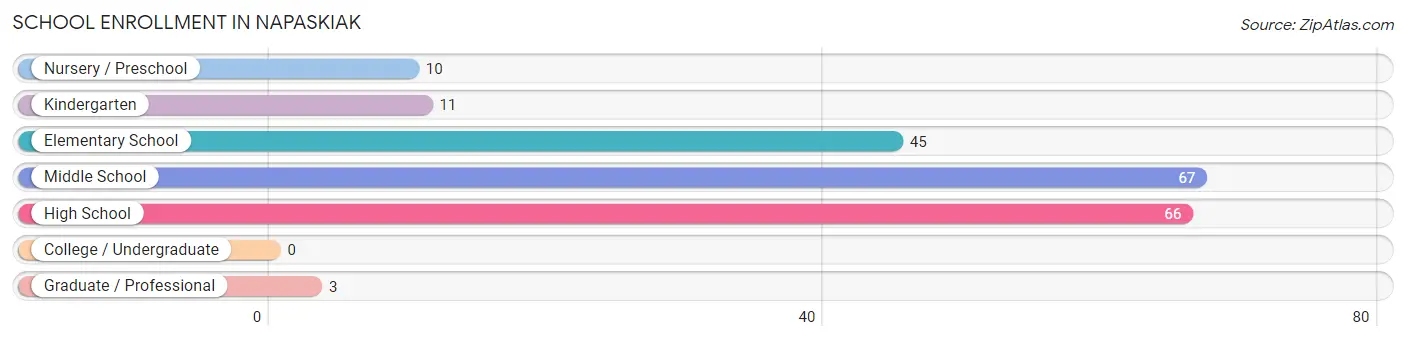
The most common levels of schooling among the 202 students in Napaskiak are middle school (67 | 33.2%), high school (66 | 32.7%), and elementary school (45 | 22.3%).
| School Level | # Students | % Students |
| Nursery / Preschool | 10 | 5.0% |
| Kindergarten | 11 | 5.4% |
| Elementary School | 45 | 22.3% |
| Middle School | 67 | 33.2% |
| High School | 66 | 32.7% |
| College / Undergraduate | 0 | 0.0% |
| Graduate / Professional | 3 | 1.5% |
| Total | 202 | 100.0% |
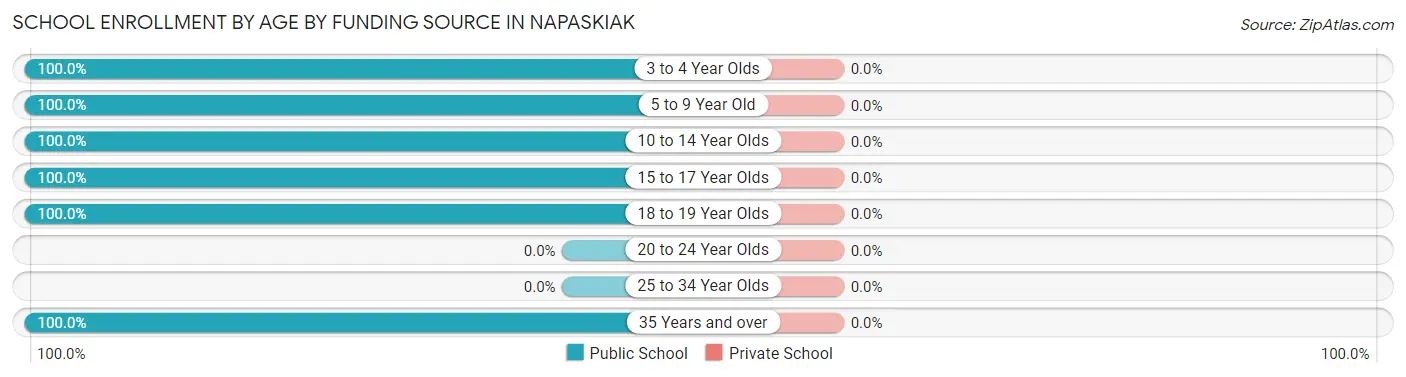
School Enrollment by Age by Funding Source in Napaskiak
| Age Bracket | Public School | Private School |
| 3 to 4 Year Olds | 10 (100.0%) | 0 (0.0%) |
| 5 to 9 Year Old | 55 (100.0%) | 0 (0.0%) |
| 10 to 14 Year Olds | 89 (100.0%) | 0 (0.0%) |
| 15 to 17 Year Olds | 36 (100.0%) | 0 (0.0%) |
| 18 to 19 Year Olds | 9 (100.0%) | 0 (0.0%) |
| 20 to 24 Year Olds | 0 (0.0%) | 0 (0.0%) |
| 25 to 34 Year Olds | 0 (0.0%) | 0 (0.0%) |
| 35 Years and over | 3 (100.0%) | 0 (0.0%) |
| Total | 202 (100.0%) | 0 (0.0%) |
Educational Attainment by Field of Study in Napaskiak
Education (5 | 50.0%), engineering (3 | 30.0%), and liberal arts & history (2 | 20.0%) are the most common fields of study among 10 individuals in Napaskiak who have obtained a bachelor's degree or higher.
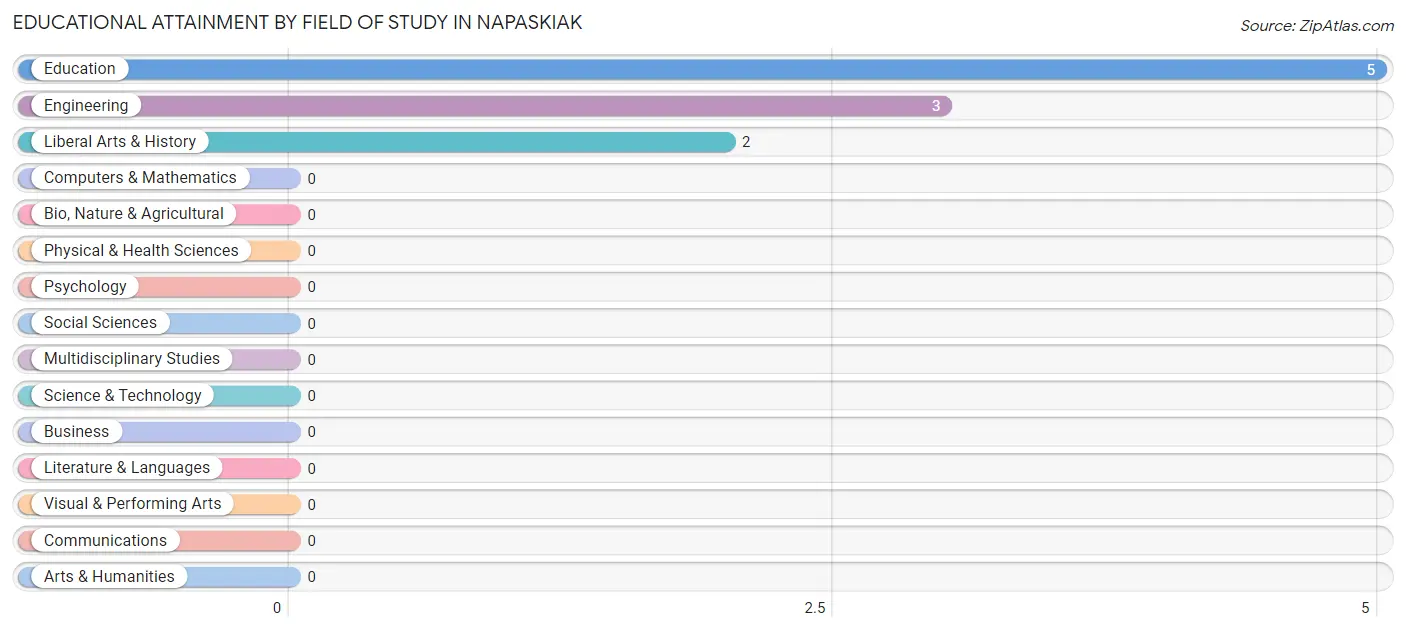
| Field of Study | # Graduates | % Graduates |
| Computers & Mathematics | 0 | 0.0% |
| Bio, Nature & Agricultural | 0 | 0.0% |
| Physical & Health Sciences | 0 | 0.0% |
| Psychology | 0 | 0.0% |
| Social Sciences | 0 | 0.0% |
| Engineering | 3 | 30.0% |
| Multidisciplinary Studies | 0 | 0.0% |
| Science & Technology | 0 | 0.0% |
| Business | 0 | 0.0% |
| Education | 5 | 50.0% |
| Literature & Languages | 0 | 0.0% |
| Liberal Arts & History | 2 | 20.0% |
| Visual & Performing Arts | 0 | 0.0% |
| Communications | 0 | 0.0% |
| Arts & Humanities | 0 | 0.0% |
| Total | 10 | 100.0% |
Transportation & Commute in Napaskiak
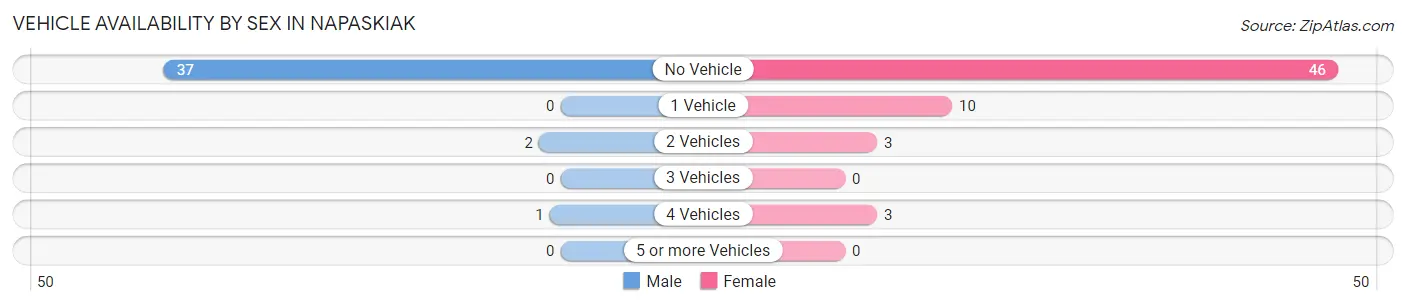
Vehicle Availability by Sex in Napaskiak
The most prevalent vehicle ownership categories in Napaskiak are males with no vehicle (37, accounting for 92.5%) and females with no vehicle (46, making up 59.7%).
| Vehicles Available | Male | Female |
| No Vehicle | 37 (92.5%) | 46 (74.2%) |
| 1 Vehicle | 0 (0.0%) | 10 (16.1%) |
| 2 Vehicles | 2 (5.0%) | 3 (4.8%) |
| 3 Vehicles | 0 (0.0%) | 0 (0.0%) |
| 4 Vehicles | 1 (2.5%) | 3 (4.8%) |
| 5 or more Vehicles | 0 (0.0%) | 0 (0.0%) |
| Total | 40 (100.0%) | 62 (100.0%) |
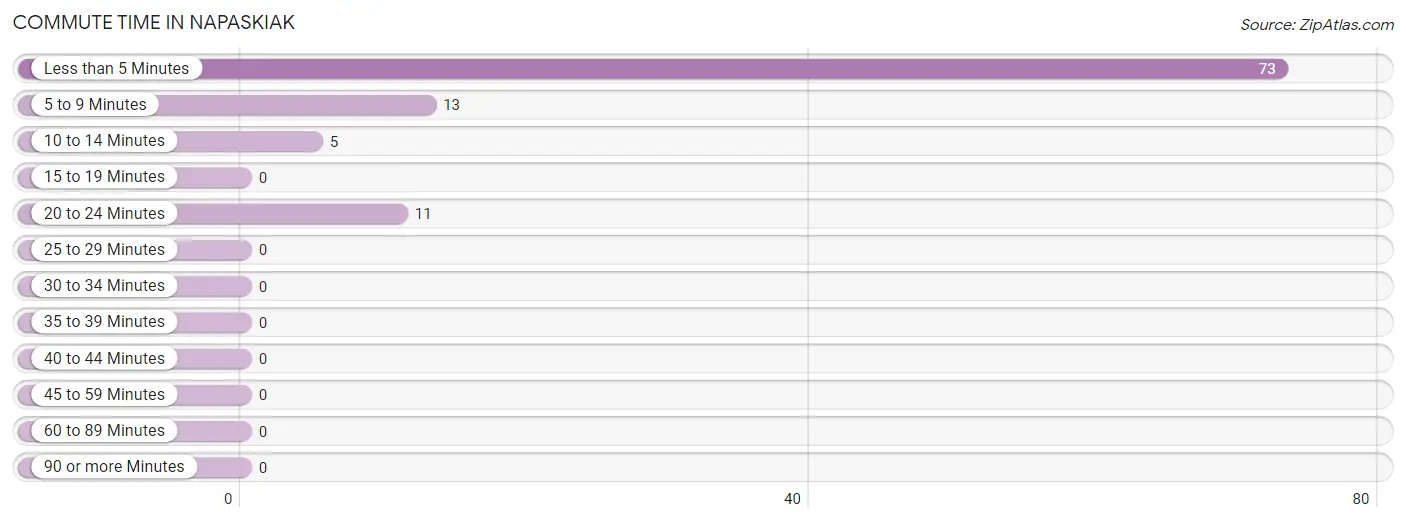
Commute Time in Napaskiak
The most frequently occuring commute durations in Napaskiak are less than 5 minutes (73 commuters, 71.6%), 5 to 9 minutes (13 commuters, 12.8%), and 20 to 24 minutes (11 commuters, 10.8%).
| Commute Time | # Commuters | % Commuters |
| Less than 5 Minutes | 73 | 71.6% |
| 5 to 9 Minutes | 13 | 12.8% |
| 10 to 14 Minutes | 5 | 4.9% |
| 15 to 19 Minutes | 0 | 0.0% |
| 20 to 24 Minutes | 11 | 10.8% |
| 25 to 29 Minutes | 0 | 0.0% |
| 30 to 34 Minutes | 0 | 0.0% |
| 35 to 39 Minutes | 0 | 0.0% |
| 40 to 44 Minutes | 0 | 0.0% |
| 45 to 59 Minutes | 0 | 0.0% |
| 60 to 89 Minutes | 0 | 0.0% |
| 90 or more Minutes | 0 | 0.0% |
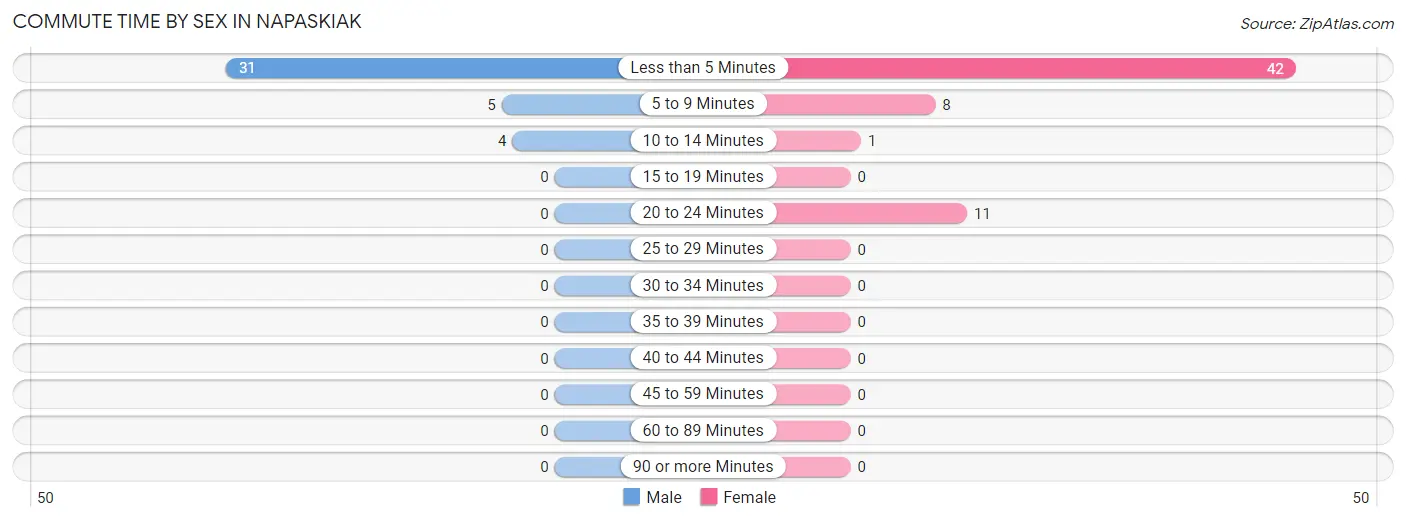
Commute Time by Sex in Napaskiak
The most common commute times in Napaskiak are less than 5 minutes (31 commuters, 77.5%) for males and less than 5 minutes (42 commuters, 67.7%) for females.
| Commute Time | Male | Female |
| Less than 5 Minutes | 31 (77.5%) | 42 (67.7%) |
| 5 to 9 Minutes | 5 (12.5%) | 8 (12.9%) |
| 10 to 14 Minutes | 4 (10.0%) | 1 (1.6%) |
| 15 to 19 Minutes | 0 (0.0%) | 0 (0.0%) |
| 20 to 24 Minutes | 0 (0.0%) | 11 (17.7%) |
| 25 to 29 Minutes | 0 (0.0%) | 0 (0.0%) |
| 30 to 34 Minutes | 0 (0.0%) | 0 (0.0%) |
| 35 to 39 Minutes | 0 (0.0%) | 0 (0.0%) |
| 40 to 44 Minutes | 0 (0.0%) | 0 (0.0%) |
| 45 to 59 Minutes | 0 (0.0%) | 0 (0.0%) |
| 60 to 89 Minutes | 0 (0.0%) | 0 (0.0%) |
| 90 or more Minutes | 0 (0.0%) | 0 (0.0%) |
Time of Departure to Work by Sex in Napaskiak
The most frequent times of departure to work in Napaskiak are 8:30 AM to 8:59 AM (16, 40.0%) for males and 8:30 AM to 8:59 AM (22, 35.5%) for females.
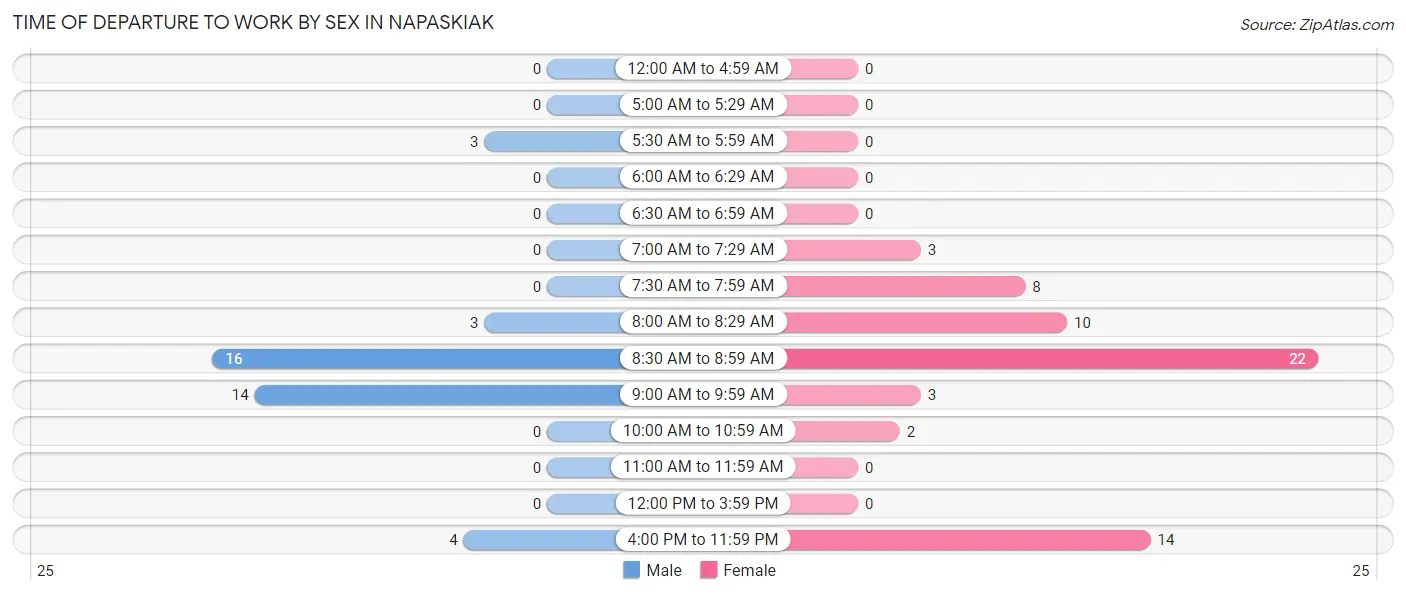
| Time of Departure | Male | Female |
| 12:00 AM to 4:59 AM | 0 (0.0%) | 0 (0.0%) |
| 5:00 AM to 5:29 AM | 0 (0.0%) | 0 (0.0%) |
| 5:30 AM to 5:59 AM | 3 (7.5%) | 0 (0.0%) |
| 6:00 AM to 6:29 AM | 0 (0.0%) | 0 (0.0%) |
| 6:30 AM to 6:59 AM | 0 (0.0%) | 0 (0.0%) |
| 7:00 AM to 7:29 AM | 0 (0.0%) | 3 (4.8%) |
| 7:30 AM to 7:59 AM | 0 (0.0%) | 8 (12.9%) |
| 8:00 AM to 8:29 AM | 3 (7.5%) | 10 (16.1%) |
| 8:30 AM to 8:59 AM | 16 (40.0%) | 22 (35.5%) |
| 9:00 AM to 9:59 AM | 14 (35.0%) | 3 (4.8%) |
| 10:00 AM to 10:59 AM | 0 (0.0%) | 2 (3.2%) |
| 11:00 AM to 11:59 AM | 0 (0.0%) | 0 (0.0%) |
| 12:00 PM to 3:59 PM | 0 (0.0%) | 0 (0.0%) |
| 4:00 PM to 11:59 PM | 4 (10.0%) | 14 (22.6%) |
| Total | 40 (100.0%) | 62 (100.0%) |
Housing Occupancy in Napaskiak
Occupancy by Ownership in Napaskiak
Of the total 122 dwellings in Napaskiak, owner-occupied units account for 91 (74.6%), while renter-occupied units make up 31 (25.4%).
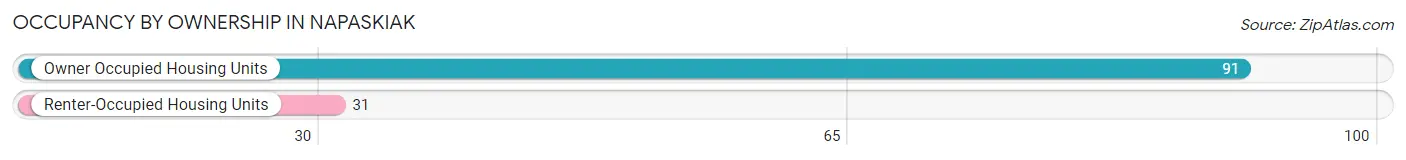
| Occupancy | # Housing Units | % Housing Units |
| Owner Occupied Housing Units | 91 | 74.6% |
| Renter-Occupied Housing Units | 31 | 25.4% |
| Total Occupied Housing Units | 122 | 100.0% |
Occupancy by Household Size in Napaskiak
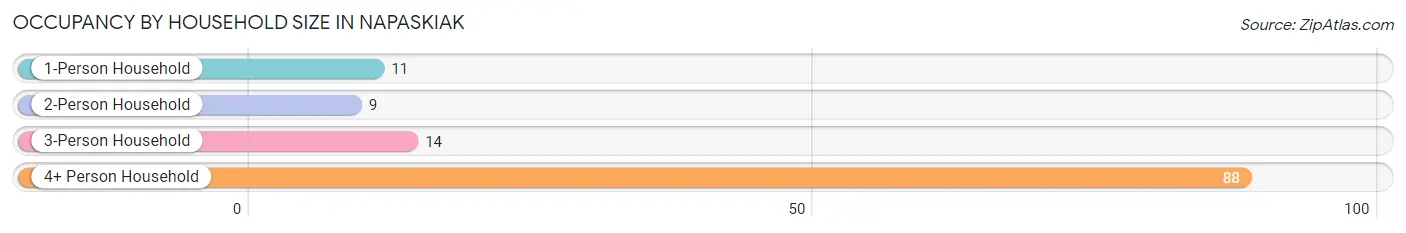
| Household Size | # Housing Units | % Housing Units |
| 1-Person Household | 11 | 9.0% |
| 2-Person Household | 9 | 7.4% |
| 3-Person Household | 14 | 11.5% |
| 4+ Person Household | 88 | 72.1% |
| Total Housing Units | 122 | 100.0% |
Occupancy by Ownership by Household Size in Napaskiak
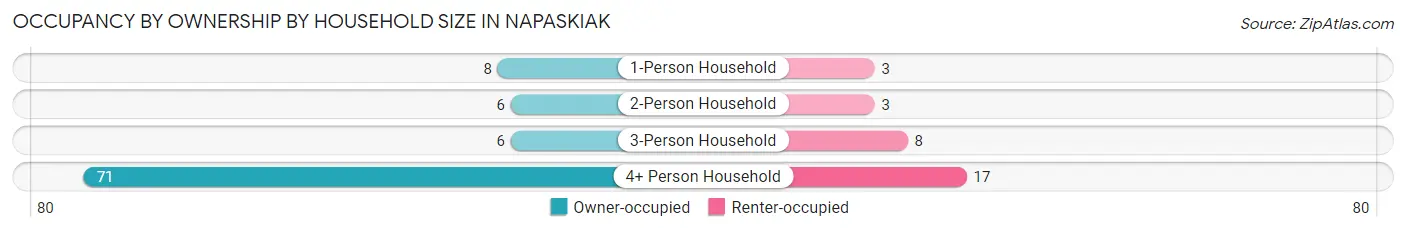
| Household Size | Owner-occupied | Renter-occupied |
| 1-Person Household | 8 (72.7%) | 3 (27.3%) |
| 2-Person Household | 6 (66.7%) | 3 (33.3%) |
| 3-Person Household | 6 (42.9%) | 8 (57.1%) |
| 4+ Person Household | 71 (80.7%) | 17 (19.3%) |
| Total Housing Units | 91 (74.6%) | 31 (25.4%) |
Occupancy by Educational Attainment in Napaskiak
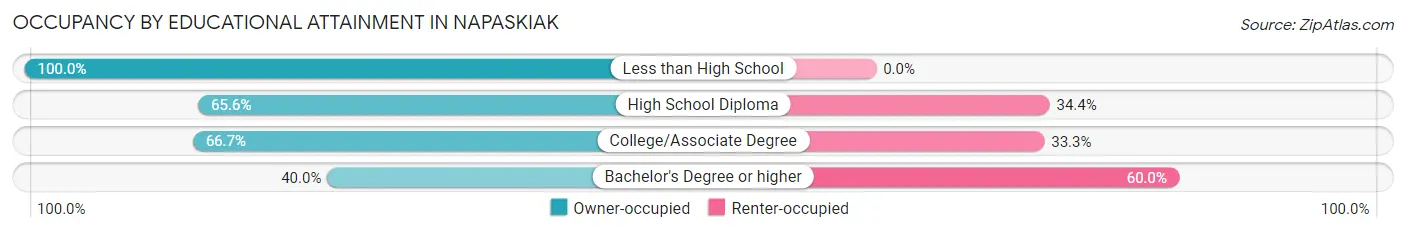
| Household Size | Owner-occupied | Renter-occupied |
| Less than High School | 35 (100.0%) | 0 (0.0%) |
| High School Diploma | 42 (65.6%) | 22 (34.4%) |
| College/Associate Degree | 12 (66.7%) | 6 (33.3%) |
| Bachelor's Degree or higher | 2 (40.0%) | 3 (60.0%) |
Occupancy by Age of Householder in Napaskiak
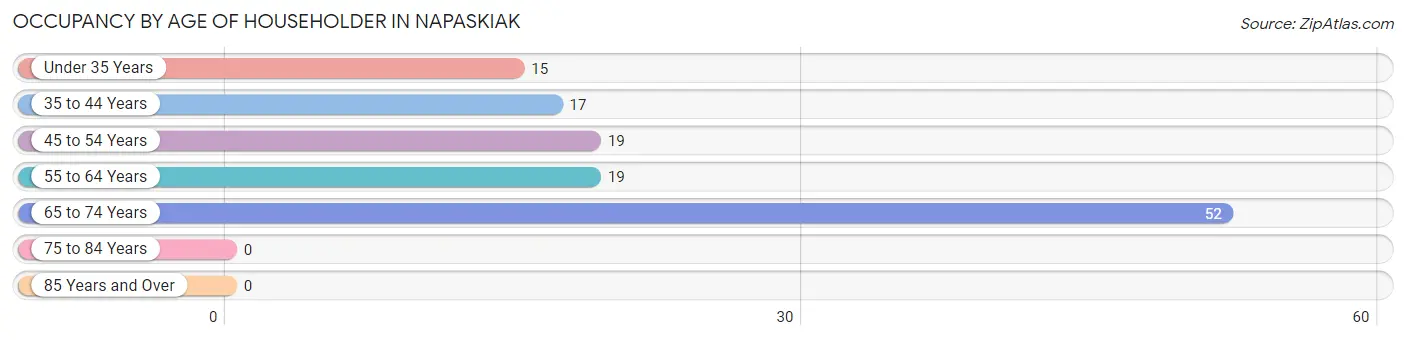
| Age Bracket | # Households | % Households |
| Under 35 Years | 15 | 12.3% |
| 35 to 44 Years | 17 | 13.9% |
| 45 to 54 Years | 19 | 15.6% |
| 55 to 64 Years | 19 | 15.6% |
| 65 to 74 Years | 52 | 42.6% |
| 75 to 84 Years | 0 | 0.0% |
| 85 Years and Over | 0 | 0.0% |
| Total | 122 | 100.0% |
Housing Finances in Napaskiak
Median Income by Occupancy in Napaskiak
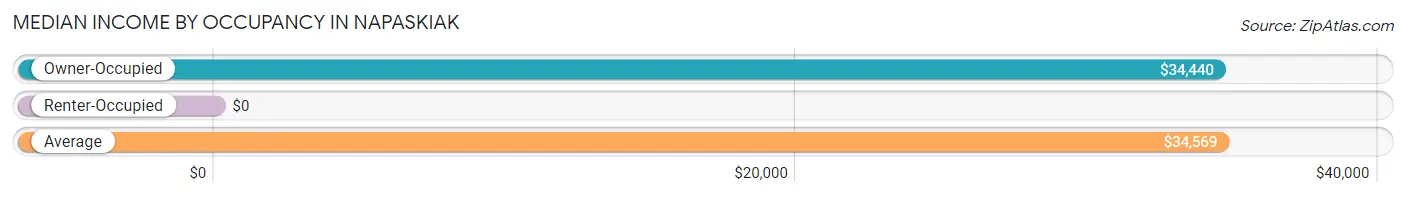
| Occupancy Type | # Households | Median Income |
| Owner-Occupied | 91 (74.6%) | $34,440 |
| Renter-Occupied | 31 (25.4%) | $0 |
| Average | 122 (100.0%) | $34,569 |
Occupancy by Householder Income Bracket in Napaskiak
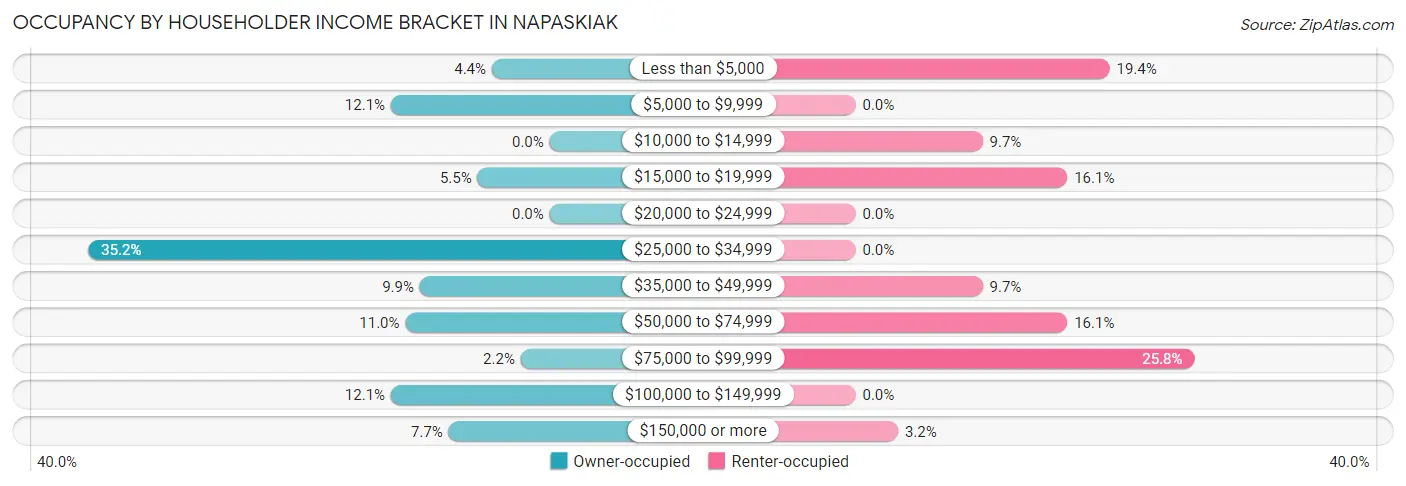
| Income Bracket | Owner-occupied | Renter-occupied |
| Less than $5,000 | 4 (4.4%) | 6 (19.4%) |
| $5,000 to $9,999 | 11 (12.1%) | 0 (0.0%) |
| $10,000 to $14,999 | 0 (0.0%) | 3 (9.7%) |
| $15,000 to $19,999 | 5 (5.5%) | 5 (16.1%) |
| $20,000 to $24,999 | 0 (0.0%) | 0 (0.0%) |
| $25,000 to $34,999 | 32 (35.2%) | 0 (0.0%) |
| $35,000 to $49,999 | 9 (9.9%) | 3 (9.7%) |
| $50,000 to $74,999 | 10 (11.0%) | 5 (16.1%) |
| $75,000 to $99,999 | 2 (2.2%) | 8 (25.8%) |
| $100,000 to $149,999 | 11 (12.1%) | 0 (0.0%) |
| $150,000 or more | 7 (7.7%) | 1 (3.2%) |
| Total | 91 (100.0%) | 31 (100.0%) |
Monthly Housing Cost Tiers in Napaskiak
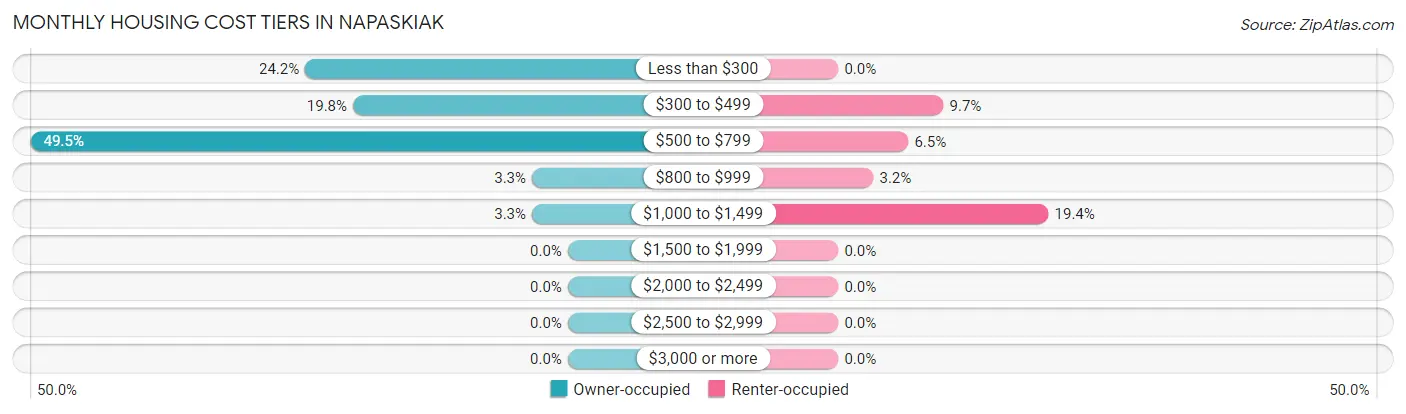
| Monthly Cost | Owner-occupied | Renter-occupied |
| Less than $300 | 22 (24.2%) | 0 (0.0%) |
| $300 to $499 | 18 (19.8%) | 3 (9.7%) |
| $500 to $799 | 45 (49.4%) | 2 (6.5%) |
| $800 to $999 | 3 (3.3%) | 1 (3.2%) |
| $1,000 to $1,499 | 3 (3.3%) | 6 (19.4%) |
| $1,500 to $1,999 | 0 (0.0%) | 0 (0.0%) |
| $2,000 to $2,499 | 0 (0.0%) | 0 (0.0%) |
| $2,500 to $2,999 | 0 (0.0%) | 0 (0.0%) |
| $3,000 or more | 0 (0.0%) | 0 (0.0%) |
| Total | 91 (100.0%) | 31 (100.0%) |
Physical Housing Characteristics in Napaskiak
Housing Structures in Napaskiak
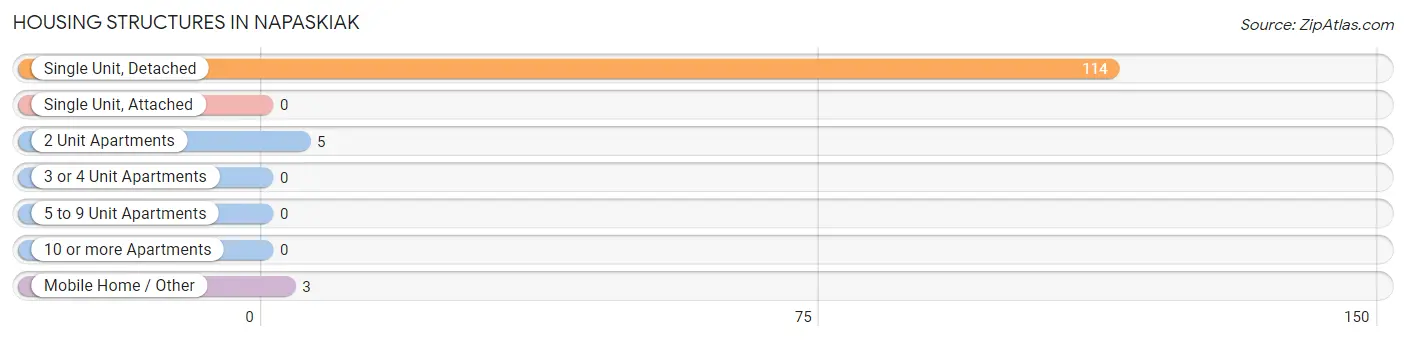
| Structure Type | # Housing Units | % Housing Units |
| Single Unit, Detached | 114 | 93.4% |
| Single Unit, Attached | 0 | 0.0% |
| 2 Unit Apartments | 5 | 4.1% |
| 3 or 4 Unit Apartments | 0 | 0.0% |
| 5 to 9 Unit Apartments | 0 | 0.0% |
| 10 or more Apartments | 0 | 0.0% |
| Mobile Home / Other | 3 | 2.5% |
| Total | 122 | 100.0% |
Housing Structures by Occupancy in Napaskiak
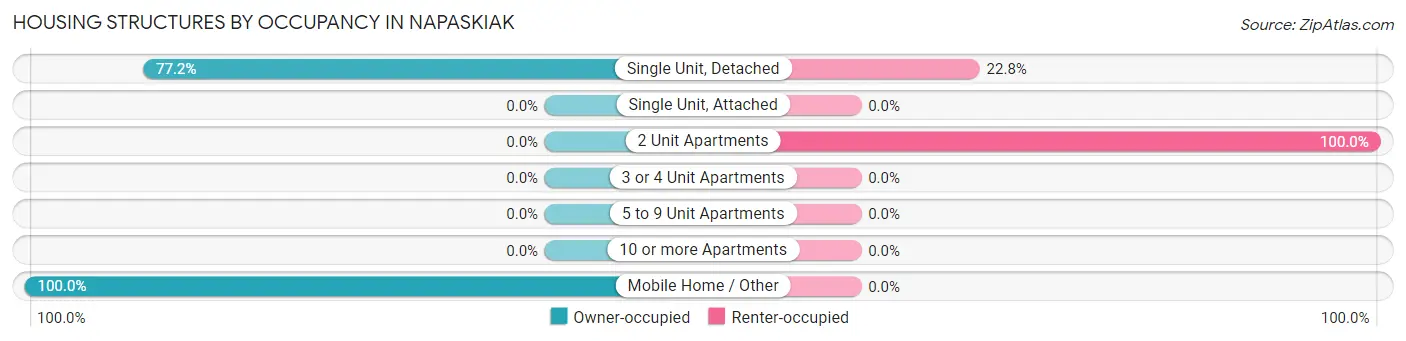
| Structure Type | Owner-occupied | Renter-occupied |
| Single Unit, Detached | 88 (77.2%) | 26 (22.8%) |
| Single Unit, Attached | 0 (0.0%) | 0 (0.0%) |
| 2 Unit Apartments | 0 (0.0%) | 5 (100.0%) |
| 3 or 4 Unit Apartments | 0 (0.0%) | 0 (0.0%) |
| 5 to 9 Unit Apartments | 0 (0.0%) | 0 (0.0%) |
| 10 or more Apartments | 0 (0.0%) | 0 (0.0%) |
| Mobile Home / Other | 3 (100.0%) | 0 (0.0%) |
| Total | 91 (74.6%) | 31 (25.4%) |
Housing Structures by Number of Rooms in Napaskiak
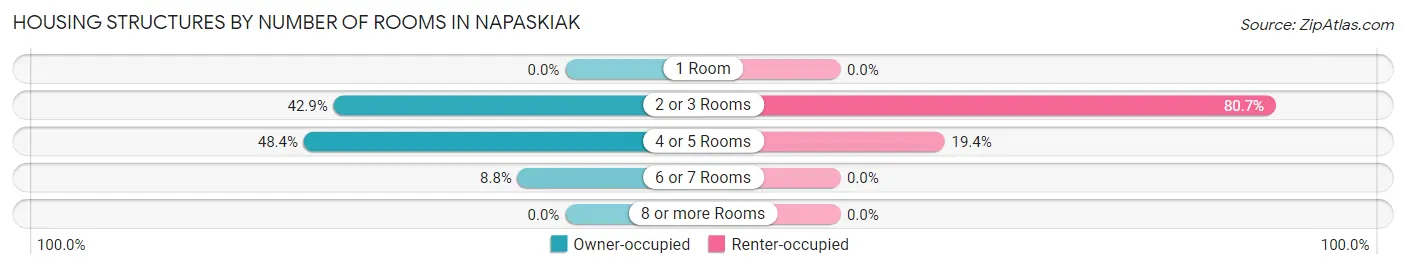
| Number of Rooms | Owner-occupied | Renter-occupied |
| 1 Room | 0 (0.0%) | 0 (0.0%) |
| 2 or 3 Rooms | 39 (42.9%) | 25 (80.6%) |
| 4 or 5 Rooms | 44 (48.3%) | 6 (19.4%) |
| 6 or 7 Rooms | 8 (8.8%) | 0 (0.0%) |
| 8 or more Rooms | 0 (0.0%) | 0 (0.0%) |
| Total | 91 (100.0%) | 31 (100.0%) |
Housing Structure by Heating Type in Napaskiak
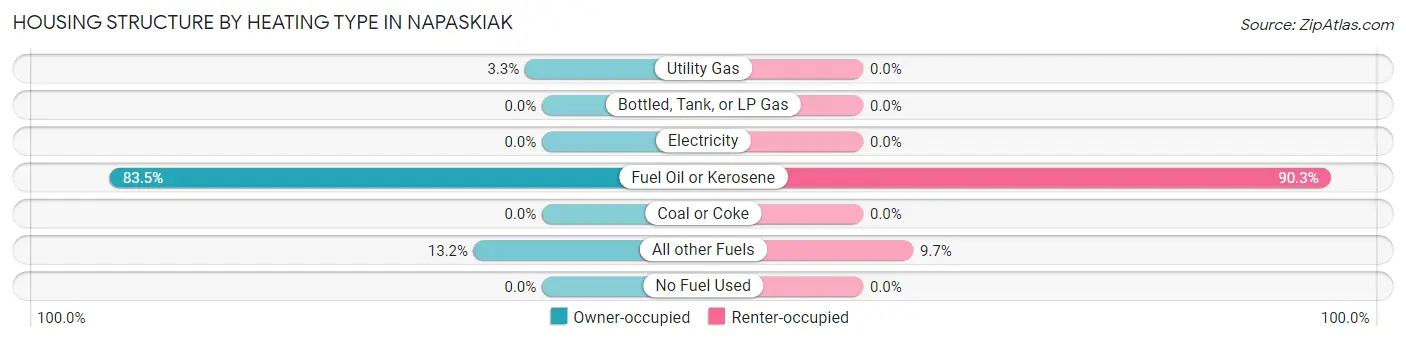
| Heating Type | Owner-occupied | Renter-occupied |
| Utility Gas | 3 (3.3%) | 0 (0.0%) |
| Bottled, Tank, or LP Gas | 0 (0.0%) | 0 (0.0%) |
| Electricity | 0 (0.0%) | 0 (0.0%) |
| Fuel Oil or Kerosene | 76 (83.5%) | 28 (90.3%) |
| Coal or Coke | 0 (0.0%) | 0 (0.0%) |
| All other Fuels | 12 (13.2%) | 3 (9.7%) |
| No Fuel Used | 0 (0.0%) | 0 (0.0%) |
| Total | 91 (100.0%) | 31 (100.0%) |
Household Vehicle Usage in Napaskiak
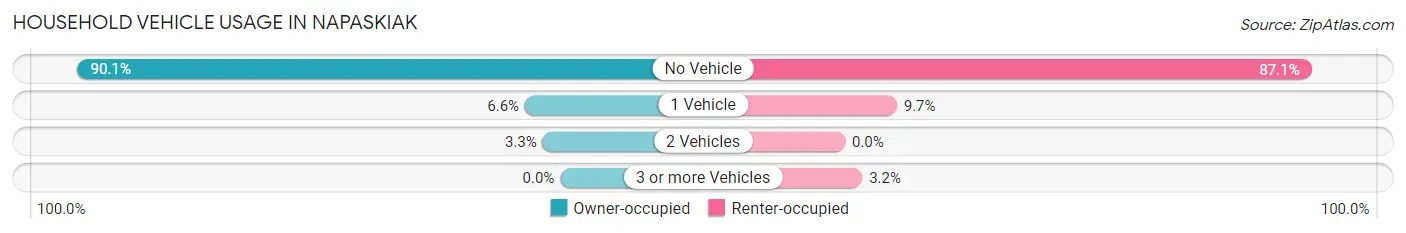
| Vehicles per Household | Owner-occupied | Renter-occupied |
| No Vehicle | 82 (90.1%) | 27 (87.1%) |
| 1 Vehicle | 6 (6.6%) | 3 (9.7%) |
| 2 Vehicles | 3 (3.3%) | 0 (0.0%) |
| 3 or more Vehicles | 0 (0.0%) | 1 (3.2%) |
| Total | 91 (100.0%) | 31 (100.0%) |
Real Estate & Mortgages in Napaskiak
Real Estate and Mortgage Overview in Napaskiak
| Characteristic | Without Mortgage | With Mortgage |
| Housing Units | 86 | 5 |
| Median Property Value | $37,100 | $0 |
| Median Household Income | $34,397 | $0 |
| Monthly Housing Costs | $508 | $0 |
| Real Estate Taxes | - | - |
Property Value by Mortgage Status in Napaskiak
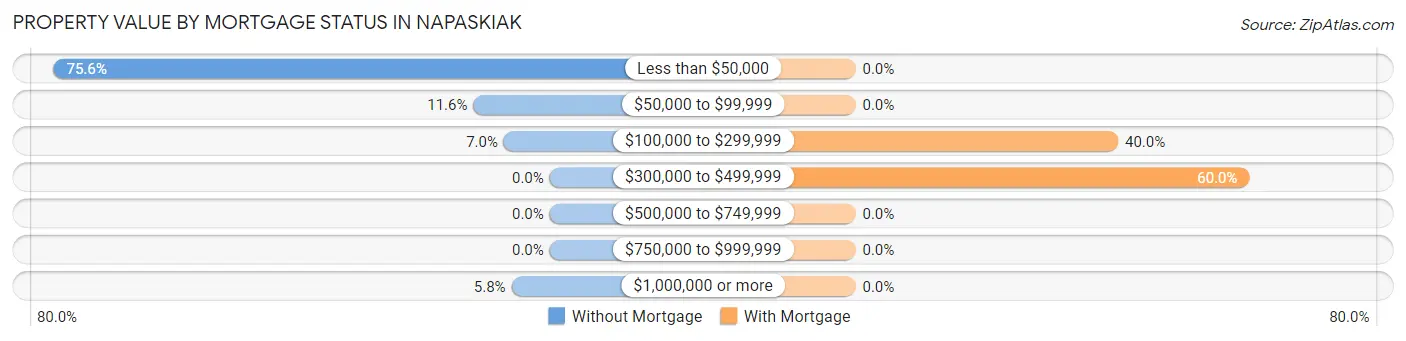
| Property Value | Without Mortgage | With Mortgage |
| Less than $50,000 | 65 (75.6%) | 0 (0.0%) |
| $50,000 to $99,999 | 10 (11.6%) | 0 (0.0%) |
| $100,000 to $299,999 | 6 (7.0%) | 2 (40.0%) |
| $300,000 to $499,999 | 0 (0.0%) | 3 (60.0%) |
| $500,000 to $749,999 | 0 (0.0%) | 0 (0.0%) |
| $750,000 to $999,999 | 0 (0.0%) | 0 (0.0%) |
| $1,000,000 or more | 5 (5.8%) | 0 (0.0%) |
| Total | 86 (100.0%) | 5 (100.0%) |
Household Income by Mortgage Status in Napaskiak
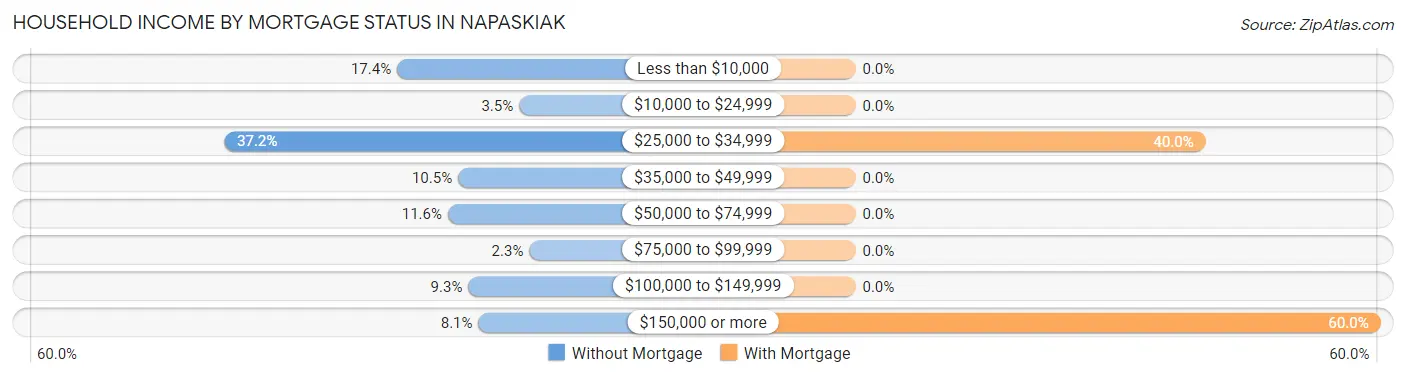
| Household Income | Without Mortgage | With Mortgage |
| Less than $10,000 | 15 (17.4%) | 0 (0.0%) |
| $10,000 to $24,999 | 3 (3.5%) | 0 (0.0%) |
| $25,000 to $34,999 | 32 (37.2%) | 2 (40.0%) |
| $35,000 to $49,999 | 9 (10.5%) | 0 (0.0%) |
| $50,000 to $74,999 | 10 (11.6%) | 0 (0.0%) |
| $75,000 to $99,999 | 2 (2.3%) | 0 (0.0%) |
| $100,000 to $149,999 | 8 (9.3%) | 0 (0.0%) |
| $150,000 or more | 7 (8.1%) | 3 (60.0%) |
| Total | 86 (100.0%) | 5 (100.0%) |
Property Value to Household Income Ratio in Napaskiak
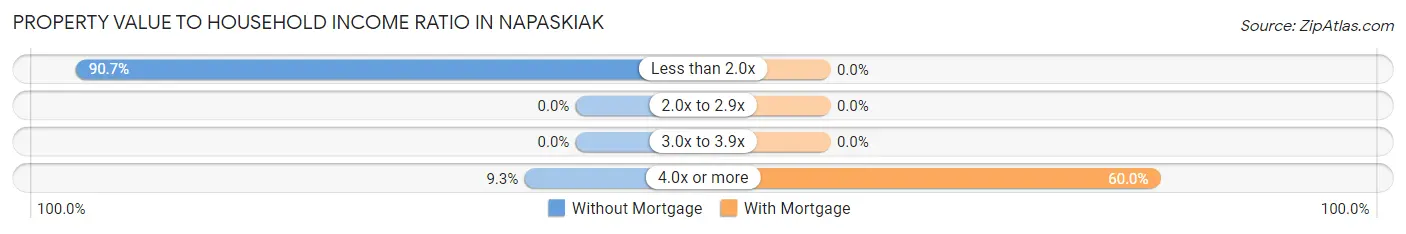
| Value-to-Income Ratio | Without Mortgage | With Mortgage |
| Less than 2.0x | 78 (90.7%) | 0 (0.0%) |
| 2.0x to 2.9x | 0 (0.0%) | 0 (0.0%) |
| 3.0x to 3.9x | 0 (0.0%) | 0 (0.0%) |
| 4.0x or more | 8 (9.3%) | 3 (60.0%) |
| Total | 86 (100.0%) | 5 (100.0%) |
Real Estate Taxes by Mortgage Status in Napaskiak
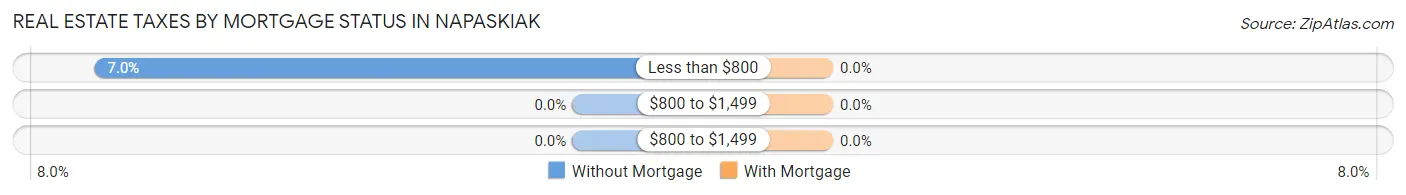
| Property Taxes | Without Mortgage | With Mortgage |
| Less than $800 | 6 (7.0%) | 0 (0.0%) |
| $800 to $1,499 | 0 (0.0%) | 0 (0.0%) |
| $800 to $1,499 | 0 (0.0%) | 0 (0.0%) |
| Total | 86 (100.0%) | 5 (100.0%) |
Health & Disability in Napaskiak
Health Insurance Coverage by Age in Napaskiak
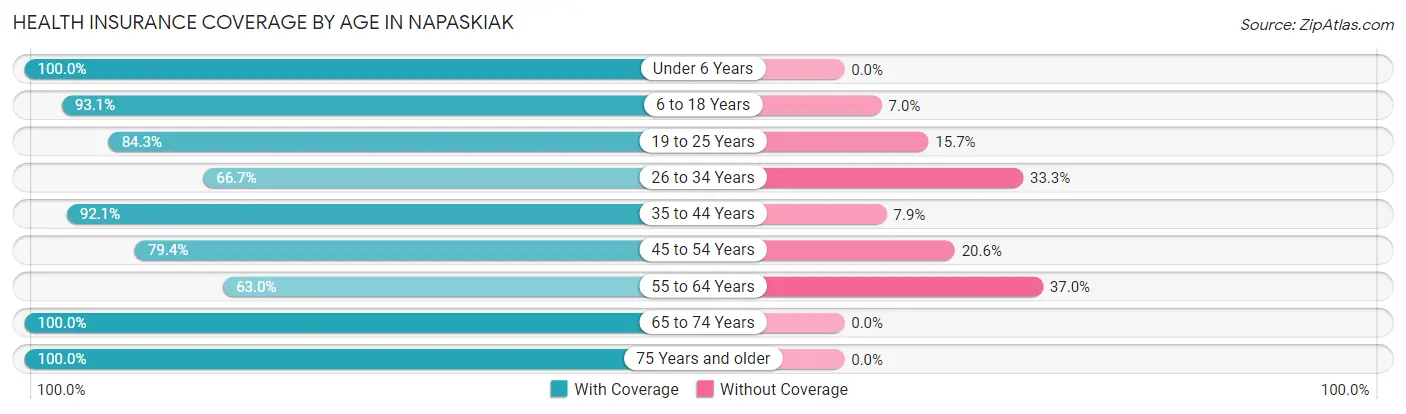
| Age Bracket | With Coverage | Without Coverage |
| Under 6 Years | 71 (100.0%) | 0 (0.0%) |
| 6 to 18 Years | 174 (93.0%) | 13 (7.0%) |
| 19 to 25 Years | 43 (84.3%) | 8 (15.7%) |
| 26 to 34 Years | 38 (66.7%) | 19 (33.3%) |
| 35 to 44 Years | 70 (92.1%) | 6 (7.9%) |
| 45 to 54 Years | 27 (79.4%) | 7 (20.6%) |
| 55 to 64 Years | 17 (63.0%) | 10 (37.0%) |
| 65 to 74 Years | 76 (100.0%) | 0 (0.0%) |
| 75 Years and older | 3 (100.0%) | 0 (0.0%) |
| Total | 519 (89.2%) | 63 (10.8%) |
Health Insurance Coverage by Citizenship Status in Napaskiak
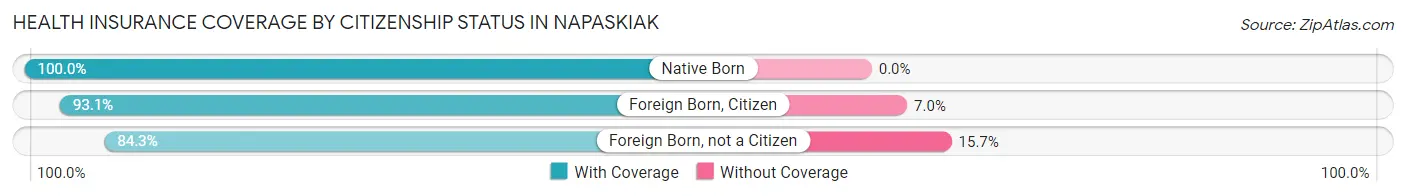
| Citizenship Status | With Coverage | Without Coverage |
| Native Born | 71 (100.0%) | 0 (0.0%) |
| Foreign Born, Citizen | 174 (93.0%) | 13 (7.0%) |
| Foreign Born, not a Citizen | 43 (84.3%) | 8 (15.7%) |
Health Insurance Coverage by Household Income in Napaskiak
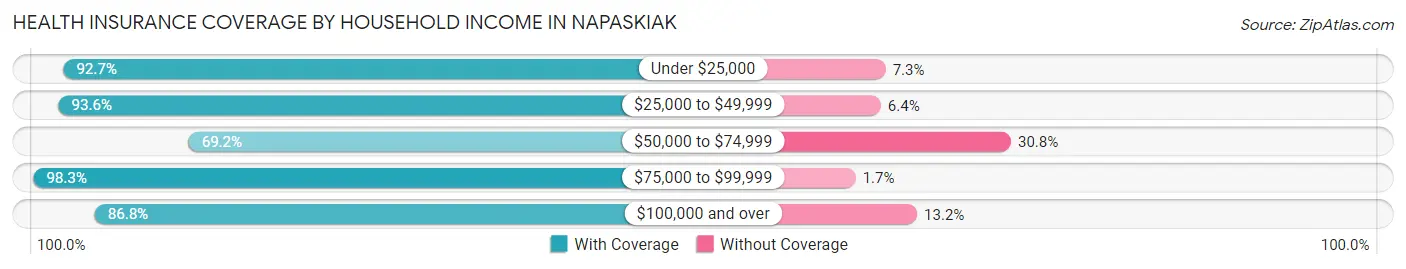
| Household Income | With Coverage | Without Coverage |
| Under $25,000 | 89 (92.7%) | 7 (7.3%) |
| $25,000 to $49,999 | 205 (93.6%) | 14 (6.4%) |
| $50,000 to $74,999 | 54 (69.2%) | 24 (30.8%) |
| $75,000 to $99,999 | 59 (98.3%) | 1 (1.7%) |
| $100,000 and over | 112 (86.8%) | 17 (13.2%) |
Public vs Private Health Insurance Coverage by Age in Napaskiak
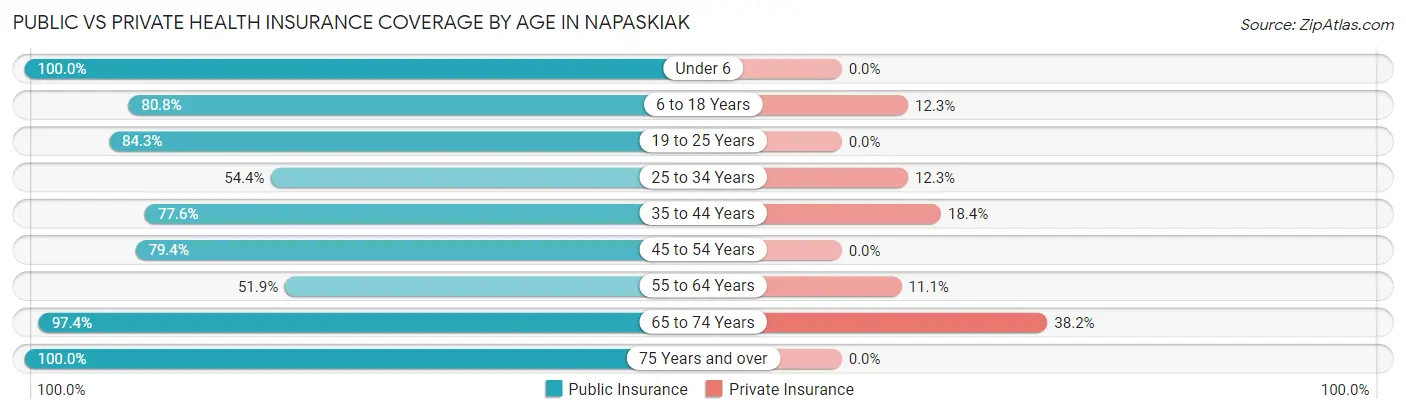
| Age Bracket | Public Insurance | Private Insurance |
| Under 6 | 71 (100.0%) | 0 (0.0%) |
| 6 to 18 Years | 151 (80.7%) | 23 (12.3%) |
| 19 to 25 Years | 43 (84.3%) | 0 (0.0%) |
| 25 to 34 Years | 31 (54.4%) | 7 (12.3%) |
| 35 to 44 Years | 59 (77.6%) | 14 (18.4%) |
| 45 to 54 Years | 27 (79.4%) | 0 (0.0%) |
| 55 to 64 Years | 14 (51.8%) | 3 (11.1%) |
| 65 to 74 Years | 74 (97.4%) | 29 (38.2%) |
| 75 Years and over | 3 (100.0%) | 0 (0.0%) |
| Total | 473 (81.3%) | 76 (13.1%) |
Disability Status by Sex by Age in Napaskiak
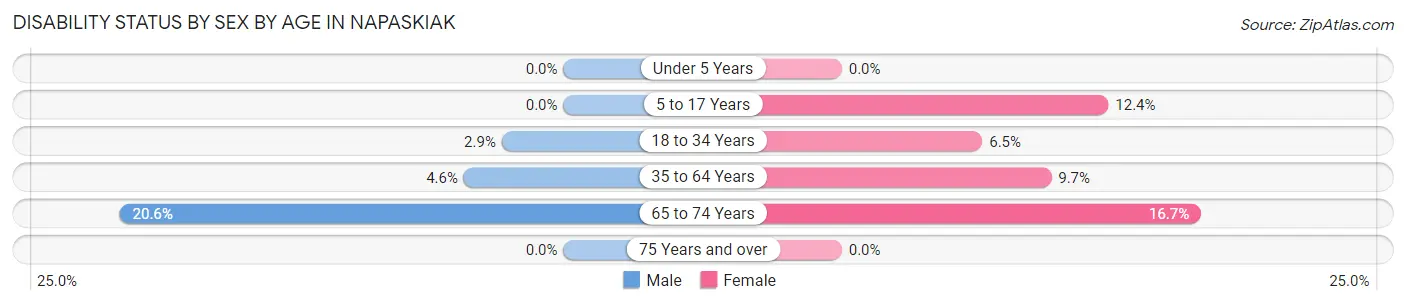
| Age Bracket | Male | Female |
| Under 5 Years | 0 (0.0%) | 0 (0.0%) |
| 5 to 17 Years | 0 (0.0%) | 12 (12.4%) |
| 18 to 34 Years | 2 (2.9%) | 3 (6.5%) |
| 35 to 64 Years | 3 (4.6%) | 7 (9.7%) |
| 65 to 74 Years | 7 (20.6%) | 7 (16.7%) |
| 75 Years and over | 0 (0.0%) | 0 (0.0%) |
Disability Class by Sex by Age in Napaskiak
Disability Class: Hearing Difficulty
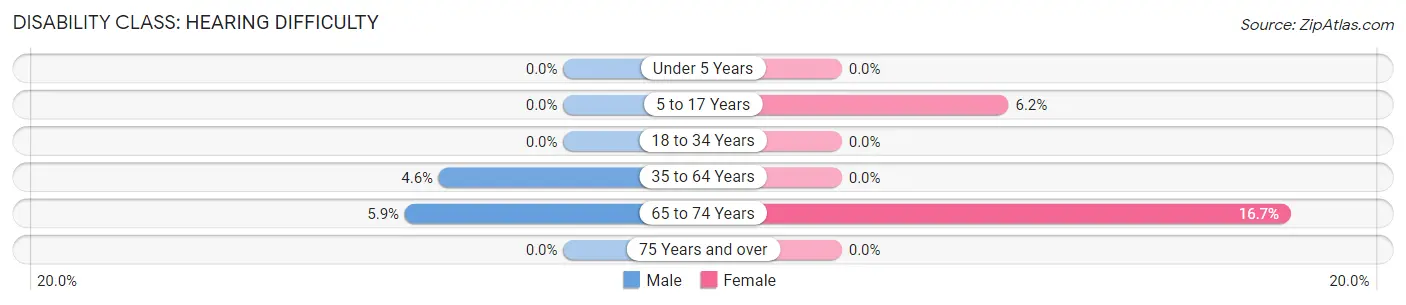
| Age Bracket | Male | Female |
| Under 5 Years | 0 (0.0%) | 0 (0.0%) |
| 5 to 17 Years | 0 (0.0%) | 6 (6.2%) |
| 18 to 34 Years | 0 (0.0%) | 0 (0.0%) |
| 35 to 64 Years | 3 (4.6%) | 0 (0.0%) |
| 65 to 74 Years | 2 (5.9%) | 7 (16.7%) |
| 75 Years and over | 0 (0.0%) | 0 (0.0%) |
Disability Class: Vision Difficulty
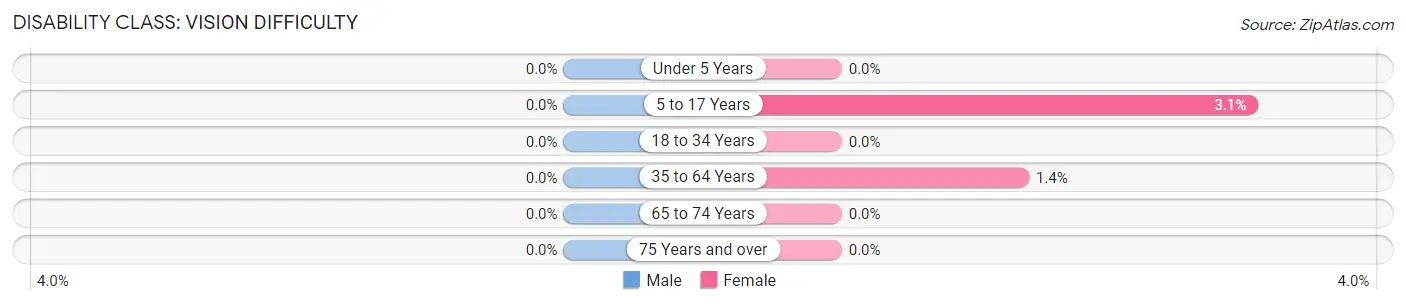
| Age Bracket | Male | Female |
| Under 5 Years | 0 (0.0%) | 0 (0.0%) |
| 5 to 17 Years | 0 (0.0%) | 3 (3.1%) |
| 18 to 34 Years | 0 (0.0%) | 0 (0.0%) |
| 35 to 64 Years | 0 (0.0%) | 1 (1.4%) |
| 65 to 74 Years | 0 (0.0%) | 0 (0.0%) |
| 75 Years and over | 0 (0.0%) | 0 (0.0%) |
Disability Class: Cognitive Difficulty
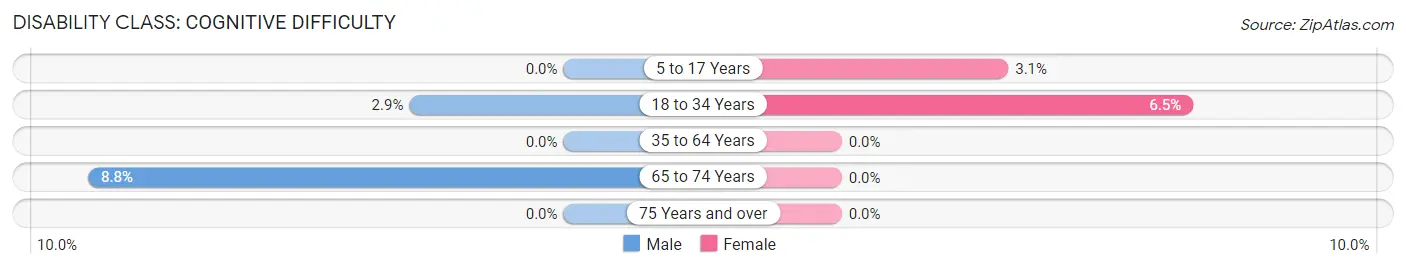
| Age Bracket | Male | Female |
| 5 to 17 Years | 0 (0.0%) | 3 (3.1%) |
| 18 to 34 Years | 2 (2.9%) | 3 (6.5%) |
| 35 to 64 Years | 0 (0.0%) | 0 (0.0%) |
| 65 to 74 Years | 3 (8.8%) | 0 (0.0%) |
| 75 Years and over | 0 (0.0%) | 0 (0.0%) |
Disability Class: Ambulatory Difficulty
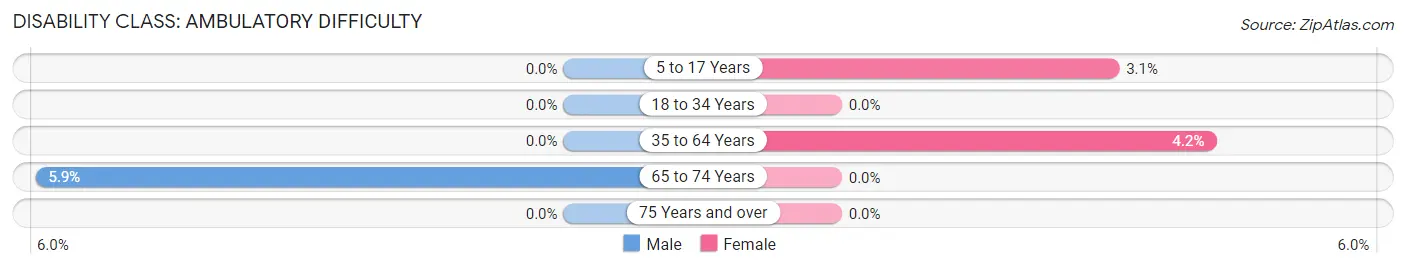
| Age Bracket | Male | Female |
| 5 to 17 Years | 0 (0.0%) | 3 (3.1%) |
| 18 to 34 Years | 0 (0.0%) | 0 (0.0%) |
| 35 to 64 Years | 0 (0.0%) | 3 (4.2%) |
| 65 to 74 Years | 2 (5.9%) | 0 (0.0%) |
| 75 Years and over | 0 (0.0%) | 0 (0.0%) |
Disability Class: Self-Care Difficulty
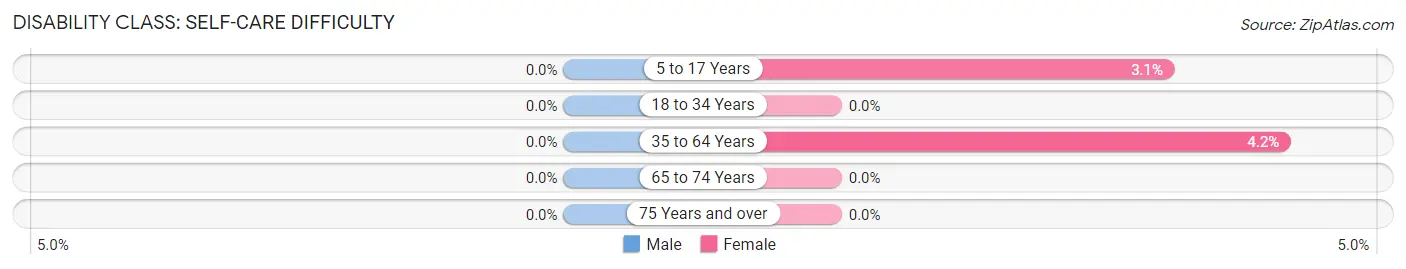
| Age Bracket | Male | Female |
| 5 to 17 Years | 0 (0.0%) | 3 (3.1%) |
| 18 to 34 Years | 0 (0.0%) | 0 (0.0%) |
| 35 to 64 Years | 0 (0.0%) | 3 (4.2%) |
| 65 to 74 Years | 0 (0.0%) | 0 (0.0%) |
| 75 Years and over | 0 (0.0%) | 0 (0.0%) |
Technology Access in Napaskiak
Computing Device Access in Napaskiak
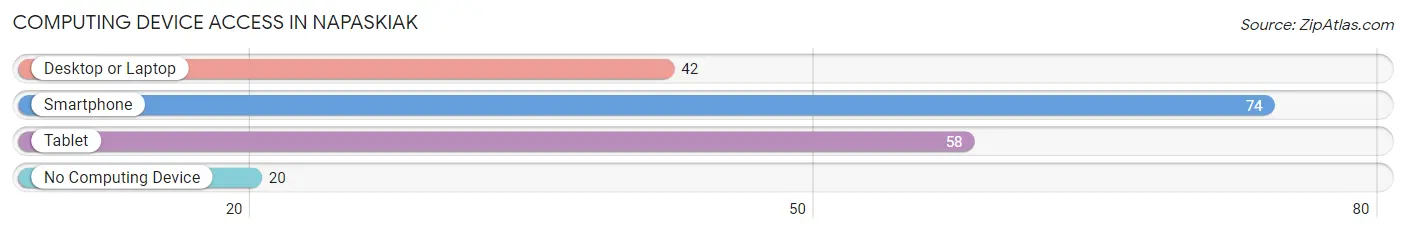
| Device Type | # Households | % Households |
| Desktop or Laptop | 42 | 34.4% |
| Smartphone | 74 | 60.7% |
| Tablet | 58 | 47.5% |
| No Computing Device | 20 | 16.4% |
| Total | 122 | 100.0% |
Internet Access in Napaskiak
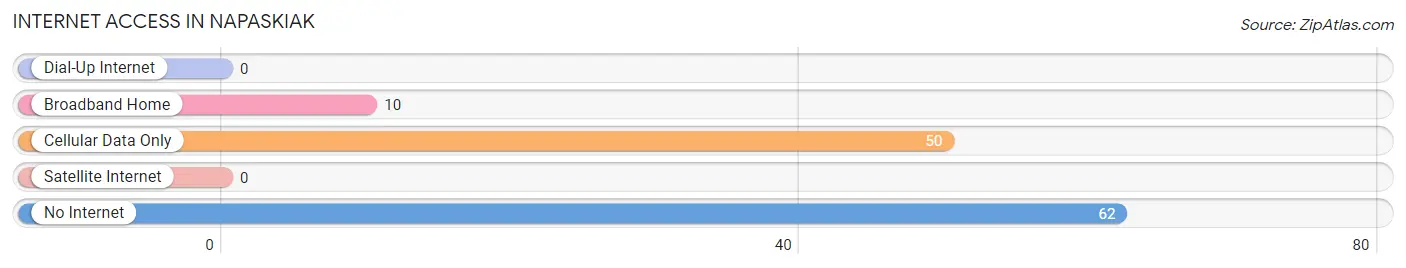
| Internet Type | # Households | % Households |
| Dial-Up Internet | 0 | 0.0% |
| Broadband Home | 10 | 8.2% |
| Cellular Data Only | 50 | 41.0% |
| Satellite Internet | 0 | 0.0% |
| No Internet | 62 | 50.8% |
| Total | 122 | 100.0% |
Napaskiak Summary
Paskiak, Alaska is a small unincorporated community located in the Bethel Census Area of the U.S. state of Alaska. It is situated on the north bank of the Kuskokwim River, approximately 25 miles (40 km) east of Bethel. The population of Paskiak was estimated to be around 200 people in 2020.
History
The area around Paskiak has been inhabited by the Yup'ik people for centuries. The first recorded European contact with the area was in 1838, when the Russian explorer Vasilii Zagoskin visited the area. The first permanent settlement in the area was established in 1884 by the Alaska Commercial Company, which built a trading post at the site. The trading post was later abandoned in the early 1900s.
In the early 1900s, the area around Paskiak was settled by Yup'ik people who had been displaced from their traditional villages by the construction of the Kuskokwim River dam. The settlement was named Paskiak, which means "place of the river" in the Yup'ik language.
Geography
Paskiak is located in the Bethel Census Area of Alaska, on the north bank of the Kuskokwim River. The community is situated approximately 25 miles (40 km) east of Bethel, and is accessible by air and river. The terrain around Paskiak is mostly flat, with some rolling hills. The climate is subarctic, with cold winters and mild summers.
Economy
The economy of Paskiak is largely based on subsistence activities, such as fishing, hunting, and gathering. The community also has a small commercial fishing industry, and some residents are employed in the local school system.
Demographics
As of the 2010 census, the population of Paskiak was estimated to be around 200 people. The majority of the population is of Yup'ik descent, and the primary language spoken is Yup'ik. The median household income in Paskiak is $25,000, and the median age is 33. The majority of the population is employed in subsistence activities, and the unemployment rate is around 10%.
Conclusion
Paskiak is a small unincorporated community located in the Bethel Census Area of Alaska. It has a population of around 200 people, and the majority of the population is of Yup'ik descent. The economy of Paskiak is largely based on subsistence activities, such as fishing, hunting, and gathering. The median household income in Paskiak is $25,000, and the median age is 33. The majority of the population is employed in subsistence activities, and the unemployment rate is around 10%.
Common Questions
What is Per Capita Income in Napaskiak?
Per Capita income in Napaskiak is $11,874.
What is the Median Family Income in Napaskiak?
Median Family Income in Napaskiak is $35,417.
What is the Median Household income in Napaskiak?
Median Household Income in Napaskiak is $34,569.
What is Income or Wage Gap in Napaskiak?
Income or Wage Gap in Napaskiak is 35.1%.
Women in Napaskiak earn 64.9 cents for every dollar earned by a man.
What is Family Income Deficit in Napaskiak?
Family Income Deficit in Napaskiak is $15,264.
Families that are below poverty line in Napaskiak earn $15,264 less on average than the poverty threshold level.
What is Inequality or Gini Index in Napaskiak?
Inequality or Gini Index in Napaskiak is 0.46.
What is the Total Population of Napaskiak?
Total Population of Napaskiak is 582.
What is the Total Male Population of Napaskiak?
Total Male Population of Napaskiak is 314.
What is the Total Female Population of Napaskiak?
Total Female Population of Napaskiak is 268.
What is the Ratio of Males per 100 Females in Napaskiak?
There are 117.16 Males per 100 Females in Napaskiak.
What is the Ratio of Females per 100 Males in Napaskiak?
There are 85.35 Females per 100 Males in Napaskiak.
What is the Median Population Age in Napaskiak?
Median Population Age in Napaskiak is 22.5 Years.
What is the Average Family Size in Napaskiak
Average Family Size in Napaskiak is 5.0 People.
What is the Average Household Size in Napaskiak
Average Household Size in Napaskiak is 4.8 People.
How Large is the Labor Force in Napaskiak?
There are 151 People in the Labor Forcein in Napaskiak.
What is the Percentage of People in the Labor Force in Napaskiak?
41.9% of People are in the Labor Force in Napaskiak.
What is the Unemployment Rate in Napaskiak?
Unemployment Rate in Napaskiak is 26.5%.