Kachemak, AK Map & Demographics
Kachemak Map
Kachemak Overview
$36,881
PER CAPITA INCOME
$78,750
AVG FAMILY INCOME
$65,000
AVG HOUSEHOLD INCOME
21.0%
WAGE / INCOME GAP [ % ]
79.0¢/ $1
WAGE / INCOME GAP [ $ ]
$6,234
FAMILY INCOME DEFICIT
0.46
INEQUALITY / GINI INDEX
787
TOTAL POPULATION
375
MALE POPULATION
412
FEMALE POPULATION
91.02
MALES / 100 FEMALES
109.87
FEMALES / 100 MALES
36.9
MEDIAN AGE
2.9
AVG FAMILY SIZE
2.6
AVG HOUSEHOLD SIZE
335
LABOR FORCE [ PEOPLE ]
55.8%
PERCENT IN LABOR FORCE
7.5%
UNEMPLOYMENT RATE
Kachemak Area Codes
Income in Kachemak
Income Overview in Kachemak
Per Capita Income in Kachemak is $36,881, while median incomes of families and households are $78,750 and $65,000 respectively.
| Characteristic | Number | Measure |
| Per Capita Income | 787 | $36,881 |
| Median Family Income | 215 | $78,750 |
| Mean Family Income | 215 | $109,837 |
| Median Household Income | 306 | $65,000 |
| Mean Household Income | 306 | $96,968 |
| Income Deficit | 215 | $6,234 |
| Wage / Income Gap (%) | 787 | 20.97% |
| Wage / Income Gap ($) | 787 | 79.03¢ per $1 |
| Gini / Inequality Index | 787 | 0.46 |
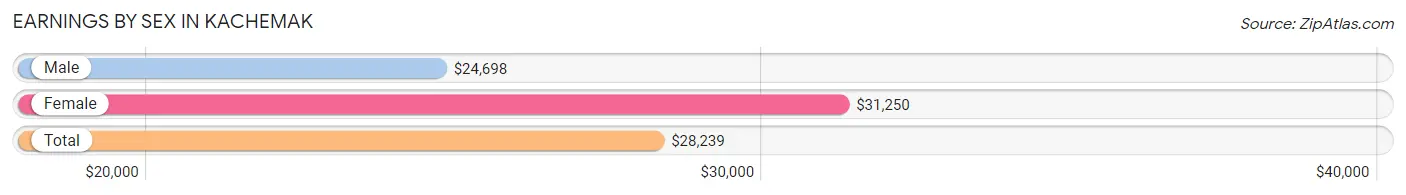
Earnings by Sex in Kachemak
Average Earnings in Kachemak are $28,239, $24,698 for men and $31,250 for women, a difference of 21.0%.
| Sex | Number | Average Earnings |
| Male | 229 (55.7%) | $24,698 |
| Female | 182 (44.3%) | $31,250 |
| Total | 411 (100.0%) | $28,239 |
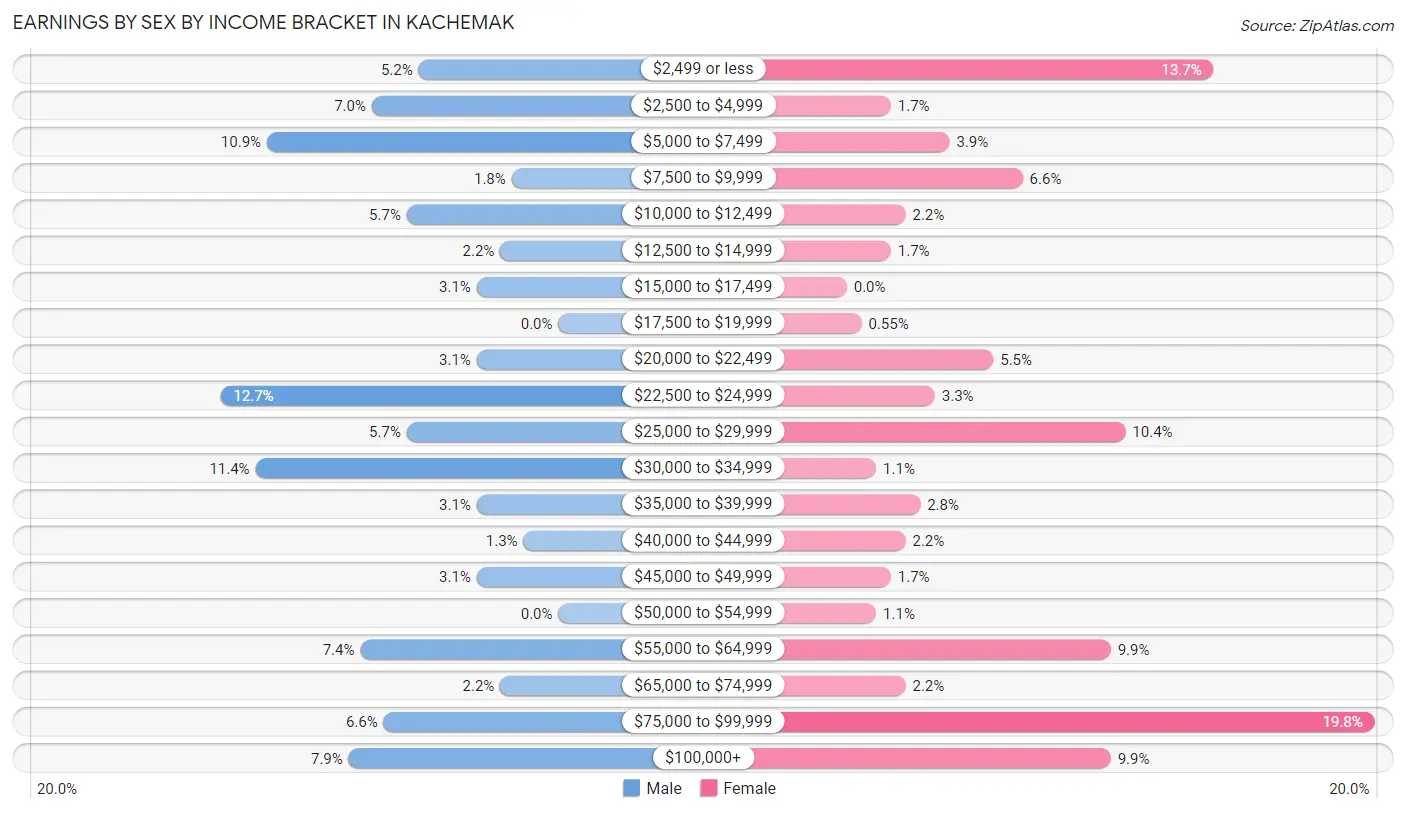
Earnings by Sex by Income Bracket in Kachemak
The most common earnings brackets in Kachemak are $22,500 to $24,999 for men (29 | 12.7%) and $75,000 to $99,999 for women (36 | 19.8%).
| Income | Male | Female |
| $2,499 or less | 12 (5.2%) | 25 (13.7%) |
| $2,500 to $4,999 | 16 (7.0%) | 3 (1.7%) |
| $5,000 to $7,499 | 25 (10.9%) | 7 (3.8%) |
| $7,500 to $9,999 | 4 (1.8%) | 12 (6.6%) |
| $10,000 to $12,499 | 13 (5.7%) | 4 (2.2%) |
| $12,500 to $14,999 | 5 (2.2%) | 3 (1.7%) |
| $15,000 to $17,499 | 7 (3.1%) | 0 (0.0%) |
| $17,500 to $19,999 | 0 (0.0%) | 1 (0.5%) |
| $20,000 to $22,499 | 7 (3.1%) | 10 (5.5%) |
| $22,500 to $24,999 | 29 (12.7%) | 6 (3.3%) |
| $25,000 to $29,999 | 13 (5.7%) | 19 (10.4%) |
| $30,000 to $34,999 | 26 (11.4%) | 2 (1.1%) |
| $35,000 to $39,999 | 7 (3.1%) | 5 (2.8%) |
| $40,000 to $44,999 | 3 (1.3%) | 4 (2.2%) |
| $45,000 to $49,999 | 7 (3.1%) | 3 (1.7%) |
| $50,000 to $54,999 | 0 (0.0%) | 2 (1.1%) |
| $55,000 to $64,999 | 17 (7.4%) | 18 (9.9%) |
| $65,000 to $74,999 | 5 (2.2%) | 4 (2.2%) |
| $75,000 to $99,999 | 15 (6.6%) | 36 (19.8%) |
| $100,000+ | 18 (7.9%) | 18 (9.9%) |
| Total | 229 (100.0%) | 182 (100.0%) |
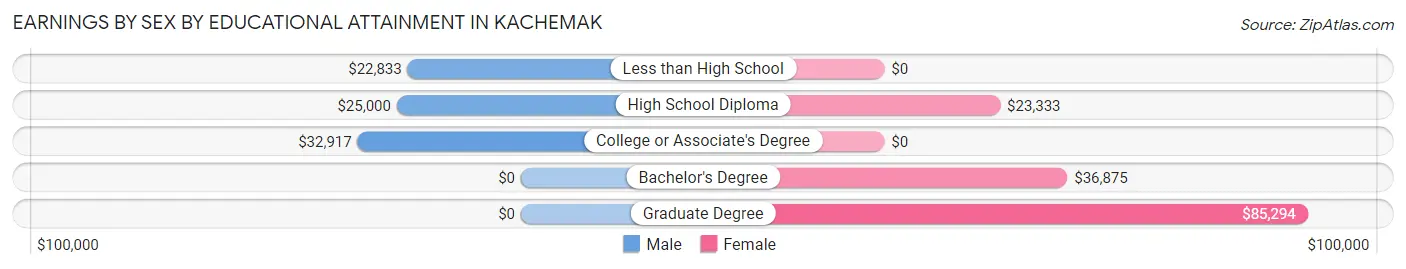
Earnings by Sex by Educational Attainment in Kachemak
Average earnings in Kachemak are $30,000 for men and $36,250 for women, a difference of 17.2%. Men with an educational attainment of college or associate's degree enjoy the highest average annual earnings of $32,917, while those with less than high school education earn the least with $22,833. Women with an educational attainment of graduate degree earn the most with the average annual earnings of $85,294, while those with high school diploma education have the smallest earnings of $23,333.
| Educational Attainment | Male Income | Female Income |
| Less than High School | $22,833 | $0 |
| High School Diploma | $25,000 | $23,333 |
| College or Associate's Degree | $32,917 | $0 |
| Bachelor's Degree | - | - |
| Graduate Degree | - | - |
| Total | $30,000 | $36,250 |
Family Income in Kachemak
Family Income Brackets in Kachemak
According to the Kachemak family income data, there are 40 families falling into the $25,000 to $34,999 income range, which is the most common income bracket and makes up 18.6% of all families.
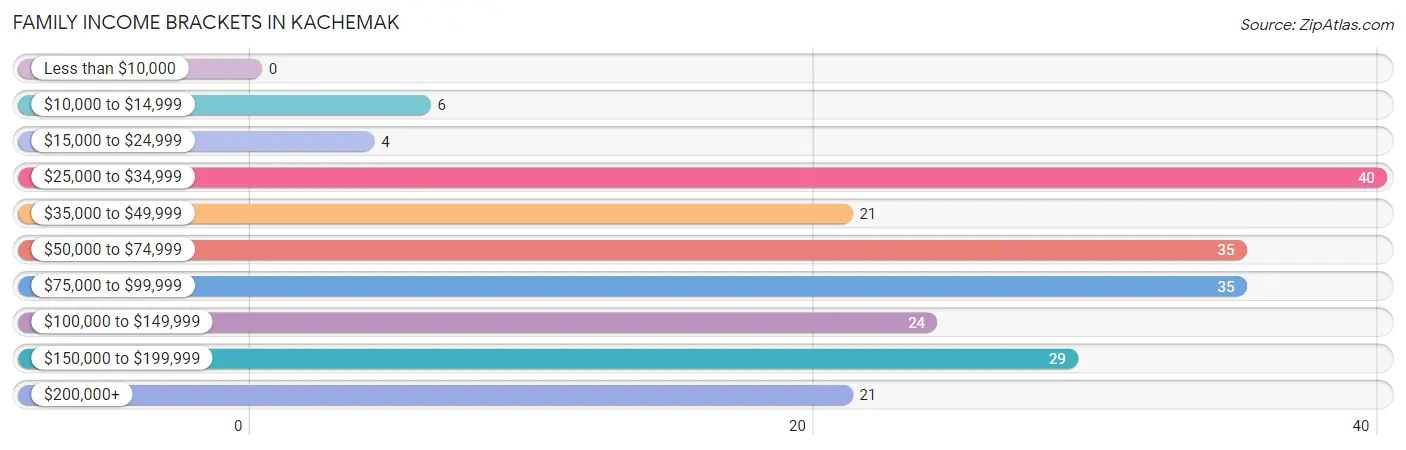
| Income Bracket | # Families | % Families |
| Less than $10,000 | 0 | 0.0% |
| $10,000 to $14,999 | 6 | 2.8% |
| $15,000 to $24,999 | 4 | 1.9% |
| $25,000 to $34,999 | 40 | 18.6% |
| $35,000 to $49,999 | 21 | 9.8% |
| $50,000 to $74,999 | 35 | 16.3% |
| $75,000 to $99,999 | 35 | 16.3% |
| $100,000 to $149,999 | 24 | 11.2% |
| $150,000 to $199,999 | 29 | 13.5% |
| $200,000+ | 21 | 9.8% |
Family Income by Famaliy Size in Kachemak
3-person families (19 | 8.8%) account for the highest median family income in Kachemak with $115,750 per family, while 2-person families (143 | 66.5%) have the highest median income of $46,458 per family member.
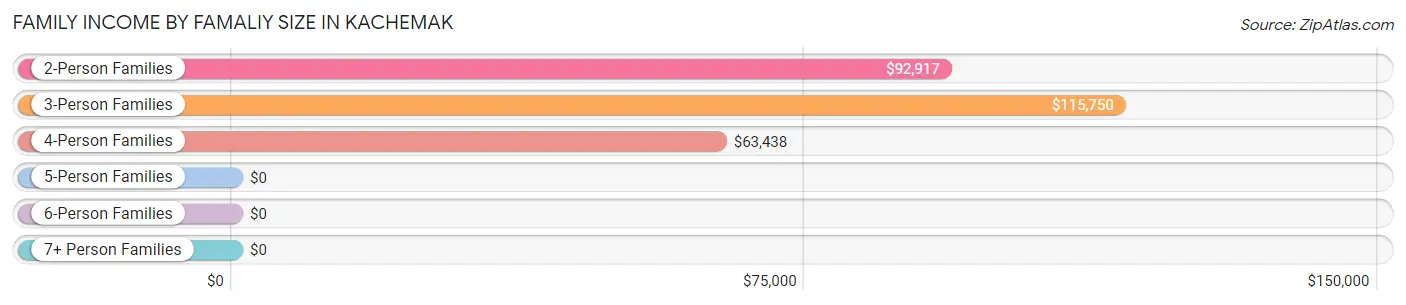
| Income Bracket | # Families | Median Income |
| 2-Person Families | 143 (66.5%) | $92,917 |
| 3-Person Families | 19 (8.8%) | $115,750 |
| 4-Person Families | 21 (9.8%) | $63,438 |
| 5-Person Families | 29 (13.5%) | $0 |
| 6-Person Families | 0 (0.0%) | $0 |
| 7+ Person Families | 3 (1.4%) | $0 |
| Total | 215 (100.0%) | $78,750 |
Family Income by Number of Earners in Kachemak
The median family income in Kachemak is $78,750, with families comprising 3+ earners (17) having the highest median family income of $156,042, while families with 2 earners (96) have the lowest median family income of $63,125, accounting for 7.9% and 44.7% of families, respectively.
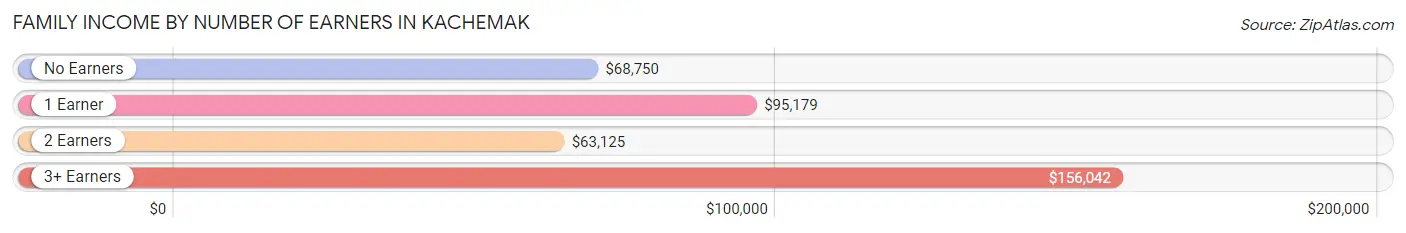
| Number of Earners | # Families | Median Income |
| No Earners | 47 (21.9%) | $68,750 |
| 1 Earner | 55 (25.6%) | $95,179 |
| 2 Earners | 96 (44.7%) | $63,125 |
| 3+ Earners | 17 (7.9%) | $156,042 |
| Total | 215 (100.0%) | $78,750 |
Household Income in Kachemak
Household Income Brackets in Kachemak
With 63 households falling in the category, the $100,000 to $149,999 income range is the most frequent in Kachemak, accounting for 20.6% of all households. In contrast, only 9 households (2.9%) fall into the less than $10,000 income bracket, making it the least populous group.
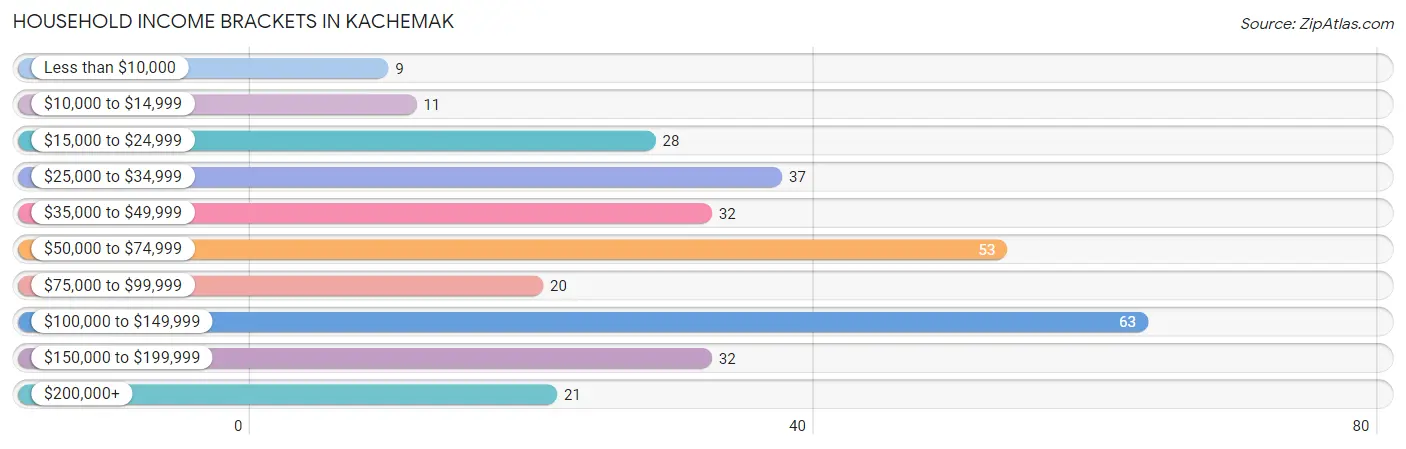
| Income Bracket | # Households | % Households |
| Less than $10,000 | 9 | 2.9% |
| $10,000 to $14,999 | 11 | 3.6% |
| $15,000 to $24,999 | 28 | 9.2% |
| $25,000 to $34,999 | 37 | 12.1% |
| $35,000 to $49,999 | 32 | 10.5% |
| $50,000 to $74,999 | 53 | 17.3% |
| $75,000 to $99,999 | 20 | 6.5% |
| $100,000 to $149,999 | 63 | 20.6% |
| $150,000 to $199,999 | 32 | 10.5% |
| $200,000+ | 21 | 6.9% |
Household Income by Householder Age in Kachemak
The median household income in Kachemak is $65,000, with the highest median household income of $90,000 found in the 25 to 44 years age bracket for the primary householder. A total of 108 households (35.3%) fall into this category.
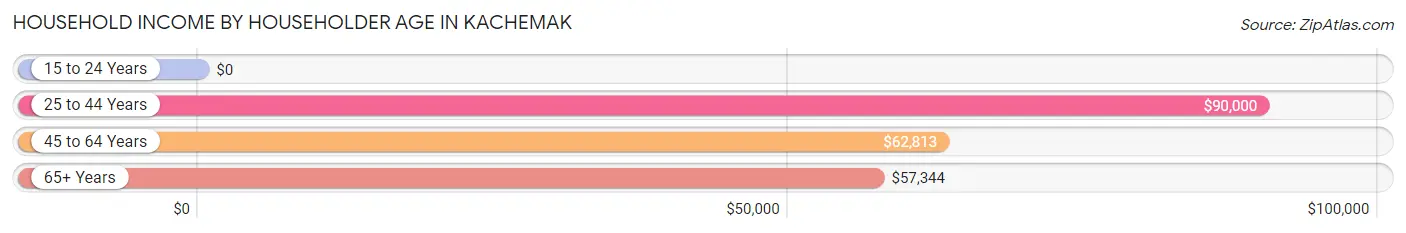
| Income Bracket | # Households | Median Income |
| 15 to 24 Years | 0 (0.0%) | $0 |
| 25 to 44 Years | 108 (35.3%) | $90,000 |
| 45 to 64 Years | 89 (29.1%) | $62,813 |
| 65+ Years | 109 (35.6%) | $57,344 |
| Total | 306 (100.0%) | $65,000 |
Poverty in Kachemak
Income Below Poverty by Sex and Age in Kachemak
With 23.7% poverty level for males and 25.0% for females among the residents of Kachemak, 6 to 11 year old males and 6 to 11 year old females are the most vulnerable to poverty, with 32 males (88.9%) and 25 females (80.6%) in their respective age groups living below the poverty level.
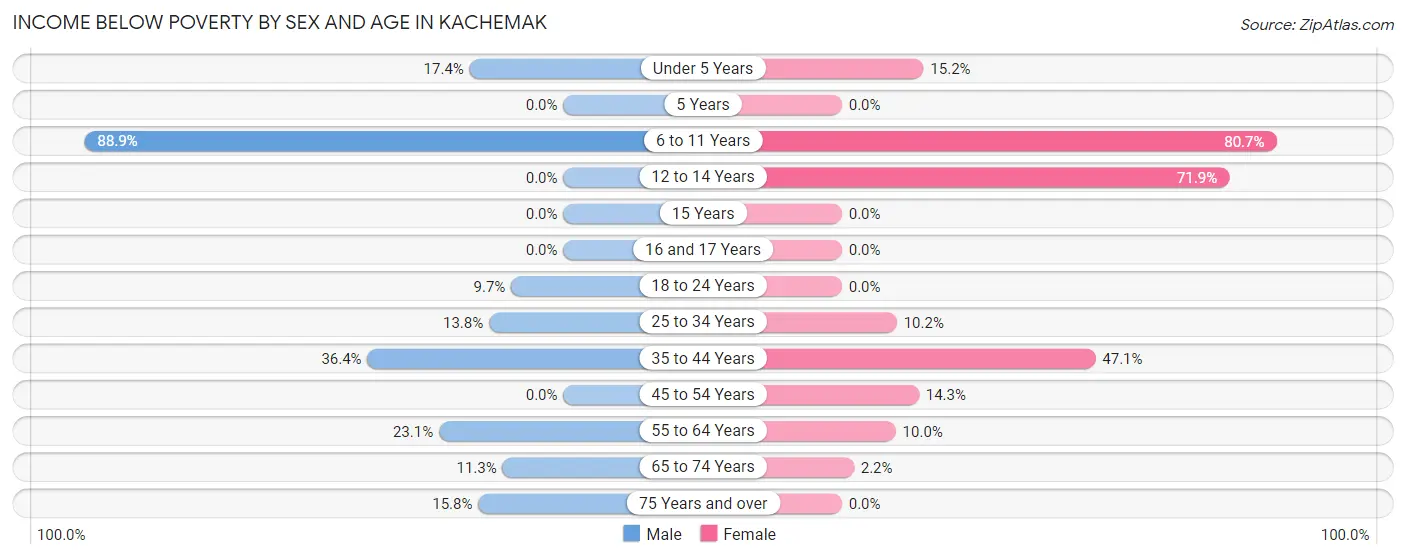
| Age Bracket | Male | Female |
| Under 5 Years | 4 (17.4%) | 5 (15.1%) |
| 5 Years | 0 (0.0%) | 0 (0.0%) |
| 6 to 11 Years | 32 (88.9%) | 25 (80.6%) |
| 12 to 14 Years | 0 (0.0%) | 23 (71.9%) |
| 15 Years | 0 (0.0%) | 0 (0.0%) |
| 16 and 17 Years | 0 (0.0%) | 0 (0.0%) |
| 18 to 24 Years | 3 (9.7%) | 0 (0.0%) |
| 25 to 34 Years | 8 (13.8%) | 5 (10.2%) |
| 35 to 44 Years | 20 (36.4%) | 32 (47.1%) |
| 45 to 54 Years | 0 (0.0%) | 5 (14.3%) |
| 55 to 64 Years | 12 (23.1%) | 5 (10.0%) |
| 65 to 74 Years | 7 (11.3%) | 1 (2.2%) |
| 75 Years and over | 3 (15.8%) | 0 (0.0%) |
| Total | 89 (23.7%) | 101 (25.0%) |
Income Above Poverty by Sex and Age in Kachemak
According to the poverty statistics in Kachemak, males aged 5 years and females aged 5 years are the age groups that are most secure financially, with 100.0% of males and 100.0% of females in these age groups living above the poverty line.
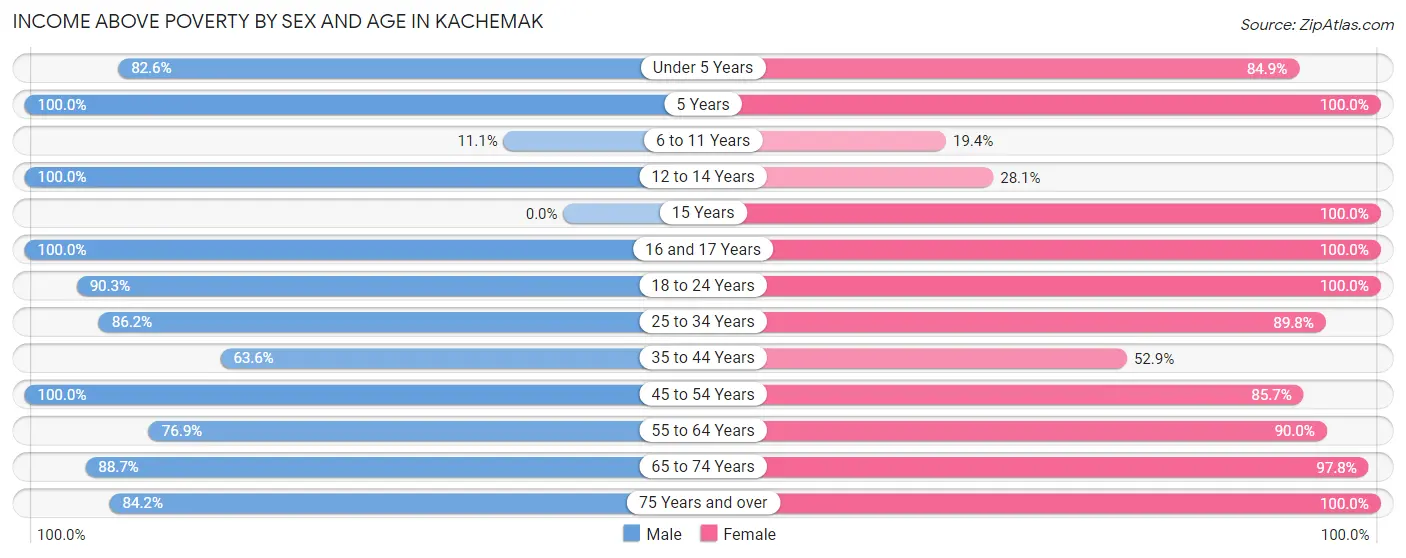
| Age Bracket | Male | Female |
| Under 5 Years | 19 (82.6%) | 28 (84.9%) |
| 5 Years | 4 (100.0%) | 13 (100.0%) |
| 6 to 11 Years | 4 (11.1%) | 6 (19.4%) |
| 12 to 14 Years | 3 (100.0%) | 9 (28.1%) |
| 15 Years | 0 (0.0%) | 4 (100.0%) |
| 16 and 17 Years | 14 (100.0%) | 3 (100.0%) |
| 18 to 24 Years | 28 (90.3%) | 4 (100.0%) |
| 25 to 34 Years | 50 (86.2%) | 44 (89.8%) |
| 35 to 44 Years | 35 (63.6%) | 36 (52.9%) |
| 45 to 54 Years | 18 (100.0%) | 30 (85.7%) |
| 55 to 64 Years | 40 (76.9%) | 45 (90.0%) |
| 65 to 74 Years | 55 (88.7%) | 44 (97.8%) |
| 75 Years and over | 16 (84.2%) | 37 (100.0%) |
| Total | 286 (76.3%) | 303 (75.0%) |
Income Below Poverty Among Married-Couple Families in Kachemak
The poverty statistics for married-couple families in Kachemak show that 16.9% or 29 of the total 172 families live below the poverty line. Families with 3 or 4 children have the highest poverty rate of 100.0%, comprising of 20 families. On the other hand, families with 1 or 2 children have the lowest poverty rate of 0.0%, which includes 0 families.
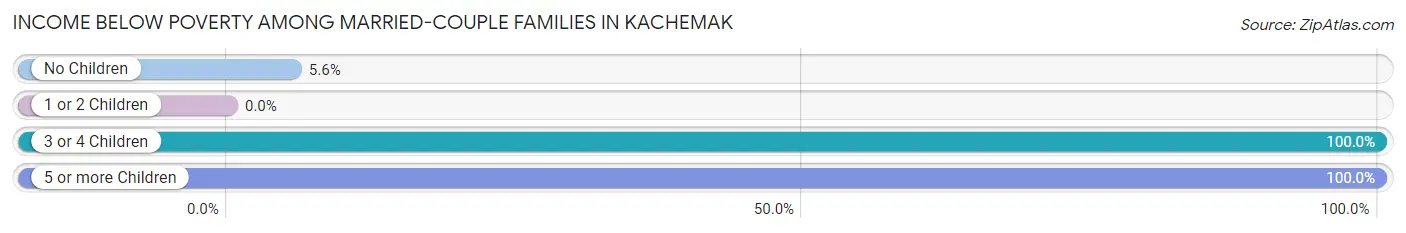
| Children | Above Poverty | Below Poverty |
| No Children | 102 (94.4%) | 6 (5.6%) |
| 1 or 2 Children | 41 (100.0%) | 0 (0.0%) |
| 3 or 4 Children | 0 (0.0%) | 20 (100.0%) |
| 5 or more Children | 0 (0.0%) | 3 (100.0%) |
| Total | 143 (83.1%) | 29 (16.9%) |
Income Below Poverty Among Single-Parent Households in Kachemak
| Children | Single Father | Single Mother |
| No Children | 0 (0.0%) | 0 (0.0%) |
| 1 or 2 Children | 0 (0.0%) | 0 (0.0%) |
| 3 or 4 Children | 0 (0.0%) | 0 (0.0%) |
| 5 or more Children | 0 (0.0%) | 0 (0.0%) |
| Total | 0 (0.0%) | 0 (0.0%) |
Income Below Poverty Among Married-Couple vs Single-Parent Households in Kachemak
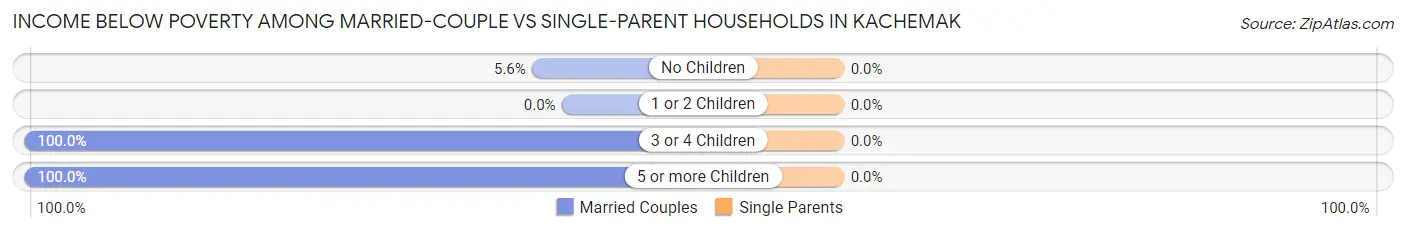
| Children | Married-Couple Families | Single-Parent Households |
| No Children | 6 (5.6%) | 0 (0.0%) |
| 1 or 2 Children | 0 (0.0%) | 0 (0.0%) |
| 3 or 4 Children | 20 (100.0%) | 0 (0.0%) |
| 5 or more Children | 3 (100.0%) | 0 (0.0%) |
| Total | 29 (16.9%) | 0 (0.0%) |
Race in Kachemak
The most populous races in Kachemak are White / Caucasian (667 | 84.8%), Two or more Races (82 | 10.4%), and Asian (22 | 2.8%).
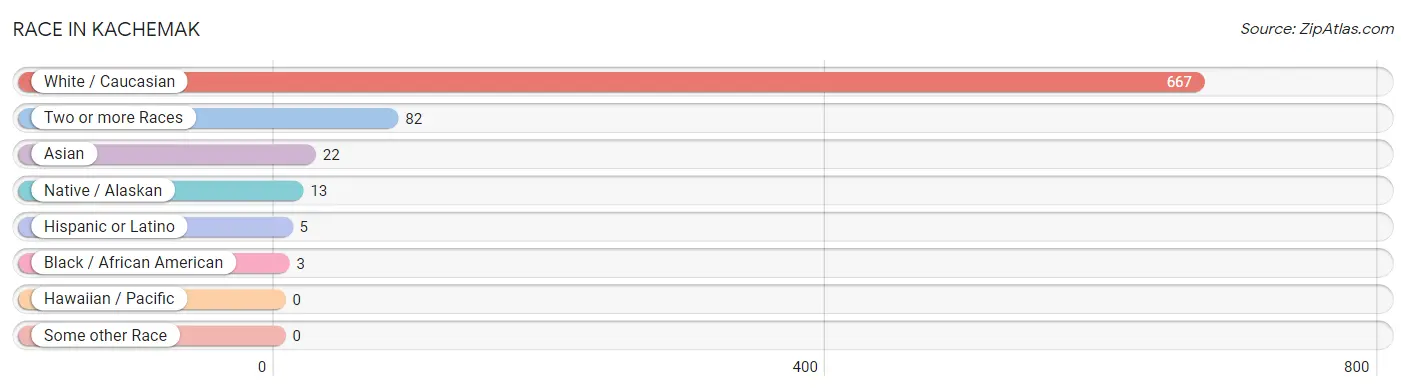
| Race | # Population | % Population |
| Asian | 22 | 2.8% |
| Black / African American | 3 | 0.4% |
| Hawaiian / Pacific | 0 | 0.0% |
| Hispanic or Latino | 5 | 0.6% |
| Native / Alaskan | 13 | 1.7% |
| White / Caucasian | 667 | 84.8% |
| Two or more Races | 82 | 10.4% |
| Some other Race | 0 | 0.0% |
| Total | 787 | 100.0% |
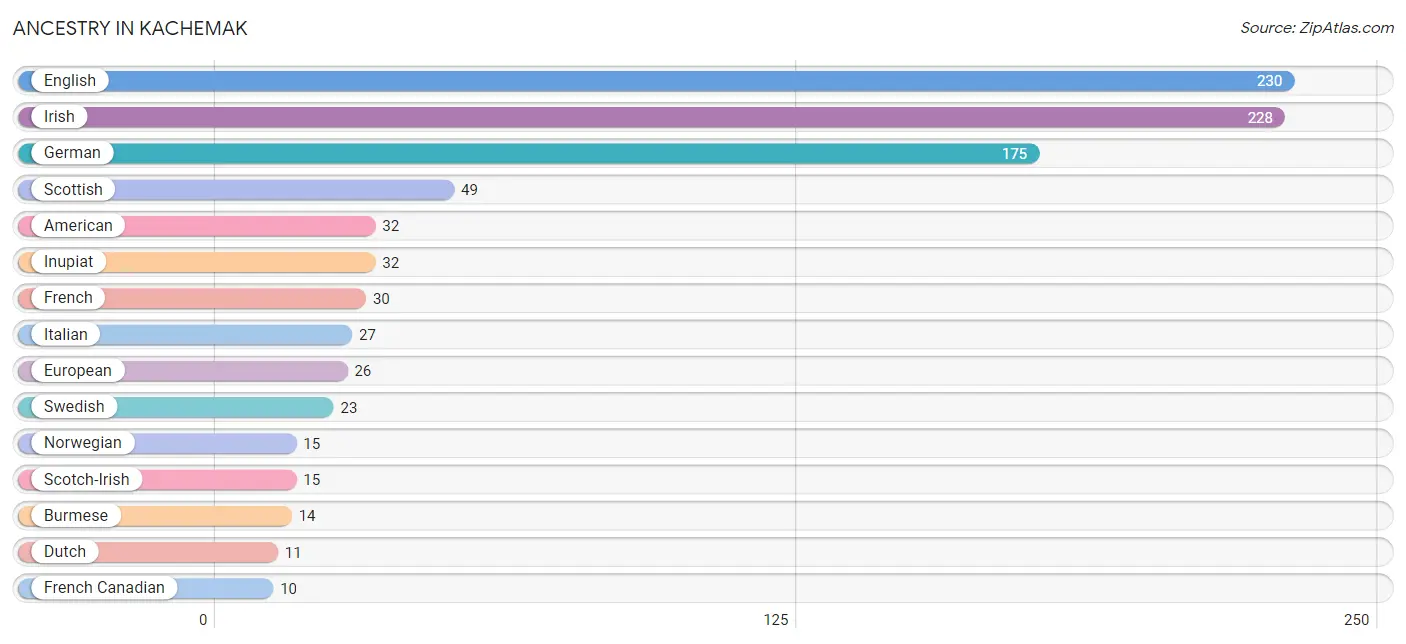
Ancestry in Kachemak
The most populous ancestries reported in Kachemak are English (230 | 29.2%), Irish (228 | 29.0%), German (175 | 22.2%), Scottish (49 | 6.2%), and American (32 | 4.1%), together accounting for 90.7% of all Kachemak residents.
| Ancestry | # Population | % Population |
| Alaska Native | 1 | 0.1% |
| Aleut | 3 | 0.4% |
| American | 32 | 4.1% |
| Arab | 8 | 1.0% |
| Austrian | 3 | 0.4% |
| Belgian | 3 | 0.4% |
| British | 5 | 0.6% |
| Burmese | 14 | 1.8% |
| Cherokee | 1 | 0.1% |
| Chippewa | 8 | 1.0% |
| Cuban | 3 | 0.4% |
| Danish | 1 | 0.1% |
| Dutch | 11 | 1.4% |
| English | 230 | 29.2% |
| European | 26 | 3.3% |
| Finnish | 3 | 0.4% |
| French | 30 | 3.8% |
| French Canadian | 10 | 1.3% |
| German | 175 | 22.2% |
| Hungarian | 4 | 0.5% |
| Inupiat | 32 | 4.1% |
| Irish | 228 | 29.0% |
| Italian | 27 | 3.4% |
| Korean | 8 | 1.0% |
| Lebanese | 8 | 1.0% |
| Lithuanian | 1 | 0.1% |
| Norwegian | 15 | 1.9% |
| Polish | 9 | 1.1% |
| Scotch-Irish | 15 | 1.9% |
| Scottish | 49 | 6.2% |
| Spanish | 2 | 0.3% |
| Swedish | 23 | 2.9% |
| Swiss | 9 | 1.1% |
| Tlingit-Haida | 1 | 0.1% |
| Welsh | 5 | 0.6% |
| Yaqui | 2 | 0.3% |
| Yup'ik | 8 | 1.0% | View All 37 Rows |
Immigrants in Kachemak
The most numerous immigrant groups reported in Kachemak came from Europe (19 | 2.4%), Western Europe (16 | 2.0%), Asia (14 | 1.8%), Eastern Asia (14 | 1.8%), and Korea (14 | 1.8%), together accounting for 9.8% of all Kachemak residents.
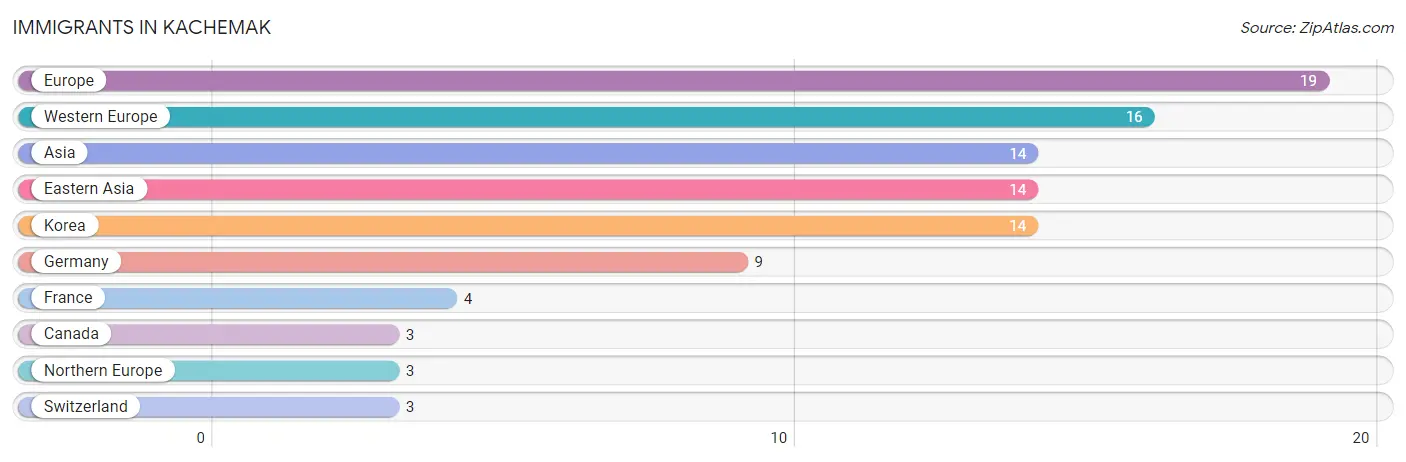
| Immigration Origin | # Population | % Population |
| Asia | 14 | 1.8% |
| Canada | 3 | 0.4% |
| Eastern Asia | 14 | 1.8% |
| Europe | 19 | 2.4% |
| France | 4 | 0.5% |
| Germany | 9 | 1.1% |
| Korea | 14 | 1.8% |
| Northern Europe | 3 | 0.4% |
| Switzerland | 3 | 0.4% |
| Western Europe | 16 | 2.0% | View All 10 Rows |
Sex and Age in Kachemak
Sex and Age in Kachemak
The most populous age groups in Kachemak are 35 to 39 Years (47 | 12.5%) for men and 35 to 39 Years (61 | 14.8%) for women.
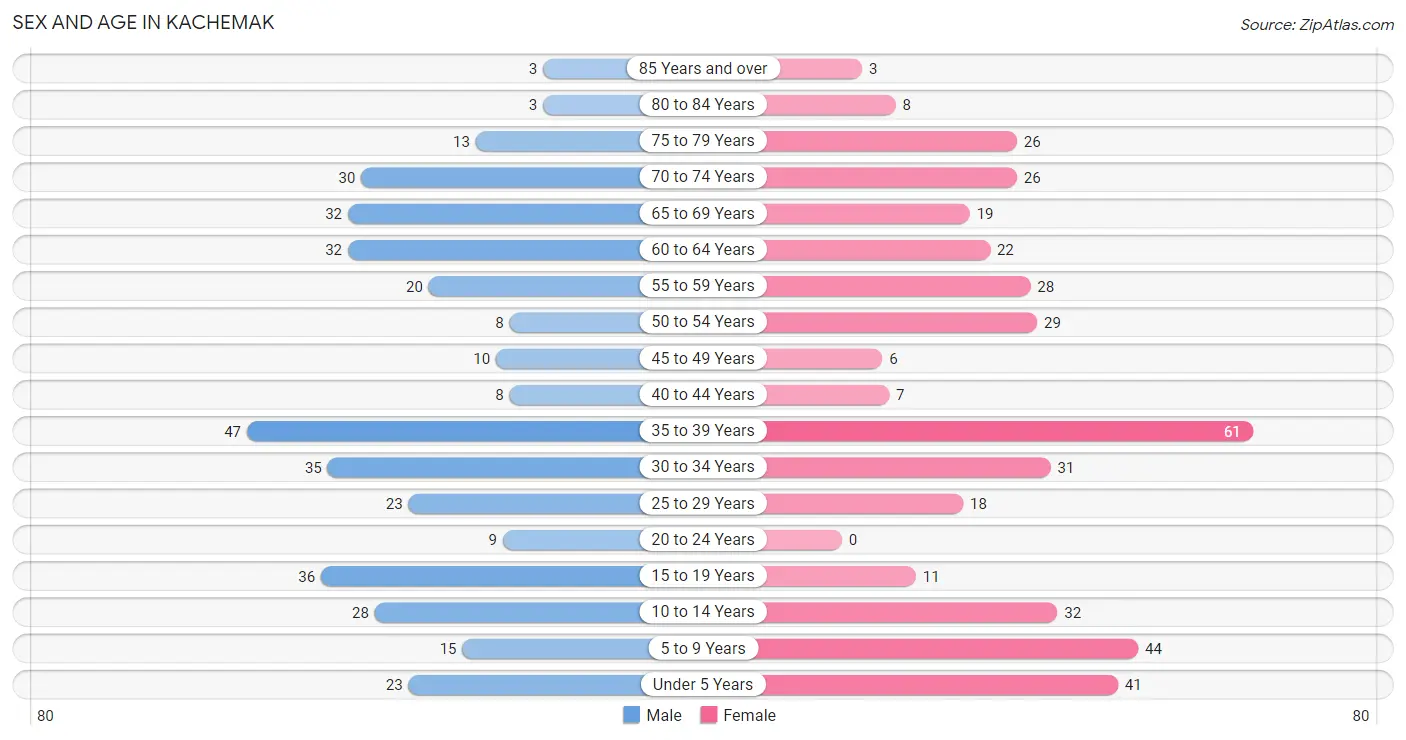
| Age Bracket | Male | Female |
| Under 5 Years | 23 (6.1%) | 41 (10.0%) |
| 5 to 9 Years | 15 (4.0%) | 44 (10.7%) |
| 10 to 14 Years | 28 (7.5%) | 32 (7.8%) |
| 15 to 19 Years | 36 (9.6%) | 11 (2.7%) |
| 20 to 24 Years | 9 (2.4%) | 0 (0.0%) |
| 25 to 29 Years | 23 (6.1%) | 18 (4.4%) |
| 30 to 34 Years | 35 (9.3%) | 31 (7.5%) |
| 35 to 39 Years | 47 (12.5%) | 61 (14.8%) |
| 40 to 44 Years | 8 (2.1%) | 7 (1.7%) |
| 45 to 49 Years | 10 (2.7%) | 6 (1.5%) |
| 50 to 54 Years | 8 (2.1%) | 29 (7.0%) |
| 55 to 59 Years | 20 (5.3%) | 28 (6.8%) |
| 60 to 64 Years | 32 (8.5%) | 22 (5.3%) |
| 65 to 69 Years | 32 (8.5%) | 19 (4.6%) |
| 70 to 74 Years | 30 (8.0%) | 26 (6.3%) |
| 75 to 79 Years | 13 (3.5%) | 26 (6.3%) |
| 80 to 84 Years | 3 (0.8%) | 8 (1.9%) |
| 85 Years and over | 3 (0.8%) | 3 (0.7%) |
| Total | 375 (100.0%) | 412 (100.0%) |
Families and Households in Kachemak
Median Family Size in Kachemak
The median family size in Kachemak is 2.94 persons per family, with married-couple families (172 | 80.0%) accounting for the largest median family size of 3.17 persons per family. On the other hand, single male/father families (7 | 3.3%) represent the smallest median family size with 2.00 persons per family.
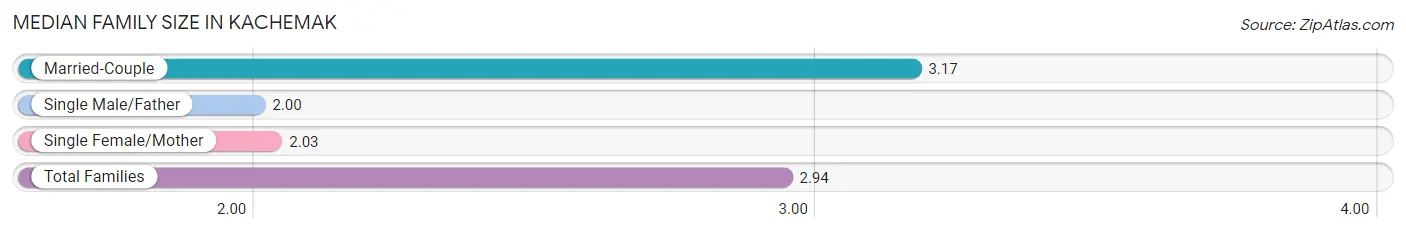
| Family Type | # Families | Family Size |
| Married-Couple | 172 (80.0%) | 3.17 |
| Single Male/Father | 7 (3.3%) | 2.00 |
| Single Female/Mother | 36 (16.7%) | 2.03 |
| Total Families | 215 (100.0%) | 2.94 |
Median Household Size in Kachemak
The median household size in Kachemak is 2.56 persons per household, with married-couple households (172 | 56.2%) accounting for the largest median household size of 3.28 persons per household. non-family households (91 | 29.7%) represent the smallest median household size with 1.31 persons per household.
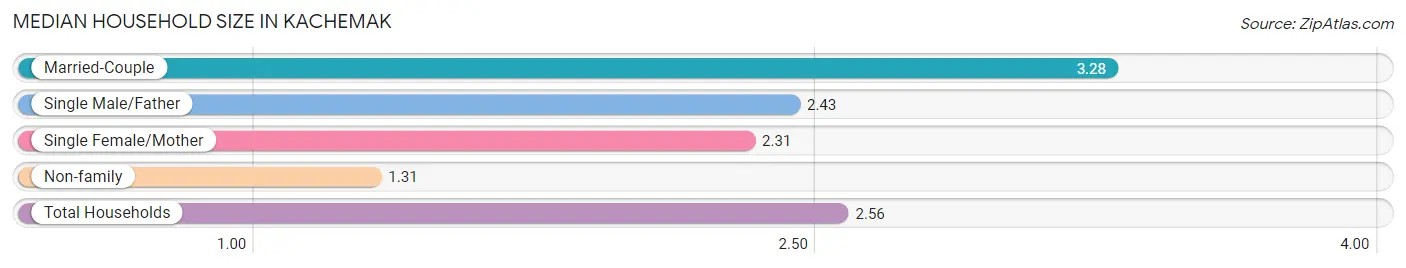
| Household Type | # Households | Household Size |
| Married-Couple | 172 (56.2%) | 3.28 |
| Single Male/Father | 7 (2.3%) | 2.43 |
| Single Female/Mother | 36 (11.8%) | 2.31 |
| Non-family | 91 (29.7%) | 1.31 |
| Total Households | 306 (100.0%) | 2.56 |
Household Size by Marriage Status in Kachemak
Out of a total of 306 households in Kachemak, 215 (70.3%) are family households, while 91 (29.7%) are nonfamily households. The most numerous type of family households are 2-person households, comprising 122, and the most common type of nonfamily households are 1-person households, comprising 71.
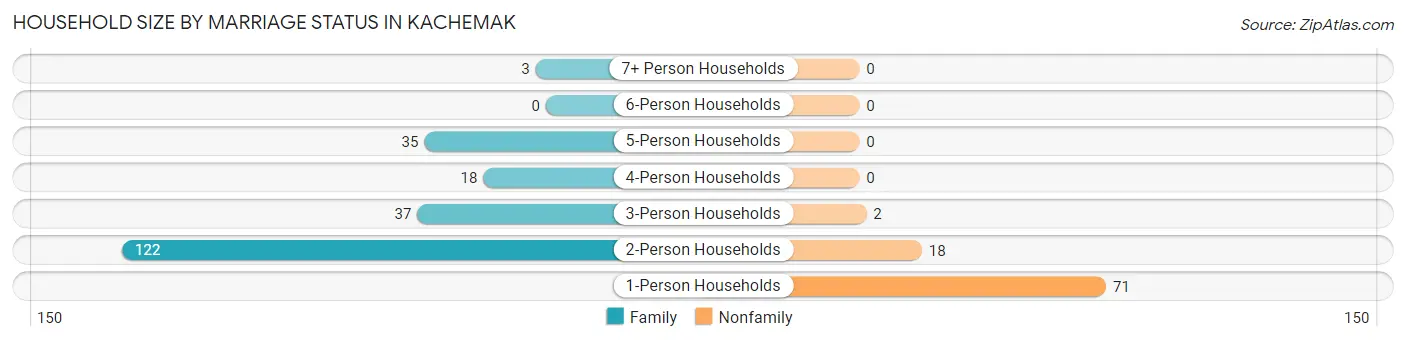
| Household Size | Family Households | Nonfamily Households |
| 1-Person Households | - | 71 (23.2%) |
| 2-Person Households | 122 (39.9%) | 18 (5.9%) |
| 3-Person Households | 37 (12.1%) | 2 (0.6%) |
| 4-Person Households | 18 (5.9%) | 0 (0.0%) |
| 5-Person Households | 35 (11.4%) | 0 (0.0%) |
| 6-Person Households | 0 (0.0%) | 0 (0.0%) |
| 7+ Person Households | 3 (1.0%) | 0 (0.0%) |
| Total | 215 (70.3%) | 91 (29.7%) |
Female Fertility in Kachemak
Fertility by Age in Kachemak
Average fertility rate in Kachemak is 20.0 births per 1,000 women. Women in the age bracket of 35 to 50 years have the highest fertility rate with 34.0 births per 1,000 women. Women in the age bracket of 35 to 50 years acount for 100.0% of all women with births.
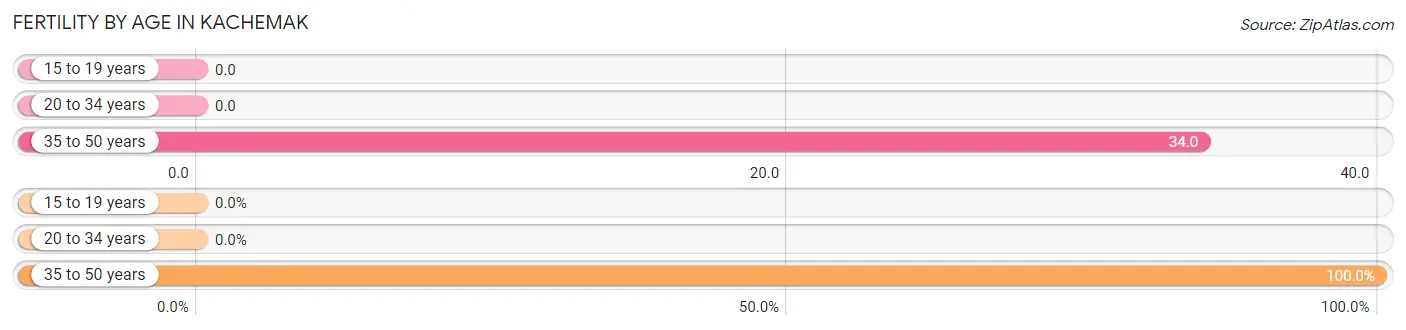
| Age Bracket | Women with Births | Births / 1,000 Women |
| 15 to 19 years | 0 (0.0%) | 0.0 |
| 20 to 34 years | 0 (0.0%) | 0.0 |
| 35 to 50 years | 3 (100.0%) | 34.0 |
| Total | 3 (100.0%) | 20.0 |
Fertility by Age by Marriage Status in Kachemak
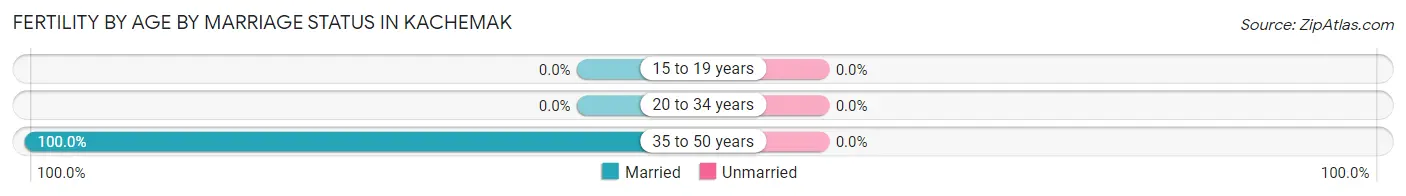
| Age Bracket | Married | Unmarried |
| 15 to 19 years | 0 (0.0%) | 0 (0.0%) |
| 20 to 34 years | 0 (0.0%) | 0 (0.0%) |
| 35 to 50 years | 3 (100.0%) | 0 (0.0%) |
| Total | 3 (100.0%) | 0 (0.0%) |
Fertility by Education in Kachemak
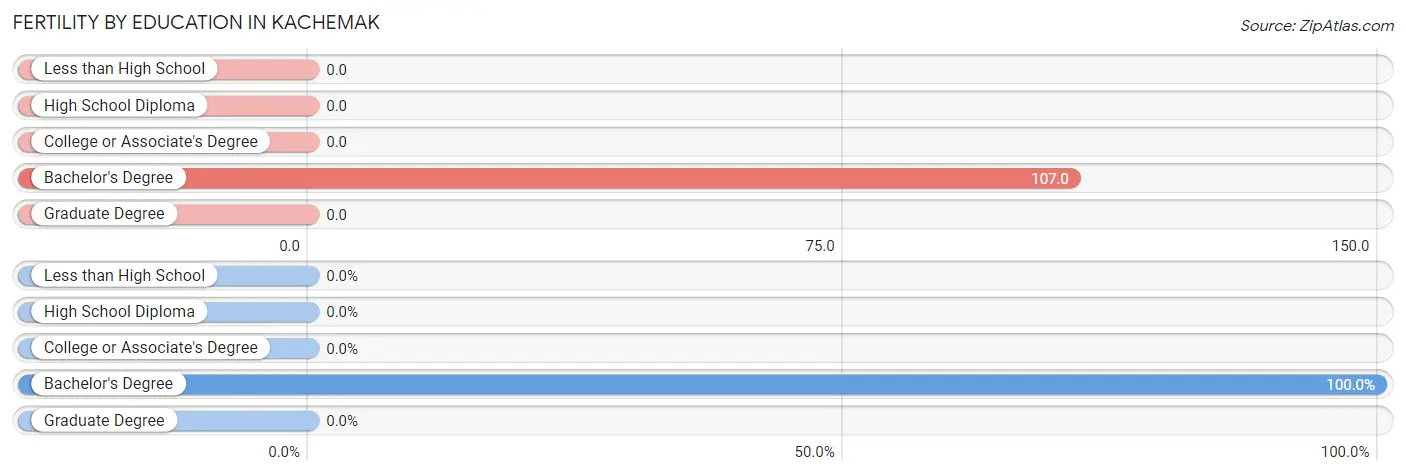
| Educational Attainment | Women with Births | Births / 1,000 Women |
| Less than High School | 0 (0.0%) | 0.0 |
| High School Diploma | 0 (0.0%) | 0.0 |
| College or Associate's Degree | 0 (0.0%) | 0.0 |
| Bachelor's Degree | 3 (100.0%) | 107.0 |
| Graduate Degree | 0 (0.0%) | 0.0 |
| Total | 3 (100.0%) | 20.0 |
Fertility by Education by Marriage Status in Kachemak
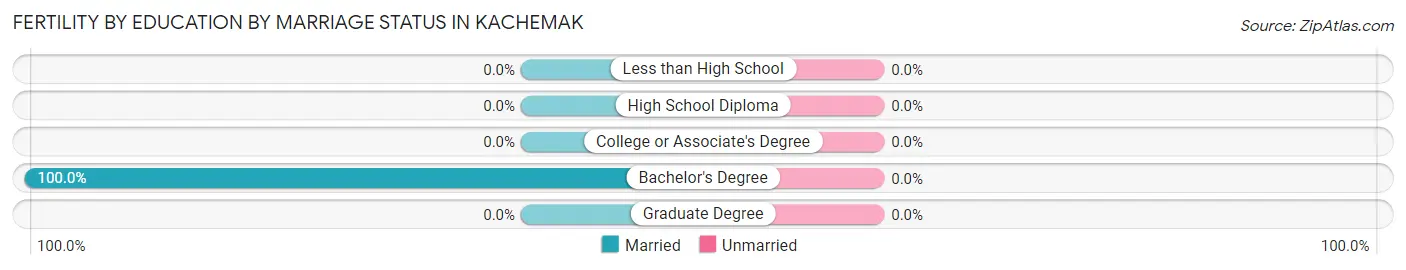
| Educational Attainment | Married | Unmarried |
| Less than High School | 0 (0.0%) | 0 (0.0%) |
| High School Diploma | 0 (0.0%) | 0 (0.0%) |
| College or Associate's Degree | 0 (0.0%) | 0 (0.0%) |
| Bachelor's Degree | 3 (100.0%) | 0 (0.0%) |
| Graduate Degree | 0 (0.0%) | 0 (0.0%) |
| Total | 3 (100.0%) | 0 (0.0%) |
Employment Characteristics in Kachemak
Employment by Class of Employer in Kachemak
Among the 284 employed individuals in Kachemak, private company employees (104 | 36.6%), self-employed (not incorporated) (68 | 23.9%), and not-for-profit organizations (37 | 13.0%) make up the most common classes of employment.
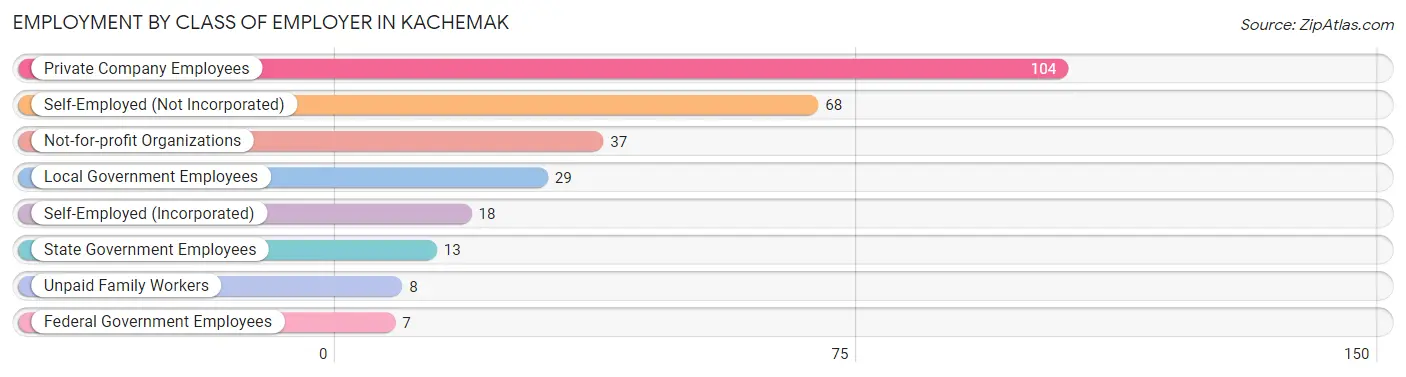
| Employer Class | # Employees | % Employees |
| Private Company Employees | 104 | 36.6% |
| Self-Employed (Incorporated) | 18 | 6.3% |
| Self-Employed (Not Incorporated) | 68 | 23.9% |
| Not-for-profit Organizations | 37 | 13.0% |
| Local Government Employees | 29 | 10.2% |
| State Government Employees | 13 | 4.6% |
| Federal Government Employees | 7 | 2.5% |
| Unpaid Family Workers | 8 | 2.8% |
| Total | 284 | 100.0% |
Employment Status by Age in Kachemak
According to the labor force statistics for Kachemak, out of the total population over 16 years of age (600), 55.8% or 335 individuals are in the labor force, with 7.5% or 25 of them unemployed. The age group with the highest labor force participation rate is 45 to 54 years, with 90.6% or 48 individuals in the labor force. Within the labor force, the 16 to 19 years age range has the highest percentage of unemployed individuals, with 34.5% or 10 of them being unemployed.
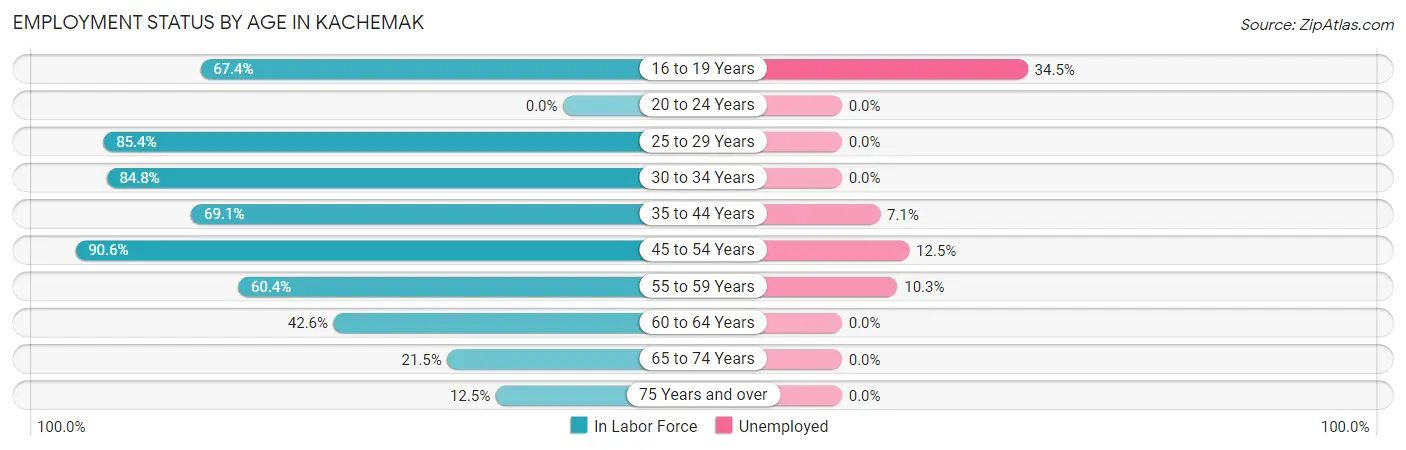
| Age Bracket | In Labor Force | Unemployed |
| 16 to 19 Years | 29 (67.4%) | 10 (34.5%) |
| 20 to 24 Years | 0 (0.0%) | 0 (0.0%) |
| 25 to 29 Years | 35 (85.4%) | 0 (0.0%) |
| 30 to 34 Years | 56 (84.8%) | 0 (0.0%) |
| 35 to 44 Years | 85 (69.1%) | 6 (7.1%) |
| 45 to 54 Years | 48 (90.6%) | 6 (12.5%) |
| 55 to 59 Years | 29 (60.4%) | 3 (10.3%) |
| 60 to 64 Years | 23 (42.6%) | 0 (0.0%) |
| 65 to 74 Years | 23 (21.5%) | 0 (0.0%) |
| 75 Years and over | 7 (12.5%) | 0 (0.0%) |
| Total | 335 (55.8%) | 25 (7.5%) |
Employment Status by Educational Attainment in Kachemak
According to labor force statistics for Kachemak, 71.7% of individuals (276) out of the total population between 25 and 64 years of age (385) are in the labor force, with 5.4% or 15 of them being unemployed. The group with the highest labor force participation rate are those with the educational attainment of bachelor's degree or higher, with 80.1% or 125 individuals in the labor force. Within the labor force, individuals with college / associate degree education have the highest percentage of unemployment, with 13.0% or 12 of them being unemployed.
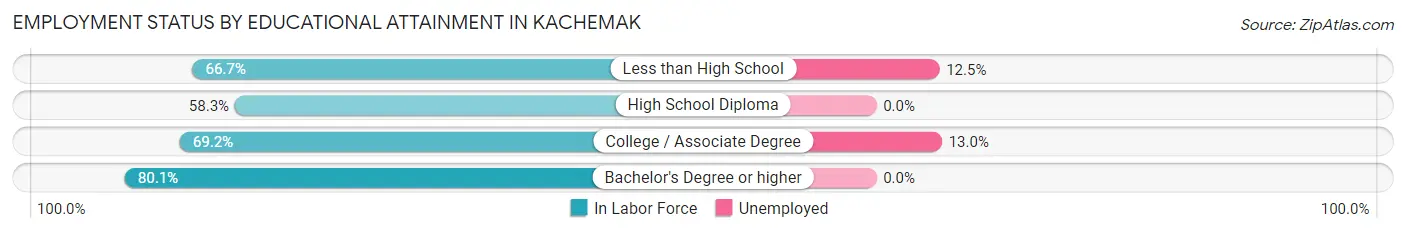
| Educational Attainment | In Labor Force | Unemployed |
| Less than High School | 24 (66.7%) | 4 (12.5%) |
| High School Diploma | 35 (58.3%) | 0 (0.0%) |
| College / Associate Degree | 92 (69.2%) | 17 (13.0%) |
| Bachelor's Degree or higher | 125 (80.1%) | 0 (0.0%) |
| Total | 276 (71.7%) | 21 (5.4%) |
Employment Occupations by Sex in Kachemak
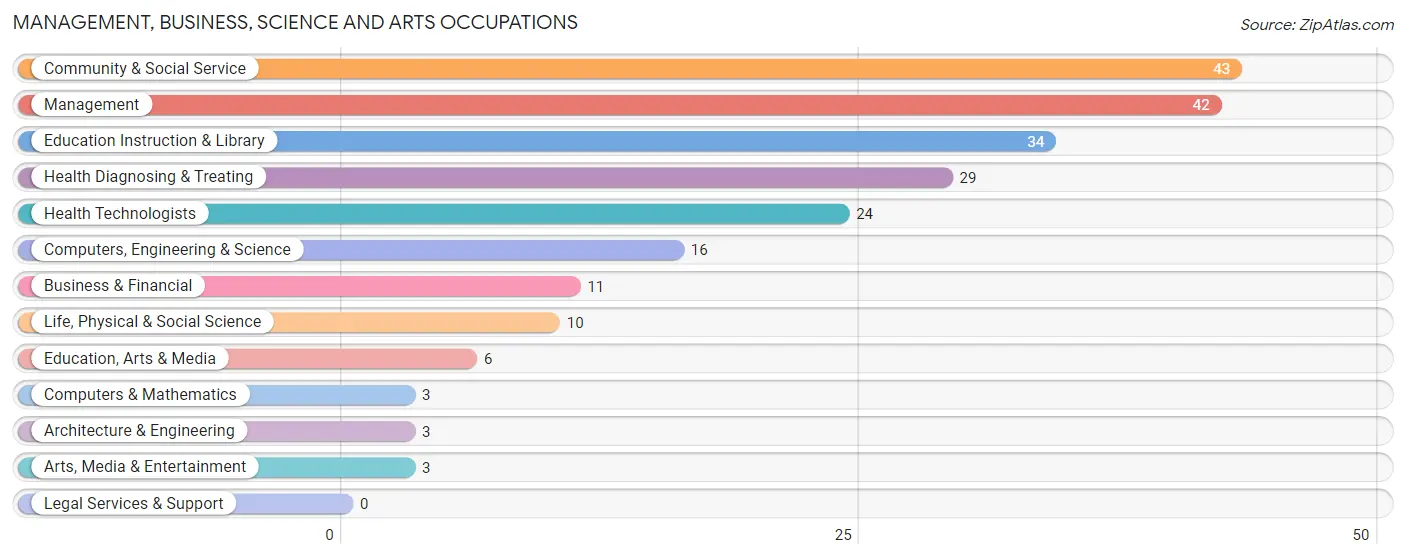
Management, Business, Science and Arts Occupations
The most common Management, Business, Science and Arts occupations in Kachemak are Community & Social Service (43 | 13.9%), Management (42 | 13.6%), Education Instruction & Library (34 | 11.0%), Health Diagnosing & Treating (29 | 9.3%), and Health Technologists (24 | 7.7%).
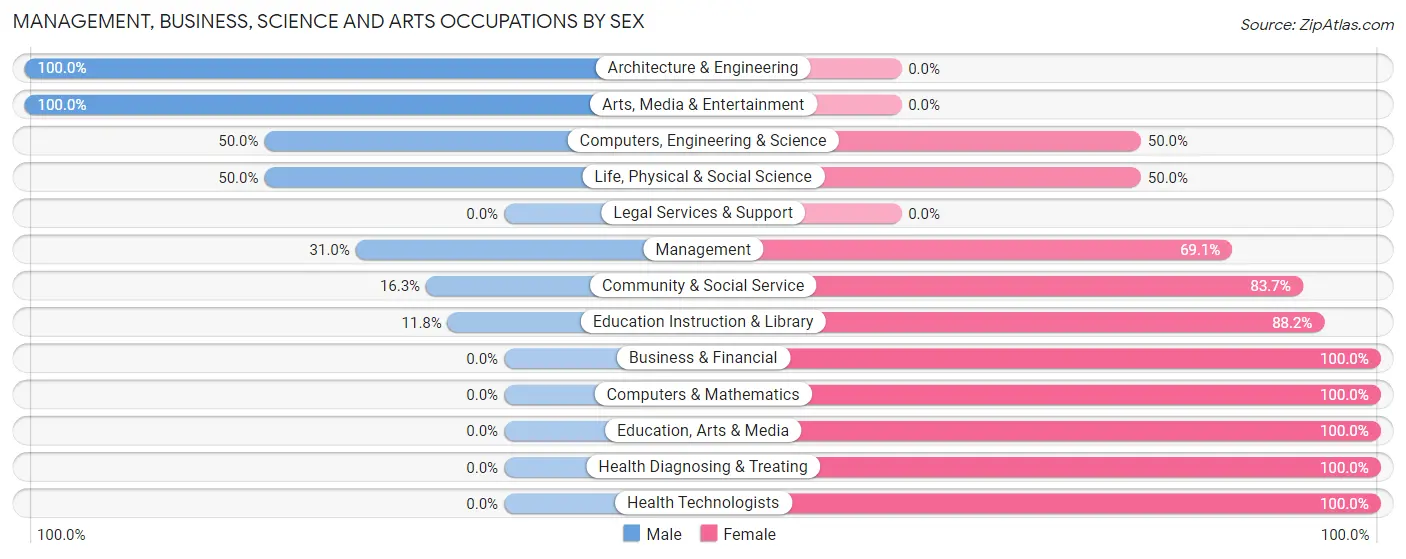
Management, Business, Science and Arts Occupations by Sex
Within the Management, Business, Science and Arts occupations in Kachemak, the most male-oriented occupations are Architecture & Engineering (100.0%), Arts, Media & Entertainment (100.0%), and Computers, Engineering & Science (50.0%), while the most female-oriented occupations are Business & Financial (100.0%), Computers & Mathematics (100.0%), and Education, Arts & Media (100.0%).
| Occupation | Male | Female |
| Management | 13 (30.9%) | 29 (69.1%) |
| Business & Financial | 0 (0.0%) | 11 (100.0%) |
| Computers, Engineering & Science | 8 (50.0%) | 8 (50.0%) |
| Computers & Mathematics | 0 (0.0%) | 3 (100.0%) |
| Architecture & Engineering | 3 (100.0%) | 0 (0.0%) |
| Life, Physical & Social Science | 5 (50.0%) | 5 (50.0%) |
| Community & Social Service | 7 (16.3%) | 36 (83.7%) |
| Education, Arts & Media | 0 (0.0%) | 6 (100.0%) |
| Legal Services & Support | 0 (0.0%) | 0 (0.0%) |
| Education Instruction & Library | 4 (11.8%) | 30 (88.2%) |
| Arts, Media & Entertainment | 3 (100.0%) | 0 (0.0%) |
| Health Diagnosing & Treating | 0 (0.0%) | 29 (100.0%) |
| Health Technologists | 0 (0.0%) | 24 (100.0%) |
| Total (Category) | 28 (19.9%) | 113 (80.1%) |
| Total (Overall) | 170 (54.8%) | 140 (45.2%) |
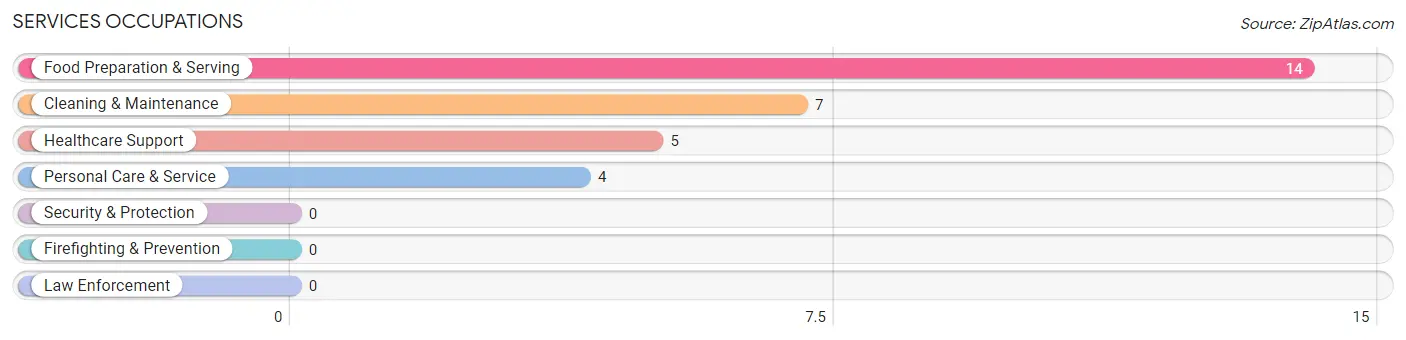
Services Occupations
The most common Services occupations in Kachemak are Food Preparation & Serving (14 | 4.5%), Cleaning & Maintenance (7 | 2.3%), Healthcare Support (5 | 1.6%), and Personal Care & Service (4 | 1.3%).
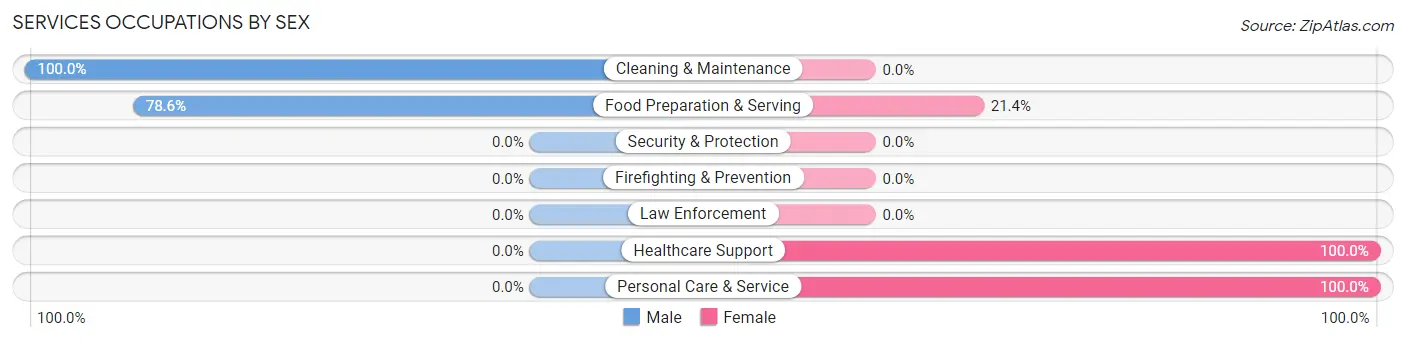
Services Occupations by Sex
Within the Services occupations in Kachemak, the most male-oriented occupations are Cleaning & Maintenance (100.0%), and Food Preparation & Serving (78.6%), while the most female-oriented occupations are Healthcare Support (100.0%), Personal Care & Service (100.0%), and Food Preparation & Serving (21.4%).
| Occupation | Male | Female |
| Healthcare Support | 0 (0.0%) | 5 (100.0%) |
| Security & Protection | 0 (0.0%) | 0 (0.0%) |
| Firefighting & Prevention | 0 (0.0%) | 0 (0.0%) |
| Law Enforcement | 0 (0.0%) | 0 (0.0%) |
| Food Preparation & Serving | 11 (78.6%) | 3 (21.4%) |
| Cleaning & Maintenance | 7 (100.0%) | 0 (0.0%) |
| Personal Care & Service | 0 (0.0%) | 4 (100.0%) |
| Total (Category) | 18 (60.0%) | 12 (40.0%) |
| Total (Overall) | 170 (54.8%) | 140 (45.2%) |
Sales and Office Occupations
The most common Sales and Office occupations in Kachemak are Sales & Related (31 | 10.0%), and Office & Administration (6 | 1.9%).
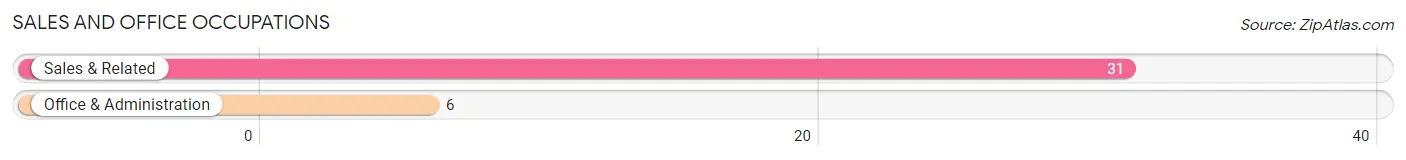
Sales and Office Occupations by Sex

| Occupation | Male | Female |
| Sales & Related | 31 (100.0%) | 0 (0.0%) |
| Office & Administration | 3 (50.0%) | 3 (50.0%) |
| Total (Category) | 34 (91.9%) | 3 (8.1%) |
| Total (Overall) | 170 (54.8%) | 140 (45.2%) |
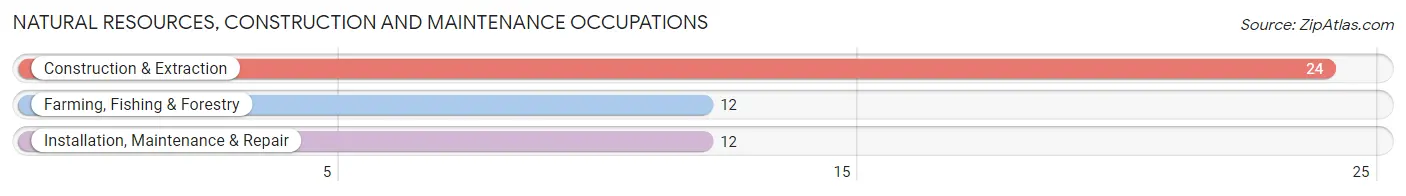
Natural Resources, Construction and Maintenance Occupations
The most common Natural Resources, Construction and Maintenance occupations in Kachemak are Construction & Extraction (24 | 7.7%), Farming, Fishing & Forestry (12 | 3.9%), and Installation, Maintenance & Repair (12 | 3.9%).
Natural Resources, Construction and Maintenance Occupations by Sex
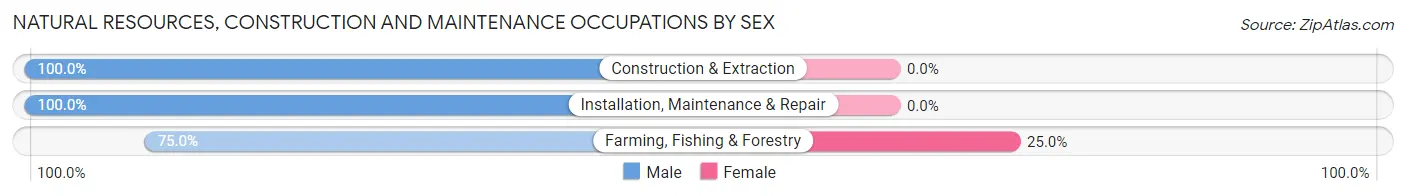
| Occupation | Male | Female |
| Farming, Fishing & Forestry | 9 (75.0%) | 3 (25.0%) |
| Construction & Extraction | 24 (100.0%) | 0 (0.0%) |
| Installation, Maintenance & Repair | 12 (100.0%) | 0 (0.0%) |
| Total (Category) | 45 (93.8%) | 3 (6.2%) |
| Total (Overall) | 170 (54.8%) | 140 (45.2%) |
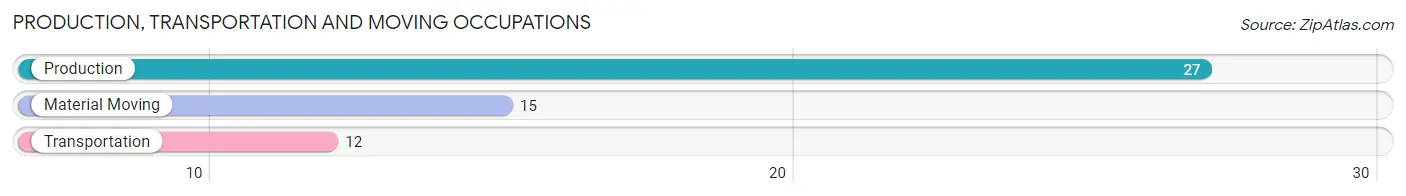
Production, Transportation and Moving Occupations
The most common Production, Transportation and Moving occupations in Kachemak are Production (27 | 8.7%), Material Moving (15 | 4.8%), and Transportation (12 | 3.9%).
Production, Transportation and Moving Occupations by Sex
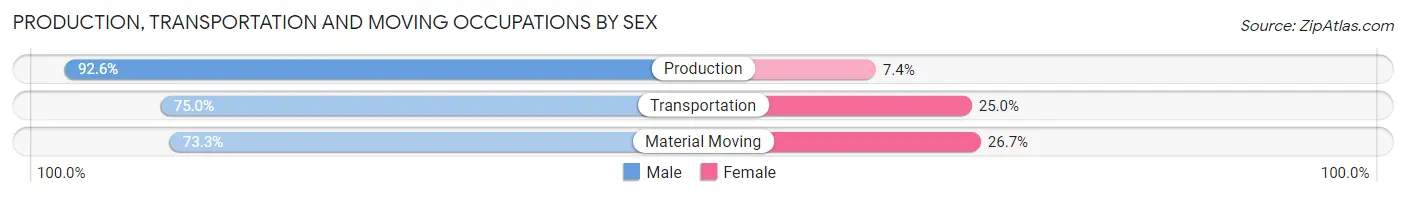
| Occupation | Male | Female |
| Production | 25 (92.6%) | 2 (7.4%) |
| Transportation | 9 (75.0%) | 3 (25.0%) |
| Material Moving | 11 (73.3%) | 4 (26.7%) |
| Total (Category) | 45 (83.3%) | 9 (16.7%) |
| Total (Overall) | 170 (54.8%) | 140 (45.2%) |
Employment Industries by Sex in Kachemak
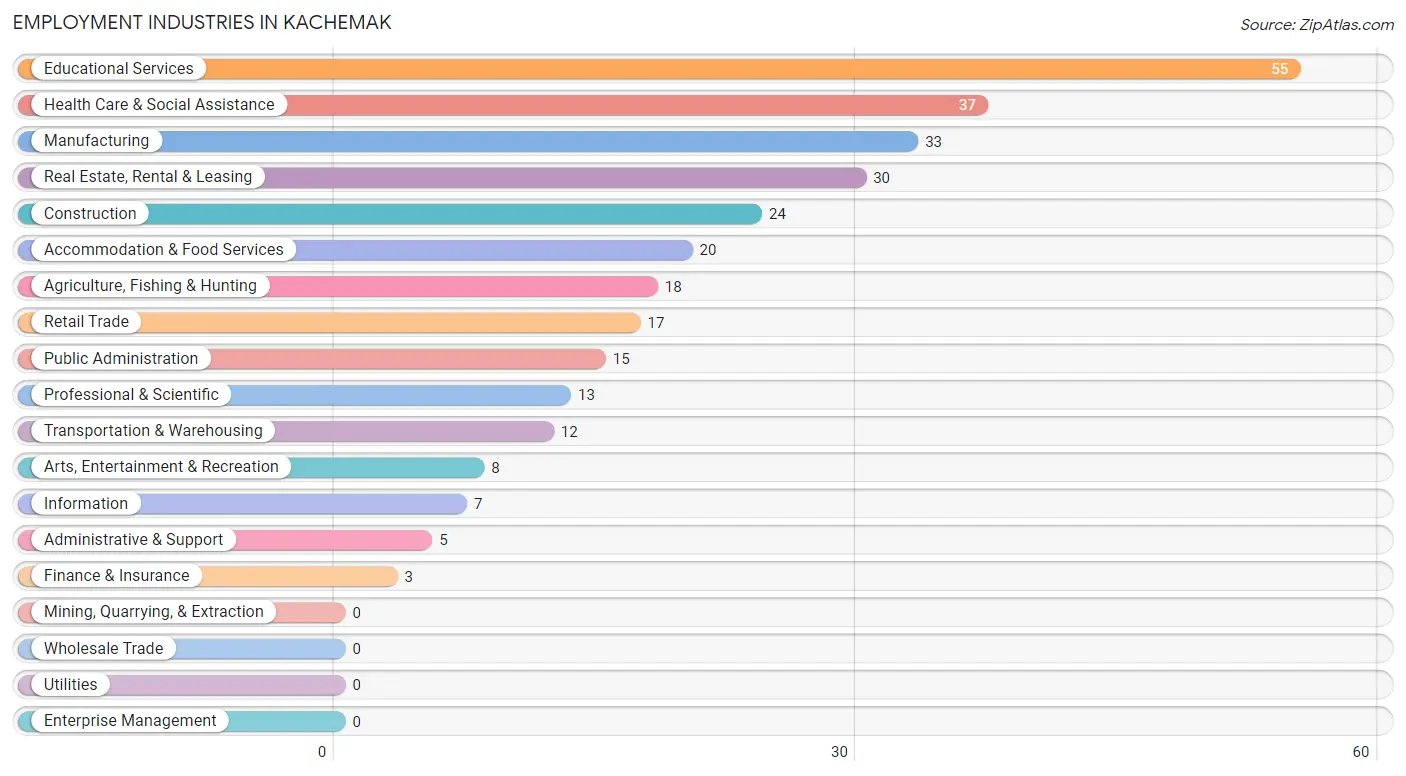
Employment Industries in Kachemak
The major employment industries in Kachemak include Educational Services (55 | 17.7%), Health Care & Social Assistance (37 | 11.9%), Manufacturing (33 | 10.6%), Real Estate, Rental & Leasing (30 | 9.7%), and Construction (24 | 7.7%).
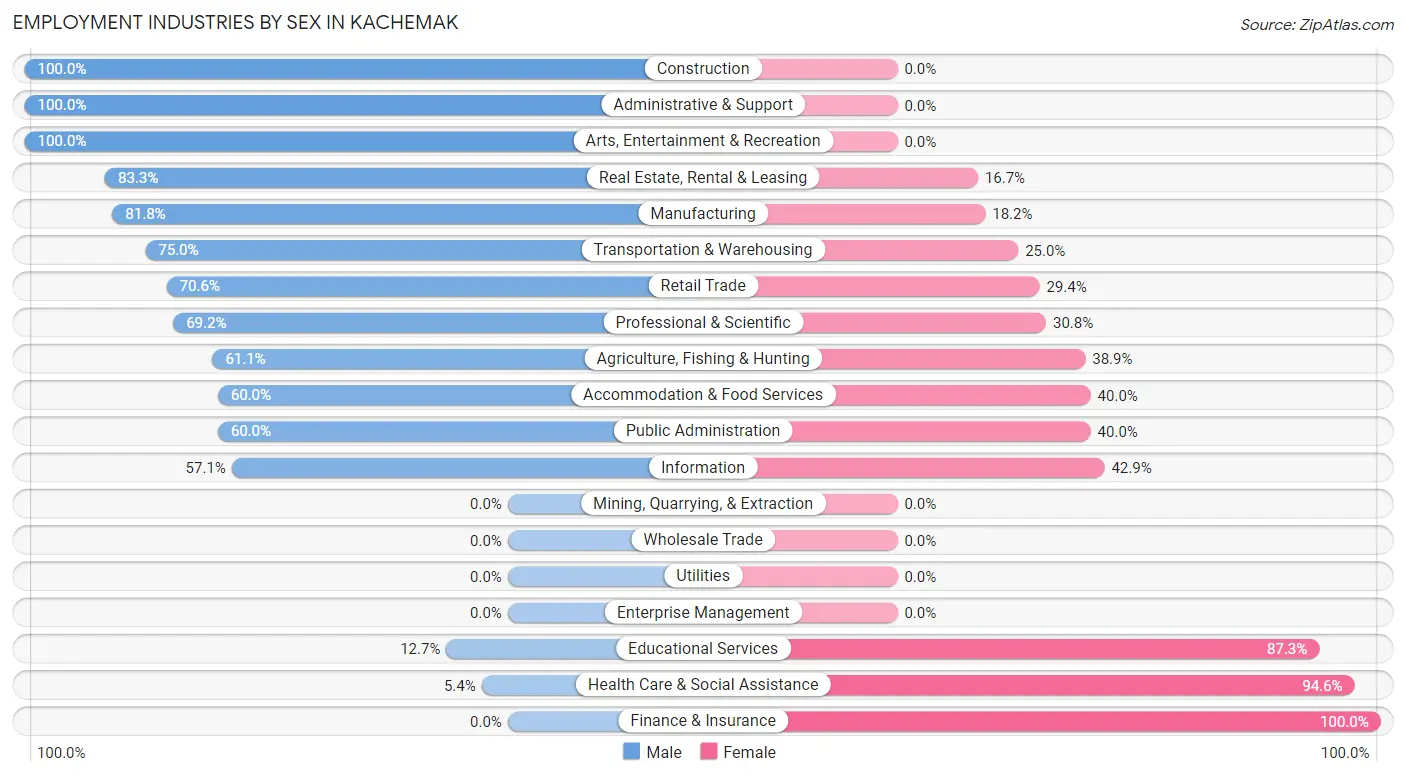
Employment Industries by Sex in Kachemak
The Kachemak industries that see more men than women are Construction (100.0%), Administrative & Support (100.0%), and Arts, Entertainment & Recreation (100.0%), whereas the industries that tend to have a higher number of women are Finance & Insurance (100.0%), Health Care & Social Assistance (94.6%), and Educational Services (87.3%).
| Industry | Male | Female |
| Agriculture, Fishing & Hunting | 11 (61.1%) | 7 (38.9%) |
| Mining, Quarrying, & Extraction | 0 (0.0%) | 0 (0.0%) |
| Construction | 24 (100.0%) | 0 (0.0%) |
| Manufacturing | 27 (81.8%) | 6 (18.2%) |
| Wholesale Trade | 0 (0.0%) | 0 (0.0%) |
| Retail Trade | 12 (70.6%) | 5 (29.4%) |
| Transportation & Warehousing | 9 (75.0%) | 3 (25.0%) |
| Utilities | 0 (0.0%) | 0 (0.0%) |
| Information | 4 (57.1%) | 3 (42.9%) |
| Finance & Insurance | 0 (0.0%) | 3 (100.0%) |
| Real Estate, Rental & Leasing | 25 (83.3%) | 5 (16.7%) |
| Professional & Scientific | 9 (69.2%) | 4 (30.8%) |
| Enterprise Management | 0 (0.0%) | 0 (0.0%) |
| Administrative & Support | 5 (100.0%) | 0 (0.0%) |
| Educational Services | 7 (12.7%) | 48 (87.3%) |
| Health Care & Social Assistance | 2 (5.4%) | 35 (94.6%) |
| Arts, Entertainment & Recreation | 8 (100.0%) | 0 (0.0%) |
| Accommodation & Food Services | 12 (60.0%) | 8 (40.0%) |
| Public Administration | 9 (60.0%) | 6 (40.0%) |
| Total | 170 (54.8%) | 140 (45.2%) |
Education in Kachemak
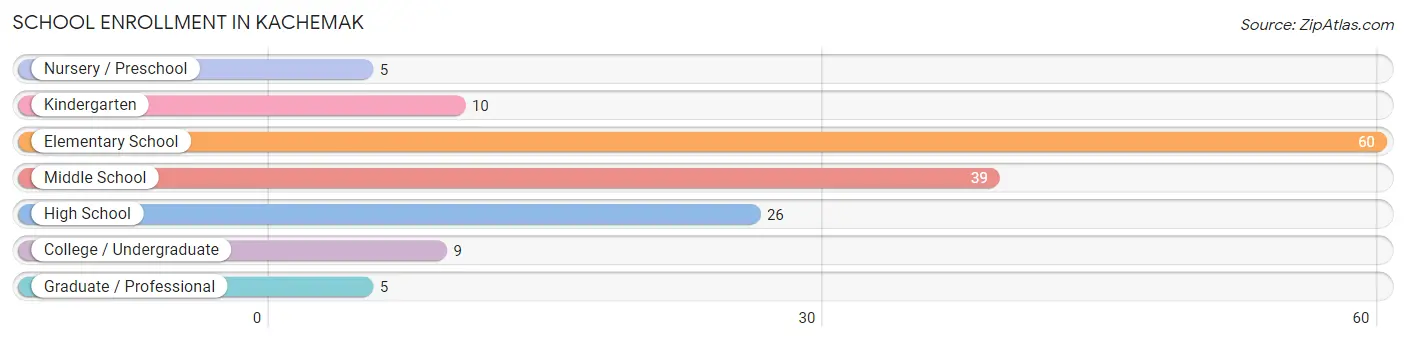
School Enrollment in Kachemak
The most common levels of schooling among the 154 students in Kachemak are elementary school (60 | 39.0%), middle school (39 | 25.3%), and high school (26 | 16.9%).
| School Level | # Students | % Students |
| Nursery / Preschool | 5 | 3.3% |
| Kindergarten | 10 | 6.5% |
| Elementary School | 60 | 39.0% |
| Middle School | 39 | 25.3% |
| High School | 26 | 16.9% |
| College / Undergraduate | 9 | 5.8% |
| Graduate / Professional | 5 | 3.3% |
| Total | 154 | 100.0% |
School Enrollment by Age by Funding Source in Kachemak
Out of a total of 154 students who are enrolled in schools in Kachemak, 71 (46.1%) attend a private institution, while the remaining 83 (53.9%) are enrolled in public schools. The age group of 35 years and over has the highest likelihood of being enrolled in private schools, with 10 (100.0% in the age bracket) enrolled. Conversely, the age group of 15 to 17 year olds has the lowest likelihood of being enrolled in a private school, with 12 (100.0% in the age bracket) attending a public institution.
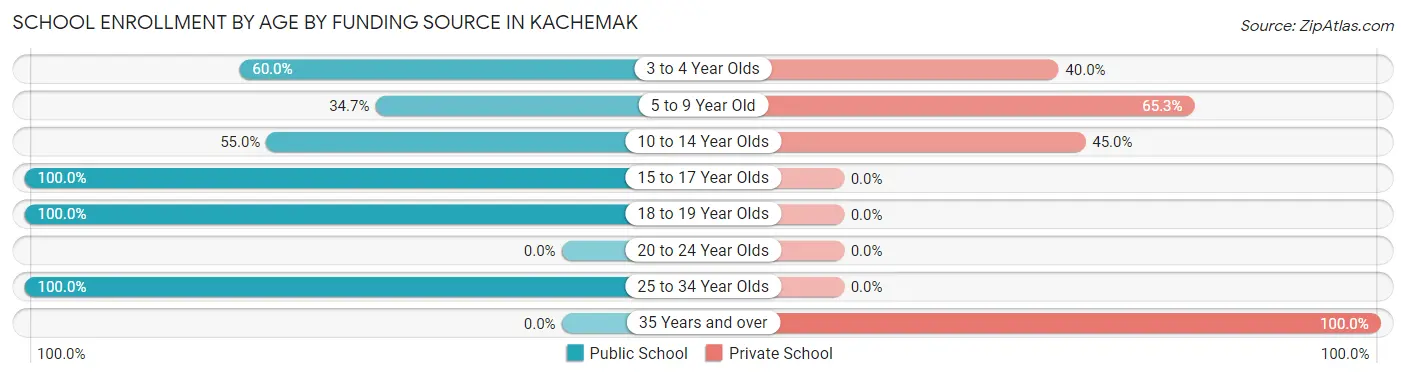
| Age Bracket | Public School | Private School |
| 3 to 4 Year Olds | 3 (60.0%) | 2 (40.0%) |
| 5 to 9 Year Old | 17 (34.7%) | 32 (65.3%) |
| 10 to 14 Year Olds | 33 (55.0%) | 27 (45.0%) |
| 15 to 17 Year Olds | 12 (100.0%) | 0 (0.0%) |
| 18 to 19 Year Olds | 14 (100.0%) | 0 (0.0%) |
| 20 to 24 Year Olds | 0 (0.0%) | 0 (0.0%) |
| 25 to 34 Year Olds | 4 (100.0%) | 0 (0.0%) |
| 35 Years and over | 0 (0.0%) | 10 (100.0%) |
| Total | 83 (53.9%) | 71 (46.1%) |
Educational Attainment by Field of Study in Kachemak
Bio, nature & agricultural (47 | 18.9%), education (40 | 16.1%), social sciences (28 | 11.2%), science & technology (25 | 10.0%), and literature & languages (19 | 7.6%) are the most common fields of study among 249 individuals in Kachemak who have obtained a bachelor's degree or higher.
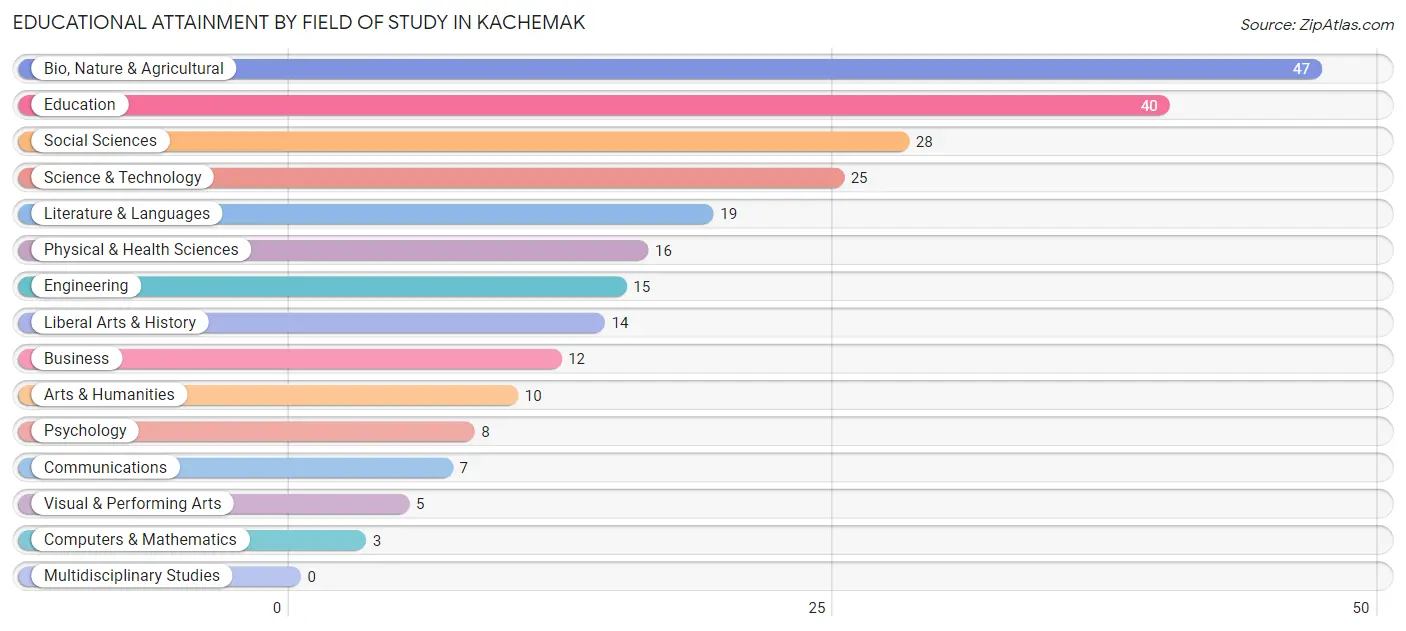
| Field of Study | # Graduates | % Graduates |
| Computers & Mathematics | 3 | 1.2% |
| Bio, Nature & Agricultural | 47 | 18.9% |
| Physical & Health Sciences | 16 | 6.4% |
| Psychology | 8 | 3.2% |
| Social Sciences | 28 | 11.2% |
| Engineering | 15 | 6.0% |
| Multidisciplinary Studies | 0 | 0.0% |
| Science & Technology | 25 | 10.0% |
| Business | 12 | 4.8% |
| Education | 40 | 16.1% |
| Literature & Languages | 19 | 7.6% |
| Liberal Arts & History | 14 | 5.6% |
| Visual & Performing Arts | 5 | 2.0% |
| Communications | 7 | 2.8% |
| Arts & Humanities | 10 | 4.0% |
| Total | 249 | 100.0% |
Transportation & Commute in Kachemak
Vehicle Availability by Sex in Kachemak
The most prevalent vehicle ownership categories in Kachemak are males with 2 vehicles (49, accounting for 32.5%) and females with 2 vehicles (54, making up 37.1%).
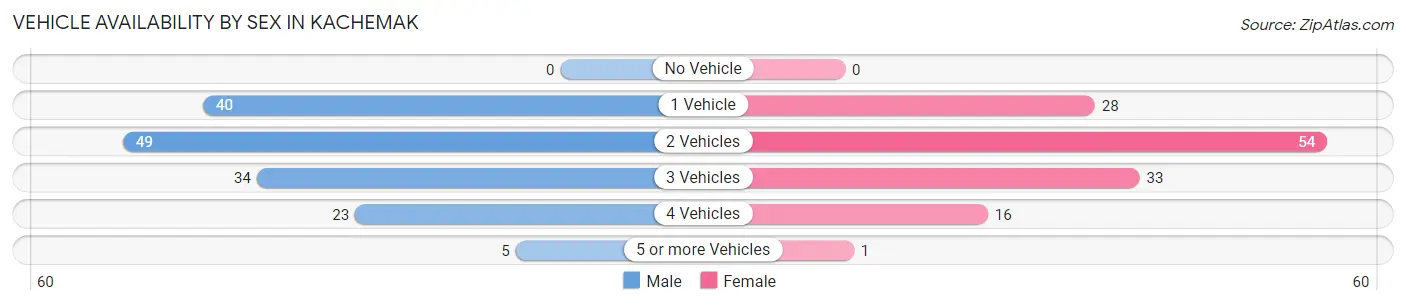
| Vehicles Available | Male | Female |
| No Vehicle | 0 (0.0%) | 0 (0.0%) |
| 1 Vehicle | 40 (26.5%) | 28 (21.2%) |
| 2 Vehicles | 49 (32.5%) | 54 (40.9%) |
| 3 Vehicles | 34 (22.5%) | 33 (25.0%) |
| 4 Vehicles | 23 (15.2%) | 16 (12.1%) |
| 5 or more Vehicles | 5 (3.3%) | 1 (0.8%) |
| Total | 151 (100.0%) | 132 (100.0%) |
Commute Time in Kachemak
The most frequently occuring commute durations in Kachemak are 10 to 14 minutes (120 commuters, 54.8%), less than 5 minutes (28 commuters, 12.8%), and 15 to 19 minutes (23 commuters, 10.5%).
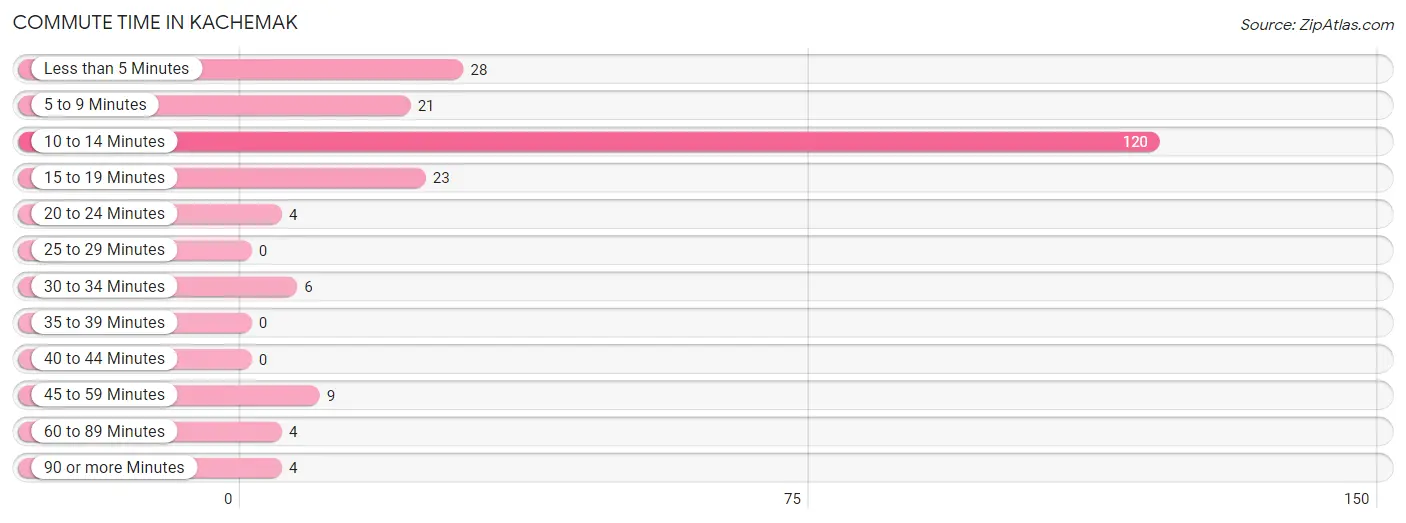
| Commute Time | # Commuters | % Commuters |
| Less than 5 Minutes | 28 | 12.8% |
| 5 to 9 Minutes | 21 | 9.6% |
| 10 to 14 Minutes | 120 | 54.8% |
| 15 to 19 Minutes | 23 | 10.5% |
| 20 to 24 Minutes | 4 | 1.8% |
| 25 to 29 Minutes | 0 | 0.0% |
| 30 to 34 Minutes | 6 | 2.7% |
| 35 to 39 Minutes | 0 | 0.0% |
| 40 to 44 Minutes | 0 | 0.0% |
| 45 to 59 Minutes | 9 | 4.1% |
| 60 to 89 Minutes | 4 | 1.8% |
| 90 or more Minutes | 4 | 1.8% |
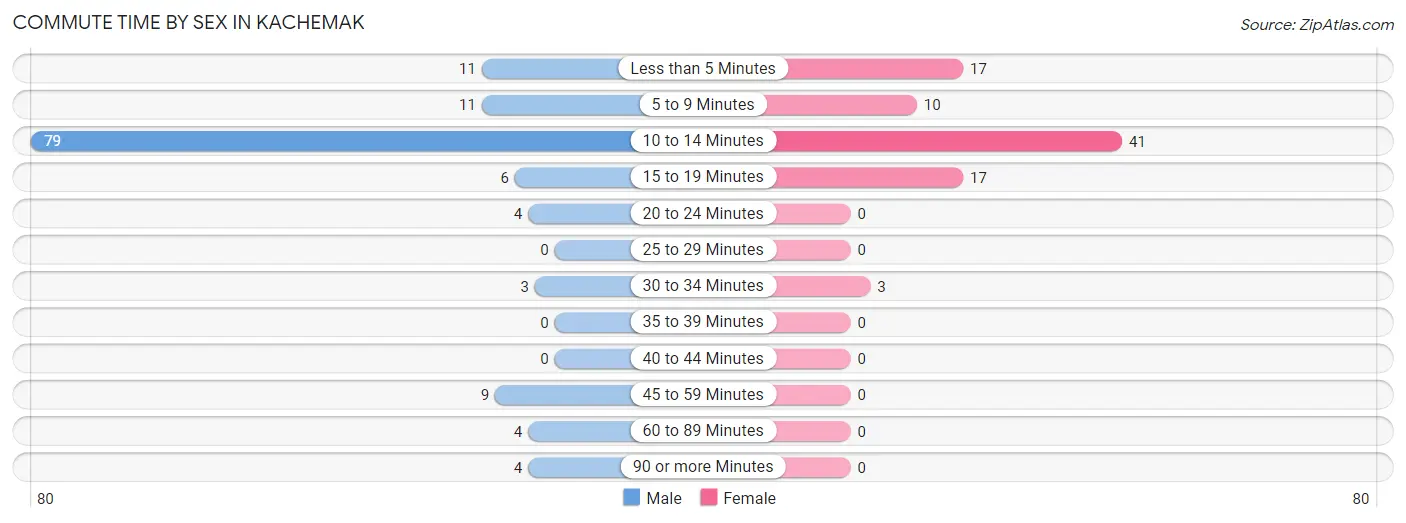
Commute Time by Sex in Kachemak
The most common commute times in Kachemak are 10 to 14 minutes (79 commuters, 60.3%) for males and 10 to 14 minutes (41 commuters, 46.6%) for females.
| Commute Time | Male | Female |
| Less than 5 Minutes | 11 (8.4%) | 17 (19.3%) |
| 5 to 9 Minutes | 11 (8.4%) | 10 (11.4%) |
| 10 to 14 Minutes | 79 (60.3%) | 41 (46.6%) |
| 15 to 19 Minutes | 6 (4.6%) | 17 (19.3%) |
| 20 to 24 Minutes | 4 (3.0%) | 0 (0.0%) |
| 25 to 29 Minutes | 0 (0.0%) | 0 (0.0%) |
| 30 to 34 Minutes | 3 (2.3%) | 3 (3.4%) |
| 35 to 39 Minutes | 0 (0.0%) | 0 (0.0%) |
| 40 to 44 Minutes | 0 (0.0%) | 0 (0.0%) |
| 45 to 59 Minutes | 9 (6.9%) | 0 (0.0%) |
| 60 to 89 Minutes | 4 (3.0%) | 0 (0.0%) |
| 90 or more Minutes | 4 (3.0%) | 0 (0.0%) |
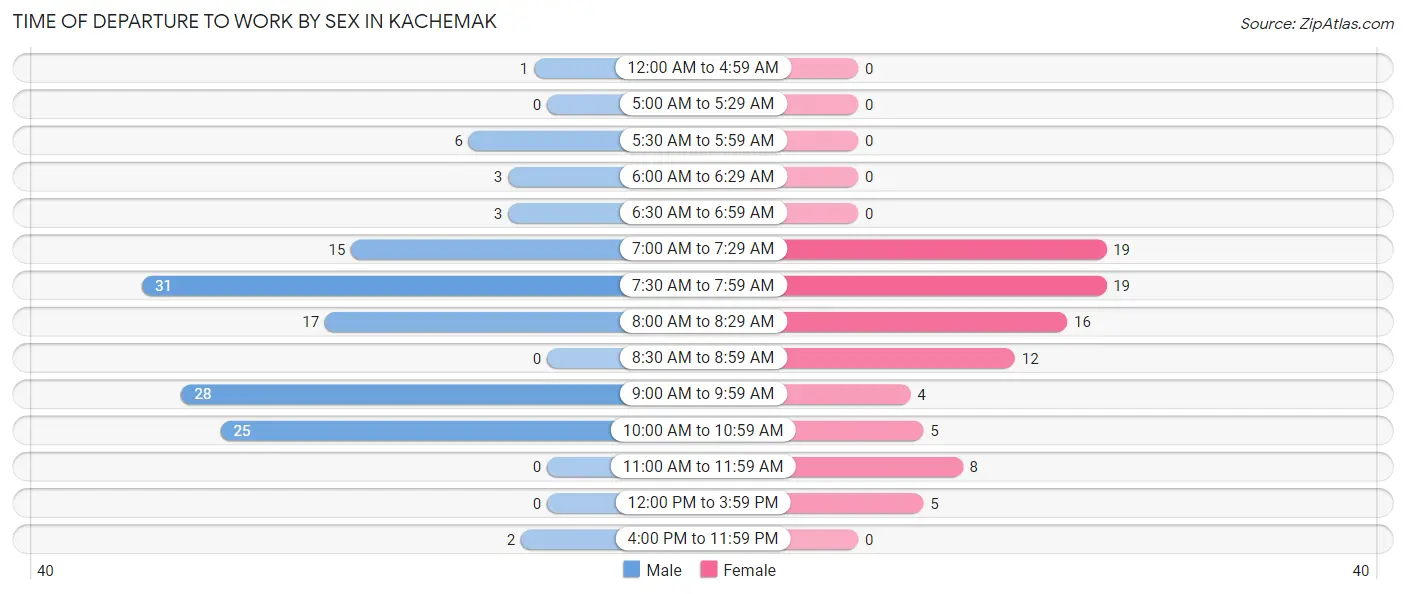
Time of Departure to Work by Sex in Kachemak
The most frequent times of departure to work in Kachemak are 7:30 AM to 7:59 AM (31, 23.7%) for males and 7:00 AM to 7:29 AM (19, 21.6%) for females.
| Time of Departure | Male | Female |
| 12:00 AM to 4:59 AM | 1 (0.8%) | 0 (0.0%) |
| 5:00 AM to 5:29 AM | 0 (0.0%) | 0 (0.0%) |
| 5:30 AM to 5:59 AM | 6 (4.6%) | 0 (0.0%) |
| 6:00 AM to 6:29 AM | 3 (2.3%) | 0 (0.0%) |
| 6:30 AM to 6:59 AM | 3 (2.3%) | 0 (0.0%) |
| 7:00 AM to 7:29 AM | 15 (11.5%) | 19 (21.6%) |
| 7:30 AM to 7:59 AM | 31 (23.7%) | 19 (21.6%) |
| 8:00 AM to 8:29 AM | 17 (13.0%) | 16 (18.2%) |
| 8:30 AM to 8:59 AM | 0 (0.0%) | 12 (13.6%) |
| 9:00 AM to 9:59 AM | 28 (21.4%) | 4 (4.5%) |
| 10:00 AM to 10:59 AM | 25 (19.1%) | 5 (5.7%) |
| 11:00 AM to 11:59 AM | 0 (0.0%) | 8 (9.1%) |
| 12:00 PM to 3:59 PM | 0 (0.0%) | 5 (5.7%) |
| 4:00 PM to 11:59 PM | 2 (1.5%) | 0 (0.0%) |
| Total | 131 (100.0%) | 88 (100.0%) |
Housing Occupancy in Kachemak
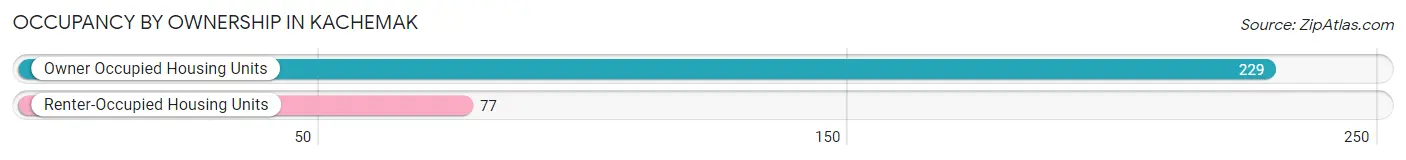
Occupancy by Ownership in Kachemak
Of the total 306 dwellings in Kachemak, owner-occupied units account for 229 (74.8%), while renter-occupied units make up 77 (25.2%).
| Occupancy | # Housing Units | % Housing Units |
| Owner Occupied Housing Units | 229 | 74.8% |
| Renter-Occupied Housing Units | 77 | 25.2% |
| Total Occupied Housing Units | 306 | 100.0% |
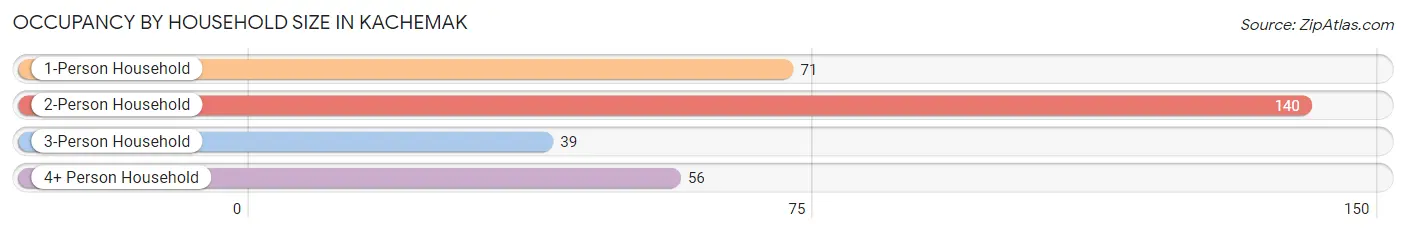
Occupancy by Household Size in Kachemak
| Household Size | # Housing Units | % Housing Units |
| 1-Person Household | 71 | 23.2% |
| 2-Person Household | 140 | 45.8% |
| 3-Person Household | 39 | 12.8% |
| 4+ Person Household | 56 | 18.3% |
| Total Housing Units | 306 | 100.0% |
Occupancy by Ownership by Household Size in Kachemak
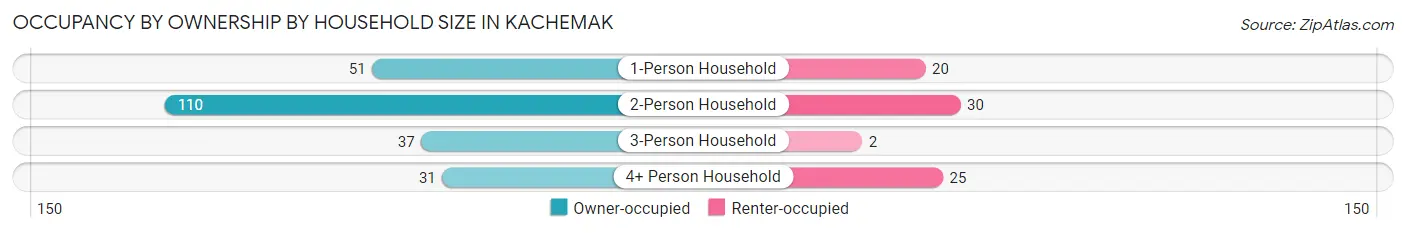
| Household Size | Owner-occupied | Renter-occupied |
| 1-Person Household | 51 (71.8%) | 20 (28.2%) |
| 2-Person Household | 110 (78.6%) | 30 (21.4%) |
| 3-Person Household | 37 (94.9%) | 2 (5.1%) |
| 4+ Person Household | 31 (55.4%) | 25 (44.6%) |
| Total Housing Units | 229 (74.8%) | 77 (25.2%) |
Occupancy by Educational Attainment in Kachemak
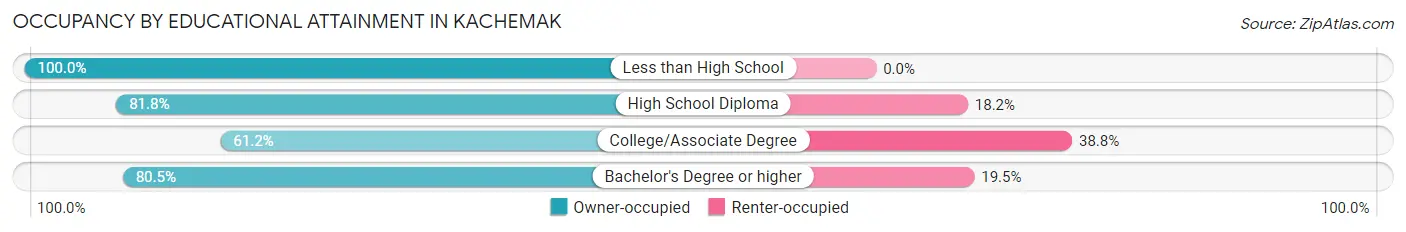
| Household Size | Owner-occupied | Renter-occupied |
| Less than High School | 10 (100.0%) | 0 (0.0%) |
| High School Diploma | 36 (81.8%) | 8 (18.2%) |
| College/Associate Degree | 63 (61.2%) | 40 (38.8%) |
| Bachelor's Degree or higher | 120 (80.5%) | 29 (19.5%) |
Occupancy by Age of Householder in Kachemak
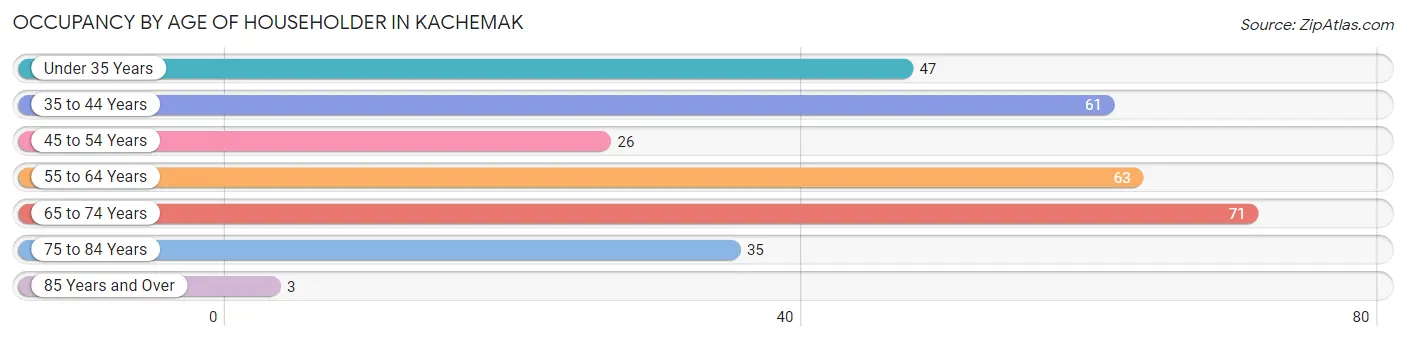
| Age Bracket | # Households | % Households |
| Under 35 Years | 47 | 15.4% |
| 35 to 44 Years | 61 | 19.9% |
| 45 to 54 Years | 26 | 8.5% |
| 55 to 64 Years | 63 | 20.6% |
| 65 to 74 Years | 71 | 23.2% |
| 75 to 84 Years | 35 | 11.4% |
| 85 Years and Over | 3 | 1.0% |
| Total | 306 | 100.0% |
Housing Finances in Kachemak
Median Income by Occupancy in Kachemak
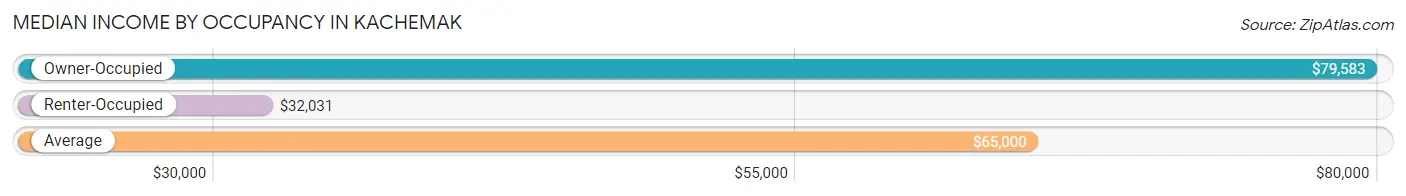
| Occupancy Type | # Households | Median Income |
| Owner-Occupied | 229 (74.8%) | $79,583 |
| Renter-Occupied | 77 (25.2%) | $32,031 |
| Average | 306 (100.0%) | $65,000 |
Occupancy by Householder Income Bracket in Kachemak
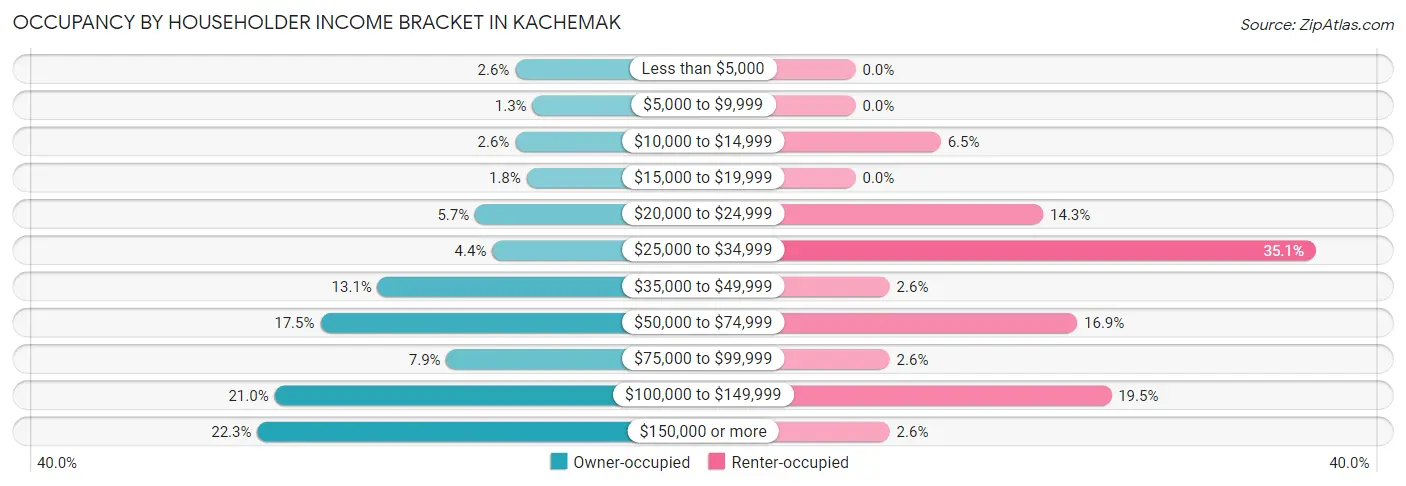
| Income Bracket | Owner-occupied | Renter-occupied |
| Less than $5,000 | 6 (2.6%) | 0 (0.0%) |
| $5,000 to $9,999 | 3 (1.3%) | 0 (0.0%) |
| $10,000 to $14,999 | 6 (2.6%) | 5 (6.5%) |
| $15,000 to $19,999 | 4 (1.8%) | 0 (0.0%) |
| $20,000 to $24,999 | 13 (5.7%) | 11 (14.3%) |
| $25,000 to $34,999 | 10 (4.4%) | 27 (35.1%) |
| $35,000 to $49,999 | 30 (13.1%) | 2 (2.6%) |
| $50,000 to $74,999 | 40 (17.5%) | 13 (16.9%) |
| $75,000 to $99,999 | 18 (7.9%) | 2 (2.6%) |
| $100,000 to $149,999 | 48 (21.0%) | 15 (19.5%) |
| $150,000 or more | 51 (22.3%) | 2 (2.6%) |
| Total | 229 (100.0%) | 77 (100.0%) |
Monthly Housing Cost Tiers in Kachemak
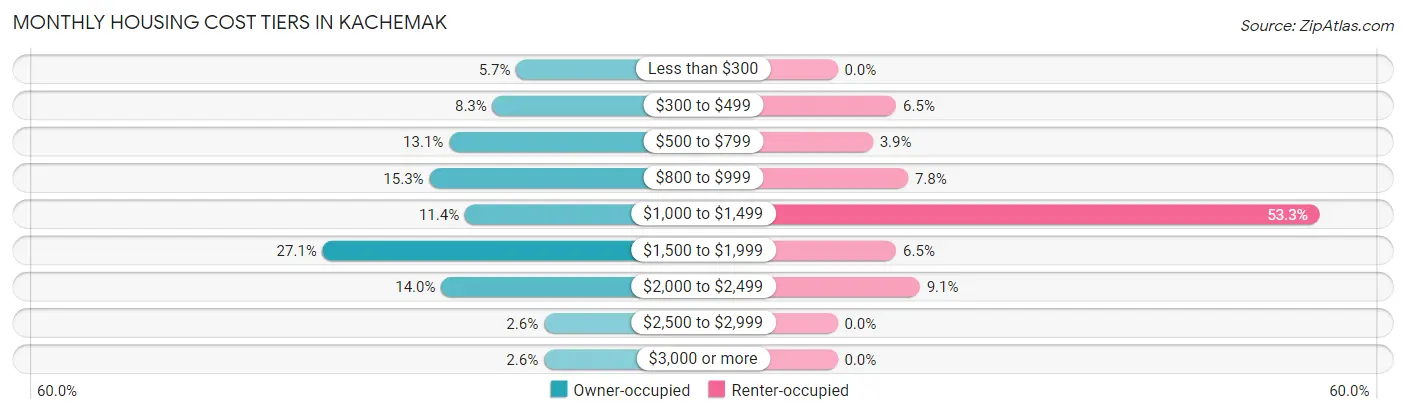
| Monthly Cost | Owner-occupied | Renter-occupied |
| Less than $300 | 13 (5.7%) | 0 (0.0%) |
| $300 to $499 | 19 (8.3%) | 5 (6.5%) |
| $500 to $799 | 30 (13.1%) | 3 (3.9%) |
| $800 to $999 | 35 (15.3%) | 6 (7.8%) |
| $1,000 to $1,499 | 26 (11.4%) | 41 (53.2%) |
| $1,500 to $1,999 | 62 (27.1%) | 5 (6.5%) |
| $2,000 to $2,499 | 32 (14.0%) | 7 (9.1%) |
| $2,500 to $2,999 | 6 (2.6%) | 0 (0.0%) |
| $3,000 or more | 6 (2.6%) | 0 (0.0%) |
| Total | 229 (100.0%) | 77 (100.0%) |
Physical Housing Characteristics in Kachemak
Housing Structures in Kachemak
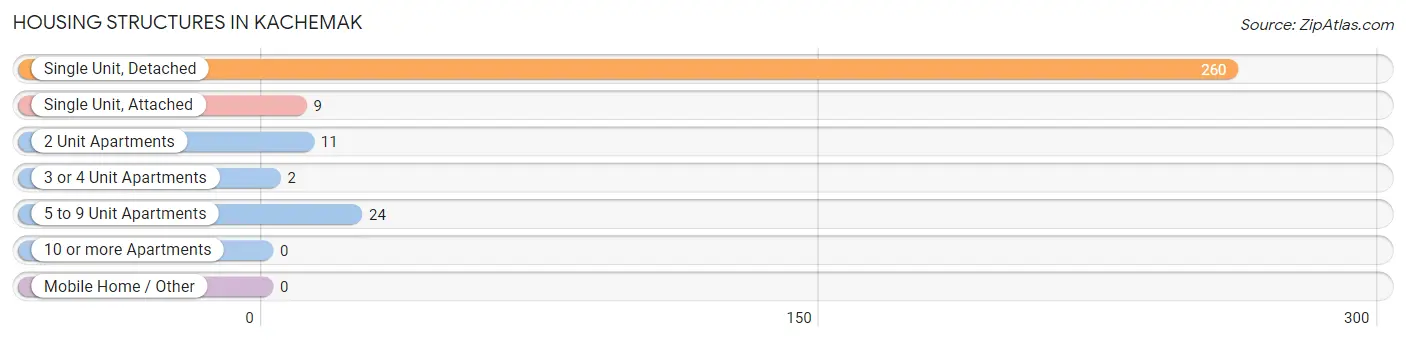
| Structure Type | # Housing Units | % Housing Units |
| Single Unit, Detached | 260 | 85.0% |
| Single Unit, Attached | 9 | 2.9% |
| 2 Unit Apartments | 11 | 3.6% |
| 3 or 4 Unit Apartments | 2 | 0.6% |
| 5 to 9 Unit Apartments | 24 | 7.8% |
| 10 or more Apartments | 0 | 0.0% |
| Mobile Home / Other | 0 | 0.0% |
| Total | 306 | 100.0% |
Housing Structures by Occupancy in Kachemak
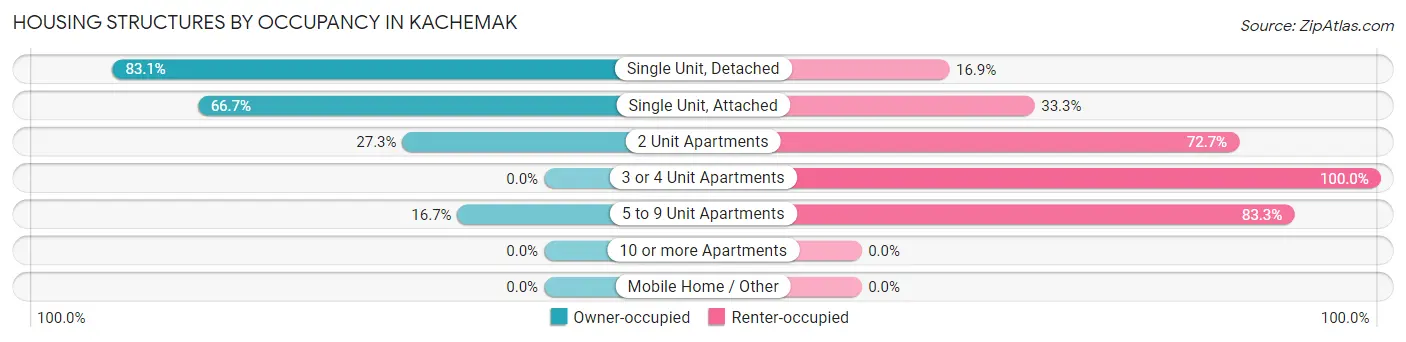
| Structure Type | Owner-occupied | Renter-occupied |
| Single Unit, Detached | 216 (83.1%) | 44 (16.9%) |
| Single Unit, Attached | 6 (66.7%) | 3 (33.3%) |
| 2 Unit Apartments | 3 (27.3%) | 8 (72.7%) |
| 3 or 4 Unit Apartments | 0 (0.0%) | 2 (100.0%) |
| 5 to 9 Unit Apartments | 4 (16.7%) | 20 (83.3%) |
| 10 or more Apartments | 0 (0.0%) | 0 (0.0%) |
| Mobile Home / Other | 0 (0.0%) | 0 (0.0%) |
| Total | 229 (74.8%) | 77 (25.2%) |
Housing Structures by Number of Rooms in Kachemak
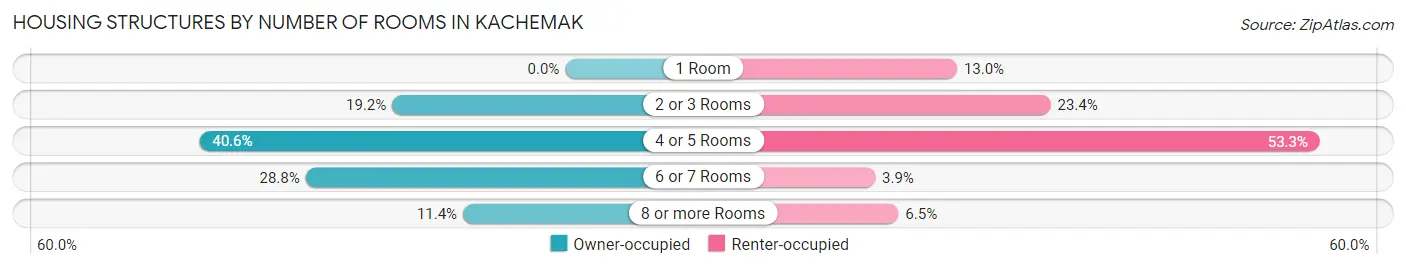
| Number of Rooms | Owner-occupied | Renter-occupied |
| 1 Room | 0 (0.0%) | 10 (13.0%) |
| 2 or 3 Rooms | 44 (19.2%) | 18 (23.4%) |
| 4 or 5 Rooms | 93 (40.6%) | 41 (53.2%) |
| 6 or 7 Rooms | 66 (28.8%) | 3 (3.9%) |
| 8 or more Rooms | 26 (11.4%) | 5 (6.5%) |
| Total | 229 (100.0%) | 77 (100.0%) |
Housing Structure by Heating Type in Kachemak
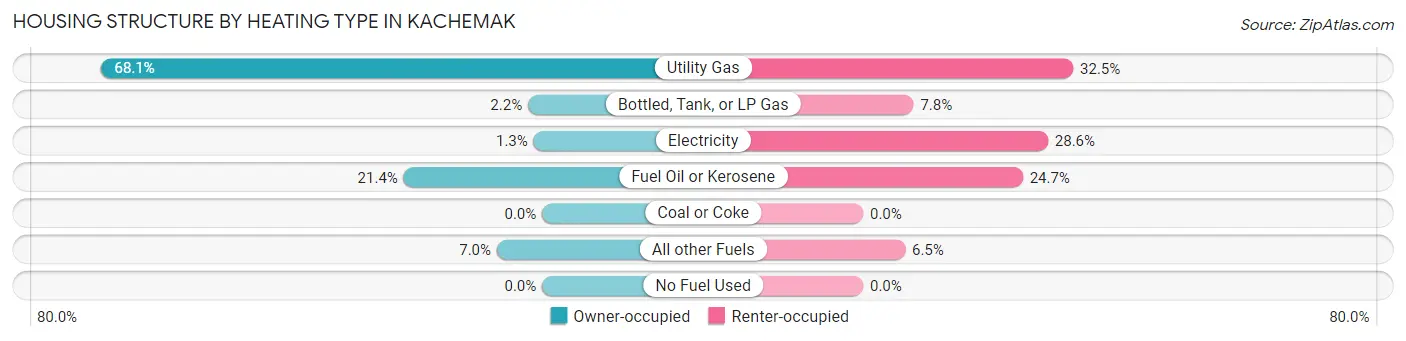
| Heating Type | Owner-occupied | Renter-occupied |
| Utility Gas | 156 (68.1%) | 25 (32.5%) |
| Bottled, Tank, or LP Gas | 5 (2.2%) | 6 (7.8%) |
| Electricity | 3 (1.3%) | 22 (28.6%) |
| Fuel Oil or Kerosene | 49 (21.4%) | 19 (24.7%) |
| Coal or Coke | 0 (0.0%) | 0 (0.0%) |
| All other Fuels | 16 (7.0%) | 5 (6.5%) |
| No Fuel Used | 0 (0.0%) | 0 (0.0%) |
| Total | 229 (100.0%) | 77 (100.0%) |
Household Vehicle Usage in Kachemak
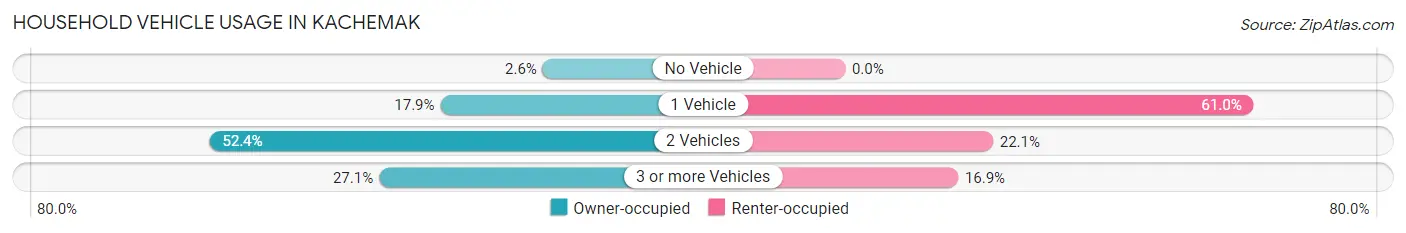
| Vehicles per Household | Owner-occupied | Renter-occupied |
| No Vehicle | 6 (2.6%) | 0 (0.0%) |
| 1 Vehicle | 41 (17.9%) | 47 (61.0%) |
| 2 Vehicles | 120 (52.4%) | 17 (22.1%) |
| 3 or more Vehicles | 62 (27.1%) | 13 (16.9%) |
| Total | 229 (100.0%) | 77 (100.0%) |
Real Estate & Mortgages in Kachemak
Real Estate and Mortgage Overview in Kachemak
| Characteristic | Without Mortgage | With Mortgage |
| Housing Units | 95 | 134 |
| Median Property Value | $341,100 | $377,400 |
| Median Household Income | $46,250 | $38 |
| Monthly Housing Costs | $628 | $6 |
| Real Estate Taxes | $1,924 | $13 |
Property Value by Mortgage Status in Kachemak
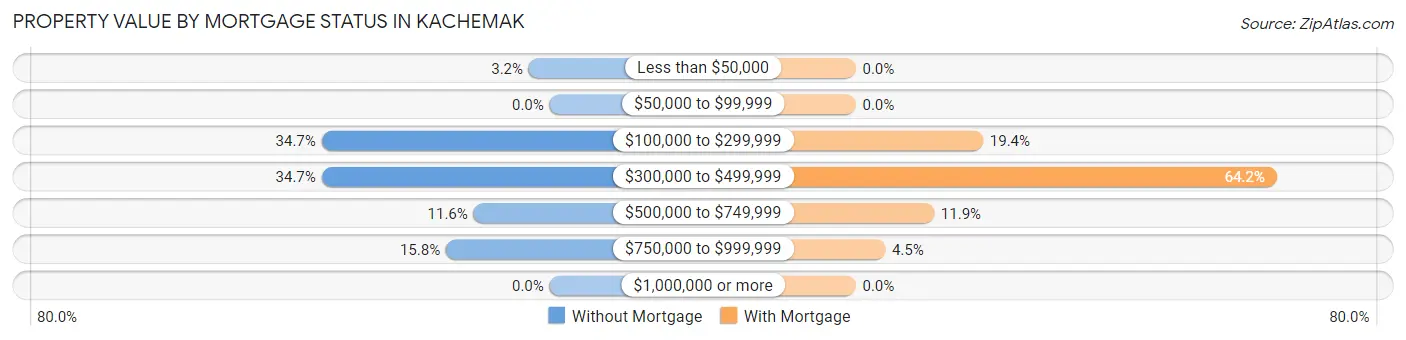
| Property Value | Without Mortgage | With Mortgage |
| Less than $50,000 | 3 (3.2%) | 0 (0.0%) |
| $50,000 to $99,999 | 0 (0.0%) | 0 (0.0%) |
| $100,000 to $299,999 | 33 (34.7%) | 26 (19.4%) |
| $300,000 to $499,999 | 33 (34.7%) | 86 (64.2%) |
| $500,000 to $749,999 | 11 (11.6%) | 16 (11.9%) |
| $750,000 to $999,999 | 15 (15.8%) | 6 (4.5%) |
| $1,000,000 or more | 0 (0.0%) | 0 (0.0%) |
| Total | 95 (100.0%) | 134 (100.0%) |
Household Income by Mortgage Status in Kachemak
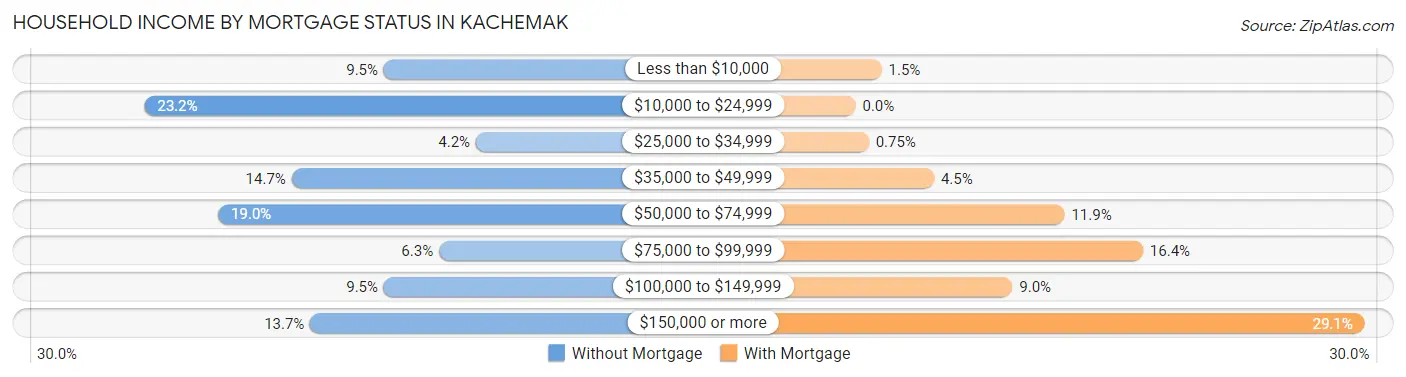
| Household Income | Without Mortgage | With Mortgage |
| Less than $10,000 | 9 (9.5%) | 2 (1.5%) |
| $10,000 to $24,999 | 22 (23.2%) | 0 (0.0%) |
| $25,000 to $34,999 | 4 (4.2%) | 1 (0.7%) |
| $35,000 to $49,999 | 14 (14.7%) | 6 (4.5%) |
| $50,000 to $74,999 | 18 (19.0%) | 16 (11.9%) |
| $75,000 to $99,999 | 6 (6.3%) | 22 (16.4%) |
| $100,000 to $149,999 | 9 (9.5%) | 12 (9.0%) |
| $150,000 or more | 13 (13.7%) | 39 (29.1%) |
| Total | 95 (100.0%) | 134 (100.0%) |
Property Value to Household Income Ratio in Kachemak
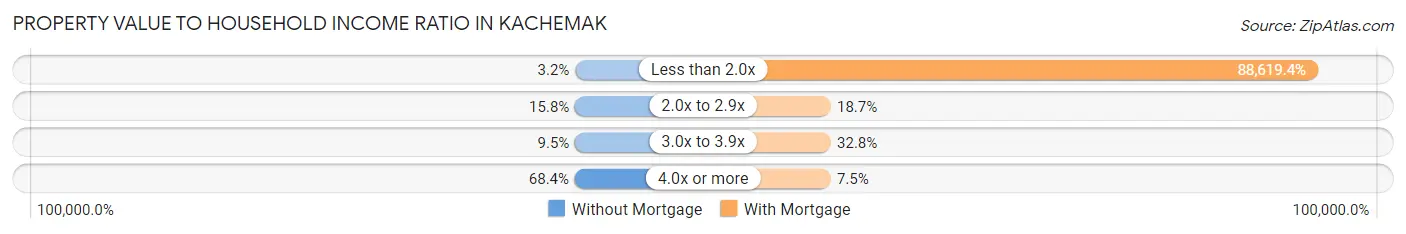
| Value-to-Income Ratio | Without Mortgage | With Mortgage |
| Less than 2.0x | 3 (3.2%) | 118,750 (88,619.4%) |
| 2.0x to 2.9x | 15 (15.8%) | 25 (18.7%) |
| 3.0x to 3.9x | 9 (9.5%) | 44 (32.8%) |
| 4.0x or more | 65 (68.4%) | 10 (7.5%) |
| Total | 95 (100.0%) | 134 (100.0%) |
Real Estate Taxes by Mortgage Status in Kachemak
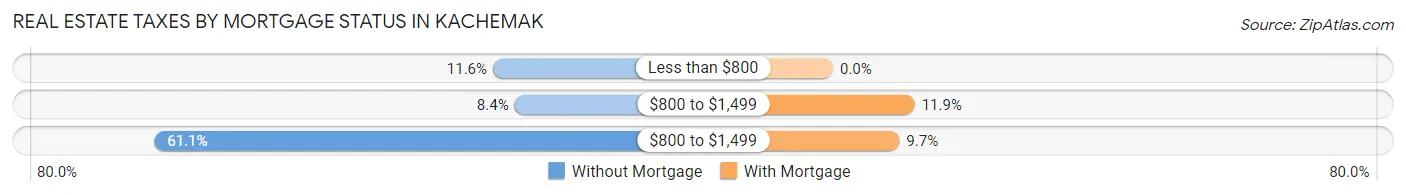
| Property Taxes | Without Mortgage | With Mortgage |
| Less than $800 | 11 (11.6%) | 0 (0.0%) |
| $800 to $1,499 | 8 (8.4%) | 16 (11.9%) |
| $800 to $1,499 | 58 (61.1%) | 13 (9.7%) |
| Total | 95 (100.0%) | 134 (100.0%) |
Health & Disability in Kachemak
Health Insurance Coverage by Age in Kachemak
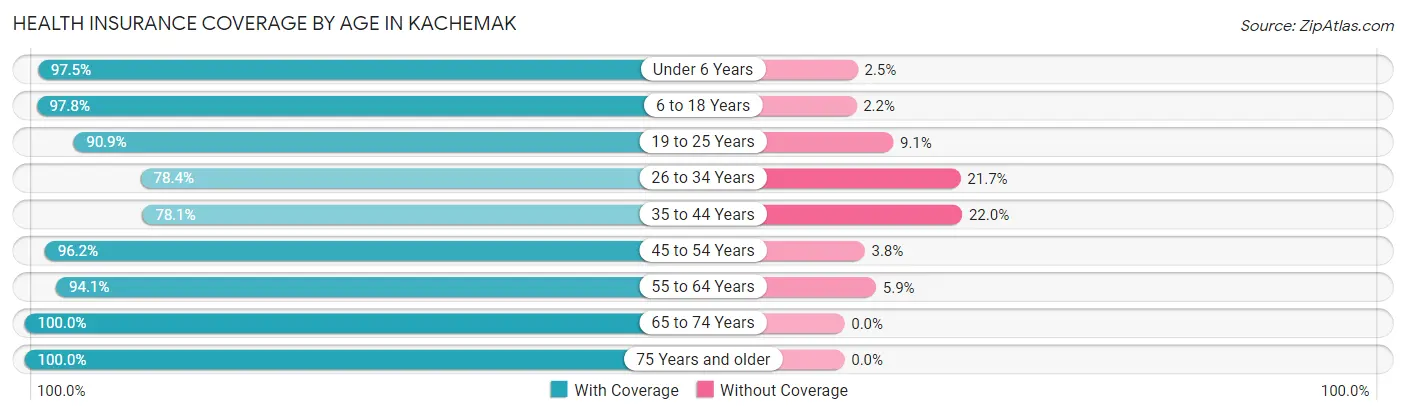
| Age Bracket | With Coverage | Without Coverage |
| Under 6 Years | 79 (97.5%) | 2 (2.5%) |
| 6 to 18 Years | 132 (97.8%) | 3 (2.2%) |
| 19 to 25 Years | 30 (90.9%) | 3 (9.1%) |
| 26 to 34 Years | 76 (78.3%) | 21 (21.6%) |
| 35 to 44 Years | 96 (78.0%) | 27 (22.0%) |
| 45 to 54 Years | 51 (96.2%) | 2 (3.8%) |
| 55 to 64 Years | 96 (94.1%) | 6 (5.9%) |
| 65 to 74 Years | 107 (100.0%) | 0 (0.0%) |
| 75 Years and older | 56 (100.0%) | 0 (0.0%) |
| Total | 723 (91.9%) | 64 (8.1%) |
Health Insurance Coverage by Citizenship Status in Kachemak
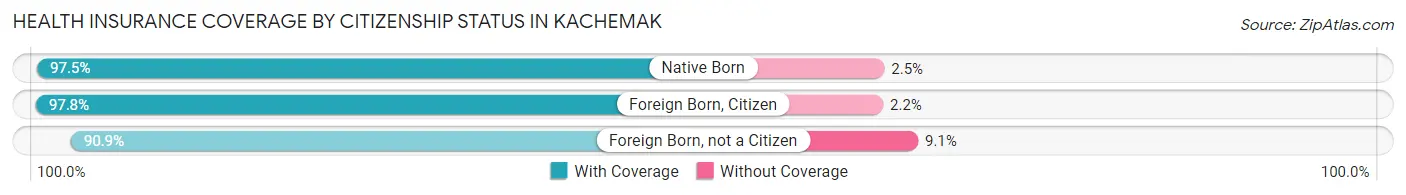
| Citizenship Status | With Coverage | Without Coverage |
| Native Born | 79 (97.5%) | 2 (2.5%) |
| Foreign Born, Citizen | 132 (97.8%) | 3 (2.2%) |
| Foreign Born, not a Citizen | 30 (90.9%) | 3 (9.1%) |
Health Insurance Coverage by Household Income in Kachemak
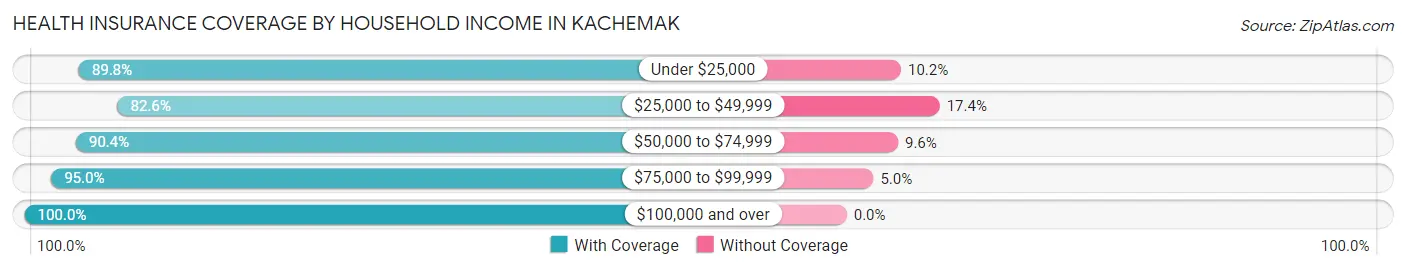
| Household Income | With Coverage | Without Coverage |
| Under $25,000 | 53 (89.8%) | 6 (10.2%) |
| $25,000 to $49,999 | 204 (82.6%) | 43 (17.4%) |
| $50,000 to $74,999 | 113 (90.4%) | 12 (9.6%) |
| $75,000 to $99,999 | 57 (95.0%) | 3 (5.0%) |
| $100,000 and over | 293 (100.0%) | 0 (0.0%) |
Public vs Private Health Insurance Coverage by Age in Kachemak
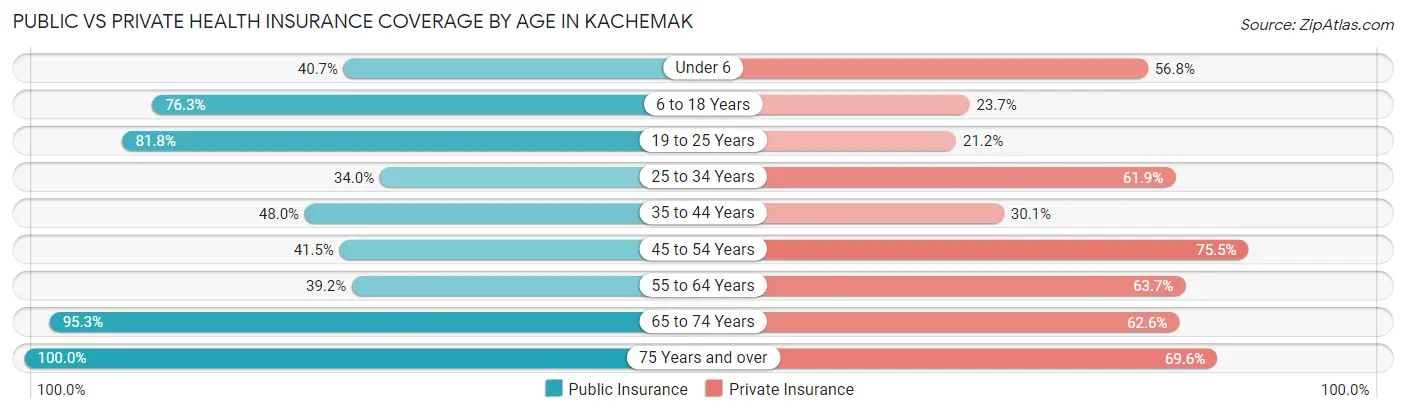
| Age Bracket | Public Insurance | Private Insurance |
| Under 6 | 33 (40.7%) | 46 (56.8%) |
| 6 to 18 Years | 103 (76.3%) | 32 (23.7%) |
| 19 to 25 Years | 27 (81.8%) | 7 (21.2%) |
| 25 to 34 Years | 33 (34.0%) | 60 (61.9%) |
| 35 to 44 Years | 59 (48.0%) | 37 (30.1%) |
| 45 to 54 Years | 22 (41.5%) | 40 (75.5%) |
| 55 to 64 Years | 40 (39.2%) | 65 (63.7%) |
| 65 to 74 Years | 102 (95.3%) | 67 (62.6%) |
| 75 Years and over | 56 (100.0%) | 39 (69.6%) |
| Total | 475 (60.4%) | 393 (49.9%) |
Disability Status by Sex by Age in Kachemak
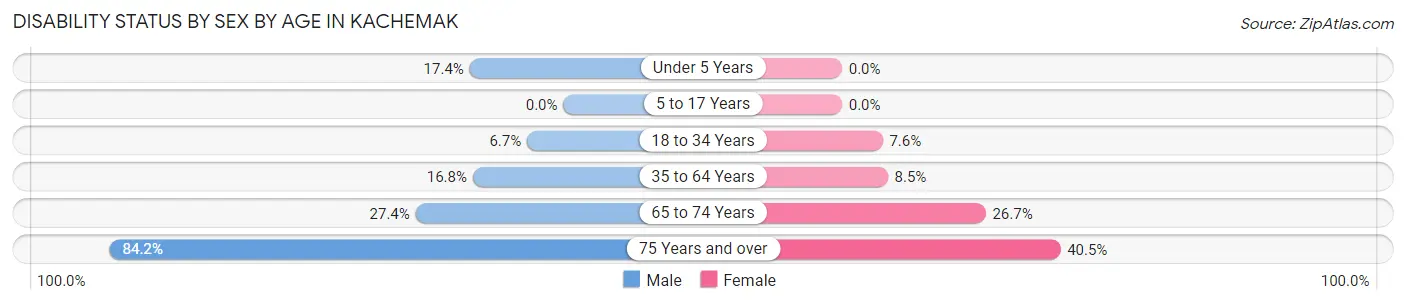
| Age Bracket | Male | Female |
| Under 5 Years | 4 (17.4%) | 0 (0.0%) |
| 5 to 17 Years | 0 (0.0%) | 0 (0.0%) |
| 18 to 34 Years | 6 (6.7%) | 4 (7.5%) |
| 35 to 64 Years | 21 (16.8%) | 13 (8.5%) |
| 65 to 74 Years | 17 (27.4%) | 12 (26.7%) |
| 75 Years and over | 16 (84.2%) | 15 (40.5%) |
Disability Class by Sex by Age in Kachemak
Disability Class: Hearing Difficulty
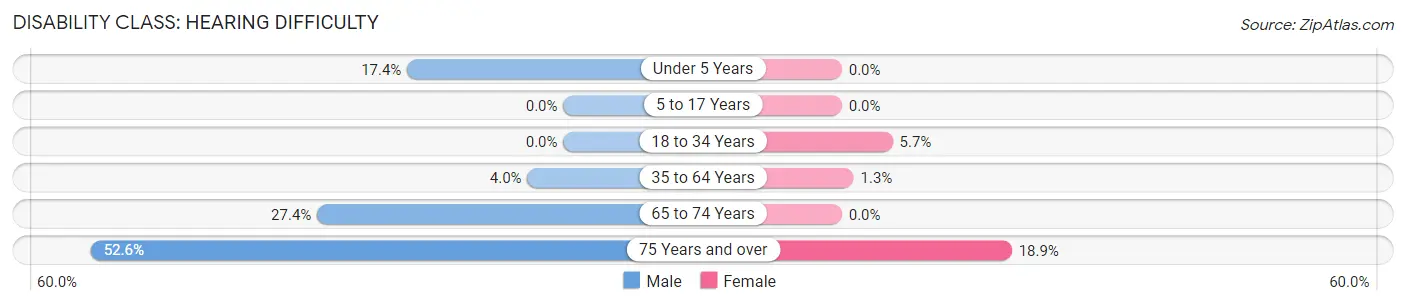
| Age Bracket | Male | Female |
| Under 5 Years | 4 (17.4%) | 0 (0.0%) |
| 5 to 17 Years | 0 (0.0%) | 0 (0.0%) |
| 18 to 34 Years | 0 (0.0%) | 3 (5.7%) |
| 35 to 64 Years | 5 (4.0%) | 2 (1.3%) |
| 65 to 74 Years | 17 (27.4%) | 0 (0.0%) |
| 75 Years and over | 10 (52.6%) | 7 (18.9%) |
Disability Class: Vision Difficulty
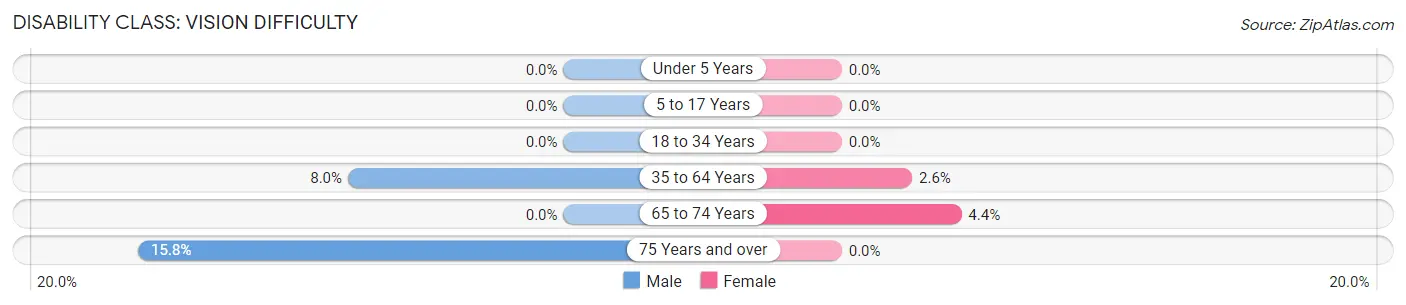
| Age Bracket | Male | Female |
| Under 5 Years | 0 (0.0%) | 0 (0.0%) |
| 5 to 17 Years | 0 (0.0%) | 0 (0.0%) |
| 18 to 34 Years | 0 (0.0%) | 0 (0.0%) |
| 35 to 64 Years | 10 (8.0%) | 4 (2.6%) |
| 65 to 74 Years | 0 (0.0%) | 2 (4.4%) |
| 75 Years and over | 3 (15.8%) | 0 (0.0%) |
Disability Class: Cognitive Difficulty
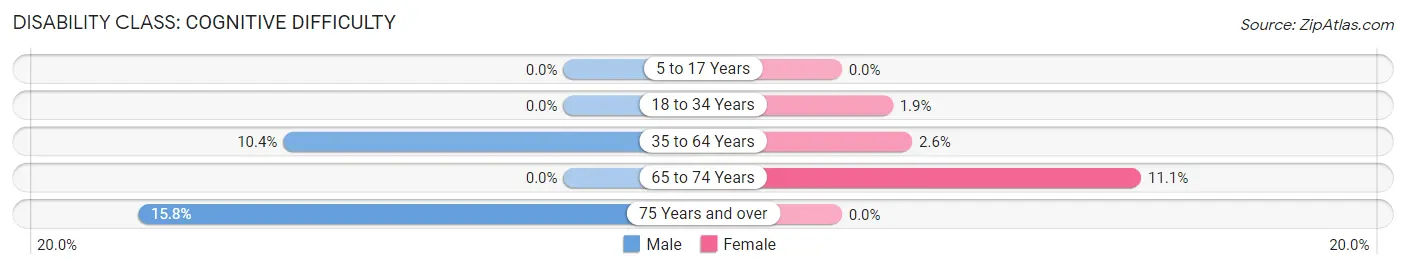
| Age Bracket | Male | Female |
| 5 to 17 Years | 0 (0.0%) | 0 (0.0%) |
| 18 to 34 Years | 0 (0.0%) | 1 (1.9%) |
| 35 to 64 Years | 13 (10.4%) | 4 (2.6%) |
| 65 to 74 Years | 0 (0.0%) | 5 (11.1%) |
| 75 Years and over | 3 (15.8%) | 0 (0.0%) |
Disability Class: Ambulatory Difficulty
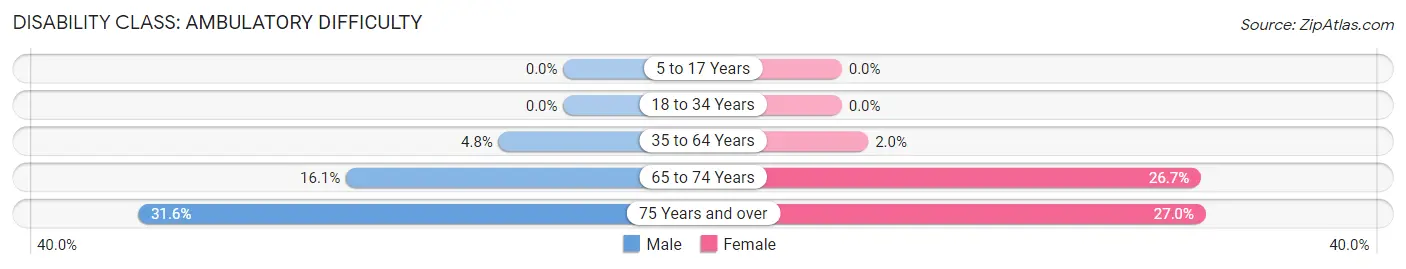
| Age Bracket | Male | Female |
| 5 to 17 Years | 0 (0.0%) | 0 (0.0%) |
| 18 to 34 Years | 0 (0.0%) | 0 (0.0%) |
| 35 to 64 Years | 6 (4.8%) | 3 (2.0%) |
| 65 to 74 Years | 10 (16.1%) | 12 (26.7%) |
| 75 Years and over | 6 (31.6%) | 10 (27.0%) |
Disability Class: Self-Care Difficulty
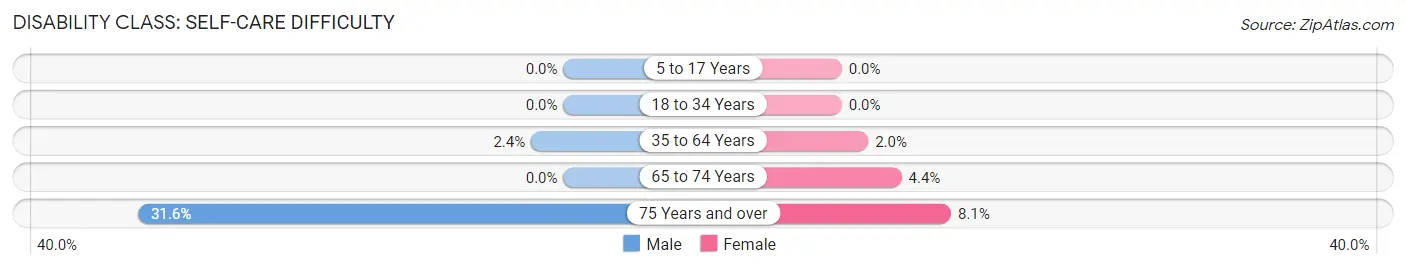
| Age Bracket | Male | Female |
| 5 to 17 Years | 0 (0.0%) | 0 (0.0%) |
| 18 to 34 Years | 0 (0.0%) | 0 (0.0%) |
| 35 to 64 Years | 3 (2.4%) | 3 (2.0%) |
| 65 to 74 Years | 0 (0.0%) | 2 (4.4%) |
| 75 Years and over | 6 (31.6%) | 3 (8.1%) |
Technology Access in Kachemak
Computing Device Access in Kachemak
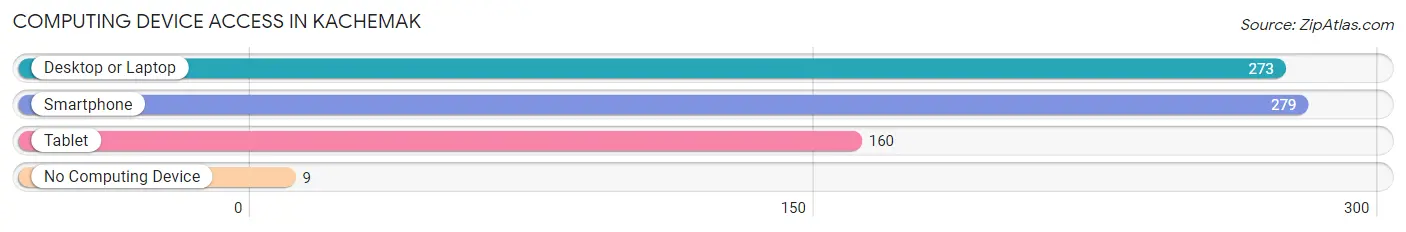
| Device Type | # Households | % Households |
| Desktop or Laptop | 273 | 89.2% |
| Smartphone | 279 | 91.2% |
| Tablet | 160 | 52.3% |
| No Computing Device | 9 | 2.9% |
| Total | 306 | 100.0% |
Internet Access in Kachemak
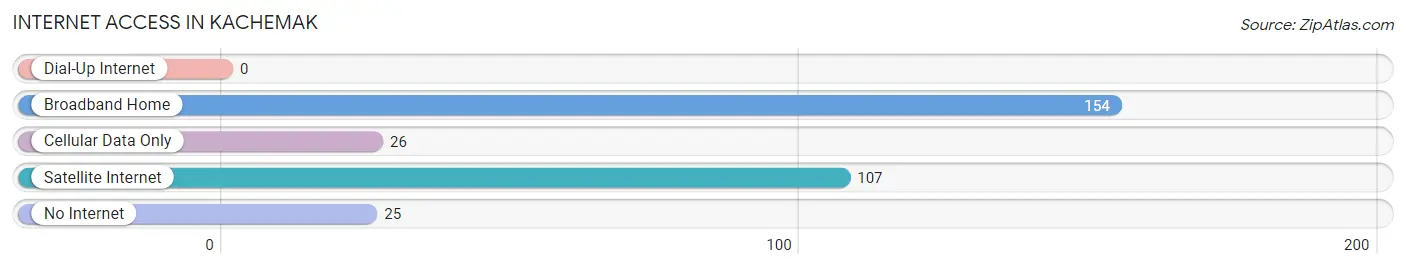
| Internet Type | # Households | % Households |
| Dial-Up Internet | 0 | 0.0% |
| Broadband Home | 154 | 50.3% |
| Cellular Data Only | 26 | 8.5% |
| Satellite Internet | 107 | 35.0% |
| No Internet | 25 | 8.2% |
| Total | 306 | 100.0% |
Kachemak Summary
Kachemak is a small city located in the Kenai Peninsula Borough of Alaska. It is situated on the western shore of Kachemak Bay, about 25 miles south of Homer. The city is home to about 1,000 people and is known for its stunning views of the bay and surrounding mountains.
History
Kachemak was first settled by the Dena’ina Athabascan people, who lived in the area for thousands of years. The first European settlers arrived in the late 19th century, and the town was officially incorporated in 1912. The city was named after the Kachemak Bay, which was named after the Dena’ina word for “big lake.”
In the early 20th century, Kachemak was a bustling fishing and logging town. The city was home to several canneries, which processed salmon and other fish caught in the bay. Logging was also an important industry, and the city was home to several sawmills.
In the 1950s, the city began to decline as the logging and fishing industries declined. The city’s population dropped from over 1,000 in 1950 to just over 500 in 1970. In the late 1970s, the city began to experience a resurgence as tourism and recreation began to take hold.
Geography
Kachemak is located on the western shore of Kachemak Bay, about 25 miles south of Homer. The city is surrounded by mountains, including the Kenai Mountains to the east and the Chugach Mountains to the west. The city is located in a temperate rainforest climate, with mild temperatures and abundant rainfall.
The city is home to several parks and recreational areas, including the Kachemak Bay State Park, which offers camping, hiking, and fishing. The city is also home to several beaches, including the popular Halibut Cove Beach.
Economy
Kachemak’s economy is largely based on tourism and recreation. The city is home to several hotels, restaurants, and other tourist-oriented businesses. The city is also home to several charter fishing companies, which offer guided fishing trips in the bay.
The city is also home to several small businesses, including a grocery store, a hardware store, and a few small shops. The city is also home to several art galleries, which feature the work of local artists.
Demographics
As of the 2010 census, Kachemak had a population of 1,011. The racial makeup of the city was 94.3% White, 0.7% Native American, 0.3% Asian, 0.2% Pacific Islander, 0.1% Black or African American, and 4.4% from other races. The median household income was $50,000, and the median age was 44.
Kachemak is a small city with a unique history and culture. The city is home to a diverse population and offers a variety of recreational activities and attractions. The city is also home to several small businesses, which provide employment opportunities for local residents.
Common Questions
What is Per Capita Income in Kachemak?
Per Capita income in Kachemak is $36,881.
What is the Median Family Income in Kachemak?
Median Family Income in Kachemak is $78,750.
What is the Median Household income in Kachemak?
Median Household Income in Kachemak is $65,000.
What is Income or Wage Gap in Kachemak?
Income or Wage Gap in Kachemak is 21.0%.
Women in Kachemak earn 79.0 cents for every dollar earned by a man.
What is Family Income Deficit in Kachemak?
Family Income Deficit in Kachemak is $6,234.
Families that are below poverty line in Kachemak earn $6,234 less on average than the poverty threshold level.
What is Inequality or Gini Index in Kachemak?
Inequality or Gini Index in Kachemak is 0.46.
What is the Total Population of Kachemak?
Total Population of Kachemak is 787.
What is the Total Male Population of Kachemak?
Total Male Population of Kachemak is 375.
What is the Total Female Population of Kachemak?
Total Female Population of Kachemak is 412.
What is the Ratio of Males per 100 Females in Kachemak?
There are 91.02 Males per 100 Females in Kachemak.
What is the Ratio of Females per 100 Males in Kachemak?
There are 109.87 Females per 100 Males in Kachemak.
What is the Median Population Age in Kachemak?
Median Population Age in Kachemak is 36.9 Years.
What is the Average Family Size in Kachemak
Average Family Size in Kachemak is 2.9 People.
What is the Average Household Size in Kachemak
Average Household Size in Kachemak is 2.6 People.
How Large is the Labor Force in Kachemak?
There are 335 People in the Labor Forcein in Kachemak.
What is the Percentage of People in the Labor Force in Kachemak?
55.8% of People are in the Labor Force in Kachemak.
What is the Unemployment Rate in Kachemak?
Unemployment Rate in Kachemak is 7.5%.