Atqasuk, AK Map & Demographics
Atqasuk Map
Atqasuk Overview
$23,804
PER CAPITA INCOME
$52,083
AVG FAMILY INCOME
$99,750
AVG HOUSEHOLD INCOME
60.6%
WAGE / INCOME GAP [ % ]
39.4¢/ $1
WAGE / INCOME GAP [ $ ]
0.30
INEQUALITY / GINI INDEX
119
TOTAL POPULATION
63
MALE POPULATION
56
FEMALE POPULATION
112.50
MALES / 100 FEMALES
88.89
FEMALES / 100 MALES
23.6
MEDIAN AGE
3.1
AVG FAMILY SIZE
3.6
AVG HOUSEHOLD SIZE
50
LABOR FORCE [ PEOPLE ]
61.7%
PERCENT IN LABOR FORCE
8.0%
UNEMPLOYMENT RATE
Atqasuk Zip Codes
Atqasuk Area Codes
Income in Atqasuk
Income Overview in Atqasuk
Per Capita Income in Atqasuk is $23,804, while median incomes of families and households are $52,083 and $99,750 respectively.
| Characteristic | Number | Measure |
| Per Capita Income | 119 | $23,804 |
| Median Family Income | 33 | $52,083 |
| Mean Family Income | 33 | $63,876 |
| Median Household Income | 33 | $99,750 |
| Mean Household Income | 33 | $97,409 |
| Income Deficit | 33 | $0 |
| Wage / Income Gap (%) | 119 | 60.61% |
| Wage / Income Gap ($) | 119 | 39.39¢ per $1 |
| Gini / Inequality Index | 119 | 0.30 |
Earnings by Sex in Atqasuk
Average Earnings in Atqasuk are $23,750, $41,250 for men and $16,250 for women, a difference of 60.6%.
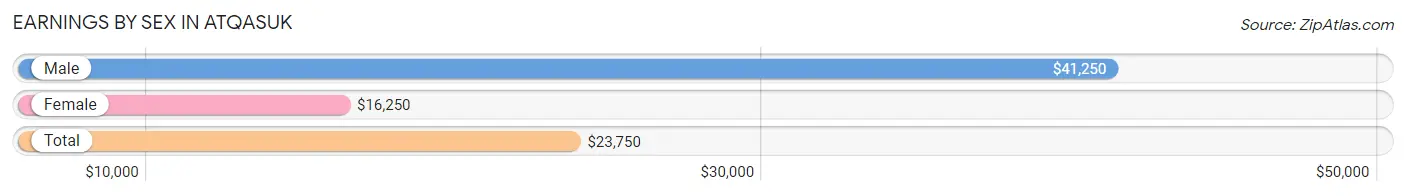
| Sex | Number | Average Earnings |
| Male | 34 (53.1%) | $41,250 |
| Female | 30 (46.9%) | $16,250 |
| Total | 64 (100.0%) | $23,750 |
Earnings by Sex by Income Bracket in Atqasuk
The most common earnings brackets in Atqasuk are $55,000 to $64,999 for men (7 | 20.6%) and $5,000 to $7,499 for women (8 | 26.7%).
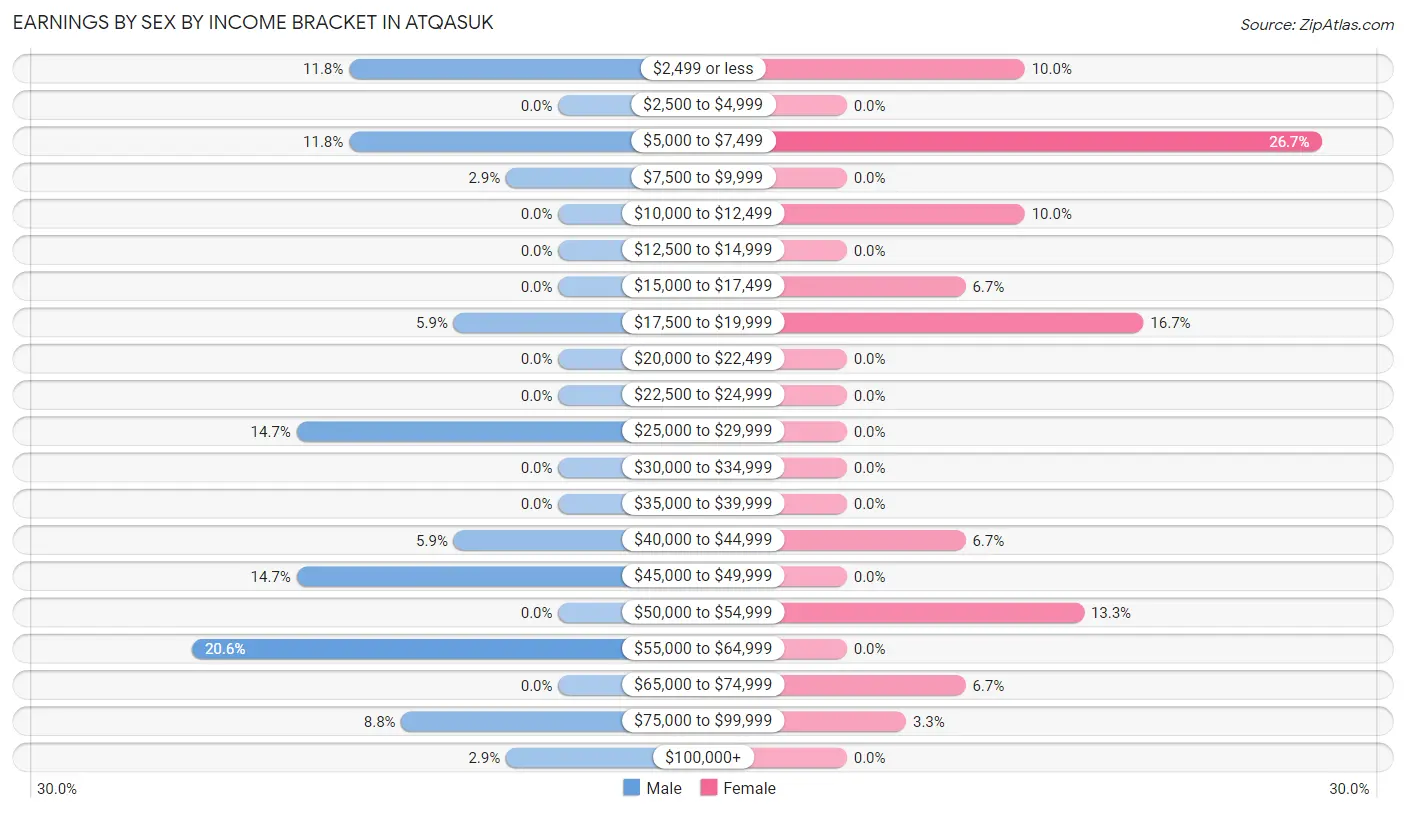
| Income | Male | Female |
| $2,499 or less | 4 (11.8%) | 3 (10.0%) |
| $2,500 to $4,999 | 0 (0.0%) | 0 (0.0%) |
| $5,000 to $7,499 | 4 (11.8%) | 8 (26.7%) |
| $7,500 to $9,999 | 1 (2.9%) | 0 (0.0%) |
| $10,000 to $12,499 | 0 (0.0%) | 3 (10.0%) |
| $12,500 to $14,999 | 0 (0.0%) | 0 (0.0%) |
| $15,000 to $17,499 | 0 (0.0%) | 2 (6.7%) |
| $17,500 to $19,999 | 2 (5.9%) | 5 (16.7%) |
| $20,000 to $22,499 | 0 (0.0%) | 0 (0.0%) |
| $22,500 to $24,999 | 0 (0.0%) | 0 (0.0%) |
| $25,000 to $29,999 | 5 (14.7%) | 0 (0.0%) |
| $30,000 to $34,999 | 0 (0.0%) | 0 (0.0%) |
| $35,000 to $39,999 | 0 (0.0%) | 0 (0.0%) |
| $40,000 to $44,999 | 2 (5.9%) | 2 (6.7%) |
| $45,000 to $49,999 | 5 (14.7%) | 0 (0.0%) |
| $50,000 to $54,999 | 0 (0.0%) | 4 (13.3%) |
| $55,000 to $64,999 | 7 (20.6%) | 0 (0.0%) |
| $65,000 to $74,999 | 0 (0.0%) | 2 (6.7%) |
| $75,000 to $99,999 | 3 (8.8%) | 1 (3.3%) |
| $100,000+ | 1 (2.9%) | 0 (0.0%) |
| Total | 34 (100.0%) | 30 (100.0%) |
Earnings by Sex by Educational Attainment in Atqasuk
| Educational Attainment | Male Income | Female Income |
| Less than High School | - | - |
| High School Diploma | - | - |
| College or Associate's Degree | - | - |
| Bachelor's Degree | - | - |
| Graduate Degree | - | - |
| Total | $58,750 | $0 |
Family Income in Atqasuk
Family Income Brackets in Atqasuk
According to the Atqasuk family income data, there are 8 families falling into the $75,000 to $99,999 income range, which is the most common income bracket and makes up 24.2% of all families.
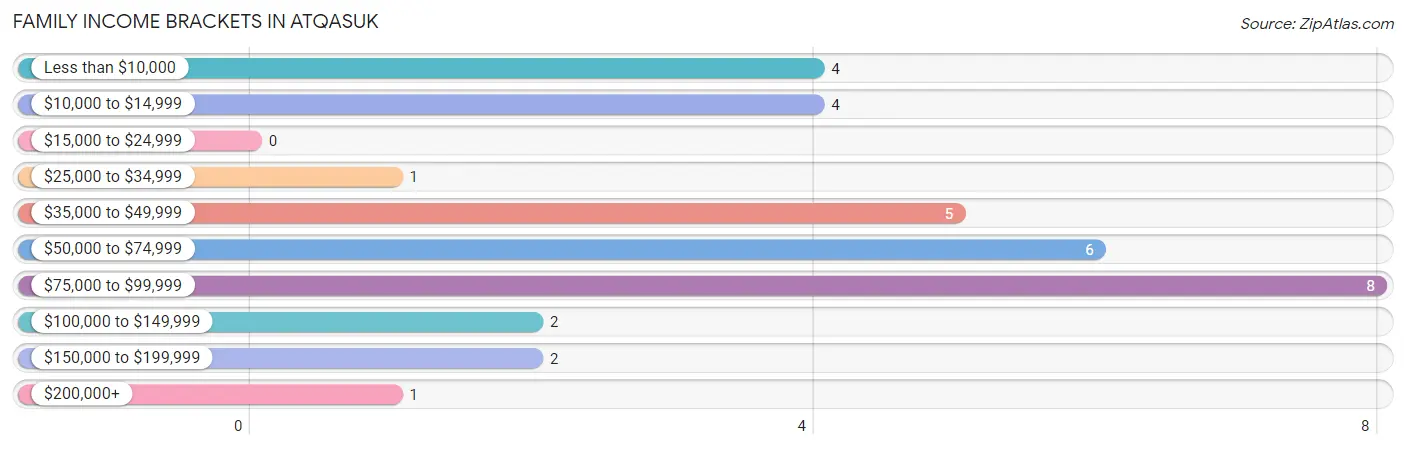
| Income Bracket | # Families | % Families |
| Less than $10,000 | 4 | 12.1% |
| $10,000 to $14,999 | 4 | 12.1% |
| $15,000 to $24,999 | 0 | 0.0% |
| $25,000 to $34,999 | 1 | 3.0% |
| $35,000 to $49,999 | 5 | 15.2% |
| $50,000 to $74,999 | 6 | 18.2% |
| $75,000 to $99,999 | 8 | 24.2% |
| $100,000 to $149,999 | 2 | 6.1% |
| $150,000 to $199,999 | 2 | 6.1% |
| $200,000+ | 1 | 3.0% |
Family Income by Famaliy Size in Atqasuk
6-person families (7 | 21.2%) account for the highest median family income in Atqasuk with $123,125 per family, while 6-person families (7 | 21.2%) have the highest median income of $20,521 per family member.
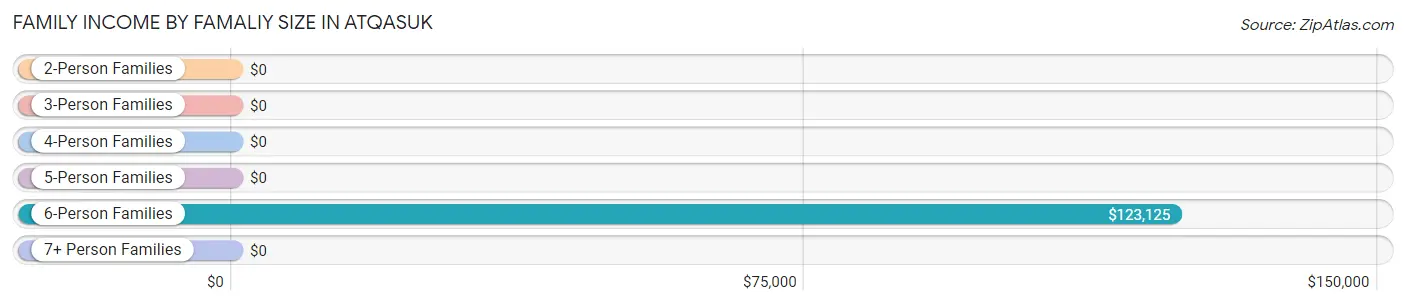
| Income Bracket | # Families | Median Income |
| 2-Person Families | 12 (36.4%) | $0 |
| 3-Person Families | 5 (15.1%) | $0 |
| 4-Person Families | 8 (24.2%) | $0 |
| 5-Person Families | 1 (3.0%) | $0 |
| 6-Person Families | 7 (21.2%) | $123,125 |
| 7+ Person Families | 0 (0.0%) | $0 |
| Total | 33 (100.0%) | $52,083 |
Family Income by Number of Earners in Atqasuk
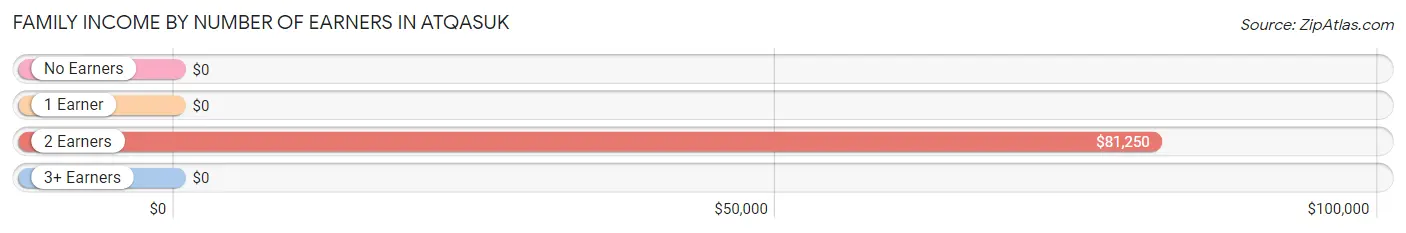
| Number of Earners | # Families | Median Income |
| No Earners | 3 (9.1%) | $0 |
| 1 Earner | 19 (57.6%) | $0 |
| 2 Earners | 7 (21.2%) | $81,250 |
| 3+ Earners | 4 (12.1%) | $0 |
| Total | 33 (100.0%) | $52,083 |
Household Income in Atqasuk
Household Income Brackets in Atqasuk
With 10 households falling in the category, the $100,000 to $149,999 income range is the most frequent in Atqasuk, accounting for 30.3% of all households.
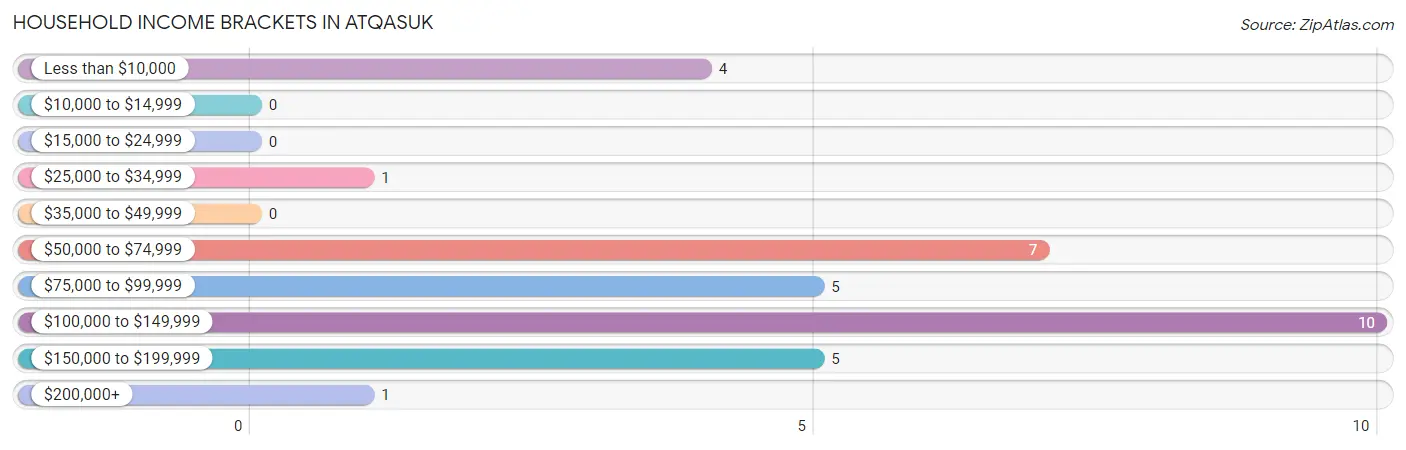
| Income Bracket | # Households | % Households |
| Less than $10,000 | 4 | 12.1% |
| $10,000 to $14,999 | 0 | 0.0% |
| $15,000 to $24,999 | 0 | 0.0% |
| $25,000 to $34,999 | 1 | 3.0% |
| $35,000 to $49,999 | 0 | 0.0% |
| $50,000 to $74,999 | 7 | 21.2% |
| $75,000 to $99,999 | 5 | 15.2% |
| $100,000 to $149,999 | 10 | 30.3% |
| $150,000 to $199,999 | 5 | 15.2% |
| $200,000+ | 1 | 3.0% |
Household Income by Householder Age in Atqasuk
The median household income in Atqasuk is $99,750, with the highest median household income of $152,917 found in the 45 to 64 years age bracket for the primary householder. A total of 7 households (21.2%) fall into this category. Meanwhile, the 25 to 44 years age bracket for the primary householder has the lowest median household income of $0, with 4 households (12.1%) in this group.
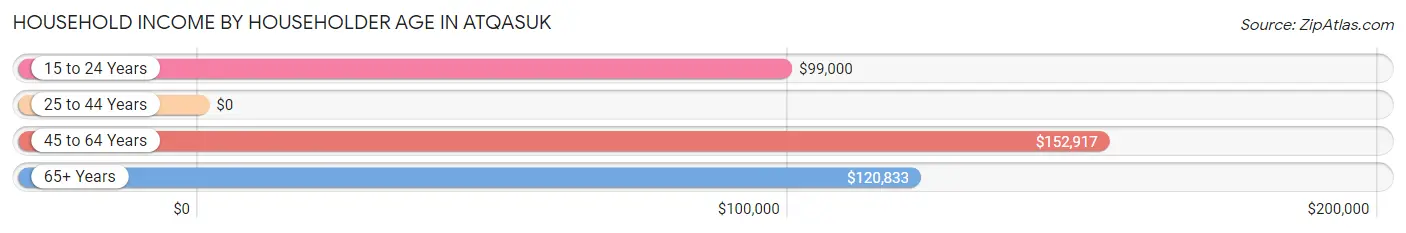
| Income Bracket | # Households | Median Income |
| 15 to 24 Years | 14 (42.4%) | $99,000 |
| 25 to 44 Years | 4 (12.1%) | $0 |
| 45 to 64 Years | 7 (21.2%) | $152,917 |
| 65+ Years | 8 (24.2%) | $120,833 |
| Total | 33 (100.0%) | $99,750 |
Poverty in Atqasuk
Income Below Poverty by Sex and Age in Atqasuk
With 20.6% poverty level for males and 14.3% for females among the residents of Atqasuk, 25 to 34 year old males and 5 year old females are the most vulnerable to poverty, with 6 males (60.0%) and 4 females (100.0%) in their respective age groups living below the poverty level.
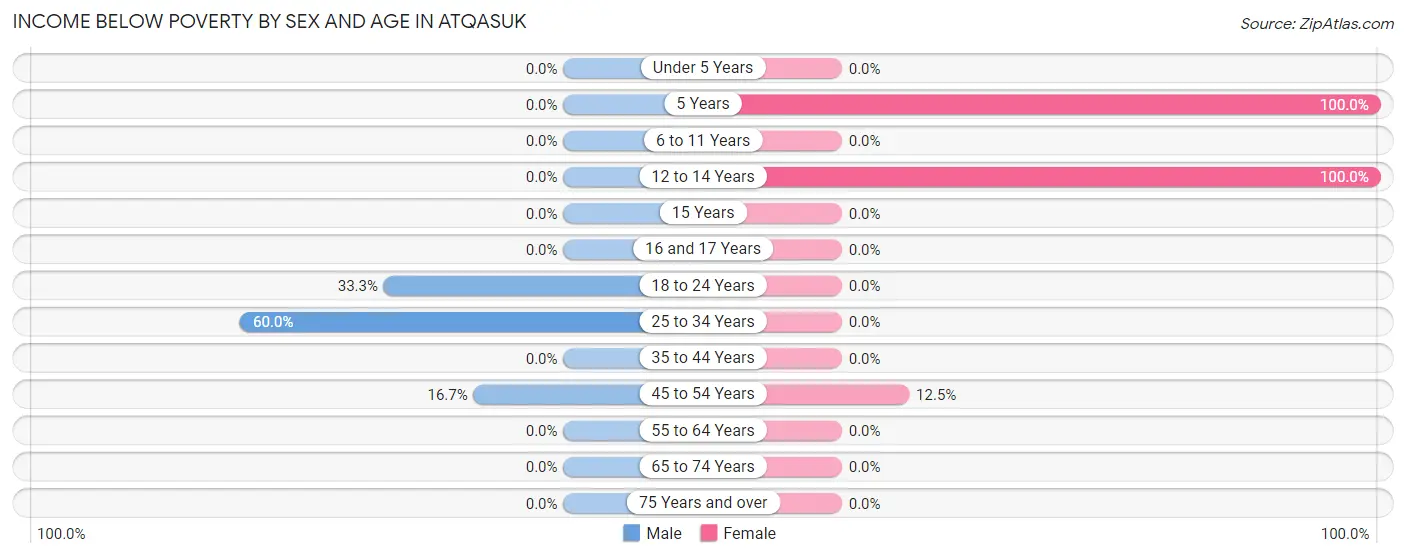
| Age Bracket | Male | Female |
| Under 5 Years | 0 (0.0%) | 0 (0.0%) |
| 5 Years | 0 (0.0%) | 4 (100.0%) |
| 6 to 11 Years | 0 (0.0%) | 0 (0.0%) |
| 12 to 14 Years | 0 (0.0%) | 3 (100.0%) |
| 15 Years | 0 (0.0%) | 0 (0.0%) |
| 16 and 17 Years | 0 (0.0%) | 0 (0.0%) |
| 18 to 24 Years | 6 (33.3%) | 0 (0.0%) |
| 25 to 34 Years | 6 (60.0%) | 0 (0.0%) |
| 35 to 44 Years | 0 (0.0%) | 0 (0.0%) |
| 45 to 54 Years | 1 (16.7%) | 1 (12.5%) |
| 55 to 64 Years | 0 (0.0%) | 0 (0.0%) |
| 65 to 74 Years | 0 (0.0%) | 0 (0.0%) |
| 75 Years and over | 0 (0.0%) | 0 (0.0%) |
| Total | 13 (20.6%) | 8 (14.3%) |
Income Above Poverty by Sex and Age in Atqasuk
According to the poverty statistics in Atqasuk, males aged under 5 years and females aged under 5 years are the age groups that are most secure financially, with 100.0% of males and 100.0% of females in these age groups living above the poverty line.
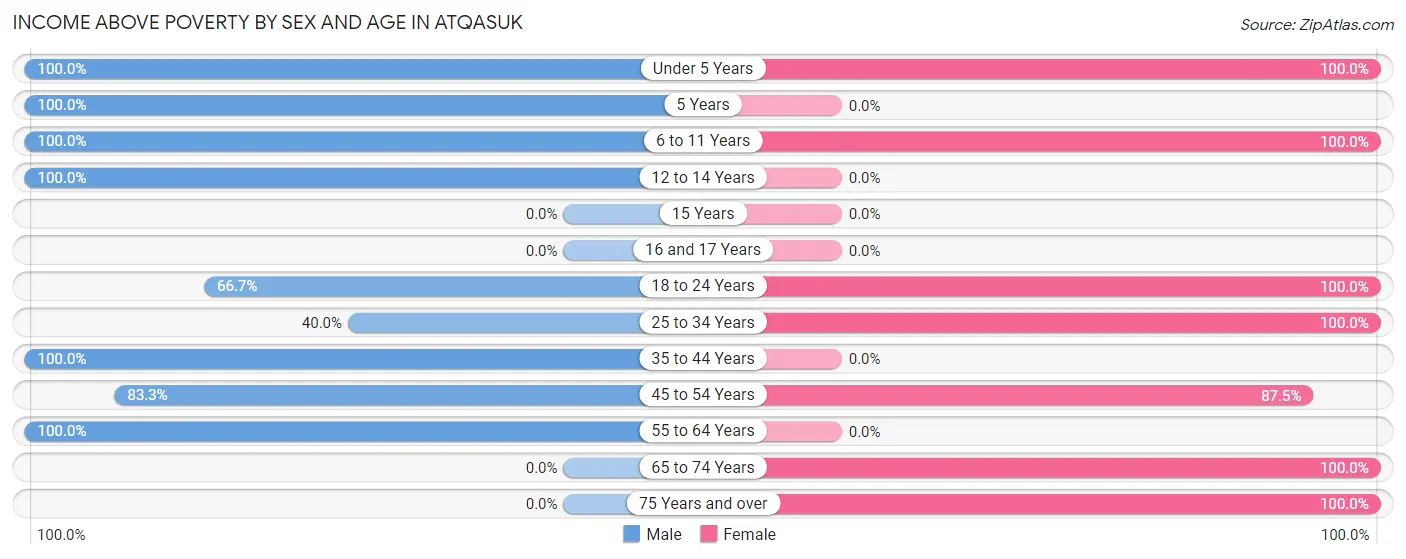
| Age Bracket | Male | Female |
| Under 5 Years | 8 (100.0%) | 4 (100.0%) |
| 5 Years | 2 (100.0%) | 0 (0.0%) |
| 6 to 11 Years | 10 (100.0%) | 4 (100.0%) |
| 12 to 14 Years | 3 (100.0%) | 0 (0.0%) |
| 15 Years | 0 (0.0%) | 0 (0.0%) |
| 16 and 17 Years | 0 (0.0%) | 0 (0.0%) |
| 18 to 24 Years | 12 (66.7%) | 12 (100.0%) |
| 25 to 34 Years | 4 (40.0%) | 13 (100.0%) |
| 35 to 44 Years | 3 (100.0%) | 0 (0.0%) |
| 45 to 54 Years | 5 (83.3%) | 7 (87.5%) |
| 55 to 64 Years | 3 (100.0%) | 0 (0.0%) |
| 65 to 74 Years | 0 (0.0%) | 2 (100.0%) |
| 75 Years and over | 0 (0.0%) | 6 (100.0%) |
| Total | 50 (79.4%) | 48 (85.7%) |
Income Below Poverty Among Married-Couple Families in Atqasuk
The poverty statistics for married-couple families in Atqasuk show that 25.0% or 1 of the total 4 families live below the poverty line. Families with 1 or 2 children have the highest poverty rate of 33.3%, comprising of 1 families. On the other hand, families with no children have the lowest poverty rate of 0.0%, which includes 0 families.
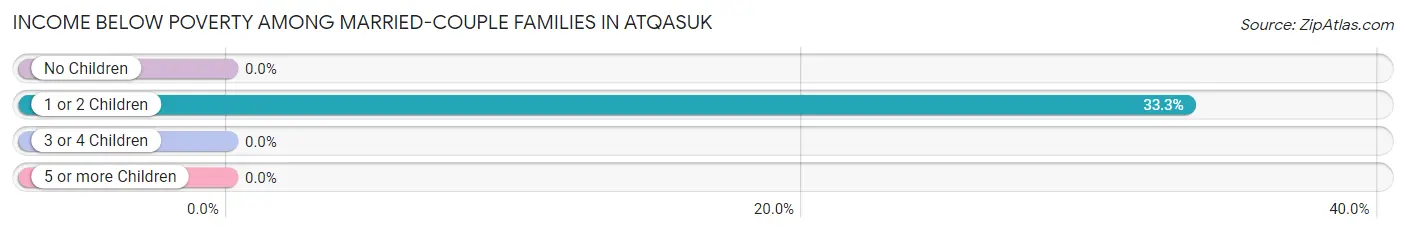
| Children | Above Poverty | Below Poverty |
| No Children | 1 (100.0%) | 0 (0.0%) |
| 1 or 2 Children | 2 (66.7%) | 1 (33.3%) |
| 3 or 4 Children | 0 (0.0%) | 0 (0.0%) |
| 5 or more Children | 0 (0.0%) | 0 (0.0%) |
| Total | 3 (75.0%) | 1 (25.0%) |
Income Below Poverty Among Single-Parent Households in Atqasuk
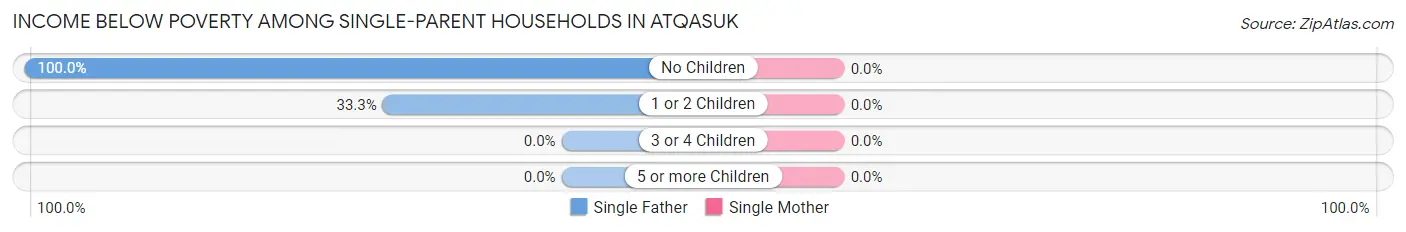
| Children | Single Father | Single Mother |
| No Children | 4 (100.0%) | 0 (0.0%) |
| 1 or 2 Children | 4 (33.3%) | 0 (0.0%) |
| 3 or 4 Children | 0 (0.0%) | 0 (0.0%) |
| 5 or more Children | 0 (0.0%) | 0 (0.0%) |
| Total | 8 (50.0%) | 0 (0.0%) |
Income Below Poverty Among Married-Couple vs Single-Parent Households in Atqasuk
The poverty data for Atqasuk shows that 1 of the married-couple family households (25.0%) and 8 of the single-parent households (27.6%) are living below the poverty level. Within the married-couple family households, those with 1 or 2 children have the highest poverty rate, with 1 households (33.3%) falling below the poverty line. Among the single-parent households, those with no children have the highest poverty rate, with 4 household (100.0%) living below poverty.
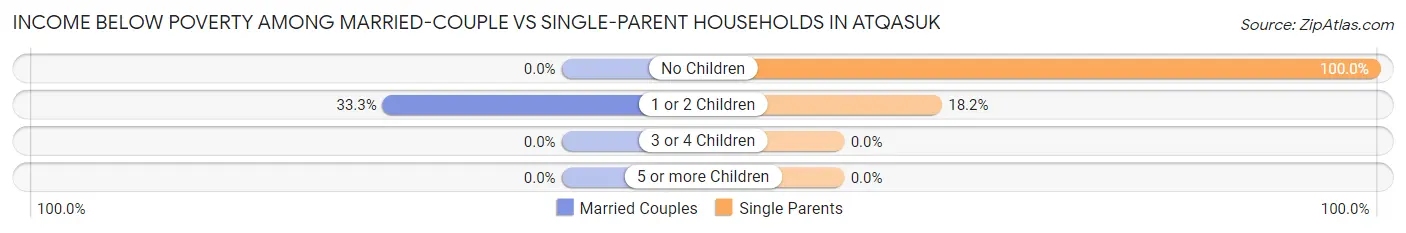
| Children | Married-Couple Families | Single-Parent Households |
| No Children | 0 (0.0%) | 4 (100.0%) |
| 1 or 2 Children | 1 (33.3%) | 4 (18.2%) |
| 3 or 4 Children | 0 (0.0%) | 0 (0.0%) |
| 5 or more Children | 0 (0.0%) | 0 (0.0%) |
| Total | 1 (25.0%) | 8 (27.6%) |
Race in Atqasuk
The most populous races in Atqasuk are Native / Alaskan (117 | 98.3%), and White / Caucasian (2 | 1.7%).
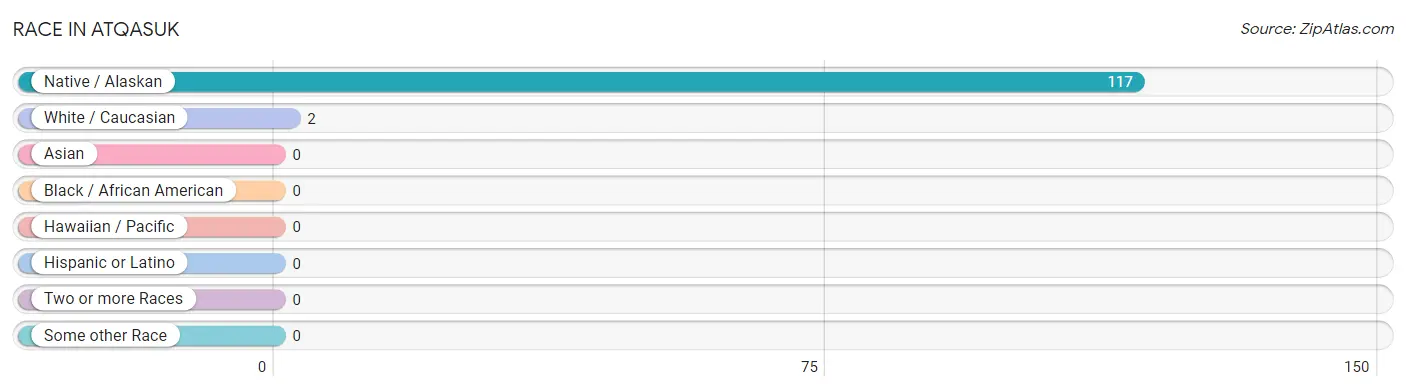
| Race | # Population | % Population |
| Asian | 0 | 0.0% |
| Black / African American | 0 | 0.0% |
| Hawaiian / Pacific | 0 | 0.0% |
| Hispanic or Latino | 0 | 0.0% |
| Native / Alaskan | 117 | 98.3% |
| White / Caucasian | 2 | 1.7% |
| Two or more Races | 0 | 0.0% |
| Some other Race | 0 | 0.0% |
| Total | 119 | 100.0% |
Ancestry in Atqasuk
The most populous ancestries reported in Atqasuk are Inupiat (117 | 98.3%), and European (2 | 1.7%), together accounting for 100.0% of all Atqasuk residents.
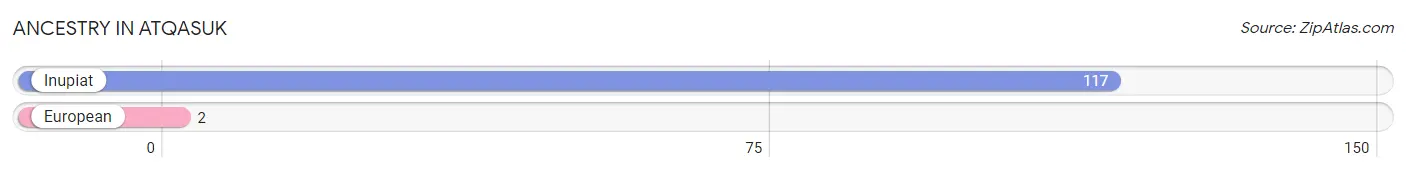
| Ancestry | # Population | % Population |
| European | 2 | 1.7% |
| Inupiat | 117 | 98.3% | View All 2 Rows |
Immigrants in Atqasuk

| Immigration Origin | # Population | % Population | View All 0 Rows |
Sex and Age in Atqasuk
Sex and Age in Atqasuk
The most populous age groups in Atqasuk are 20 to 24 Years (17 | 27.0%) for men and 25 to 29 Years (11 | 19.6%) for women.
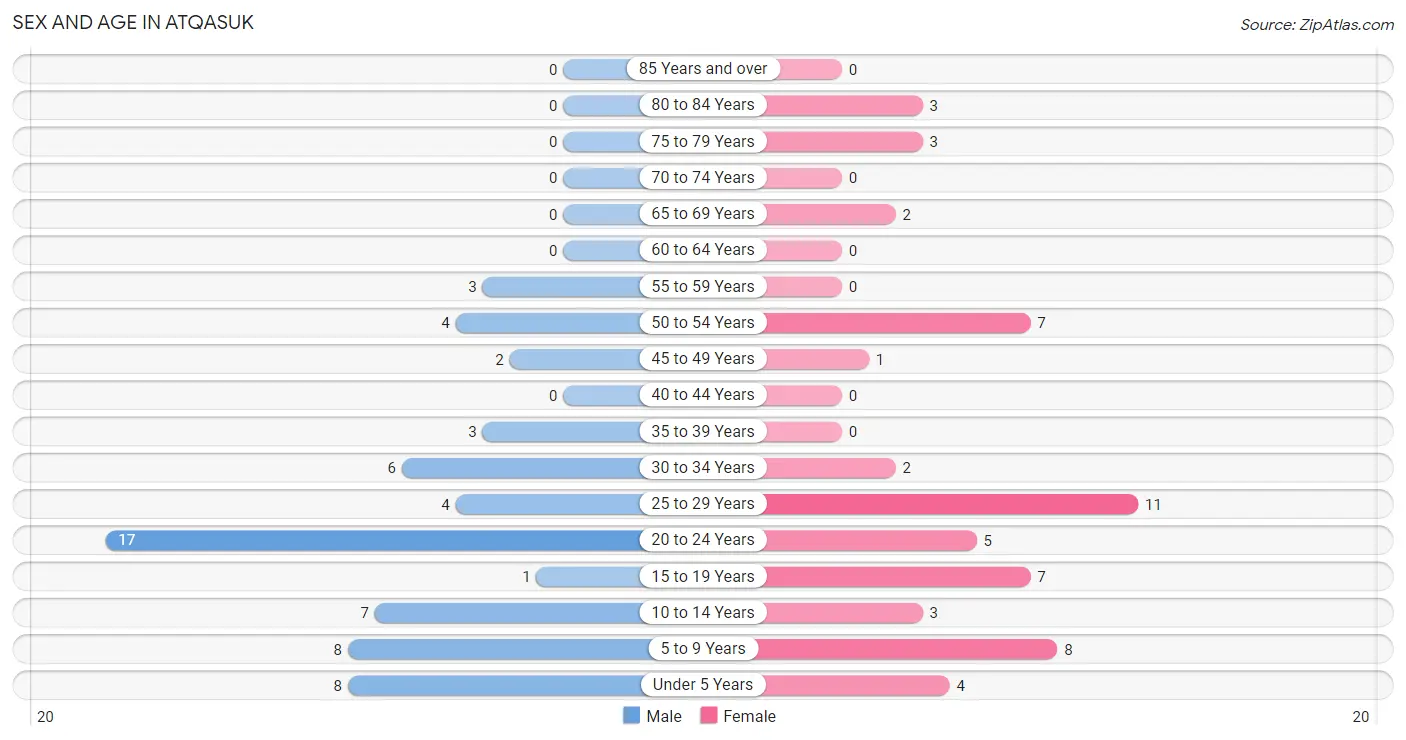
| Age Bracket | Male | Female |
| Under 5 Years | 8 (12.7%) | 4 (7.1%) |
| 5 to 9 Years | 8 (12.7%) | 8 (14.3%) |
| 10 to 14 Years | 7 (11.1%) | 3 (5.4%) |
| 15 to 19 Years | 1 (1.6%) | 7 (12.5%) |
| 20 to 24 Years | 17 (27.0%) | 5 (8.9%) |
| 25 to 29 Years | 4 (6.4%) | 11 (19.6%) |
| 30 to 34 Years | 6 (9.5%) | 2 (3.6%) |
| 35 to 39 Years | 3 (4.8%) | 0 (0.0%) |
| 40 to 44 Years | 0 (0.0%) | 0 (0.0%) |
| 45 to 49 Years | 2 (3.2%) | 1 (1.8%) |
| 50 to 54 Years | 4 (6.4%) | 7 (12.5%) |
| 55 to 59 Years | 3 (4.8%) | 0 (0.0%) |
| 60 to 64 Years | 0 (0.0%) | 0 (0.0%) |
| 65 to 69 Years | 0 (0.0%) | 2 (3.6%) |
| 70 to 74 Years | 0 (0.0%) | 0 (0.0%) |
| 75 to 79 Years | 0 (0.0%) | 3 (5.4%) |
| 80 to 84 Years | 0 (0.0%) | 3 (5.4%) |
| 85 Years and over | 0 (0.0%) | 0 (0.0%) |
| Total | 63 (100.0%) | 56 (100.0%) |
Families and Households in Atqasuk
Median Family Size in Atqasuk
The median family size in Atqasuk is 3.15 persons per family, with married-couple families (4 | 12.1%) accounting for the largest median family size of 7.25 persons per family. On the other hand, single male/father families (16 | 48.5%) represent the smallest median family size with 1.81 persons per family.
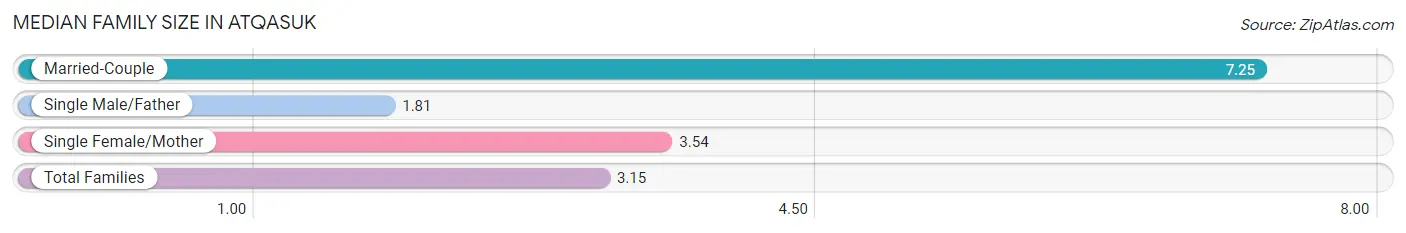
| Family Type | # Families | Family Size |
| Married-Couple | 4 (12.1%) | 7.25 |
| Single Male/Father | 16 (48.5%) | 1.81 |
| Single Female/Mother | 13 (39.4%) | 3.54 |
| Total Families | 33 (100.0%) | 3.15 |
Median Household Size in Atqasuk
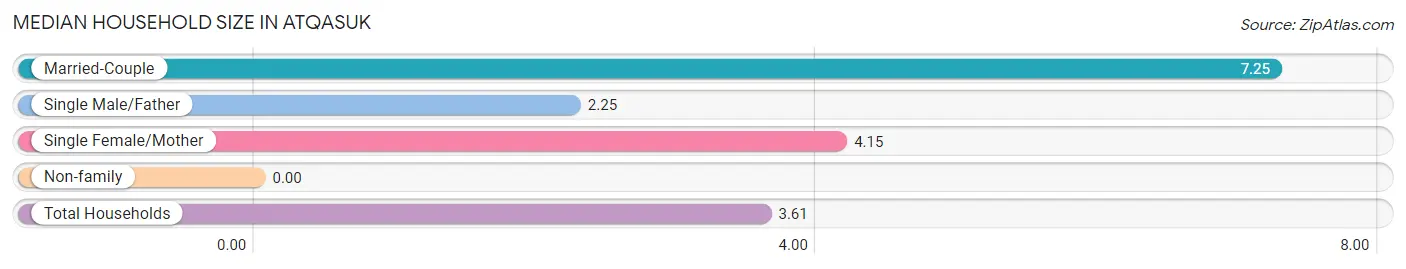
| Household Type | # Households | Household Size |
| Married-Couple | 4 (12.1%) | 7.25 |
| Single Male/Father | 16 (48.5%) | 2.25 |
| Single Female/Mother | 13 (39.4%) | 4.15 |
| Non-family | 0 (0.0%) | - |
| Total Households | 33 (100.0%) | 3.61 |
Household Size by Marriage Status in Atqasuk
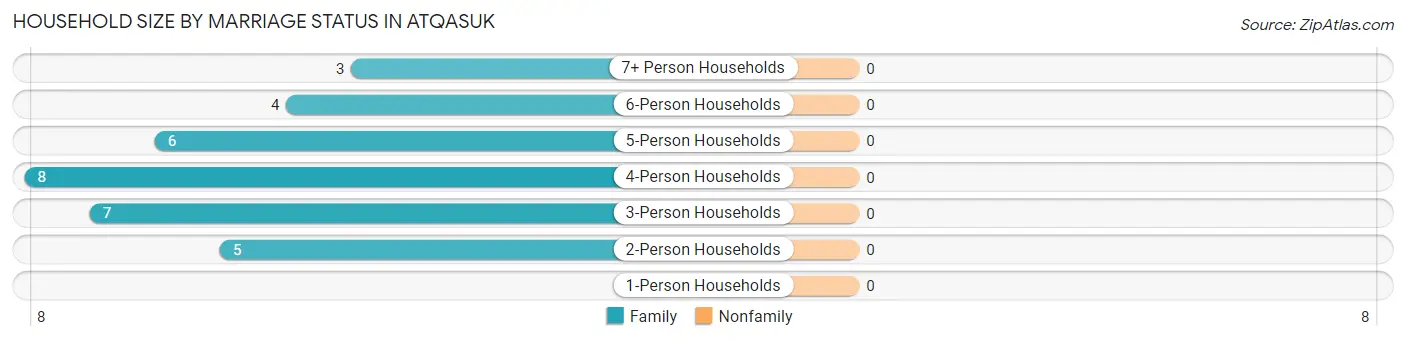
| Household Size | Family Households | Nonfamily Households |
| 1-Person Households | - | 0 (0.0%) |
| 2-Person Households | 5 (15.1%) | 0 (0.0%) |
| 3-Person Households | 7 (21.2%) | 0 (0.0%) |
| 4-Person Households | 8 (24.2%) | 0 (0.0%) |
| 5-Person Households | 6 (18.2%) | 0 (0.0%) |
| 6-Person Households | 4 (12.1%) | 0 (0.0%) |
| 7+ Person Households | 3 (9.1%) | 0 (0.0%) |
| Total | 33 (100.0%) | 0 (0.0%) |
Female Fertility in Atqasuk
Fertility by Age in Atqasuk
Average fertility rate in Atqasuk is 77.0 births per 1,000 women. Women in the age bracket of 20 to 34 years have the highest fertility rate with 111.0 births per 1,000 women. Women in the age bracket of 20 to 34 years acount for 100.0% of all women with births.

| Age Bracket | Women with Births | Births / 1,000 Women |
| 15 to 19 years | 0 (0.0%) | 0.0 |
| 20 to 34 years | 2 (100.0%) | 111.0 |
| 35 to 50 years | 0 (0.0%) | 0.0 |
| Total | 2 (100.0%) | 77.0 |
Fertility by Age by Marriage Status in Atqasuk
| Age Bracket | Married | Unmarried |
| 15 to 19 years | 0 (0.0%) | 0 (0.0%) |
| 20 to 34 years | 2 (100.0%) | 0 (0.0%) |
| 35 to 50 years | 0 (0.0%) | 0 (0.0%) |
| Total | 2 (100.0%) | 0 (0.0%) |
Fertility by Education in Atqasuk
| Educational Attainment | Women with Births | Births / 1,000 Women |
| Less than High School | 0 (0.0%) | 0.0 |
| High School Diploma | 0 (0.0%) | 0.0 |
| College or Associate's Degree | 2 (100.0%) | 118.0 |
| Bachelor's Degree | 0 (0.0%) | 0.0 |
| Graduate Degree | 0 (0.0%) | 0.0 |
| Total | 2 (100.0%) | 77.0 |
Fertility by Education by Marriage Status in Atqasuk
| Educational Attainment | Married | Unmarried |
| Less than High School | 0 (0.0%) | 0 (0.0%) |
| High School Diploma | 0 (0.0%) | 0 (0.0%) |
| College or Associate's Degree | 2 (100.0%) | 0 (0.0%) |
| Bachelor's Degree | 0 (0.0%) | 0 (0.0%) |
| Graduate Degree | 0 (0.0%) | 0 (0.0%) |
| Total | 2 (100.0%) | 0 (0.0%) |
Employment Characteristics in Atqasuk
Employment by Class of Employer in Atqasuk
Among the 41 employed individuals in Atqasuk, local government employees (20 | 48.8%), state government employees (10 | 24.4%), and federal government employees (7 | 17.1%) make up the most common classes of employment.
| Employer Class | # Employees | % Employees |
| Private Company Employees | 4 | 9.8% |
| Self-Employed (Incorporated) | 0 | 0.0% |
| Self-Employed (Not Incorporated) | 0 | 0.0% |
| Not-for-profit Organizations | 0 | 0.0% |
| Local Government Employees | 20 | 48.8% |
| State Government Employees | 10 | 24.4% |
| Federal Government Employees | 7 | 17.1% |
| Unpaid Family Workers | 0 | 0.0% |
| Total | 41 | 100.0% |
Employment Status by Age in Atqasuk
According to the labor force statistics for Atqasuk, out of the total population over 16 years of age (81), 61.7% or 50 individuals are in the labor force, with 8.0% or 4 of them unemployed. The age group with the highest labor force participation rate is 55 to 59 years, with 100.0% or 3 individuals in the labor force. Within the labor force, the 45 to 54 years age range has the highest percentage of unemployed individuals, with 20.0% or 2 of them being unemployed.
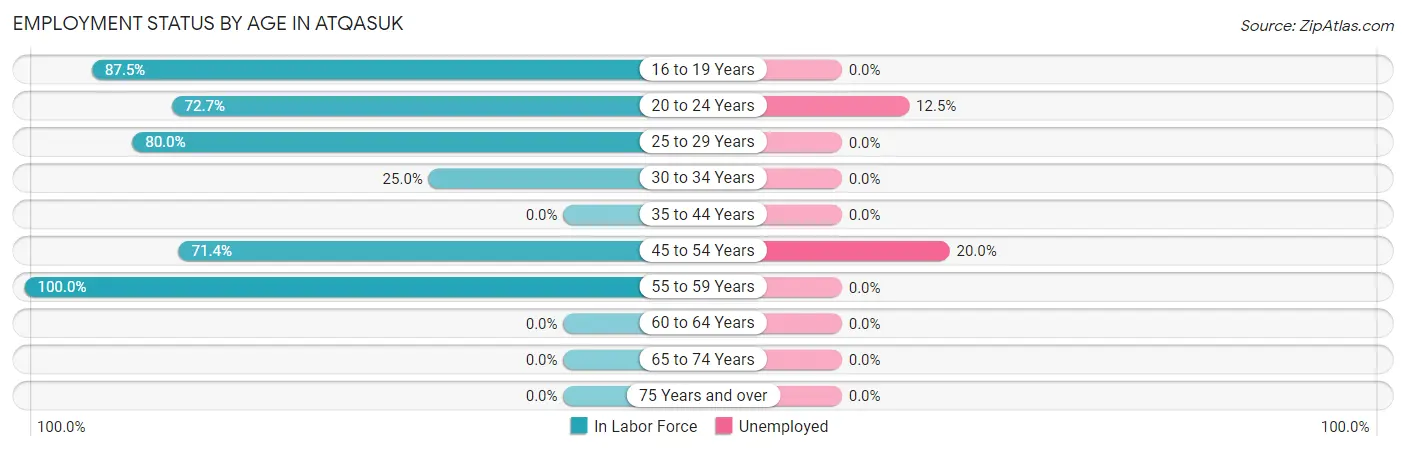
| Age Bracket | In Labor Force | Unemployed |
| 16 to 19 Years | 7 (87.5%) | 0 (0.0%) |
| 20 to 24 Years | 16 (72.7%) | 2 (12.5%) |
| 25 to 29 Years | 12 (80.0%) | 0 (0.0%) |
| 30 to 34 Years | 2 (25.0%) | 0 (0.0%) |
| 35 to 44 Years | 0 (0.0%) | 0 (0.0%) |
| 45 to 54 Years | 10 (71.4%) | 2 (20.0%) |
| 55 to 59 Years | 3 (100.0%) | 0 (0.0%) |
| 60 to 64 Years | 0 (0.0%) | 0 (0.0%) |
| 65 to 74 Years | 0 (0.0%) | 0 (0.0%) |
| 75 Years and over | 0 (0.0%) | 0 (0.0%) |
| Total | 50 (61.7%) | 4 (8.0%) |
Employment Status by Educational Attainment in Atqasuk
According to labor force statistics for Atqasuk, 62.8% of individuals (27) out of the total population between 25 and 64 years of age (43) are in the labor force, with 7.4% or 2 of them being unemployed. The group with the highest labor force participation rate are those with the educational attainment of bachelor's degree or higher, with 100.0% or 2 individuals in the labor force. Within the labor force, individuals with less than high school education have the highest percentage of unemployment, with 33.3% or 1 of them being unemployed.
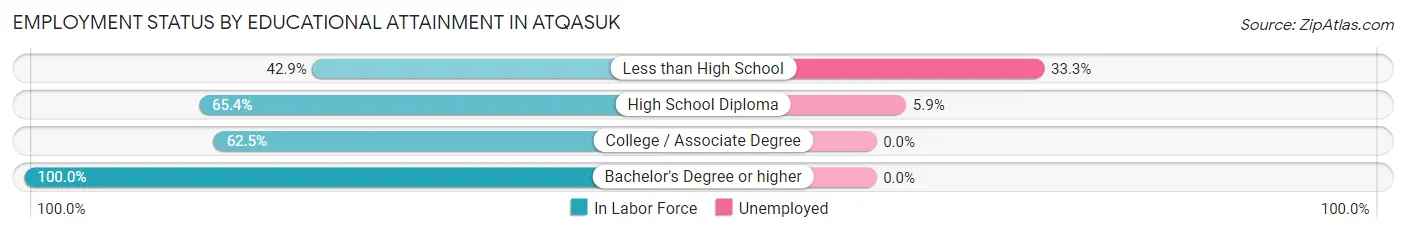
| Educational Attainment | In Labor Force | Unemployed |
| Less than High School | 3 (42.9%) | 2 (33.3%) |
| High School Diploma | 17 (65.4%) | 2 (5.9%) |
| College / Associate Degree | 5 (62.5%) | 0 (0.0%) |
| Bachelor's Degree or higher | 2 (100.0%) | 0 (0.0%) |
| Total | 27 (62.8%) | 3 (7.4%) |
Employment Occupations by Sex in Atqasuk
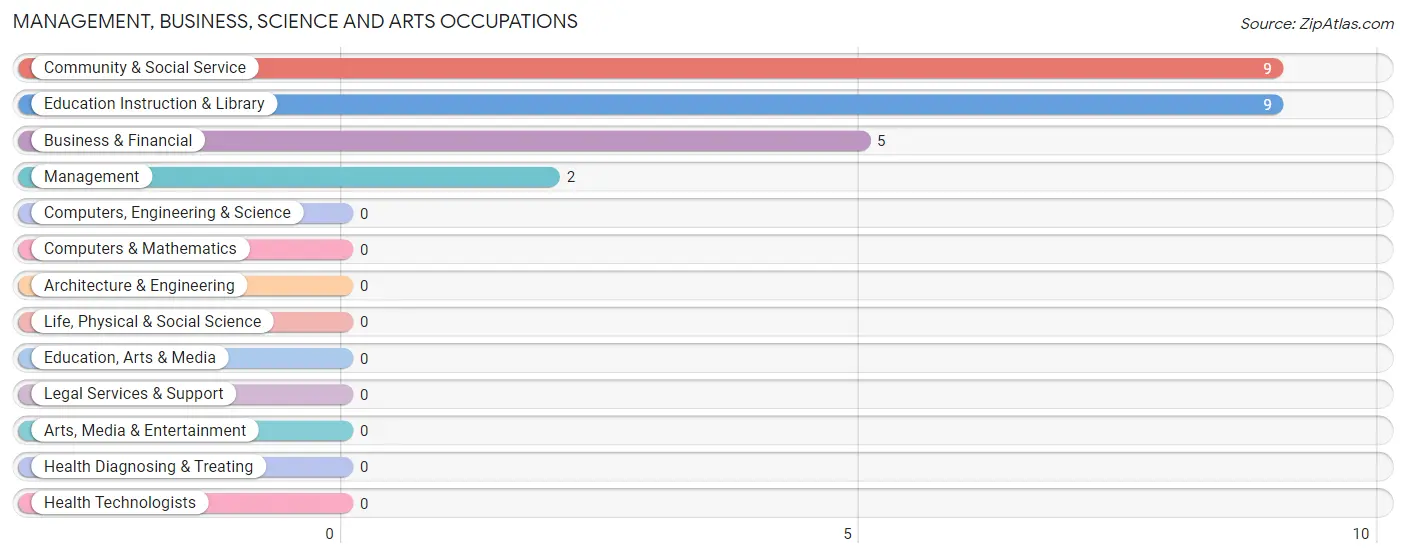
Management, Business, Science and Arts Occupations
The most common Management, Business, Science and Arts occupations in Atqasuk are Community & Social Service (9 | 19.6%), Education Instruction & Library (9 | 19.6%), Business & Financial (5 | 10.9%), and Management (2 | 4.3%).
Management, Business, Science and Arts Occupations by Sex
Within the Management, Business, Science and Arts occupations in Atqasuk, the most male-oriented occupations are Business & Financial (100.0%), Community & Social Service (55.6%), and Education Instruction & Library (55.6%), while the most female-oriented occupations are Management (100.0%), Community & Social Service (44.4%), and Education Instruction & Library (44.4%).
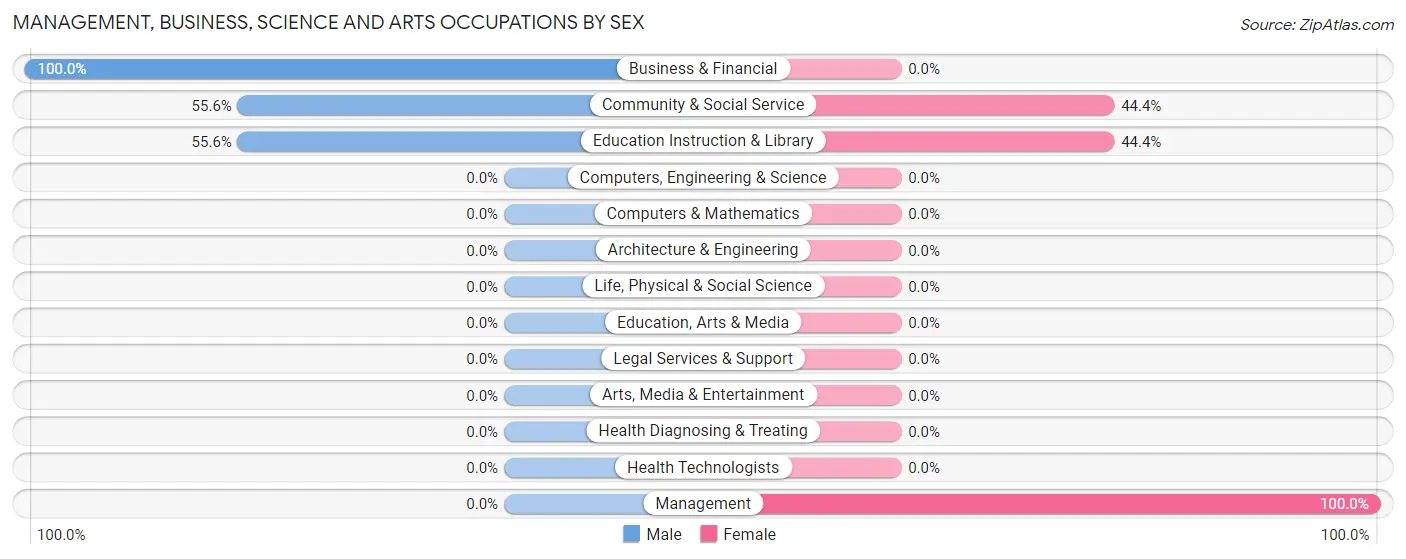
| Occupation | Male | Female |
| Management | 0 (0.0%) | 2 (100.0%) |
| Business & Financial | 5 (100.0%) | 0 (0.0%) |
| Computers, Engineering & Science | 0 (0.0%) | 0 (0.0%) |
| Computers & Mathematics | 0 (0.0%) | 0 (0.0%) |
| Architecture & Engineering | 0 (0.0%) | 0 (0.0%) |
| Life, Physical & Social Science | 0 (0.0%) | 0 (0.0%) |
| Community & Social Service | 5 (55.6%) | 4 (44.4%) |
| Education, Arts & Media | 0 (0.0%) | 0 (0.0%) |
| Legal Services & Support | 0 (0.0%) | 0 (0.0%) |
| Education Instruction & Library | 5 (55.6%) | 4 (44.4%) |
| Arts, Media & Entertainment | 0 (0.0%) | 0 (0.0%) |
| Health Diagnosing & Treating | 0 (0.0%) | 0 (0.0%) |
| Health Technologists | 0 (0.0%) | 0 (0.0%) |
| Total (Category) | 10 (62.5%) | 6 (37.5%) |
| Total (Overall) | 24 (52.2%) | 22 (47.8%) |
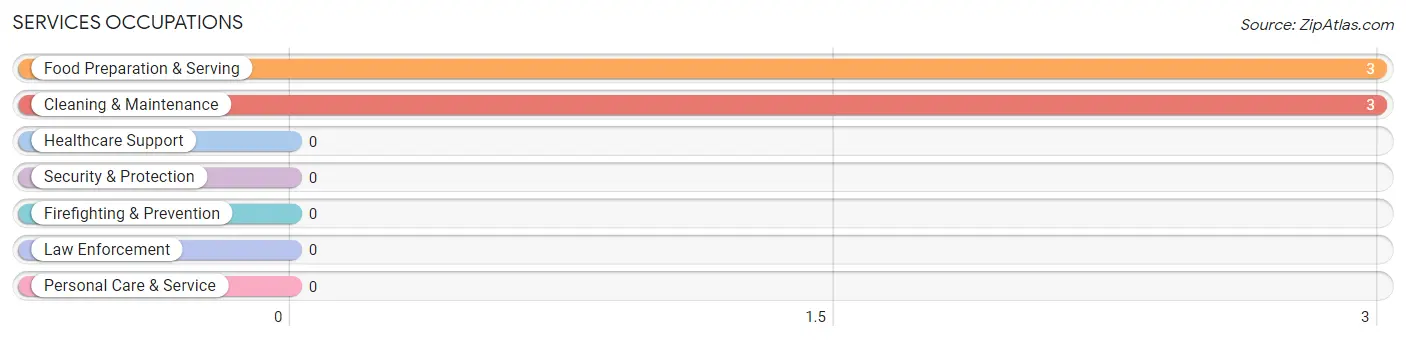
Services Occupations
The most common Services occupations in Atqasuk are Food Preparation & Serving (3 | 6.5%), and Cleaning & Maintenance (3 | 6.5%).
Services Occupations by Sex
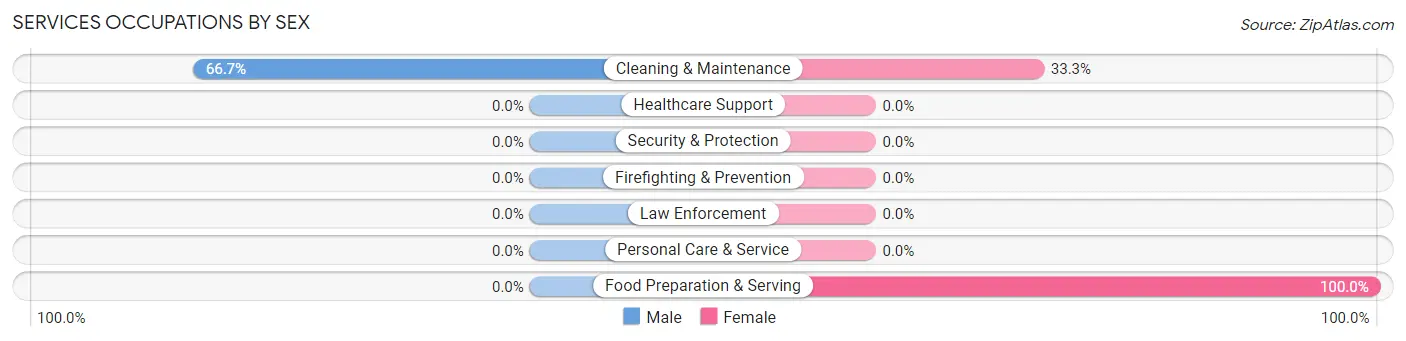
| Occupation | Male | Female |
| Healthcare Support | 0 (0.0%) | 0 (0.0%) |
| Security & Protection | 0 (0.0%) | 0 (0.0%) |
| Firefighting & Prevention | 0 (0.0%) | 0 (0.0%) |
| Law Enforcement | 0 (0.0%) | 0 (0.0%) |
| Food Preparation & Serving | 0 (0.0%) | 3 (100.0%) |
| Cleaning & Maintenance | 2 (66.7%) | 1 (33.3%) |
| Personal Care & Service | 0 (0.0%) | 0 (0.0%) |
| Total (Category) | 2 (33.3%) | 4 (66.7%) |
| Total (Overall) | 24 (52.2%) | 22 (47.8%) |
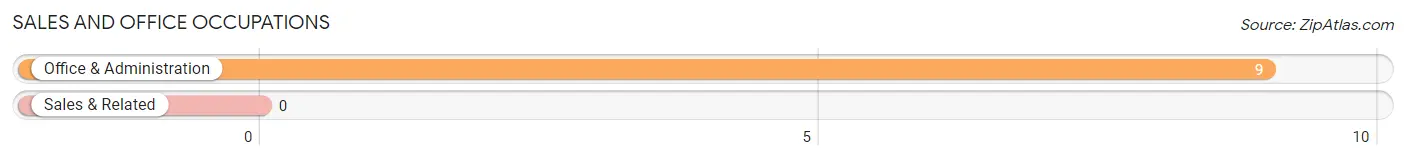
Sales and Office Occupations
The most common Sales and Office occupations in Atqasuk are , and Office & Administration (9 | 19.6%).
Sales and Office Occupations by Sex
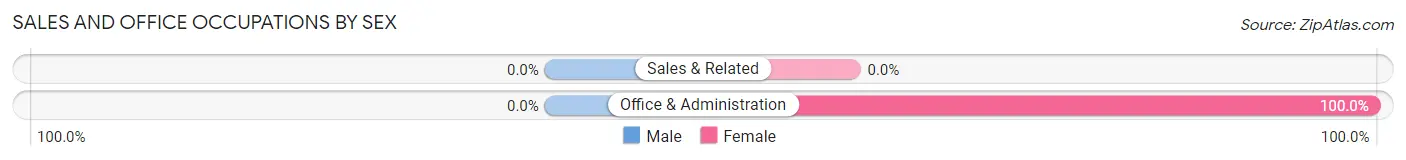
| Occupation | Male | Female |
| Sales & Related | 0 (0.0%) | 0 (0.0%) |
| Office & Administration | 0 (0.0%) | 9 (100.0%) |
| Total (Category) | 0 (0.0%) | 9 (100.0%) |
| Total (Overall) | 24 (52.2%) | 22 (47.8%) |
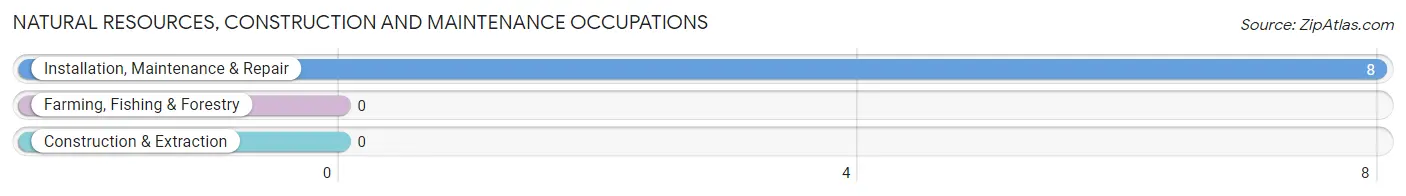
Natural Resources, Construction and Maintenance Occupations
The most common Natural Resources, Construction and Maintenance occupations in Atqasuk are , and Installation, Maintenance & Repair (8 | 17.4%).
Natural Resources, Construction and Maintenance Occupations by Sex
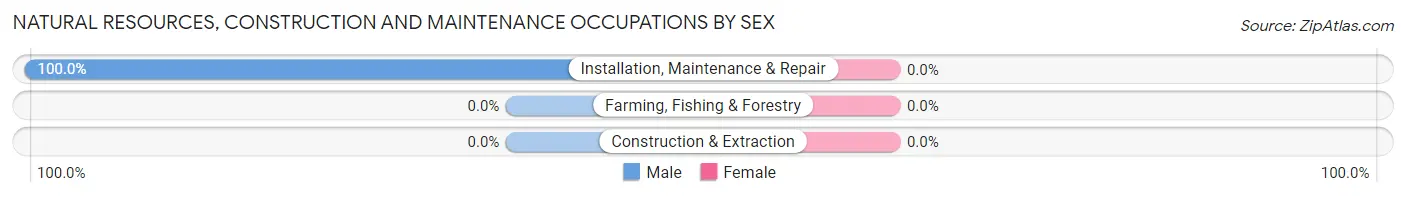
| Occupation | Male | Female |
| Farming, Fishing & Forestry | 0 (0.0%) | 0 (0.0%) |
| Construction & Extraction | 0 (0.0%) | 0 (0.0%) |
| Installation, Maintenance & Repair | 8 (100.0%) | 0 (0.0%) |
| Total (Category) | 8 (100.0%) | 0 (0.0%) |
| Total (Overall) | 24 (52.2%) | 22 (47.8%) |
Production, Transportation and Moving Occupations
The most common Production, Transportation and Moving occupations in Atqasuk are Production (4 | 8.7%), and Material Moving (3 | 6.5%).
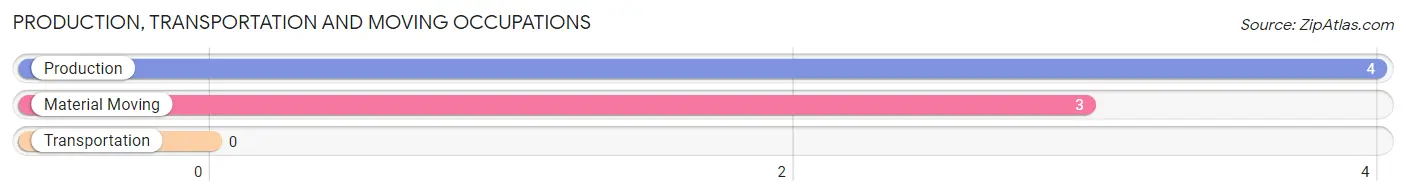
Production, Transportation and Moving Occupations by Sex
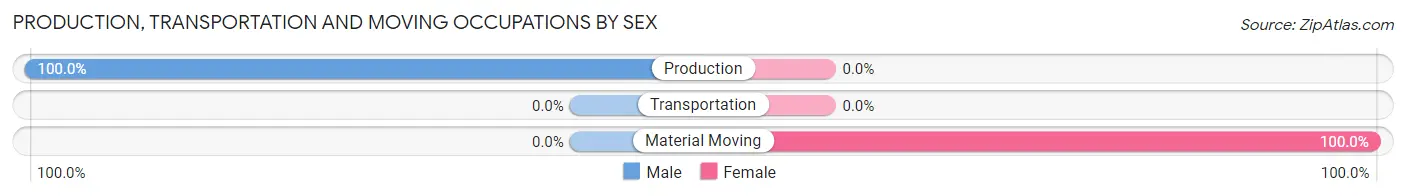
| Occupation | Male | Female |
| Production | 4 (100.0%) | 0 (0.0%) |
| Transportation | 0 (0.0%) | 0 (0.0%) |
| Material Moving | 0 (0.0%) | 3 (100.0%) |
| Total (Category) | 4 (57.1%) | 3 (42.9%) |
| Total (Overall) | 24 (52.2%) | 22 (47.8%) |
Employment Industries by Sex in Atqasuk
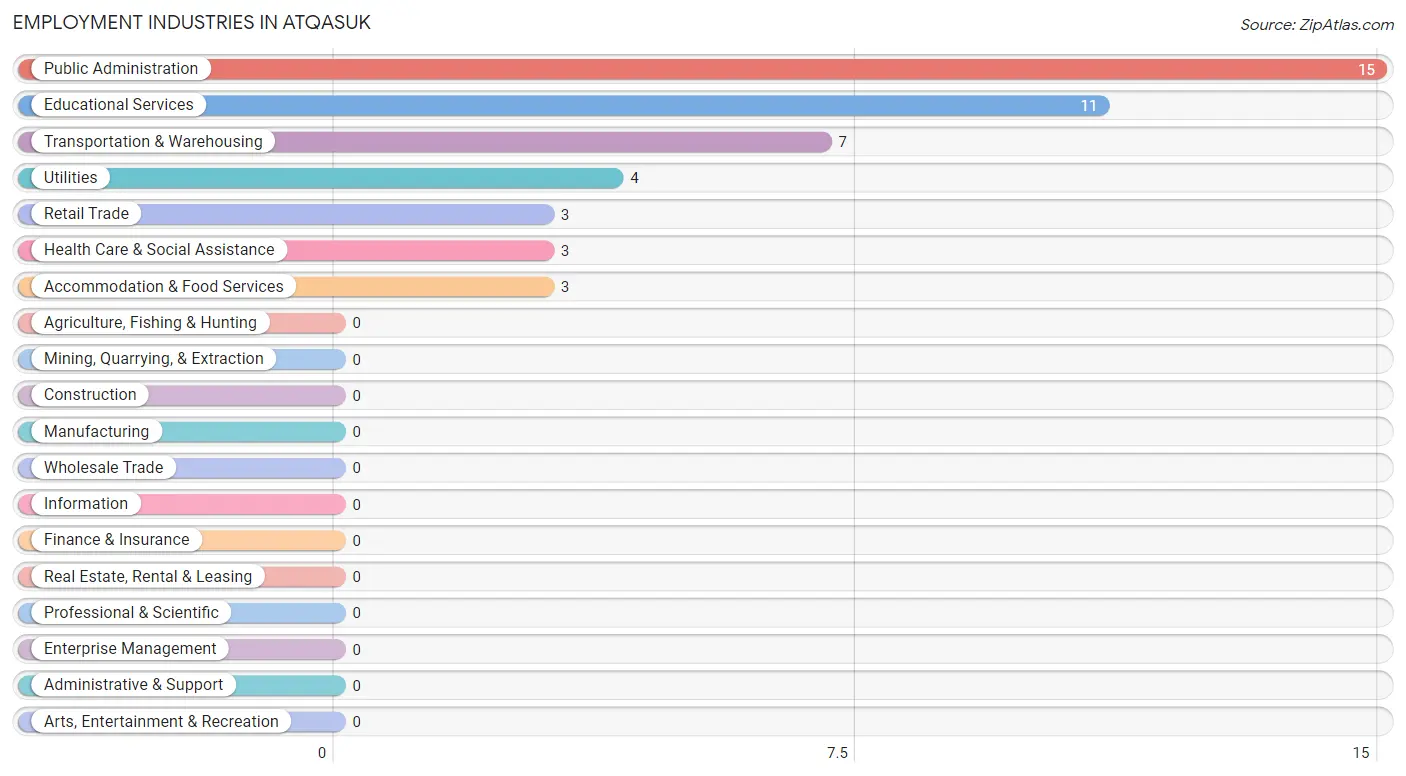
Employment Industries in Atqasuk
The major employment industries in Atqasuk include Public Administration (15 | 32.6%), Educational Services (11 | 23.9%), Transportation & Warehousing (7 | 15.2%), Utilities (4 | 8.7%), and Retail Trade (3 | 6.5%).
Employment Industries by Sex in Atqasuk
The Atqasuk industries that see more men than women are Utilities (100.0%), Public Administration (86.7%), and Educational Services (63.6%), whereas the industries that tend to have a higher number of women are Retail Trade (100.0%), Transportation & Warehousing (100.0%), and Health Care & Social Assistance (100.0%).
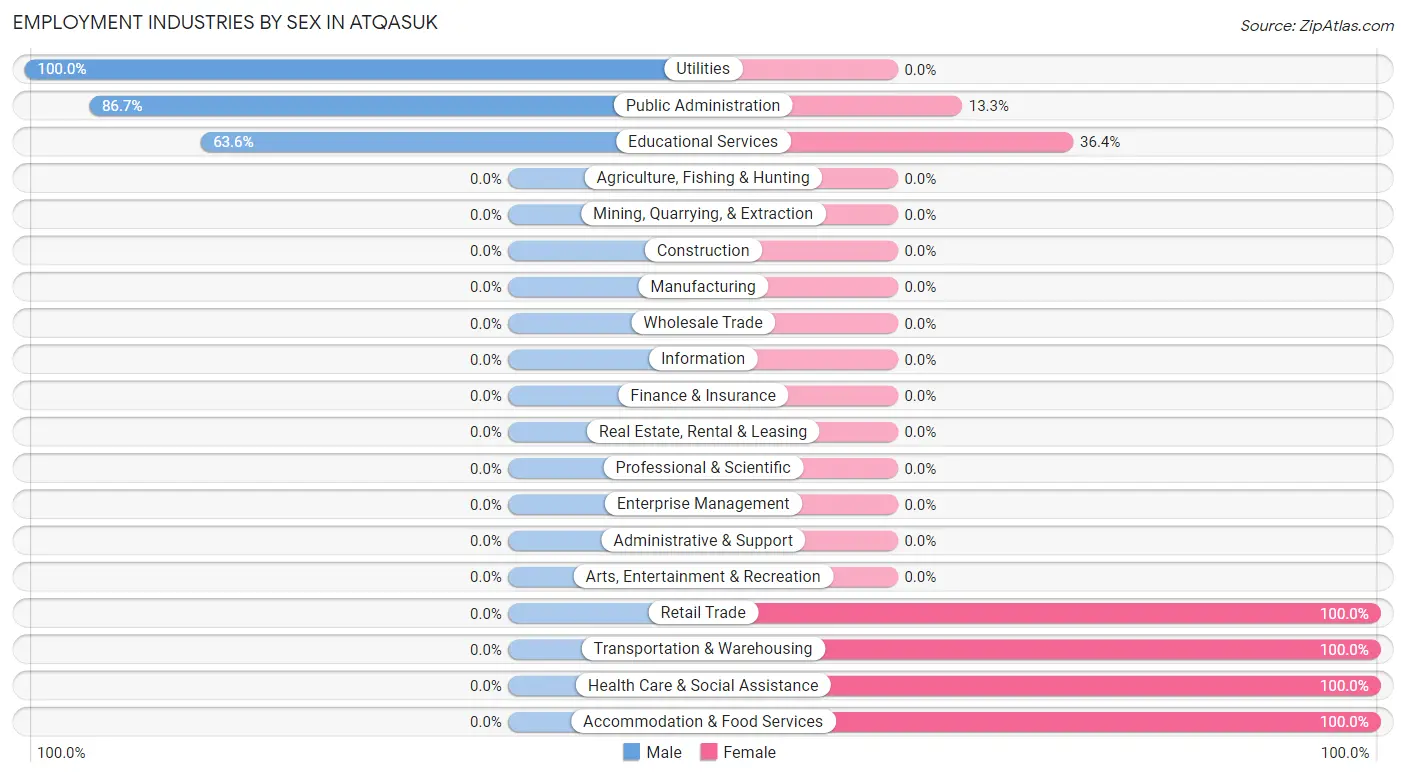
| Industry | Male | Female |
| Agriculture, Fishing & Hunting | 0 (0.0%) | 0 (0.0%) |
| Mining, Quarrying, & Extraction | 0 (0.0%) | 0 (0.0%) |
| Construction | 0 (0.0%) | 0 (0.0%) |
| Manufacturing | 0 (0.0%) | 0 (0.0%) |
| Wholesale Trade | 0 (0.0%) | 0 (0.0%) |
| Retail Trade | 0 (0.0%) | 3 (100.0%) |
| Transportation & Warehousing | 0 (0.0%) | 7 (100.0%) |
| Utilities | 4 (100.0%) | 0 (0.0%) |
| Information | 0 (0.0%) | 0 (0.0%) |
| Finance & Insurance | 0 (0.0%) | 0 (0.0%) |
| Real Estate, Rental & Leasing | 0 (0.0%) | 0 (0.0%) |
| Professional & Scientific | 0 (0.0%) | 0 (0.0%) |
| Enterprise Management | 0 (0.0%) | 0 (0.0%) |
| Administrative & Support | 0 (0.0%) | 0 (0.0%) |
| Educational Services | 7 (63.6%) | 4 (36.4%) |
| Health Care & Social Assistance | 0 (0.0%) | 3 (100.0%) |
| Arts, Entertainment & Recreation | 0 (0.0%) | 0 (0.0%) |
| Accommodation & Food Services | 0 (0.0%) | 3 (100.0%) |
| Public Administration | 13 (86.7%) | 2 (13.3%) |
| Total | 24 (52.2%) | 22 (47.8%) |
Education in Atqasuk
School Enrollment in Atqasuk
The most common levels of schooling among the 39 students in Atqasuk are middle school (9 | 23.1%), college / undergraduate (8 | 20.5%), and nursery / preschool (6 | 15.4%).
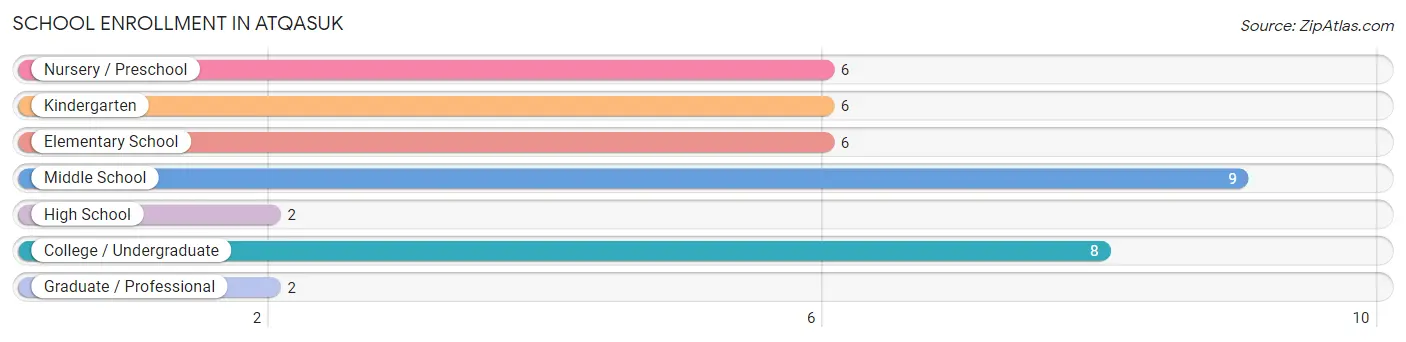
| School Level | # Students | % Students |
| Nursery / Preschool | 6 | 15.4% |
| Kindergarten | 6 | 15.4% |
| Elementary School | 6 | 15.4% |
| Middle School | 9 | 23.1% |
| High School | 2 | 5.1% |
| College / Undergraduate | 8 | 20.5% |
| Graduate / Professional | 2 | 5.1% |
| Total | 39 | 100.0% |
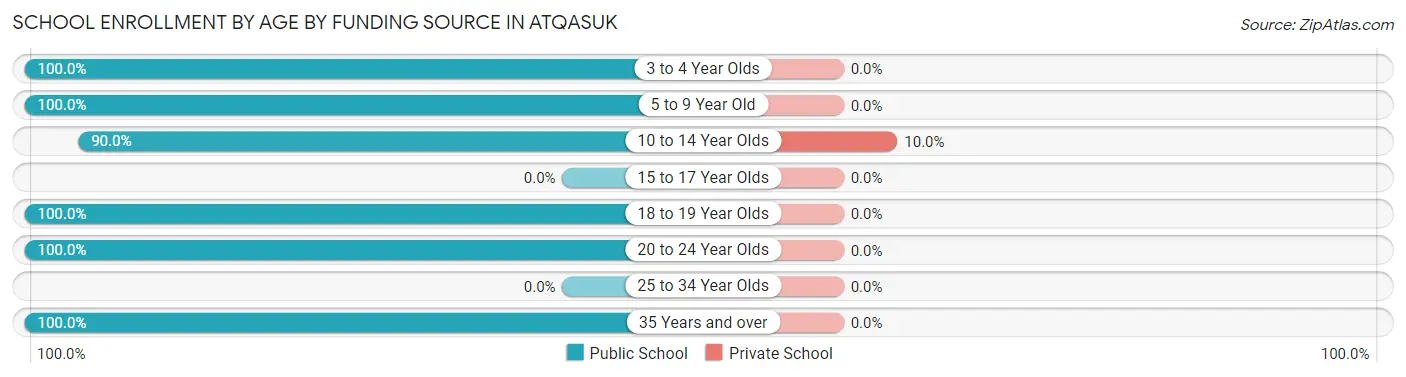
School Enrollment by Age by Funding Source in Atqasuk
Out of a total of 39 students who are enrolled in schools in Atqasuk, 1 (2.6%) attend a private institution, while the remaining 38 (97.4%) are enrolled in public schools. The age group of 10 to 14 year olds has the highest likelihood of being enrolled in private schools, with 1 (10.0% in the age bracket) enrolled. Conversely, the age group of 3 to 4 year olds has the lowest likelihood of being enrolled in a private school, with 2 (100.0% in the age bracket) attending a public institution.
| Age Bracket | Public School | Private School |
| 3 to 4 Year Olds | 2 (100.0%) | 0 (0.0%) |
| 5 to 9 Year Old | 16 (100.0%) | 0 (0.0%) |
| 10 to 14 Year Olds | 9 (90.0%) | 1 (10.0%) |
| 15 to 17 Year Olds | 0 (0.0%) | 0 (0.0%) |
| 18 to 19 Year Olds | 8 (100.0%) | 0 (0.0%) |
| 20 to 24 Year Olds | 1 (100.0%) | 0 (0.0%) |
| 25 to 34 Year Olds | 0 (0.0%) | 0 (0.0%) |
| 35 Years and over | 2 (100.0%) | 0 (0.0%) |
| Total | 38 (97.4%) | 1 (2.6%) |
Educational Attainment by Field of Study in Atqasuk
Education (2 | 66.7%), and arts & humanities (1 | 33.3%) are the most common fields of study among 3 individuals in Atqasuk who have obtained a bachelor's degree or higher.
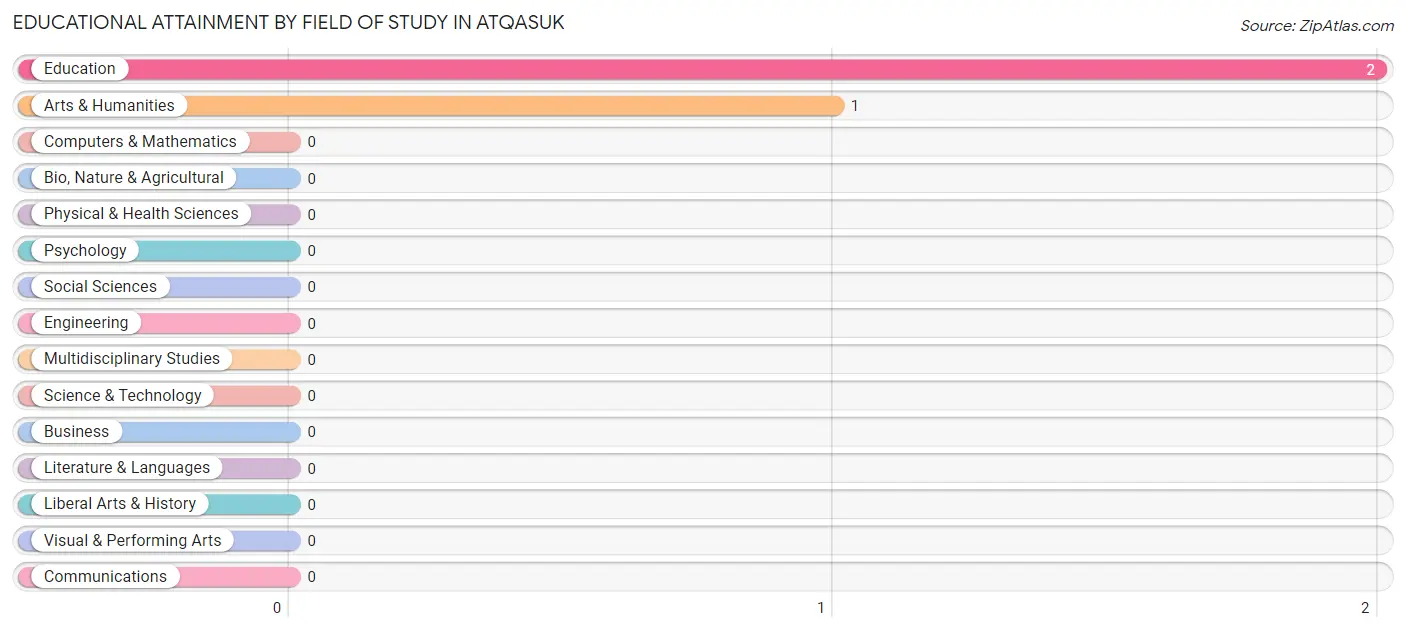
| Field of Study | # Graduates | % Graduates |
| Computers & Mathematics | 0 | 0.0% |
| Bio, Nature & Agricultural | 0 | 0.0% |
| Physical & Health Sciences | 0 | 0.0% |
| Psychology | 0 | 0.0% |
| Social Sciences | 0 | 0.0% |
| Engineering | 0 | 0.0% |
| Multidisciplinary Studies | 0 | 0.0% |
| Science & Technology | 0 | 0.0% |
| Business | 0 | 0.0% |
| Education | 2 | 66.7% |
| Literature & Languages | 0 | 0.0% |
| Liberal Arts & History | 0 | 0.0% |
| Visual & Performing Arts | 0 | 0.0% |
| Communications | 0 | 0.0% |
| Arts & Humanities | 1 | 33.3% |
| Total | 3 | 100.0% |
Transportation & Commute in Atqasuk
Vehicle Availability by Sex in Atqasuk
The most prevalent vehicle ownership categories in Atqasuk are males with no vehicle (10, accounting for 45.5%) and females with no vehicle (4, making up 52.6%).
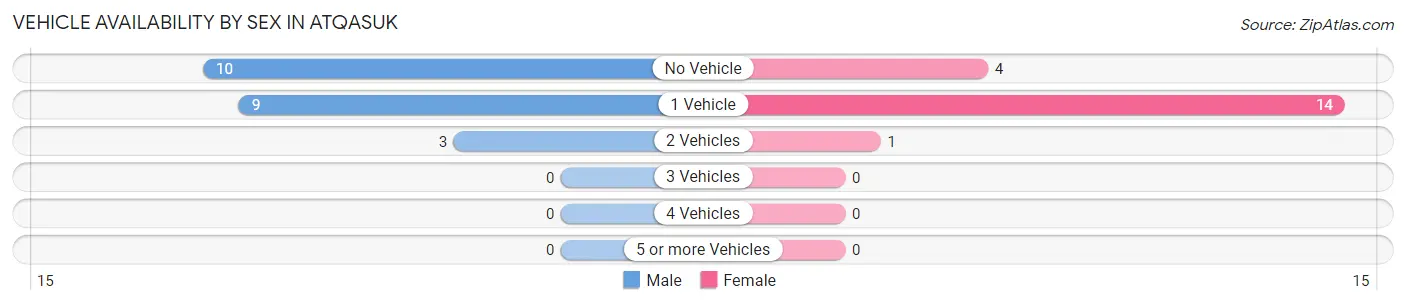
| Vehicles Available | Male | Female |
| No Vehicle | 10 (45.5%) | 4 (21.0%) |
| 1 Vehicle | 9 (40.9%) | 14 (73.7%) |
| 2 Vehicles | 3 (13.6%) | 1 (5.3%) |
| 3 Vehicles | 0 (0.0%) | 0 (0.0%) |
| 4 Vehicles | 0 (0.0%) | 0 (0.0%) |
| 5 or more Vehicles | 0 (0.0%) | 0 (0.0%) |
| Total | 22 (100.0%) | 19 (100.0%) |
Commute Time in Atqasuk
The most frequently occuring commute durations in Atqasuk are 5 to 9 minutes (24 commuters, 58.5%), less than 5 minutes (11 commuters, 26.8%), and 10 to 14 minutes (3 commuters, 7.3%).
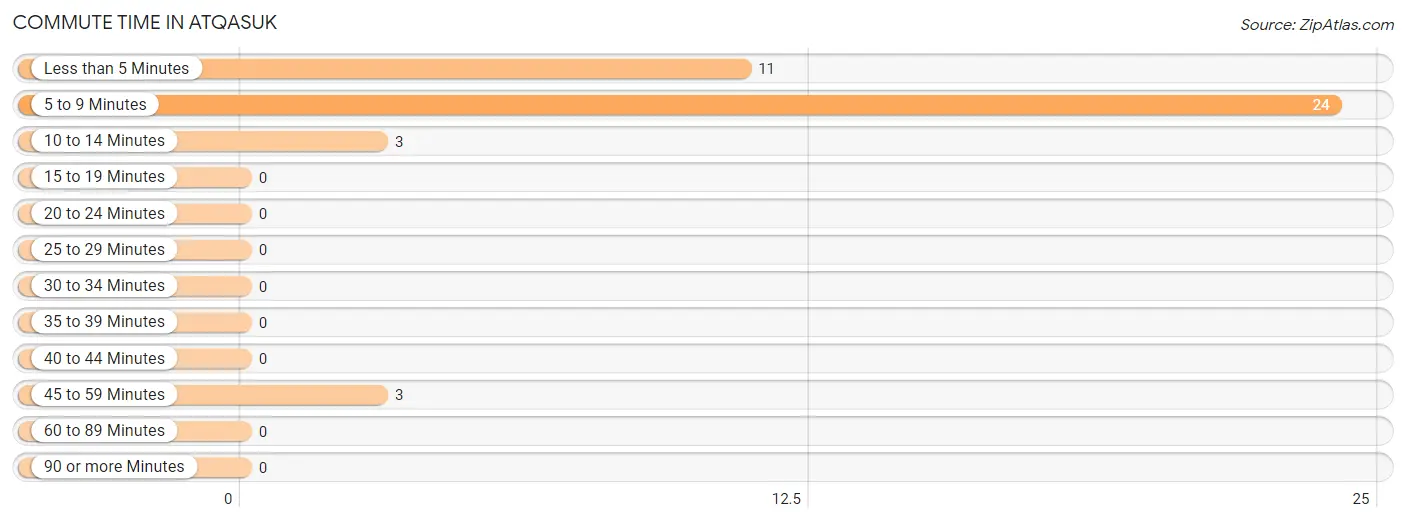
| Commute Time | # Commuters | % Commuters |
| Less than 5 Minutes | 11 | 26.8% |
| 5 to 9 Minutes | 24 | 58.5% |
| 10 to 14 Minutes | 3 | 7.3% |
| 15 to 19 Minutes | 0 | 0.0% |
| 20 to 24 Minutes | 0 | 0.0% |
| 25 to 29 Minutes | 0 | 0.0% |
| 30 to 34 Minutes | 0 | 0.0% |
| 35 to 39 Minutes | 0 | 0.0% |
| 40 to 44 Minutes | 0 | 0.0% |
| 45 to 59 Minutes | 3 | 7.3% |
| 60 to 89 Minutes | 0 | 0.0% |
| 90 or more Minutes | 0 | 0.0% |
Commute Time by Sex in Atqasuk
The most common commute times in Atqasuk are 5 to 9 minutes (12 commuters, 54.5%) for males and 5 to 9 minutes (12 commuters, 63.2%) for females.
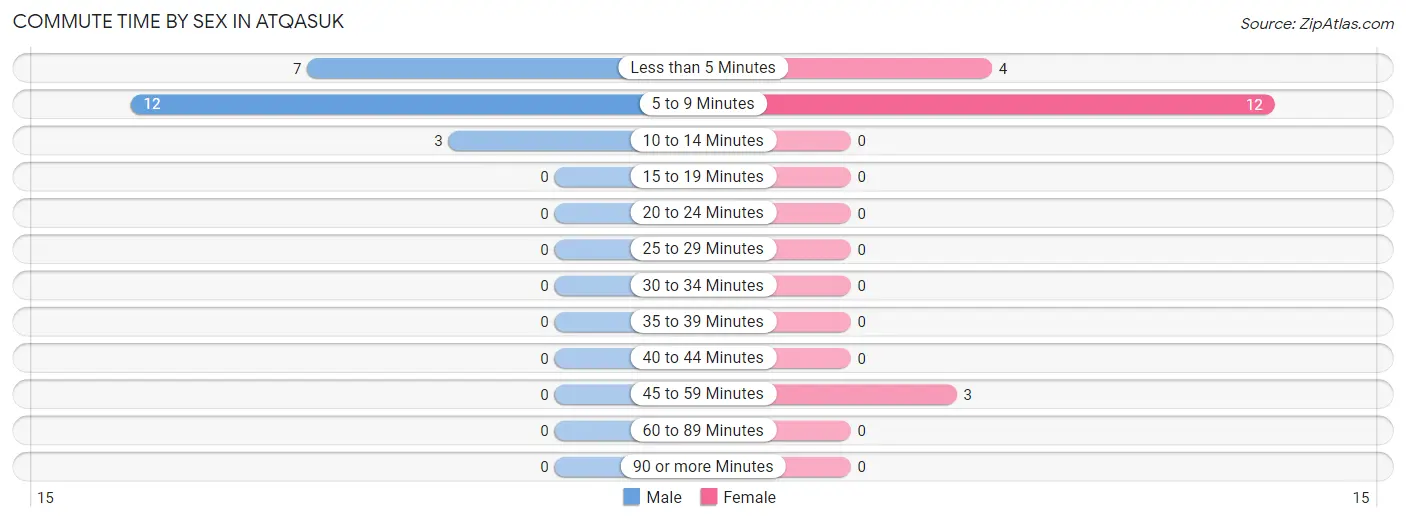
| Commute Time | Male | Female |
| Less than 5 Minutes | 7 (31.8%) | 4 (21.0%) |
| 5 to 9 Minutes | 12 (54.5%) | 12 (63.2%) |
| 10 to 14 Minutes | 3 (13.6%) | 0 (0.0%) |
| 15 to 19 Minutes | 0 (0.0%) | 0 (0.0%) |
| 20 to 24 Minutes | 0 (0.0%) | 0 (0.0%) |
| 25 to 29 Minutes | 0 (0.0%) | 0 (0.0%) |
| 30 to 34 Minutes | 0 (0.0%) | 0 (0.0%) |
| 35 to 39 Minutes | 0 (0.0%) | 0 (0.0%) |
| 40 to 44 Minutes | 0 (0.0%) | 0 (0.0%) |
| 45 to 59 Minutes | 0 (0.0%) | 3 (15.8%) |
| 60 to 89 Minutes | 0 (0.0%) | 0 (0.0%) |
| 90 or more Minutes | 0 (0.0%) | 0 (0.0%) |
Time of Departure to Work by Sex in Atqasuk
The most frequent times of departure to work in Atqasuk are 12:00 PM to 3:59 PM (9, 40.9%) for males and 9:00 AM to 9:59 AM (7, 36.8%) for females.
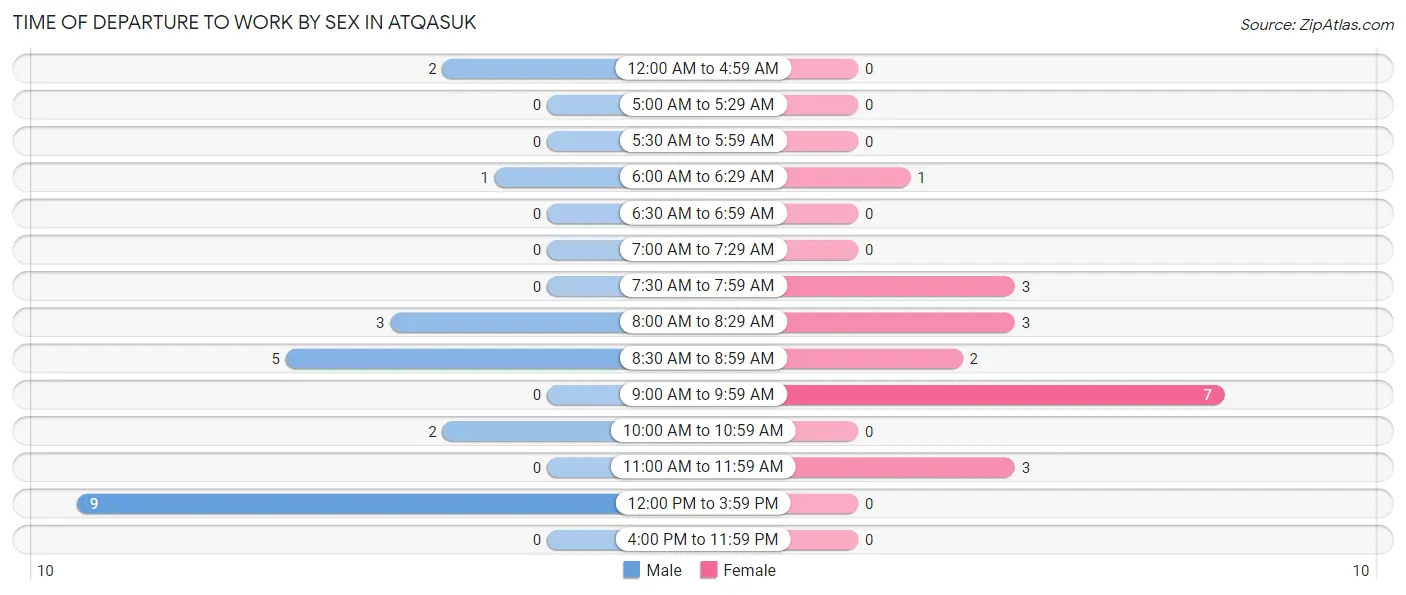
| Time of Departure | Male | Female |
| 12:00 AM to 4:59 AM | 2 (9.1%) | 0 (0.0%) |
| 5:00 AM to 5:29 AM | 0 (0.0%) | 0 (0.0%) |
| 5:30 AM to 5:59 AM | 0 (0.0%) | 0 (0.0%) |
| 6:00 AM to 6:29 AM | 1 (4.5%) | 1 (5.3%) |
| 6:30 AM to 6:59 AM | 0 (0.0%) | 0 (0.0%) |
| 7:00 AM to 7:29 AM | 0 (0.0%) | 0 (0.0%) |
| 7:30 AM to 7:59 AM | 0 (0.0%) | 3 (15.8%) |
| 8:00 AM to 8:29 AM | 3 (13.6%) | 3 (15.8%) |
| 8:30 AM to 8:59 AM | 5 (22.7%) | 2 (10.5%) |
| 9:00 AM to 9:59 AM | 0 (0.0%) | 7 (36.8%) |
| 10:00 AM to 10:59 AM | 2 (9.1%) | 0 (0.0%) |
| 11:00 AM to 11:59 AM | 0 (0.0%) | 3 (15.8%) |
| 12:00 PM to 3:59 PM | 9 (40.9%) | 0 (0.0%) |
| 4:00 PM to 11:59 PM | 0 (0.0%) | 0 (0.0%) |
| Total | 22 (100.0%) | 19 (100.0%) |
Housing Occupancy in Atqasuk
Occupancy by Ownership in Atqasuk
Of the total 33 dwellings in Atqasuk, owner-occupied units account for 23 (69.7%), while renter-occupied units make up 10 (30.3%).
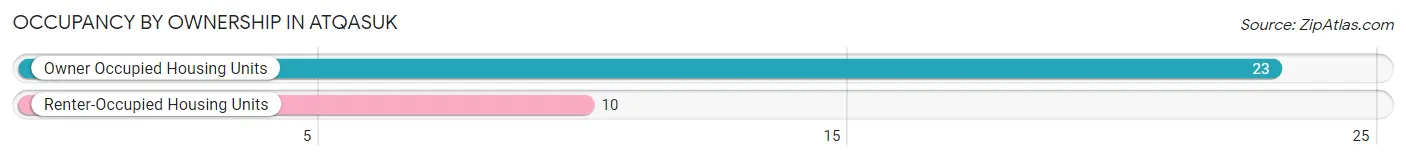
| Occupancy | # Housing Units | % Housing Units |
| Owner Occupied Housing Units | 23 | 69.7% |
| Renter-Occupied Housing Units | 10 | 30.3% |
| Total Occupied Housing Units | 33 | 100.0% |
Occupancy by Household Size in Atqasuk
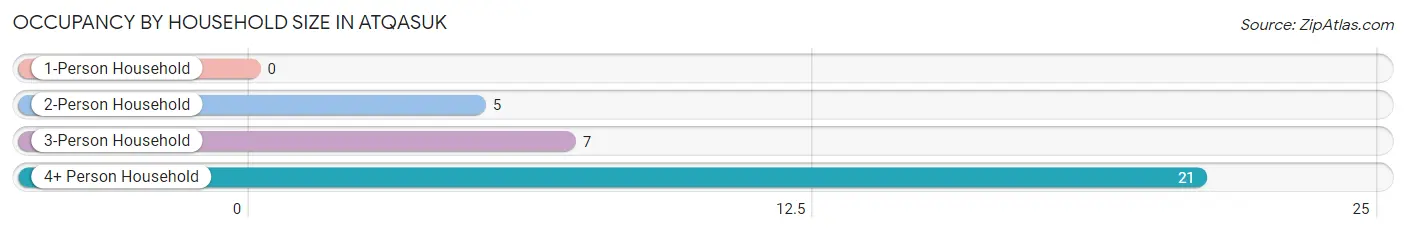
| Household Size | # Housing Units | % Housing Units |
| 1-Person Household | 0 | 0.0% |
| 2-Person Household | 5 | 15.1% |
| 3-Person Household | 7 | 21.2% |
| 4+ Person Household | 21 | 63.6% |
| Total Housing Units | 33 | 100.0% |
Occupancy by Ownership by Household Size in Atqasuk
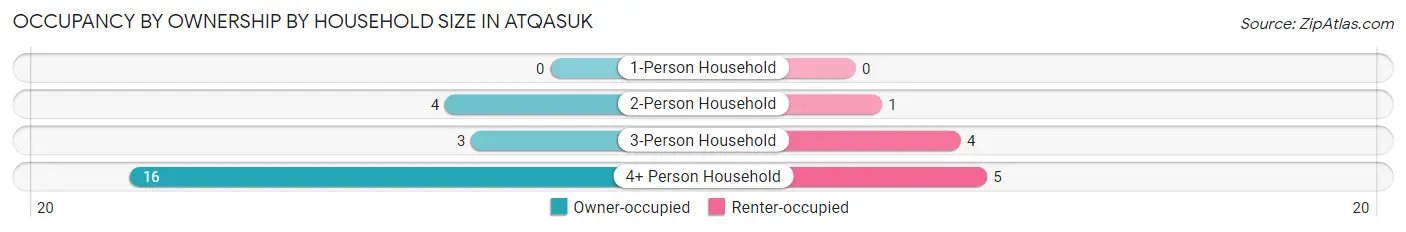
| Household Size | Owner-occupied | Renter-occupied |
| 1-Person Household | 0 (0.0%) | 0 (0.0%) |
| 2-Person Household | 4 (80.0%) | 1 (20.0%) |
| 3-Person Household | 3 (42.9%) | 4 (57.1%) |
| 4+ Person Household | 16 (76.2%) | 5 (23.8%) |
| Total Housing Units | 23 (69.7%) | 10 (30.3%) |
Occupancy by Educational Attainment in Atqasuk
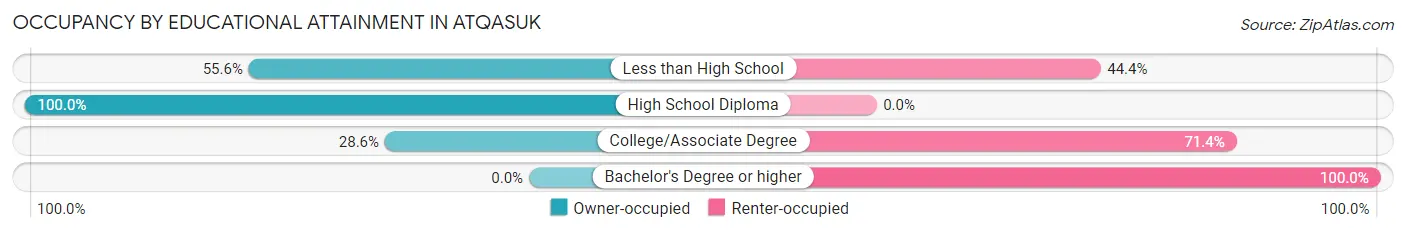
| Household Size | Owner-occupied | Renter-occupied |
| Less than High School | 5 (55.6%) | 4 (44.4%) |
| High School Diploma | 16 (100.0%) | 0 (0.0%) |
| College/Associate Degree | 2 (28.6%) | 5 (71.4%) |
| Bachelor's Degree or higher | 0 (0.0%) | 1 (100.0%) |
Occupancy by Age of Householder in Atqasuk
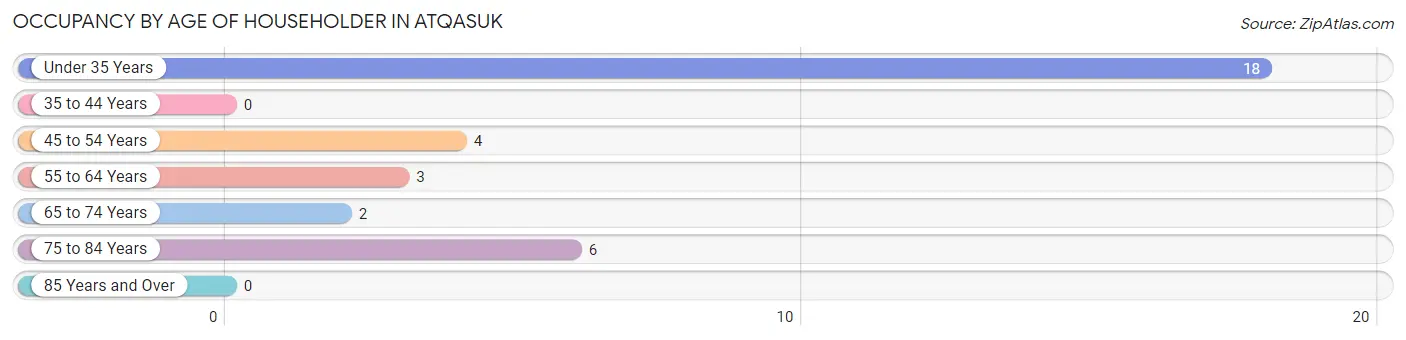
| Age Bracket | # Households | % Households |
| Under 35 Years | 18 | 54.5% |
| 35 to 44 Years | 0 | 0.0% |
| 45 to 54 Years | 4 | 12.1% |
| 55 to 64 Years | 3 | 9.1% |
| 65 to 74 Years | 2 | 6.1% |
| 75 to 84 Years | 6 | 18.2% |
| 85 Years and Over | 0 | 0.0% |
| Total | 33 | 100.0% |
Housing Finances in Atqasuk
Median Income by Occupancy in Atqasuk
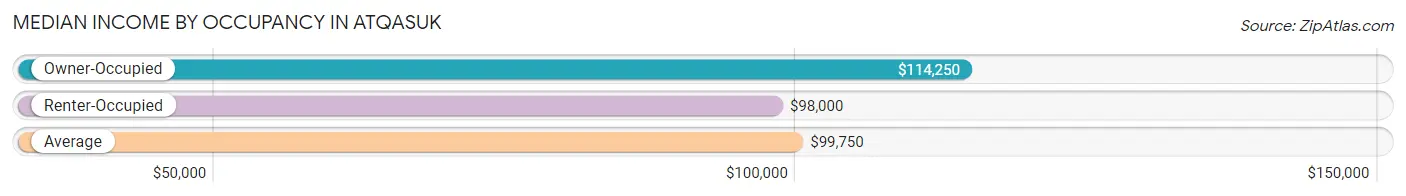
| Occupancy Type | # Households | Median Income |
| Owner-Occupied | 23 (69.7%) | $114,250 |
| Renter-Occupied | 10 (30.3%) | $98,000 |
| Average | 33 (100.0%) | $99,750 |
Occupancy by Householder Income Bracket in Atqasuk
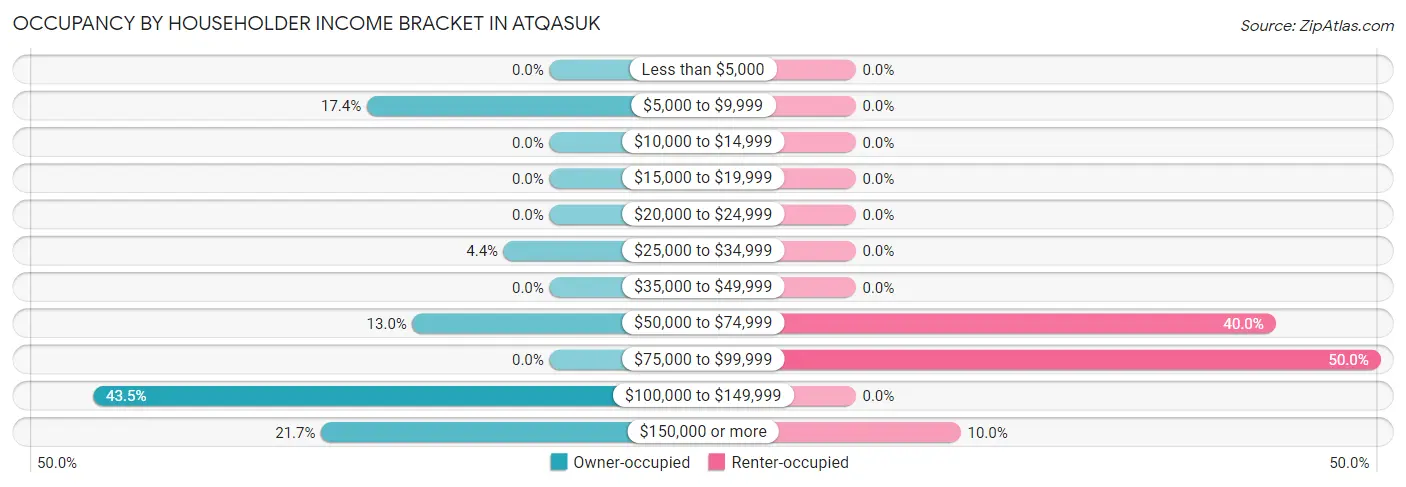
| Income Bracket | Owner-occupied | Renter-occupied |
| Less than $5,000 | 0 (0.0%) | 0 (0.0%) |
| $5,000 to $9,999 | 4 (17.4%) | 0 (0.0%) |
| $10,000 to $14,999 | 0 (0.0%) | 0 (0.0%) |
| $15,000 to $19,999 | 0 (0.0%) | 0 (0.0%) |
| $20,000 to $24,999 | 0 (0.0%) | 0 (0.0%) |
| $25,000 to $34,999 | 1 (4.3%) | 0 (0.0%) |
| $35,000 to $49,999 | 0 (0.0%) | 0 (0.0%) |
| $50,000 to $74,999 | 3 (13.0%) | 4 (40.0%) |
| $75,000 to $99,999 | 0 (0.0%) | 5 (50.0%) |
| $100,000 to $149,999 | 10 (43.5%) | 0 (0.0%) |
| $150,000 or more | 5 (21.7%) | 1 (10.0%) |
| Total | 23 (100.0%) | 10 (100.0%) |
Monthly Housing Cost Tiers in Atqasuk
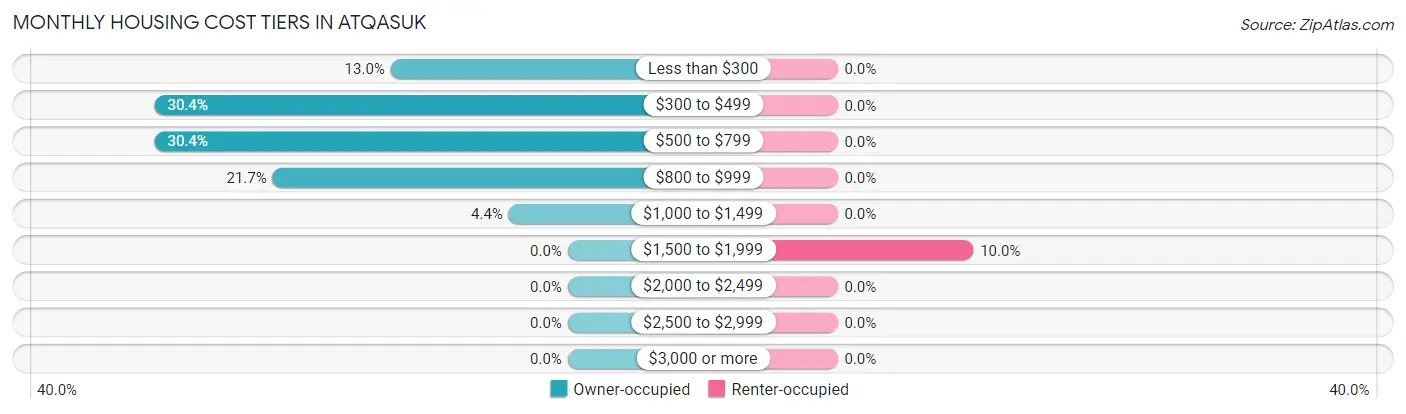
| Monthly Cost | Owner-occupied | Renter-occupied |
| Less than $300 | 3 (13.0%) | 0 (0.0%) |
| $300 to $499 | 7 (30.4%) | 0 (0.0%) |
| $500 to $799 | 7 (30.4%) | 0 (0.0%) |
| $800 to $999 | 5 (21.7%) | 0 (0.0%) |
| $1,000 to $1,499 | 1 (4.3%) | 0 (0.0%) |
| $1,500 to $1,999 | 0 (0.0%) | 1 (10.0%) |
| $2,000 to $2,499 | 0 (0.0%) | 0 (0.0%) |
| $2,500 to $2,999 | 0 (0.0%) | 0 (0.0%) |
| $3,000 or more | 0 (0.0%) | 0 (0.0%) |
| Total | 23 (100.0%) | 10 (100.0%) |
Physical Housing Characteristics in Atqasuk
Housing Structures in Atqasuk
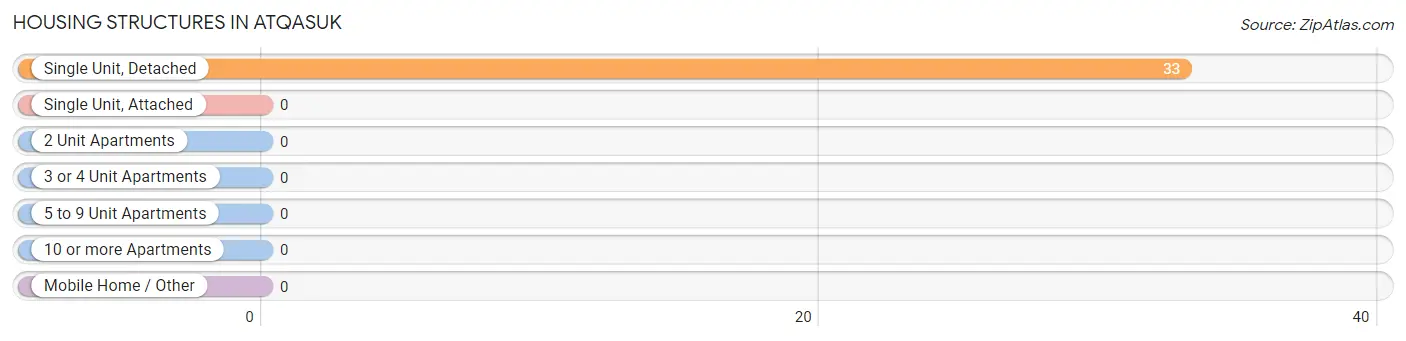
| Structure Type | # Housing Units | % Housing Units |
| Single Unit, Detached | 33 | 100.0% |
| Single Unit, Attached | 0 | 0.0% |
| 2 Unit Apartments | 0 | 0.0% |
| 3 or 4 Unit Apartments | 0 | 0.0% |
| 5 to 9 Unit Apartments | 0 | 0.0% |
| 10 or more Apartments | 0 | 0.0% |
| Mobile Home / Other | 0 | 0.0% |
| Total | 33 | 100.0% |
Housing Structures by Occupancy in Atqasuk
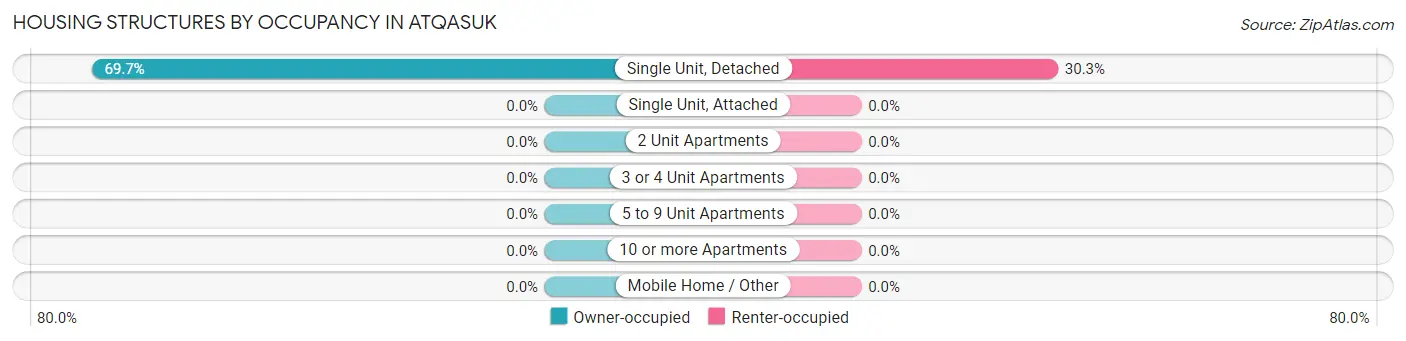
| Structure Type | Owner-occupied | Renter-occupied |
| Single Unit, Detached | 23 (69.7%) | 10 (30.3%) |
| Single Unit, Attached | 0 (0.0%) | 0 (0.0%) |
| 2 Unit Apartments | 0 (0.0%) | 0 (0.0%) |
| 3 or 4 Unit Apartments | 0 (0.0%) | 0 (0.0%) |
| 5 to 9 Unit Apartments | 0 (0.0%) | 0 (0.0%) |
| 10 or more Apartments | 0 (0.0%) | 0 (0.0%) |
| Mobile Home / Other | 0 (0.0%) | 0 (0.0%) |
| Total | 23 (69.7%) | 10 (30.3%) |
Housing Structures by Number of Rooms in Atqasuk
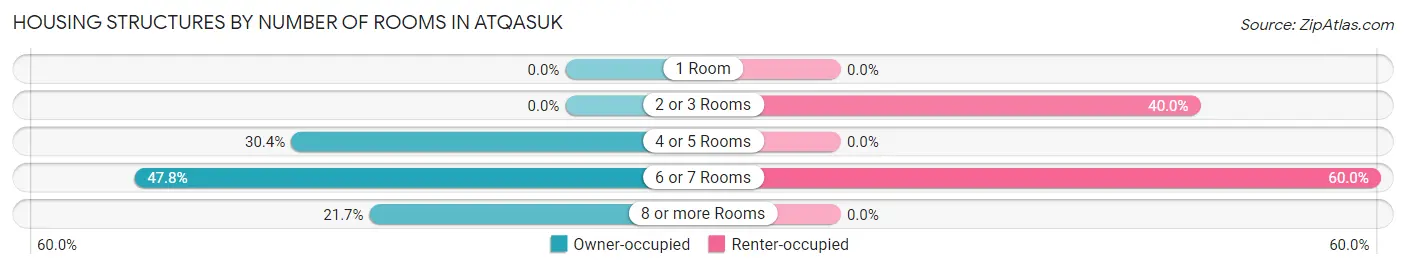
| Number of Rooms | Owner-occupied | Renter-occupied |
| 1 Room | 0 (0.0%) | 0 (0.0%) |
| 2 or 3 Rooms | 0 (0.0%) | 4 (40.0%) |
| 4 or 5 Rooms | 7 (30.4%) | 0 (0.0%) |
| 6 or 7 Rooms | 11 (47.8%) | 6 (60.0%) |
| 8 or more Rooms | 5 (21.7%) | 0 (0.0%) |
| Total | 23 (100.0%) | 10 (100.0%) |
Housing Structure by Heating Type in Atqasuk
| Heating Type | Owner-occupied | Renter-occupied |
| Utility Gas | 0 (0.0%) | 0 (0.0%) |
| Bottled, Tank, or LP Gas | 0 (0.0%) | 0 (0.0%) |
| Electricity | 0 (0.0%) | 0 (0.0%) |
| Fuel Oil or Kerosene | 23 (100.0%) | 10 (100.0%) |
| Coal or Coke | 0 (0.0%) | 0 (0.0%) |
| All other Fuels | 0 (0.0%) | 0 (0.0%) |
| No Fuel Used | 0 (0.0%) | 0 (0.0%) |
| Total | 23 (100.0%) | 10 (100.0%) |
Household Vehicle Usage in Atqasuk
| Vehicles per Household | Owner-occupied | Renter-occupied |
| No Vehicle | 10 (43.5%) | 10 (100.0%) |
| 1 Vehicle | 10 (43.5%) | 0 (0.0%) |
| 2 Vehicles | 3 (13.0%) | 0 (0.0%) |
| 3 or more Vehicles | 0 (0.0%) | 0 (0.0%) |
| Total | 23 (100.0%) | 10 (100.0%) |
Real Estate & Mortgages in Atqasuk
Real Estate and Mortgage Overview in Atqasuk
| Characteristic | Without Mortgage | With Mortgage |
| Housing Units | 17 | 6 |
| Median Property Value | $112,500 | $0 |
| Median Household Income | $114,750 | $2 |
| Monthly Housing Costs | - | - |
| Real Estate Taxes | - | - |
Property Value by Mortgage Status in Atqasuk
| Property Value | Without Mortgage | With Mortgage |
| Less than $50,000 | 2 (11.8%) | 0 (0.0%) |
| $50,000 to $99,999 | 6 (35.3%) | 4 (66.7%) |
| $100,000 to $299,999 | 9 (52.9%) | 2 (33.3%) |
| $300,000 to $499,999 | 0 (0.0%) | 0 (0.0%) |
| $500,000 to $749,999 | 0 (0.0%) | 0 (0.0%) |
| $750,000 to $999,999 | 0 (0.0%) | 0 (0.0%) |
| $1,000,000 or more | 0 (0.0%) | 0 (0.0%) |
| Total | 17 (100.0%) | 6 (100.0%) |
Household Income by Mortgage Status in Atqasuk
| Household Income | Without Mortgage | With Mortgage |
| Less than $10,000 | 0 (0.0%) | 0 (0.0%) |
| $10,000 to $24,999 | 0 (0.0%) | 4 (66.7%) |
| $25,000 to $34,999 | 1 (5.9%) | 0 (0.0%) |
| $35,000 to $49,999 | 0 (0.0%) | 0 (0.0%) |
| $50,000 to $74,999 | 3 (17.6%) | 0 (0.0%) |
| $75,000 to $99,999 | 0 (0.0%) | 0 (0.0%) |
| $100,000 to $149,999 | 10 (58.8%) | 0 (0.0%) |
| $150,000 or more | 3 (17.6%) | 0 (0.0%) |
| Total | 17 (100.0%) | 6 (100.0%) |
Property Value to Household Income Ratio in Atqasuk
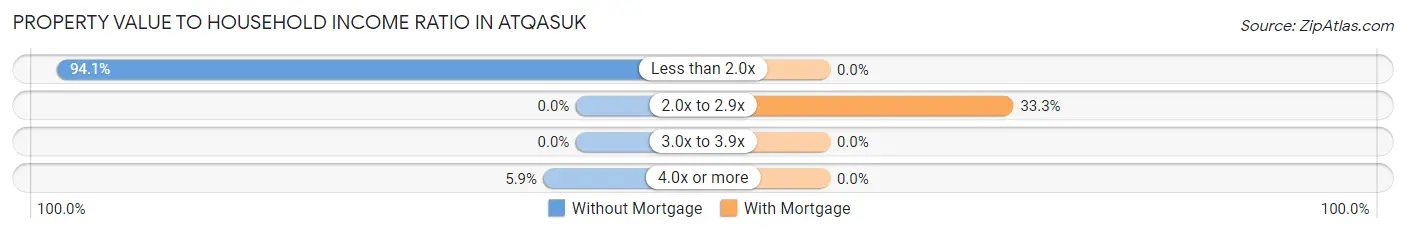
| Value-to-Income Ratio | Without Mortgage | With Mortgage |
| Less than 2.0x | 16 (94.1%) | 0 (0.0%) |
| 2.0x to 2.9x | 0 (0.0%) | 2 (33.3%) |
| 3.0x to 3.9x | 0 (0.0%) | 0 (0.0%) |
| 4.0x or more | 1 (5.9%) | 0 (0.0%) |
| Total | 17 (100.0%) | 6 (100.0%) |
Real Estate Taxes by Mortgage Status in Atqasuk
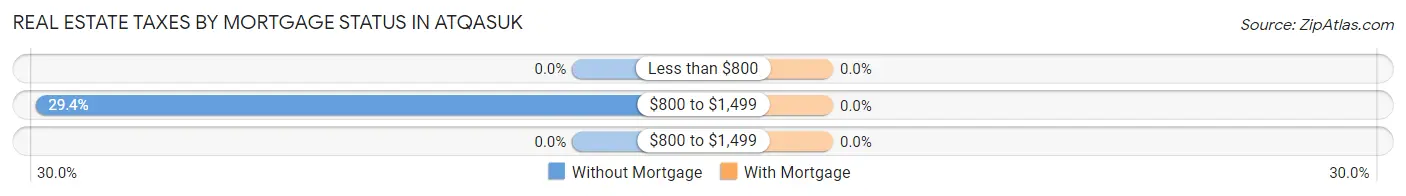
| Property Taxes | Without Mortgage | With Mortgage |
| Less than $800 | 0 (0.0%) | 0 (0.0%) |
| $800 to $1,499 | 5 (29.4%) | 0 (0.0%) |
| $800 to $1,499 | 0 (0.0%) | 0 (0.0%) |
| Total | 17 (100.0%) | 6 (100.0%) |
Health & Disability in Atqasuk
Health Insurance Coverage by Age in Atqasuk
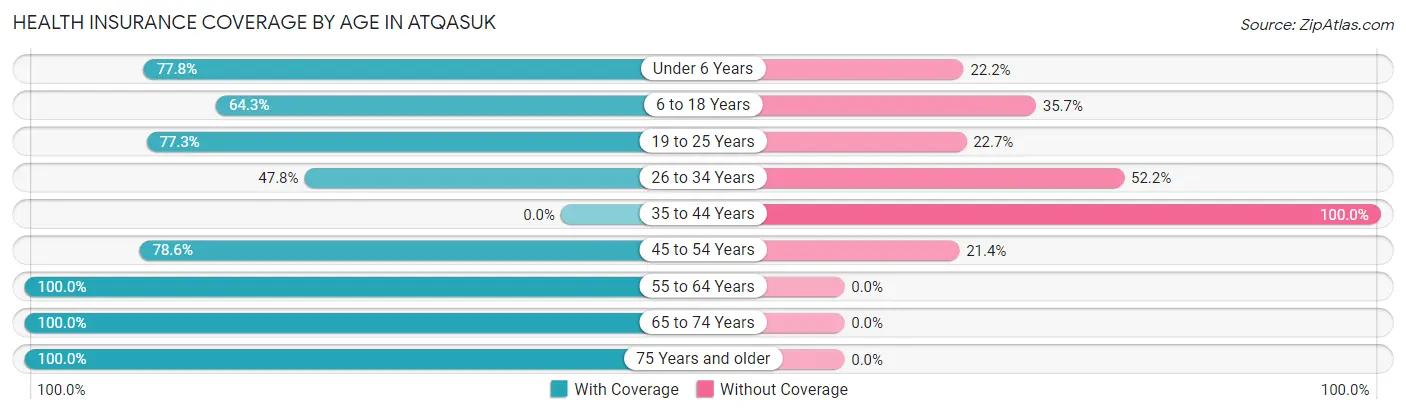
| Age Bracket | With Coverage | Without Coverage |
| Under 6 Years | 14 (77.8%) | 4 (22.2%) |
| 6 to 18 Years | 18 (64.3%) | 10 (35.7%) |
| 19 to 25 Years | 17 (77.3%) | 5 (22.7%) |
| 26 to 34 Years | 11 (47.8%) | 12 (52.2%) |
| 35 to 44 Years | 0 (0.0%) | 3 (100.0%) |
| 45 to 54 Years | 11 (78.6%) | 3 (21.4%) |
| 55 to 64 Years | 3 (100.0%) | 0 (0.0%) |
| 65 to 74 Years | 2 (100.0%) | 0 (0.0%) |
| 75 Years and older | 6 (100.0%) | 0 (0.0%) |
| Total | 82 (68.9%) | 37 (31.1%) |
Health Insurance Coverage by Citizenship Status in Atqasuk
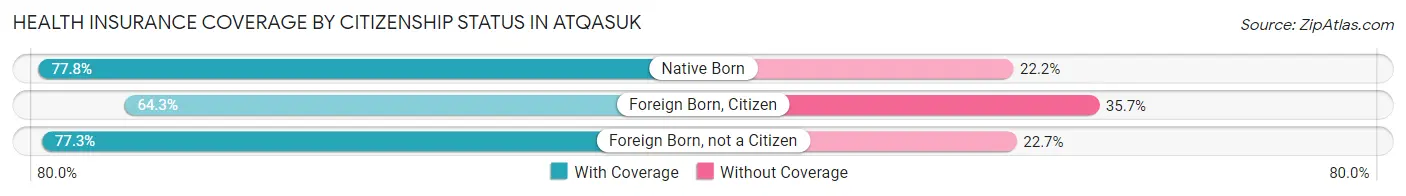
| Citizenship Status | With Coverage | Without Coverage |
| Native Born | 14 (77.8%) | 4 (22.2%) |
| Foreign Born, Citizen | 18 (64.3%) | 10 (35.7%) |
| Foreign Born, not a Citizen | 17 (77.3%) | 5 (22.7%) |
Health Insurance Coverage by Household Income in Atqasuk
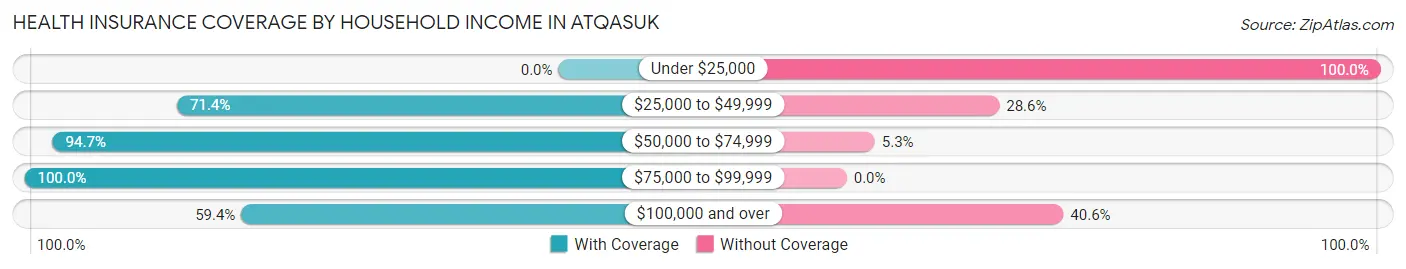
| Household Income | With Coverage | Without Coverage |
| Under $25,000 | 0 (0.0%) | 6 (100.0%) |
| $25,000 to $49,999 | 5 (71.4%) | 2 (28.6%) |
| $50,000 to $74,999 | 18 (94.7%) | 1 (5.3%) |
| $75,000 to $99,999 | 18 (100.0%) | 0 (0.0%) |
| $100,000 and over | 41 (59.4%) | 28 (40.6%) |
Public vs Private Health Insurance Coverage by Age in Atqasuk
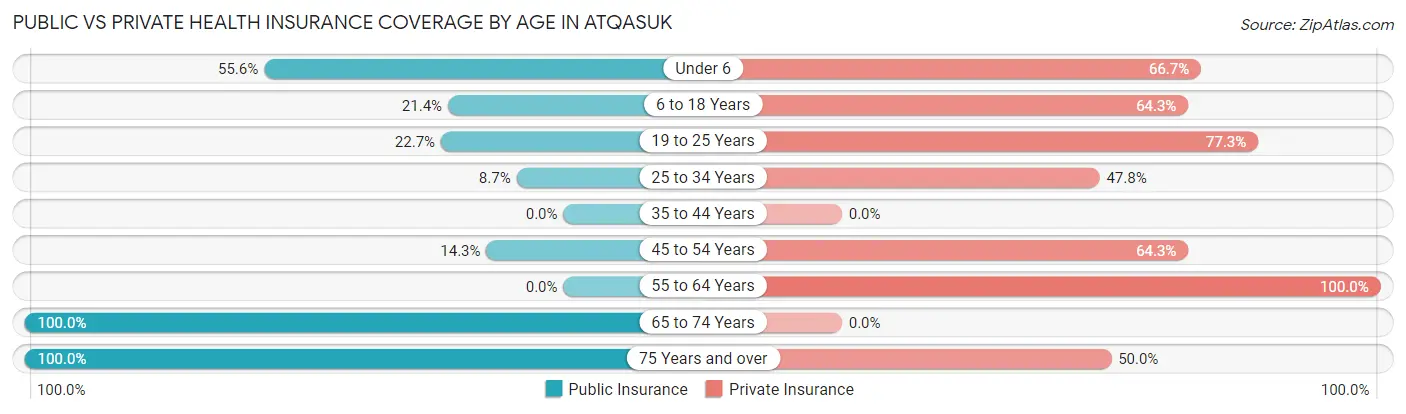
| Age Bracket | Public Insurance | Private Insurance |
| Under 6 | 10 (55.6%) | 12 (66.7%) |
| 6 to 18 Years | 6 (21.4%) | 18 (64.3%) |
| 19 to 25 Years | 5 (22.7%) | 17 (77.3%) |
| 25 to 34 Years | 2 (8.7%) | 11 (47.8%) |
| 35 to 44 Years | 0 (0.0%) | 0 (0.0%) |
| 45 to 54 Years | 2 (14.3%) | 9 (64.3%) |
| 55 to 64 Years | 0 (0.0%) | 3 (100.0%) |
| 65 to 74 Years | 2 (100.0%) | 0 (0.0%) |
| 75 Years and over | 6 (100.0%) | 3 (50.0%) |
| Total | 33 (27.7%) | 73 (61.3%) |
Disability Status by Sex by Age in Atqasuk
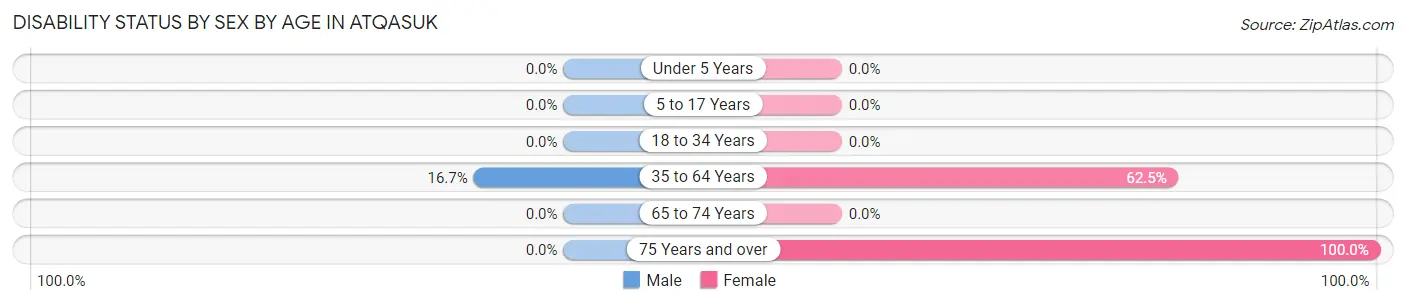
| Age Bracket | Male | Female |
| Under 5 Years | 0 (0.0%) | 0 (0.0%) |
| 5 to 17 Years | 0 (0.0%) | 0 (0.0%) |
| 18 to 34 Years | 0 (0.0%) | 0 (0.0%) |
| 35 to 64 Years | 2 (16.7%) | 5 (62.5%) |
| 65 to 74 Years | 0 (0.0%) | 0 (0.0%) |
| 75 Years and over | 0 (0.0%) | 6 (100.0%) |
Disability Class by Sex by Age in Atqasuk
Disability Class: Hearing Difficulty
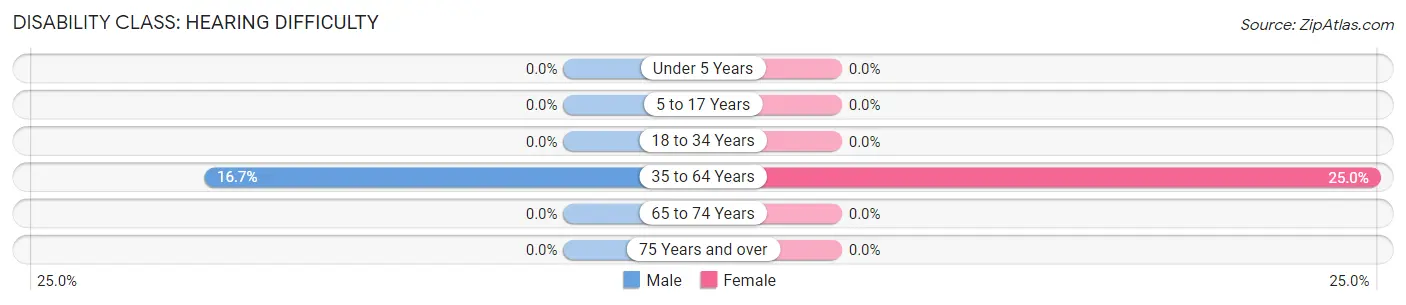
| Age Bracket | Male | Female |
| Under 5 Years | 0 (0.0%) | 0 (0.0%) |
| 5 to 17 Years | 0 (0.0%) | 0 (0.0%) |
| 18 to 34 Years | 0 (0.0%) | 0 (0.0%) |
| 35 to 64 Years | 2 (16.7%) | 2 (25.0%) |
| 65 to 74 Years | 0 (0.0%) | 0 (0.0%) |
| 75 Years and over | 0 (0.0%) | 0 (0.0%) |
Disability Class: Vision Difficulty
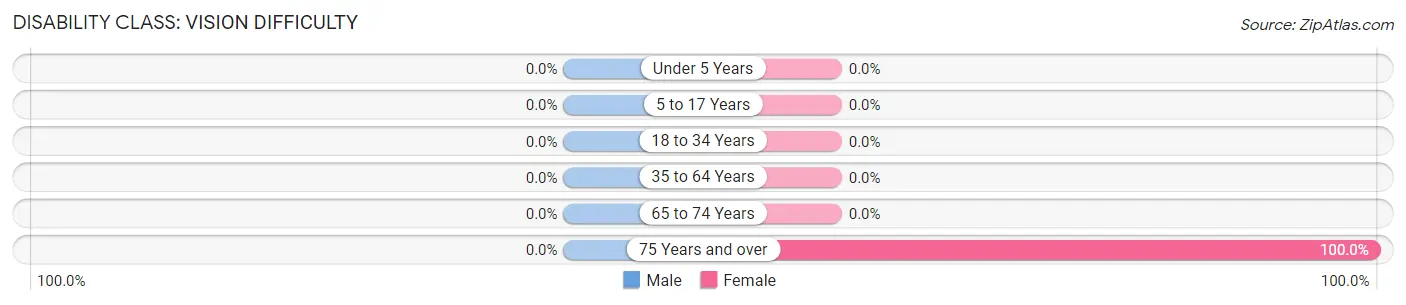
| Age Bracket | Male | Female |
| Under 5 Years | 0 (0.0%) | 0 (0.0%) |
| 5 to 17 Years | 0 (0.0%) | 0 (0.0%) |
| 18 to 34 Years | 0 (0.0%) | 0 (0.0%) |
| 35 to 64 Years | 0 (0.0%) | 0 (0.0%) |
| 65 to 74 Years | 0 (0.0%) | 0 (0.0%) |
| 75 Years and over | 0 (0.0%) | 6 (100.0%) |
Disability Class: Cognitive Difficulty
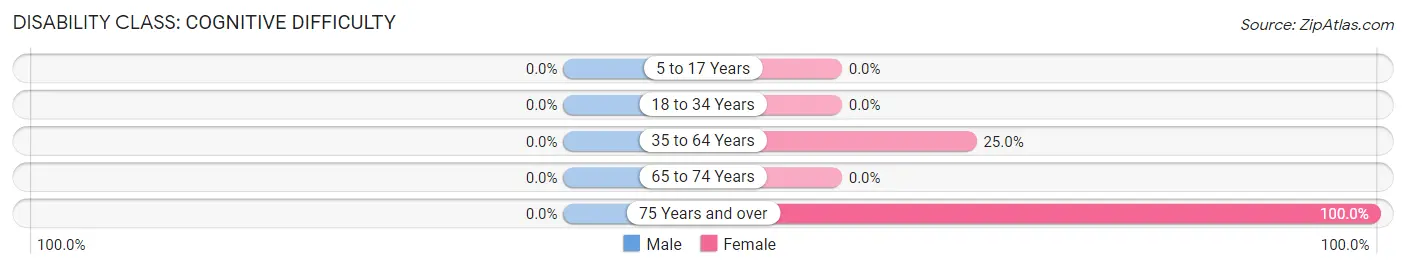
| Age Bracket | Male | Female |
| 5 to 17 Years | 0 (0.0%) | 0 (0.0%) |
| 18 to 34 Years | 0 (0.0%) | 0 (0.0%) |
| 35 to 64 Years | 0 (0.0%) | 2 (25.0%) |
| 65 to 74 Years | 0 (0.0%) | 0 (0.0%) |
| 75 Years and over | 0 (0.0%) | 6 (100.0%) |
Disability Class: Ambulatory Difficulty
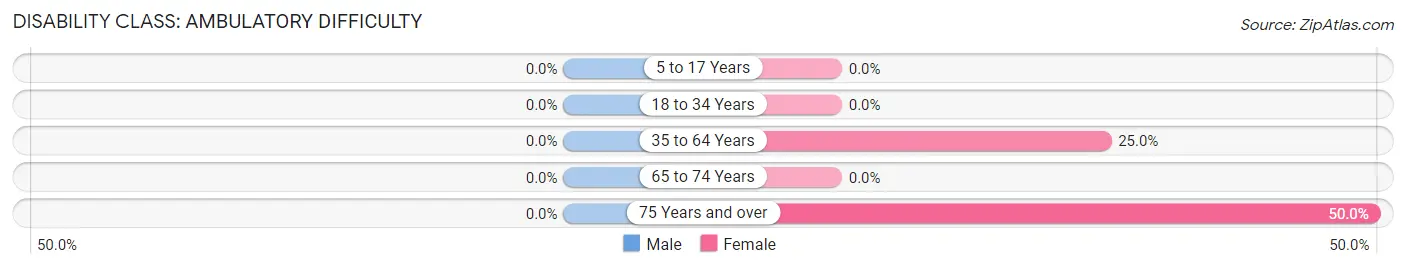
| Age Bracket | Male | Female |
| 5 to 17 Years | 0 (0.0%) | 0 (0.0%) |
| 18 to 34 Years | 0 (0.0%) | 0 (0.0%) |
| 35 to 64 Years | 0 (0.0%) | 2 (25.0%) |
| 65 to 74 Years | 0 (0.0%) | 0 (0.0%) |
| 75 Years and over | 0 (0.0%) | 3 (50.0%) |
Disability Class: Self-Care Difficulty
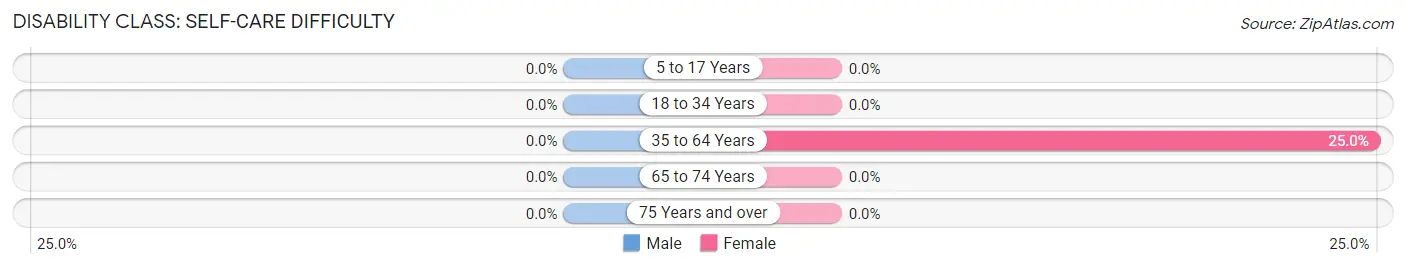
| Age Bracket | Male | Female |
| 5 to 17 Years | 0 (0.0%) | 0 (0.0%) |
| 18 to 34 Years | 0 (0.0%) | 0 (0.0%) |
| 35 to 64 Years | 0 (0.0%) | 2 (25.0%) |
| 65 to 74 Years | 0 (0.0%) | 0 (0.0%) |
| 75 Years and over | 0 (0.0%) | 0 (0.0%) |
Technology Access in Atqasuk
Computing Device Access in Atqasuk
| Device Type | # Households | % Households |
| Desktop or Laptop | 21 | 63.6% |
| Smartphone | 33 | 100.0% |
| Tablet | 25 | 75.8% |
| No Computing Device | 0 | 0.0% |
| Total | 33 | 100.0% |
Internet Access in Atqasuk
| Internet Type | # Households | % Households |
| Dial-Up Internet | 0 | 0.0% |
| Broadband Home | 15 | 45.5% |
| Cellular Data Only | 11 | 33.3% |
| Satellite Internet | 13 | 39.4% |
| No Internet | 3 | 9.1% |
| Total | 33 | 100.0% |
Atqasuk Summary
Atqasuk is a small Inupiat Eskimo village located on the northern coast of Alaska, in the North Slope Borough. It is situated on the Chukchi Sea, just south of the Arctic National Wildlife Refuge. The village is home to approximately 200 people, and is the northernmost community in the United States.
Geography
Atqasuk is located on the northern coast of Alaska, in the North Slope Borough. It is situated on the Chukchi Sea, just south of the Arctic National Wildlife Refuge. The village is located on a small, flat plain, surrounded by low hills and mountains. The terrain is mostly tundra, with some areas of permafrost. The climate is cold and dry, with temperatures ranging from -20 to 70 degrees Fahrenheit.
The village is accessible by air and sea. The closest airport is located in Barrow, about 40 miles away. There is also a small airstrip in Atqasuk, which is used for local flights. The village is also accessible by boat, with the nearest port located in Wainwright, about 30 miles away.
History
Atqasuk has been inhabited by the Inupiat Eskimos for centuries. The village was first recorded in the early 1900s, when it was used as a trading post for the Inupiat people. In the 1950s, the village was relocated to its current location, due to the construction of the Trans-Alaska Pipeline.
The village has been a part of the North Slope Borough since its formation in 1972. In the 1980s, the village was connected to the rest of Alaska by the Dalton Highway, which runs from Fairbanks to Prudhoe Bay.
Economy
Atqasuk is a subsistence-based economy, with most of the population relying on hunting, fishing, and gathering for their livelihood. The village is also home to a small commercial fishing industry, which provides employment for some of the residents.
The village is also home to a small tourism industry, with visitors coming to experience the unique culture and environment of the Arctic. The village is also home to a small oil and gas industry, which provides employment for some of the residents.
Demographics
Atqasuk is home to approximately 200 people, most of whom are Inupiat Eskimos. The population is predominantly young, with a median age of 24. The village is also home to a small number of non-native residents, mostly from the United States and Canada.
The village is served by a single school, which provides education for students from kindergarten through high school. The village also has a small health clinic, which provides basic medical care for the residents.
Atqasuk is a small, isolated village, but it is an important part of the North Slope Borough. The village is home to a unique culture and environment, and is an important part of the history and heritage of the Inupiat people.
Common Questions
What is Per Capita Income in Atqasuk?
Per Capita income in Atqasuk is $23,804.
What is the Median Family Income in Atqasuk?
Median Family Income in Atqasuk is $52,083.
What is the Median Household income in Atqasuk?
Median Household Income in Atqasuk is $99,750.
What is Income or Wage Gap in Atqasuk?
Income or Wage Gap in Atqasuk is 60.6%.
Women in Atqasuk earn 39.4 cents for every dollar earned by a man.
What is Inequality or Gini Index in Atqasuk?
Inequality or Gini Index in Atqasuk is 0.30.
What is the Total Population of Atqasuk?
Total Population of Atqasuk is 119.
What is the Total Male Population of Atqasuk?
Total Male Population of Atqasuk is 63.
What is the Total Female Population of Atqasuk?
Total Female Population of Atqasuk is 56.
What is the Ratio of Males per 100 Females in Atqasuk?
There are 112.50 Males per 100 Females in Atqasuk.
What is the Ratio of Females per 100 Males in Atqasuk?
There are 88.89 Females per 100 Males in Atqasuk.
What is the Median Population Age in Atqasuk?
Median Population Age in Atqasuk is 23.6 Years.
What is the Average Family Size in Atqasuk
Average Family Size in Atqasuk is 3.1 People.
What is the Average Household Size in Atqasuk
Average Household Size in Atqasuk is 3.6 People.
How Large is the Labor Force in Atqasuk?
There are 50 People in the Labor Forcein in Atqasuk.
What is the Percentage of People in the Labor Force in Atqasuk?
61.7% of People are in the Labor Force in Atqasuk.
What is the Unemployment Rate in Atqasuk?
Unemployment Rate in Atqasuk is 8.0%.