Clark s Point, AK Map & Demographics
Clark s Point Map
Clark s Point Overview
$11,397
PER CAPITA INCOME
$23,333
AVG HOUSEHOLD INCOME
0.43
INEQUALITY / GINI INDEX
31
TOTAL POPULATION
11
MALE POPULATION
20
FEMALE POPULATION
55.00
MALES / 100 FEMALES
181.82
FEMALES / 100 MALES
24.8
MEDIAN AGE
4.8
AVG FAMILY SIZE
3.1
AVG HOUSEHOLD SIZE
12
LABOR FORCE [ PEOPLE ]
66.7%
PERCENT IN LABOR FORCE
25.0%
UNEMPLOYMENT RATE
Income in Clark s Point
Income Overview in Clark s Point
| Characteristic | Number | Measure |
| Per Capita Income | 31 | $11,397 |
| Median Family Income | 4 | $0 |
| Mean Family Income | 4 | $0 |
| Median Household Income | 10 | $23,333 |
| Mean Household Income | 10 | $31,660 |
| Income Deficit | 4 | $0 |
| Wage / Income Gap (%) | 31 | 0.00% |
| Wage / Income Gap ($) | 31 | 100.00¢ per $1 |
| Gini / Inequality Index | 31 | 0.43 |
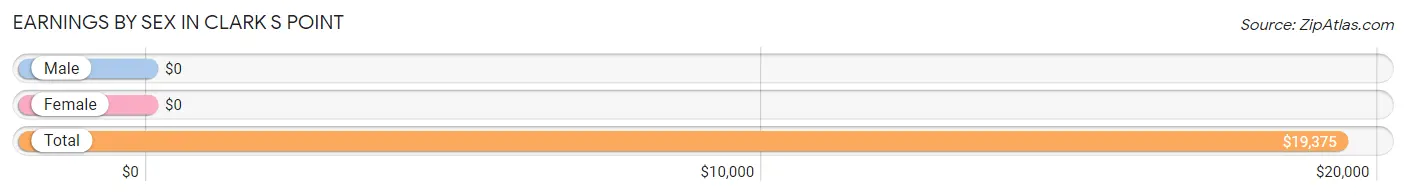
Earnings by Sex in Clark s Point
| Sex | Number | Average Earnings |
| Male | 4 (44.4%) | $0 |
| Female | 5 (55.6%) | $0 |
| Total | 9 (100.0%) | $19,375 |
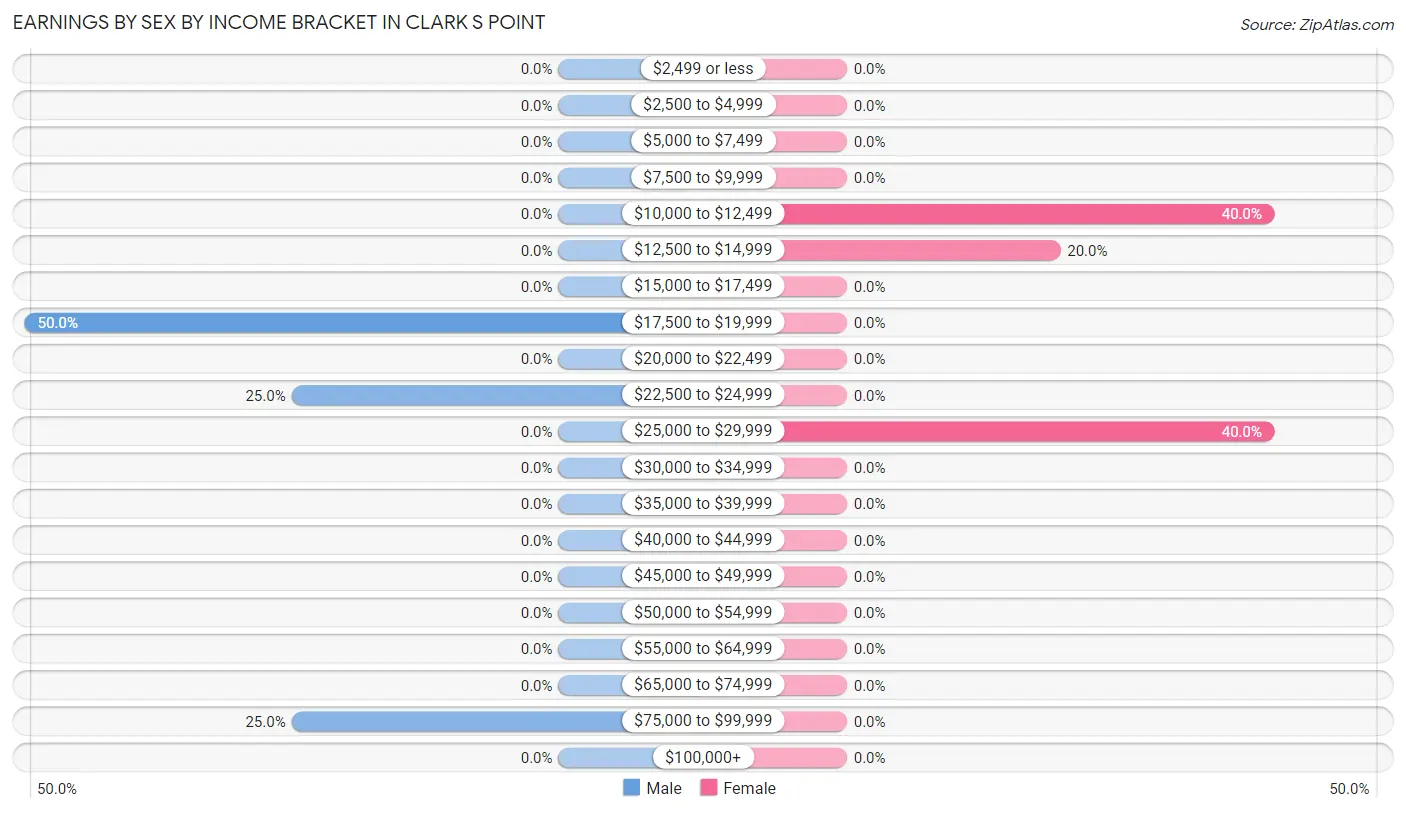
Earnings by Sex by Income Bracket in Clark s Point
The most common earnings brackets in Clark s Point are $17,500 to $19,999 for men (2 | 50.0%) and $10,000 to $12,499 for women (2 | 40.0%).
| Income | Male | Female |
| $2,499 or less | 0 (0.0%) | 0 (0.0%) |
| $2,500 to $4,999 | 0 (0.0%) | 0 (0.0%) |
| $5,000 to $7,499 | 0 (0.0%) | 0 (0.0%) |
| $7,500 to $9,999 | 0 (0.0%) | 0 (0.0%) |
| $10,000 to $12,499 | 0 (0.0%) | 2 (40.0%) |
| $12,500 to $14,999 | 0 (0.0%) | 1 (20.0%) |
| $15,000 to $17,499 | 0 (0.0%) | 0 (0.0%) |
| $17,500 to $19,999 | 2 (50.0%) | 0 (0.0%) |
| $20,000 to $22,499 | 0 (0.0%) | 0 (0.0%) |
| $22,500 to $24,999 | 1 (25.0%) | 0 (0.0%) |
| $25,000 to $29,999 | 0 (0.0%) | 2 (40.0%) |
| $30,000 to $34,999 | 0 (0.0%) | 0 (0.0%) |
| $35,000 to $39,999 | 0 (0.0%) | 0 (0.0%) |
| $40,000 to $44,999 | 0 (0.0%) | 0 (0.0%) |
| $45,000 to $49,999 | 0 (0.0%) | 0 (0.0%) |
| $50,000 to $54,999 | 0 (0.0%) | 0 (0.0%) |
| $55,000 to $64,999 | 0 (0.0%) | 0 (0.0%) |
| $65,000 to $74,999 | 0 (0.0%) | 0 (0.0%) |
| $75,000 to $99,999 | 1 (25.0%) | 0 (0.0%) |
| $100,000+ | 0 (0.0%) | 0 (0.0%) |
| Total | 4 (100.0%) | 5 (100.0%) |
Earnings by Sex by Educational Attainment in Clark s Point
| Educational Attainment | Male Income | Female Income |
| Less than High School | - | - |
| High School Diploma | - | - |
| College or Associate's Degree | - | - |
| Bachelor's Degree | - | - |
| Graduate Degree | - | - |
| Total | - | - |
Family Income in Clark s Point
Family Income Brackets in Clark s Point
According to the Clark s Point family income data, there are 3 families falling into the less than $10,000 income range, which is the most common income bracket and makes up 75.0% of all families.
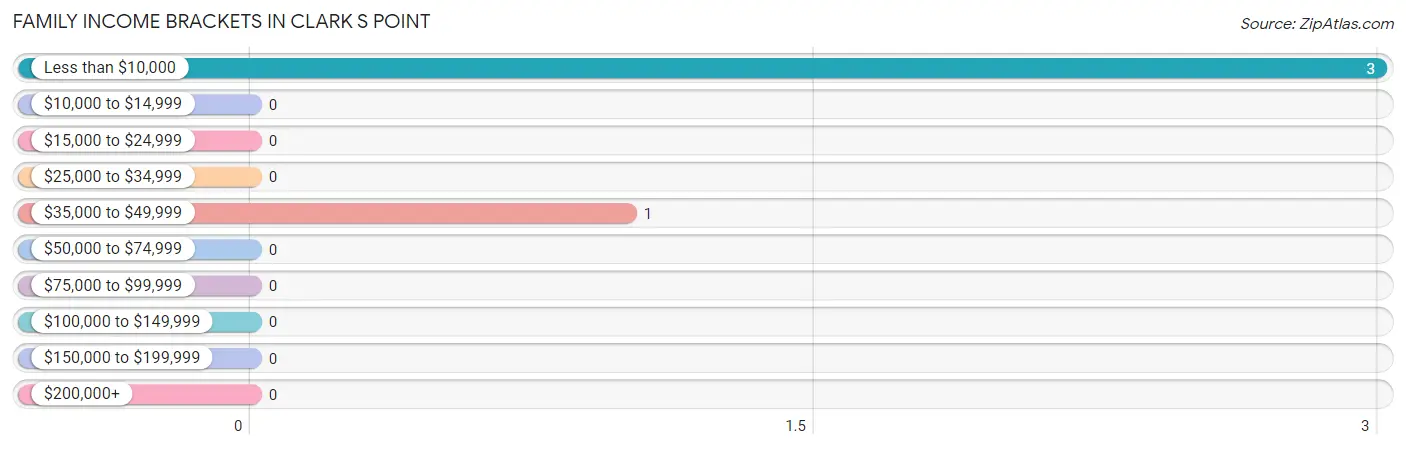
| Income Bracket | # Families | % Families |
| Less than $10,000 | 3 | 75.0% |
| $10,000 to $14,999 | 0 | 0.0% |
| $15,000 to $24,999 | 0 | 0.0% |
| $25,000 to $34,999 | 0 | 0.0% |
| $35,000 to $49,999 | 1 | 25.0% |
| $50,000 to $74,999 | 0 | 0.0% |
| $75,000 to $99,999 | 0 | 0.0% |
| $100,000 to $149,999 | 0 | 0.0% |
| $150,000 to $199,999 | 0 | 0.0% |
| $200,000+ | 0 | 0.0% |
Family Income by Famaliy Size in Clark s Point
| Income Bracket | # Families | Median Income |
| 2-Person Families | 0 (0.0%) | $0 |
| 3-Person Families | 0 (0.0%) | $0 |
| 4-Person Families | 3 (75.0%) | $0 |
| 5-Person Families | 0 (0.0%) | $0 |
| 6-Person Families | 1 (25.0%) | $0 |
| 7+ Person Families | 0 (0.0%) | $0 |
| Total | 4 (100.0%) | $0 |
Family Income by Number of Earners in Clark s Point
| Number of Earners | # Families | Median Income |
| No Earners | 3 (75.0%) | $0 |
| 1 Earner | 0 (0.0%) | $0 |
| 2 Earners | 1 (25.0%) | $0 |
| 3+ Earners | 0 (0.0%) | $0 |
| Total | 4 (100.0%) | $0 |
Household Income in Clark s Point
Household Income Brackets in Clark s Point
With 5 households falling in the category, the $15,000 to $24,999 income range is the most frequent in Clark s Point, accounting for 50.0% of all households.
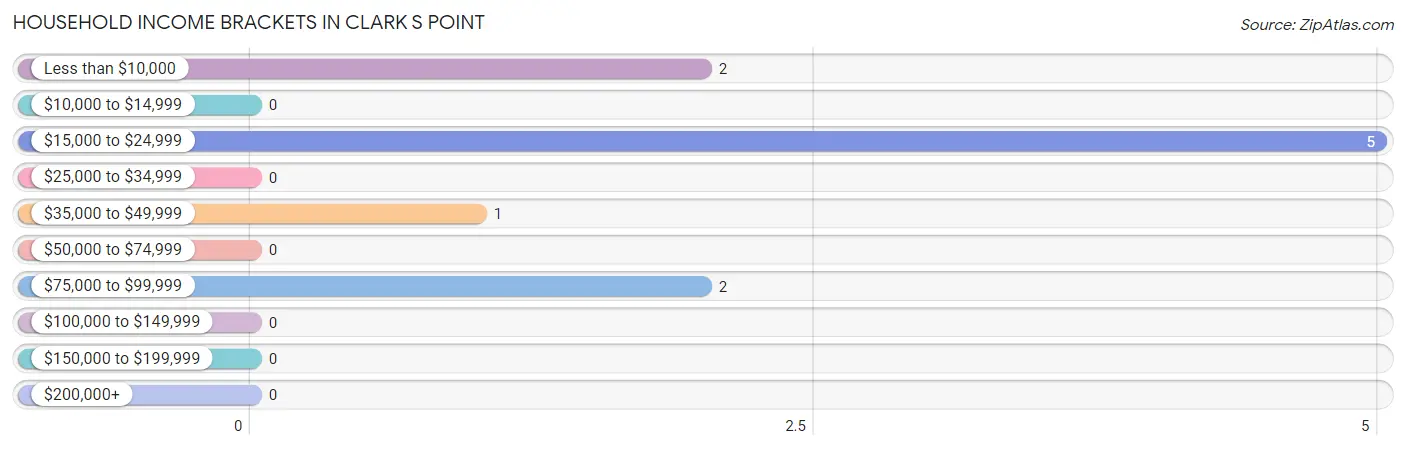
| Income Bracket | # Households | % Households |
| Less than $10,000 | 2 | 20.0% |
| $10,000 to $14,999 | 0 | 0.0% |
| $15,000 to $24,999 | 5 | 50.0% |
| $25,000 to $34,999 | 0 | 0.0% |
| $35,000 to $49,999 | 1 | 10.0% |
| $50,000 to $74,999 | 0 | 0.0% |
| $75,000 to $99,999 | 2 | 20.0% |
| $100,000 to $149,999 | 0 | 0.0% |
| $150,000 to $199,999 | 0 | 0.0% |
| $200,000+ | 0 | 0.0% |
Household Income by Householder Age in Clark s Point
| Income Bracket | # Households | Median Income |
| 15 to 24 Years | 3 (30.0%) | $0 |
| 25 to 44 Years | 2 (20.0%) | $0 |
| 45 to 64 Years | 2 (20.0%) | $0 |
| 65+ Years | 3 (30.0%) | $0 |
| Total | 10 (100.0%) | $23,333 |
Poverty in Clark s Point
Income Below Poverty by Sex and Age in Clark s Point
With 55.6% poverty level for males and 80.0% for females among the residents of Clark s Point, under 5 year old males and under 5 year old females are the most vulnerable to poverty, with 2 males (100.0%) and 2 females (100.0%) in their respective age groups living below the poverty level.
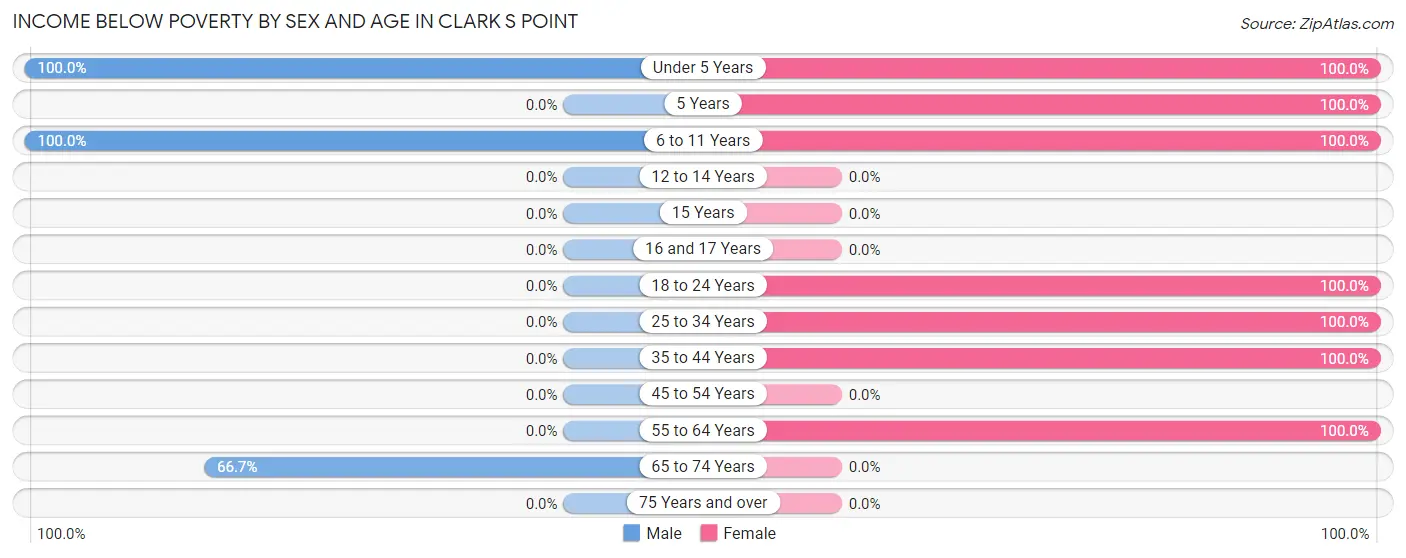
| Age Bracket | Male | Female |
| Under 5 Years | 2 (100.0%) | 2 (100.0%) |
| 5 Years | 0 (0.0%) | 2 (100.0%) |
| 6 to 11 Years | 1 (100.0%) | 4 (100.0%) |
| 12 to 14 Years | 0 (0.0%) | 0 (0.0%) |
| 15 Years | 0 (0.0%) | 0 (0.0%) |
| 16 and 17 Years | 0 (0.0%) | 0 (0.0%) |
| 18 to 24 Years | 0 (0.0%) | 3 (100.0%) |
| 25 to 34 Years | 0 (0.0%) | 2 (100.0%) |
| 35 to 44 Years | 0 (0.0%) | 2 (100.0%) |
| 45 to 54 Years | 0 (0.0%) | 0 (0.0%) |
| 55 to 64 Years | 0 (0.0%) | 1 (100.0%) |
| 65 to 74 Years | 2 (66.7%) | 0 (0.0%) |
| 75 Years and over | 0 (0.0%) | 0 (0.0%) |
| Total | 5 (55.6%) | 16 (80.0%) |
Income Above Poverty by Sex and Age in Clark s Point
According to the poverty statistics in Clark s Point, males aged 25 to 34 years and females aged 45 to 54 years are the age groups that are most secure financially, with 100.0% of males and 100.0% of females in these age groups living above the poverty line.
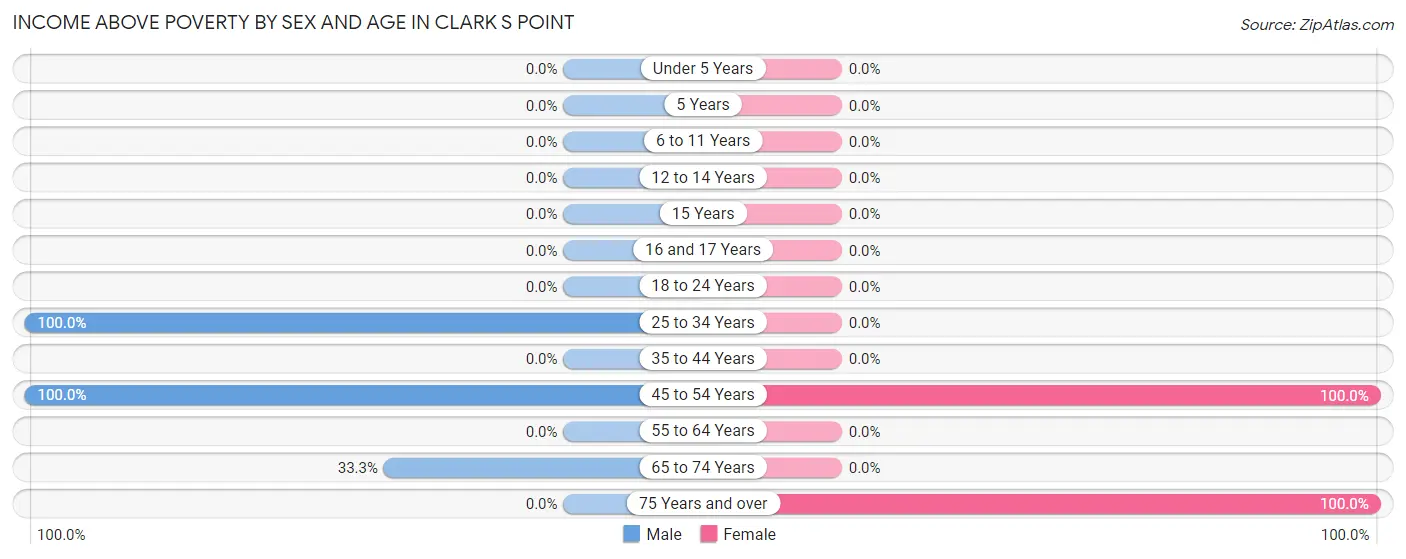
| Age Bracket | Male | Female |
| Under 5 Years | 0 (0.0%) | 0 (0.0%) |
| 5 Years | 0 (0.0%) | 0 (0.0%) |
| 6 to 11 Years | 0 (0.0%) | 0 (0.0%) |
| 12 to 14 Years | 0 (0.0%) | 0 (0.0%) |
| 15 Years | 0 (0.0%) | 0 (0.0%) |
| 16 and 17 Years | 0 (0.0%) | 0 (0.0%) |
| 18 to 24 Years | 0 (0.0%) | 0 (0.0%) |
| 25 to 34 Years | 2 (100.0%) | 0 (0.0%) |
| 35 to 44 Years | 0 (0.0%) | 0 (0.0%) |
| 45 to 54 Years | 1 (100.0%) | 2 (100.0%) |
| 55 to 64 Years | 0 (0.0%) | 0 (0.0%) |
| 65 to 74 Years | 1 (33.3%) | 0 (0.0%) |
| 75 Years and over | 0 (0.0%) | 2 (100.0%) |
| Total | 4 (44.4%) | 4 (20.0%) |
Income Below Poverty Among Married-Couple Families in Clark s Point
The poverty statistics for married-couple families in Clark s Point show that 100.0% or 1 of the total 1 families live below the poverty line. Families with 3 or 4 children have the highest poverty rate of 100.0%, comprising of 1 families. On the other hand, families with 3 or 4 children have the lowest poverty rate of 100.0%, which includes 1 families.
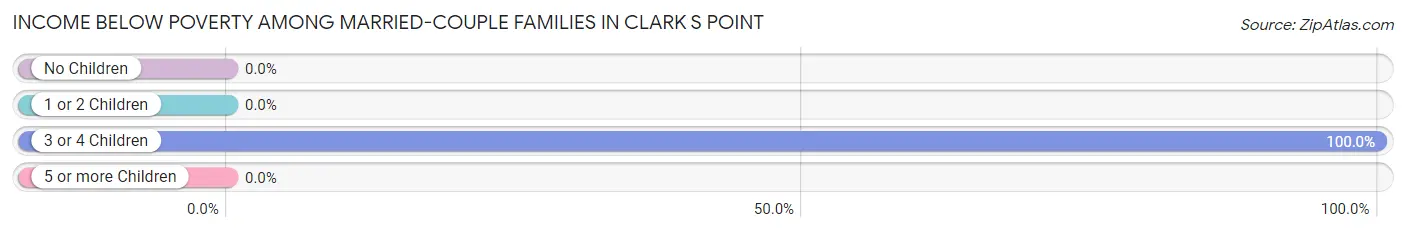
| Children | Above Poverty | Below Poverty |
| No Children | 0 (0.0%) | 0 (0.0%) |
| 1 or 2 Children | 0 (0.0%) | 0 (0.0%) |
| 3 or 4 Children | 0 (0.0%) | 1 (100.0%) |
| 5 or more Children | 0 (0.0%) | 0 (0.0%) |
| Total | 0 (0.0%) | 1 (100.0%) |
Income Below Poverty Among Single-Parent Households in Clark s Point
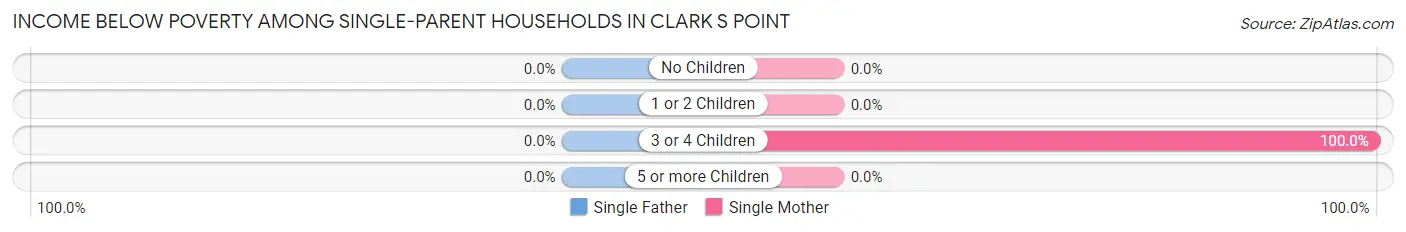
| Children | Single Father | Single Mother |
| No Children | 0 (0.0%) | 0 (0.0%) |
| 1 or 2 Children | 0 (0.0%) | 0 (0.0%) |
| 3 or 4 Children | 0 (0.0%) | 3 (100.0%) |
| 5 or more Children | 0 (0.0%) | 0 (0.0%) |
| Total | 0 (0.0%) | 3 (100.0%) |
Income Below Poverty Among Married-Couple vs Single-Parent Households in Clark s Point
The poverty data for Clark s Point shows that 1 of the married-couple family households (100.0%) and 3 of the single-parent households (100.0%) are living below the poverty level. Within the married-couple family households, those with 3 or 4 children have the highest poverty rate, with 1 households (100.0%) falling below the poverty line. Among the single-parent households, those with 3 or 4 children have the highest poverty rate, with 3 household (100.0%) living below poverty.
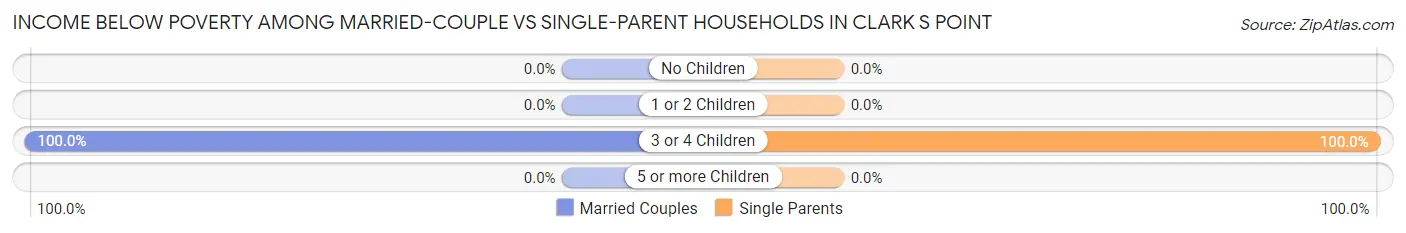
| Children | Married-Couple Families | Single-Parent Households |
| No Children | 0 (0.0%) | 0 (0.0%) |
| 1 or 2 Children | 0 (0.0%) | 0 (0.0%) |
| 3 or 4 Children | 1 (100.0%) | 3 (100.0%) |
| 5 or more Children | 0 (0.0%) | 0 (0.0%) |
| Total | 1 (100.0%) | 3 (100.0%) |
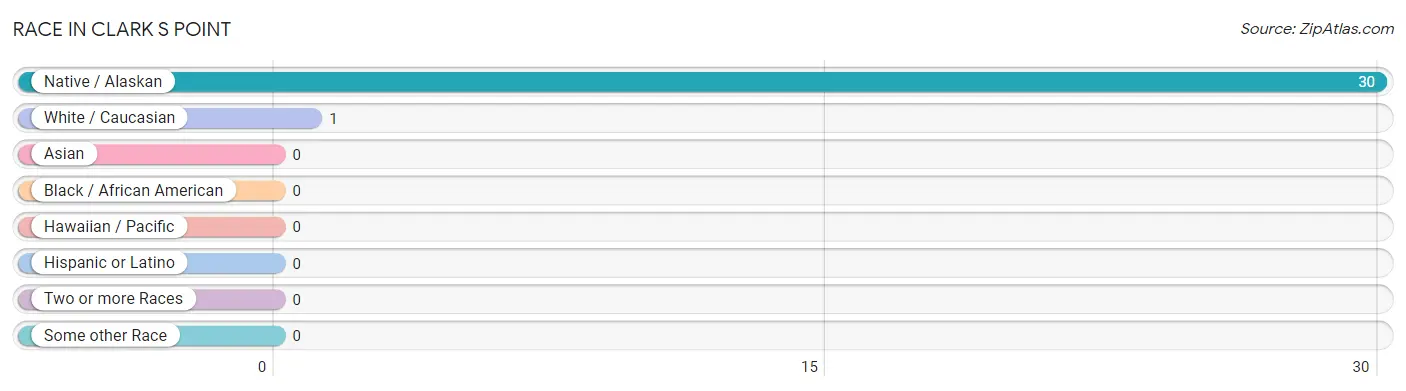
Race in Clark s Point
The most populous races in Clark s Point are Native / Alaskan (30 | 96.8%), and White / Caucasian (1 | 3.2%).
| Race | # Population | % Population |
| Asian | 0 | 0.0% |
| Black / African American | 0 | 0.0% |
| Hawaiian / Pacific | 0 | 0.0% |
| Hispanic or Latino | 0 | 0.0% |
| Native / Alaskan | 30 | 96.8% |
| White / Caucasian | 1 | 3.2% |
| Two or more Races | 0 | 0.0% |
| Some other Race | 0 | 0.0% |
| Total | 31 | 100.0% |
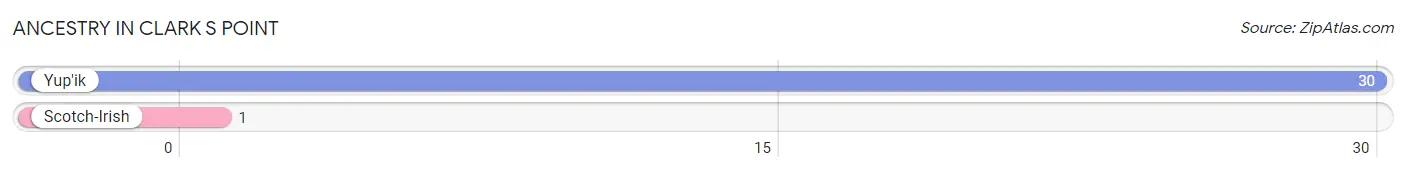
Ancestry in Clark s Point
The most populous ancestries reported in Clark s Point are Yup'ik (30 | 96.8%), and Scotch-Irish (1 | 3.2%), together accounting for 100.0% of all Clark s Point residents.
| Ancestry | # Population | % Population |
| Scotch-Irish | 1 | 3.2% |
| Yup'ik | 30 | 96.8% | View All 2 Rows |
Immigrants in Clark s Point

| Immigration Origin | # Population | % Population | View All 0 Rows |
Sex and Age in Clark s Point
Sex and Age in Clark s Point
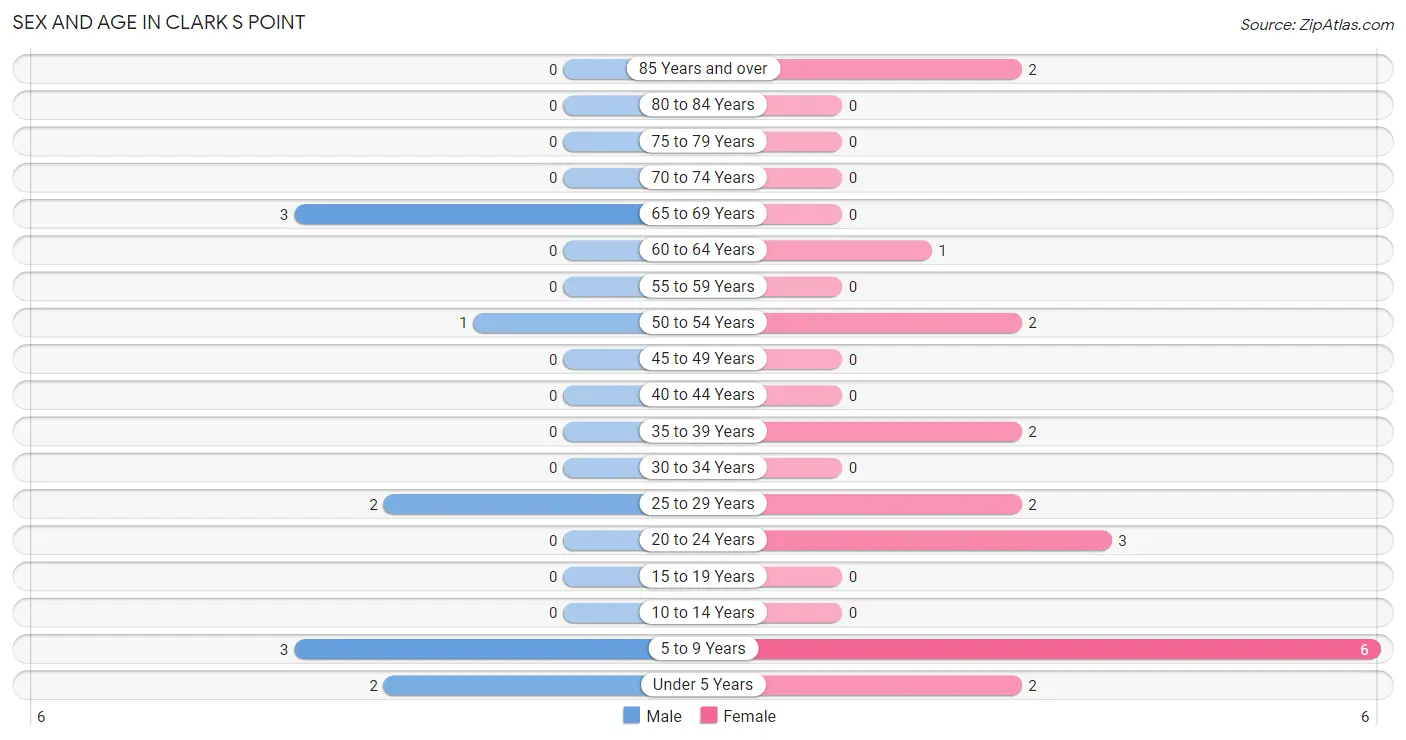
The most populous age groups in Clark s Point are 5 to 9 Years (3 | 27.3%) for men and 5 to 9 Years (6 | 30.0%) for women.
| Age Bracket | Male | Female |
| Under 5 Years | 2 (18.2%) | 2 (10.0%) |
| 5 to 9 Years | 3 (27.3%) | 6 (30.0%) |
| 10 to 14 Years | 0 (0.0%) | 0 (0.0%) |
| 15 to 19 Years | 0 (0.0%) | 0 (0.0%) |
| 20 to 24 Years | 0 (0.0%) | 3 (15.0%) |
| 25 to 29 Years | 2 (18.2%) | 2 (10.0%) |
| 30 to 34 Years | 0 (0.0%) | 0 (0.0%) |
| 35 to 39 Years | 0 (0.0%) | 2 (10.0%) |
| 40 to 44 Years | 0 (0.0%) | 0 (0.0%) |
| 45 to 49 Years | 0 (0.0%) | 0 (0.0%) |
| 50 to 54 Years | 1 (9.1%) | 2 (10.0%) |
| 55 to 59 Years | 0 (0.0%) | 0 (0.0%) |
| 60 to 64 Years | 0 (0.0%) | 1 (5.0%) |
| 65 to 69 Years | 3 (27.3%) | 0 (0.0%) |
| 70 to 74 Years | 0 (0.0%) | 0 (0.0%) |
| 75 to 79 Years | 0 (0.0%) | 0 (0.0%) |
| 80 to 84 Years | 0 (0.0%) | 0 (0.0%) |
| 85 Years and over | 0 (0.0%) | 2 (10.0%) |
| Total | 11 (100.0%) | 20 (100.0%) |
Families and Households in Clark s Point
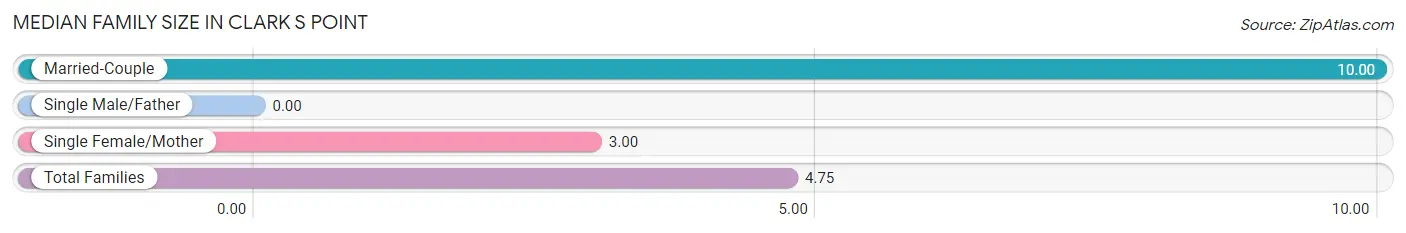
Median Family Size in Clark s Point
| Family Type | # Families | Family Size |
| Married-Couple | 1 (25.0%) | 10.00 |
| Single Male/Father | 0 (0.0%) | - |
| Single Female/Mother | 3 (75.0%) | 3.00 |
| Total Families | 4 (100.0%) | 4.75 |
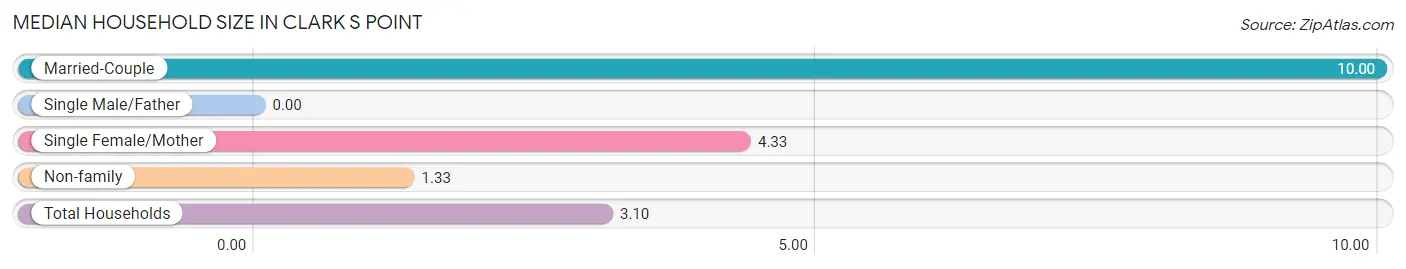
Median Household Size in Clark s Point
| Household Type | # Households | Household Size |
| Married-Couple | 1 (10.0%) | 10.00 |
| Single Male/Father | 0 (0.0%) | - |
| Single Female/Mother | 3 (30.0%) | 4.33 |
| Non-family | 6 (60.0%) | 1.33 |
| Total Households | 10 (100.0%) | 3.10 |
Household Size by Marriage Status in Clark s Point
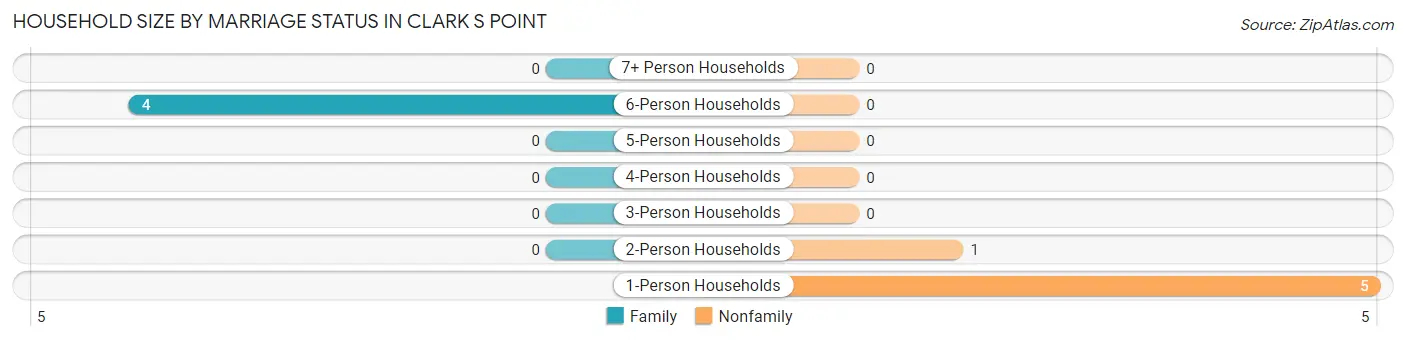
Out of a total of 10 households in Clark s Point, 4 (40.0%) are family households, while 6 (60.0%) are nonfamily households. The most numerous type of family households are 6-person households, comprising 4, and the most common type of nonfamily households are 1-person households, comprising 5.
| Household Size | Family Households | Nonfamily Households |
| 1-Person Households | - | 5 (50.0%) |
| 2-Person Households | 0 (0.0%) | 1 (10.0%) |
| 3-Person Households | 0 (0.0%) | 0 (0.0%) |
| 4-Person Households | 0 (0.0%) | 0 (0.0%) |
| 5-Person Households | 0 (0.0%) | 0 (0.0%) |
| 6-Person Households | 4 (40.0%) | 0 (0.0%) |
| 7+ Person Households | 0 (0.0%) | 0 (0.0%) |
| Total | 4 (40.0%) | 6 (60.0%) |
Female Fertility in Clark s Point
Fertility by Age in Clark s Point
| Age Bracket | Women with Births | Births / 1,000 Women |
| 15 to 19 years | 0 (0.0%) | 0.0 |
| 20 to 34 years | 0 (0.0%) | 0.0 |
| 35 to 50 years | 0 (0.0%) | 0.0 |
| Total | 0 (0.0%) | 0.0 |
Fertility by Age by Marriage Status in Clark s Point
| Age Bracket | Married | Unmarried |
| 15 to 19 years | 0 (0.0%) | 0 (0.0%) |
| 20 to 34 years | 0 (0.0%) | 0 (0.0%) |
| 35 to 50 years | 0 (0.0%) | 0 (0.0%) |
| Total | 0 (0.0%) | 0 (0.0%) |
Fertility by Education in Clark s Point
| Educational Attainment | Women with Births | Births / 1,000 Women |
| Less than High School | 0 (0.0%) | 0.0 |
| High School Diploma | 0 (0.0%) | 0.0 |
| College or Associate's Degree | 0 (0.0%) | 0.0 |
| Bachelor's Degree | 0 (0.0%) | 0.0 |
| Graduate Degree | 0 (0.0%) | 0.0 |
| Total | 0 (0.0%) | 0.0 |
Fertility by Education by Marriage Status in Clark s Point
| Educational Attainment | Married | Unmarried |
| Less than High School | 0 (0.0%) | 0 (0.0%) |
| High School Diploma | 0 (0.0%) | 0 (0.0%) |
| College or Associate's Degree | 0 (0.0%) | 0 (0.0%) |
| Bachelor's Degree | 0 (0.0%) | 0 (0.0%) |
| Graduate Degree | 0 (0.0%) | 0 (0.0%) |
| Total | 0 (0.0%) | 0 (0.0%) |
Employment Characteristics in Clark s Point
Employment by Class of Employer in Clark s Point
Among the 8 employed individuals in Clark s Point, local government employees (6 | 75.0%), not-for-profit organizations (1 | 12.5%), and state government employees (1 | 12.5%) make up the most common classes of employment.
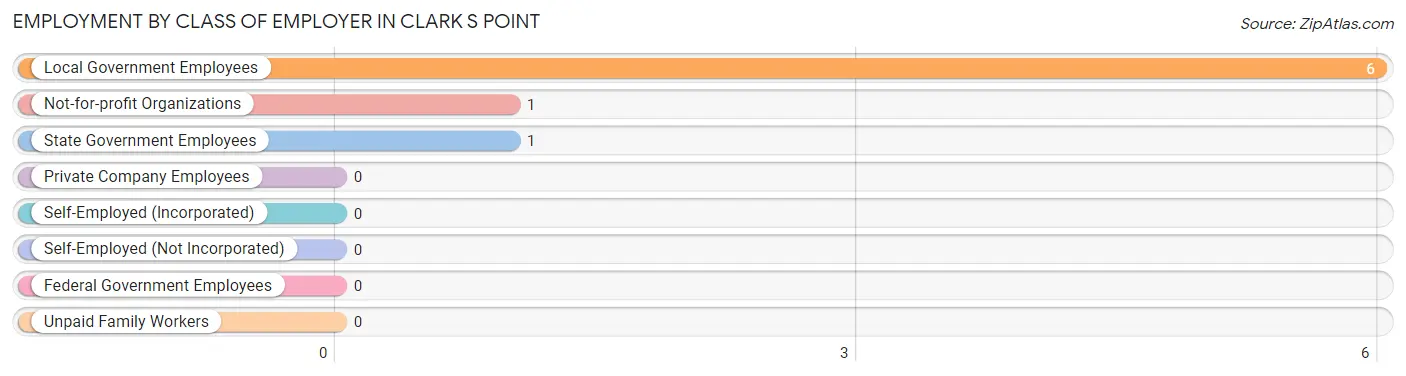
| Employer Class | # Employees | % Employees |
| Private Company Employees | 0 | 0.0% |
| Self-Employed (Incorporated) | 0 | 0.0% |
| Self-Employed (Not Incorporated) | 0 | 0.0% |
| Not-for-profit Organizations | 1 | 12.5% |
| Local Government Employees | 6 | 75.0% |
| State Government Employees | 1 | 12.5% |
| Federal Government Employees | 0 | 0.0% |
| Unpaid Family Workers | 0 | 0.0% |
| Total | 8 | 100.0% |
Employment Status by Age in Clark s Point
According to the labor force statistics for Clark s Point, out of the total population over 16 years of age (18), 66.7% or 12 individuals are in the labor force, with 25.0% or 3 of them unemployed. The age group with the highest labor force participation rate is 20 to 24 years, with 100.0% or 3 individuals in the labor force. Within the labor force, the 20 to 24 years age range has the highest percentage of unemployed individuals, with 100.0% or 3 of them being unemployed.
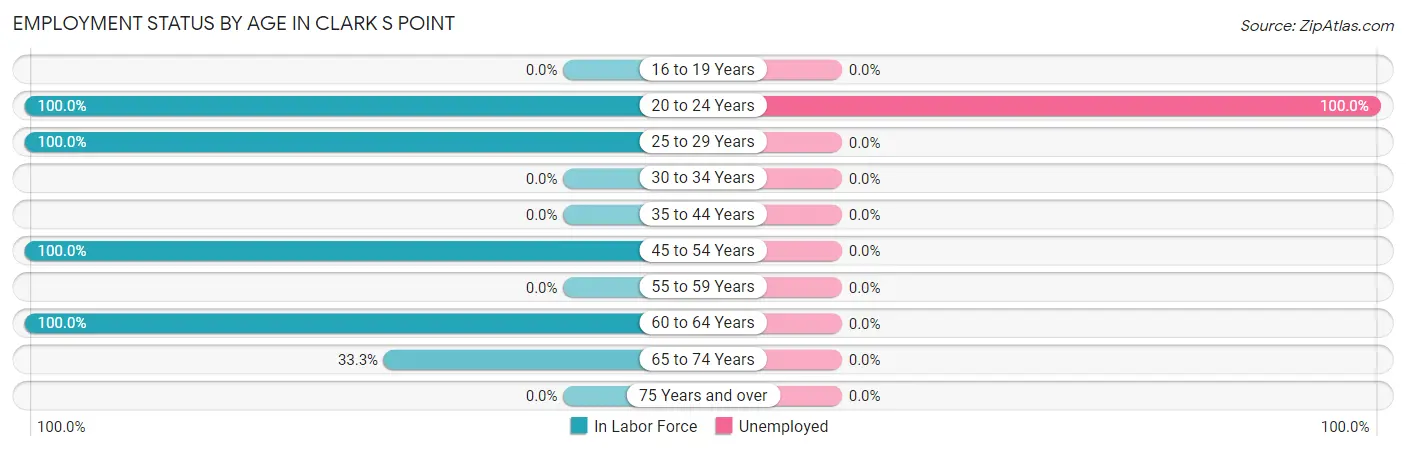
| Age Bracket | In Labor Force | Unemployed |
| 16 to 19 Years | 0 (0.0%) | 0 (0.0%) |
| 20 to 24 Years | 3 (100.0%) | 3 (100.0%) |
| 25 to 29 Years | 4 (100.0%) | 0 (0.0%) |
| 30 to 34 Years | 0 (0.0%) | 0 (0.0%) |
| 35 to 44 Years | 0 (0.0%) | 0 (0.0%) |
| 45 to 54 Years | 3 (100.0%) | 0 (0.0%) |
| 55 to 59 Years | 0 (0.0%) | 0 (0.0%) |
| 60 to 64 Years | 1 (100.0%) | 0 (0.0%) |
| 65 to 74 Years | 1 (33.3%) | 0 (0.0%) |
| 75 Years and over | 0 (0.0%) | 0 (0.0%) |
| Total | 12 (66.7%) | 3 (25.0%) |
Employment Status by Educational Attainment in Clark s Point
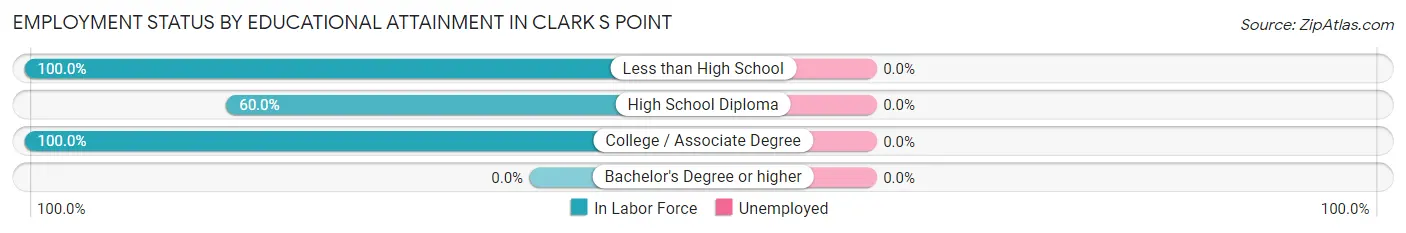
| Educational Attainment | In Labor Force | Unemployed |
| Less than High School | 1 (100.0%) | 0 (0.0%) |
| High School Diploma | 3 (60.0%) | 0 (0.0%) |
| College / Associate Degree | 4 (100.0%) | 0 (0.0%) |
| Bachelor's Degree or higher | 0 (0.0%) | 0 (0.0%) |
| Total | 8 (80.0%) | 0 (0.0%) |
Employment Occupations by Sex in Clark s Point
Management, Business, Science and Arts Occupations
The most common Management, Business, Science and Arts occupations in Clark s Point are Community & Social Service (1 | 11.1%), and Education, Arts & Media (1 | 11.1%).
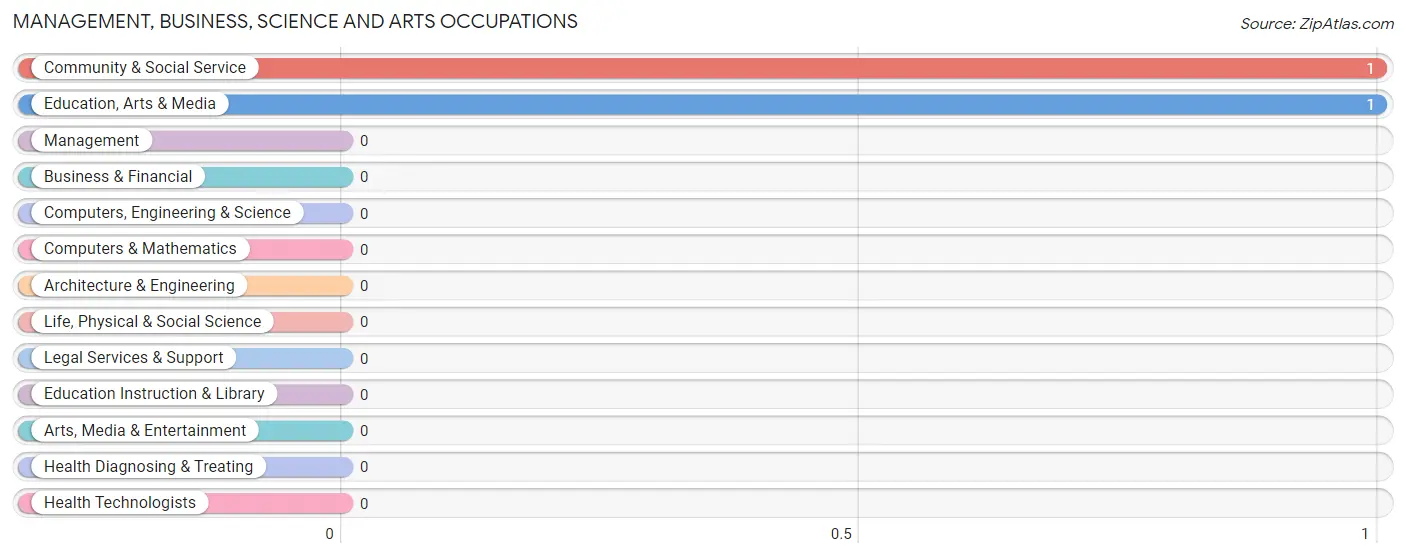
Management, Business, Science and Arts Occupations by Sex
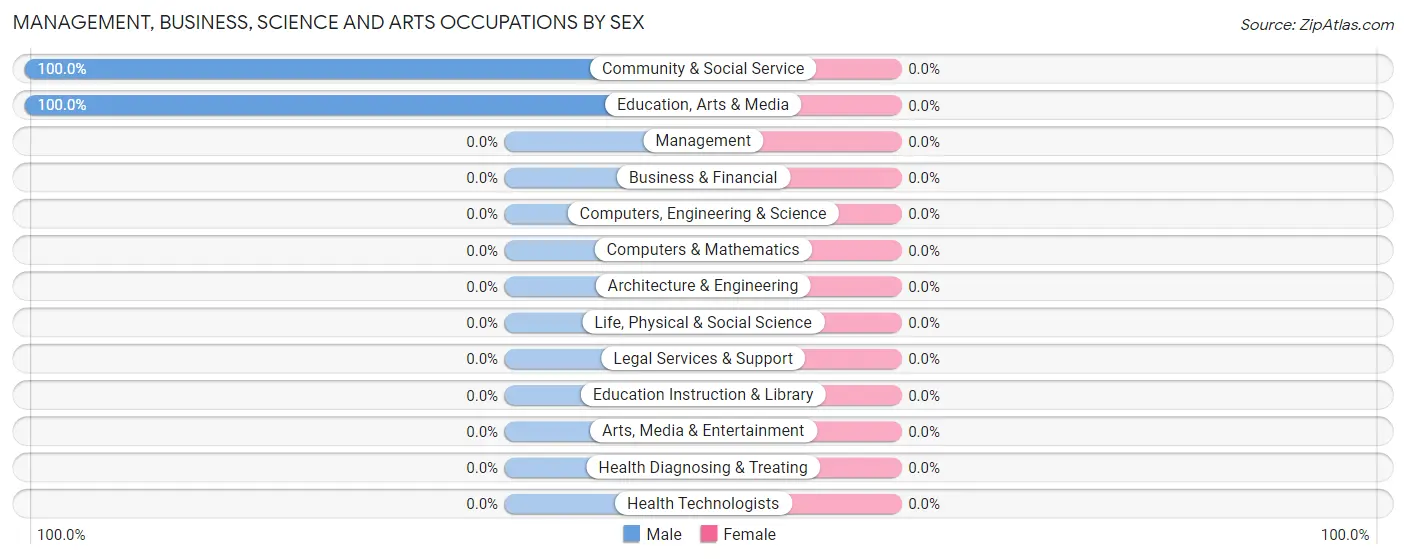
| Occupation | Male | Female |
| Management | 0 (0.0%) | 0 (0.0%) |
| Business & Financial | 0 (0.0%) | 0 (0.0%) |
| Computers, Engineering & Science | 0 (0.0%) | 0 (0.0%) |
| Computers & Mathematics | 0 (0.0%) | 0 (0.0%) |
| Architecture & Engineering | 0 (0.0%) | 0 (0.0%) |
| Life, Physical & Social Science | 0 (0.0%) | 0 (0.0%) |
| Community & Social Service | 1 (100.0%) | 0 (0.0%) |
| Education, Arts & Media | 1 (100.0%) | 0 (0.0%) |
| Legal Services & Support | 0 (0.0%) | 0 (0.0%) |
| Education Instruction & Library | 0 (0.0%) | 0 (0.0%) |
| Arts, Media & Entertainment | 0 (0.0%) | 0 (0.0%) |
| Health Diagnosing & Treating | 0 (0.0%) | 0 (0.0%) |
| Health Technologists | 0 (0.0%) | 0 (0.0%) |
| Total (Category) | 1 (100.0%) | 0 (0.0%) |
| Total (Overall) | 4 (44.4%) | 5 (55.6%) |
Services Occupations
The most common Services occupations in Clark s Point are Security & Protection (1 | 11.1%), Firefighting & Prevention (1 | 11.1%), and Food Preparation & Serving (1 | 11.1%).
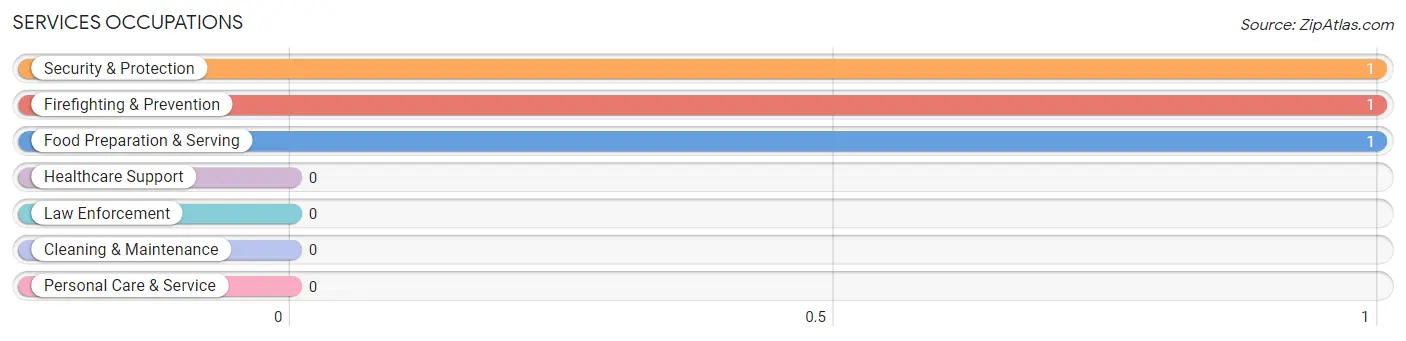
Services Occupations by Sex
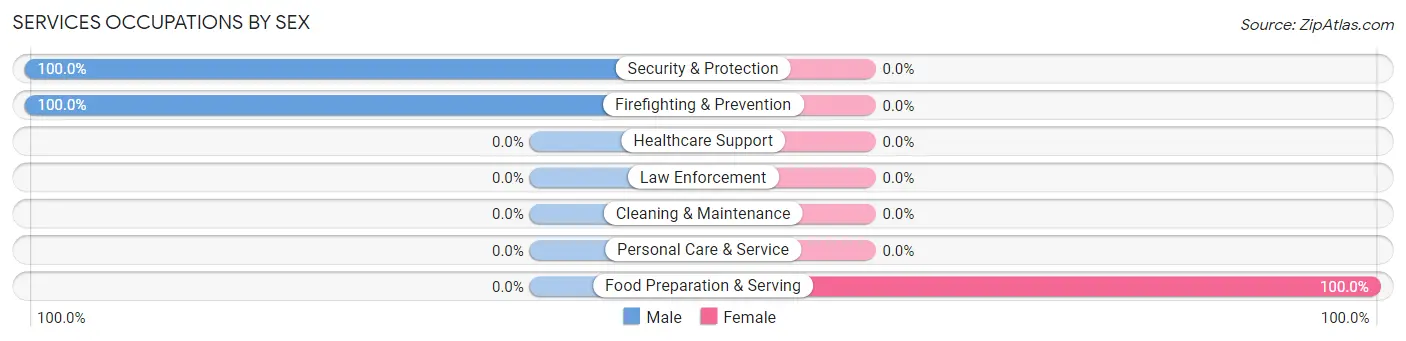
| Occupation | Male | Female |
| Healthcare Support | 0 (0.0%) | 0 (0.0%) |
| Security & Protection | 1 (100.0%) | 0 (0.0%) |
| Firefighting & Prevention | 1 (100.0%) | 0 (0.0%) |
| Law Enforcement | 0 (0.0%) | 0 (0.0%) |
| Food Preparation & Serving | 0 (0.0%) | 1 (100.0%) |
| Cleaning & Maintenance | 0 (0.0%) | 0 (0.0%) |
| Personal Care & Service | 0 (0.0%) | 0 (0.0%) |
| Total (Category) | 1 (50.0%) | 1 (50.0%) |
| Total (Overall) | 4 (44.4%) | 5 (55.6%) |
Sales and Office Occupations
The most common Sales and Office occupations in Clark s Point are , and Office & Administration (4 | 44.4%).
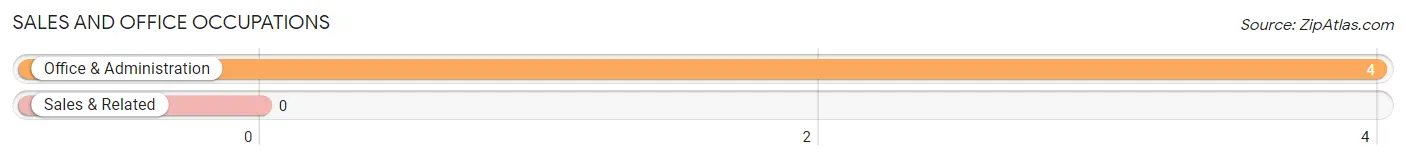
Sales and Office Occupations by Sex
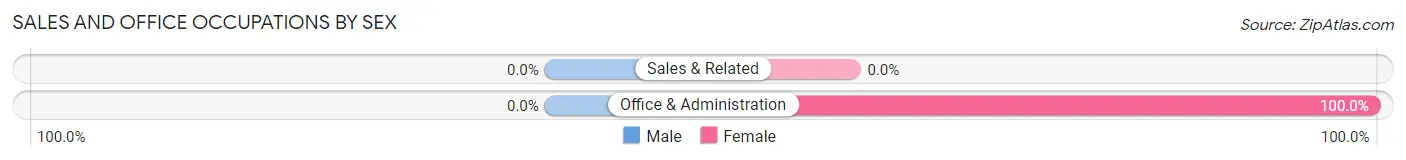
| Occupation | Male | Female |
| Sales & Related | 0 (0.0%) | 0 (0.0%) |
| Office & Administration | 0 (0.0%) | 4 (100.0%) |
| Total (Category) | 0 (0.0%) | 4 (100.0%) |
| Total (Overall) | 4 (44.4%) | 5 (55.6%) |
Natural Resources, Construction and Maintenance Occupations
The most common Natural Resources, Construction and Maintenance occupations in Clark s Point are , and Installation, Maintenance & Repair (2 | 22.2%).
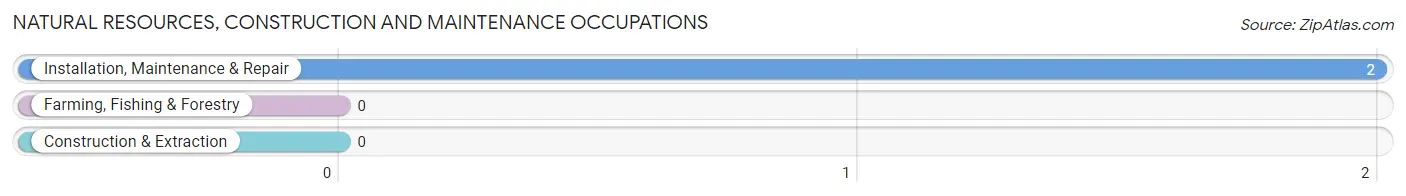
Natural Resources, Construction and Maintenance Occupations by Sex
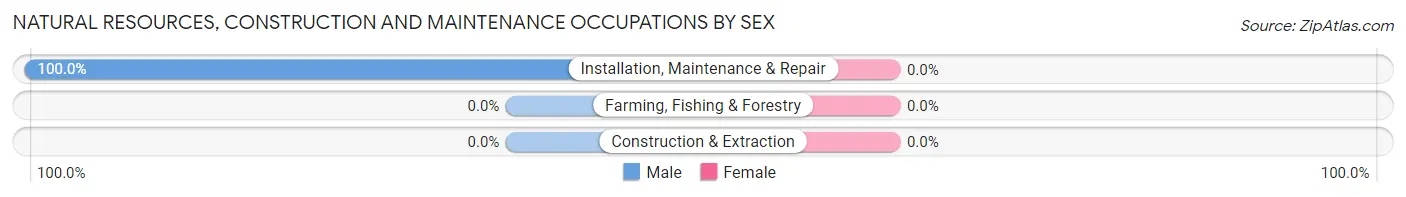
| Occupation | Male | Female |
| Farming, Fishing & Forestry | 0 (0.0%) | 0 (0.0%) |
| Construction & Extraction | 0 (0.0%) | 0 (0.0%) |
| Installation, Maintenance & Repair | 2 (100.0%) | 0 (0.0%) |
| Total (Category) | 2 (100.0%) | 0 (0.0%) |
| Total (Overall) | 4 (44.4%) | 5 (55.6%) |
Production, Transportation and Moving Occupations
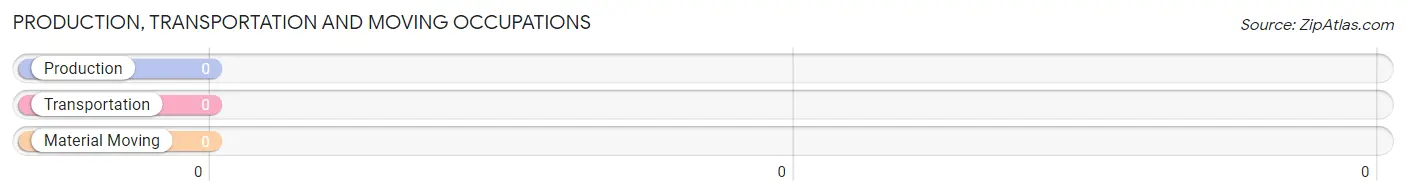
Production, Transportation and Moving Occupations by Sex
| Occupation | Male | Female |
| Production | 0 (0.0%) | 0 (0.0%) |
| Transportation | 0 (0.0%) | 0 (0.0%) |
| Material Moving | 0 (0.0%) | 0 (0.0%) |
| Total (Category) | 0 (0.0%) | 0 (0.0%) |
| Total (Overall) | 4 (44.4%) | 5 (55.6%) |
Employment Industries by Sex in Clark s Point
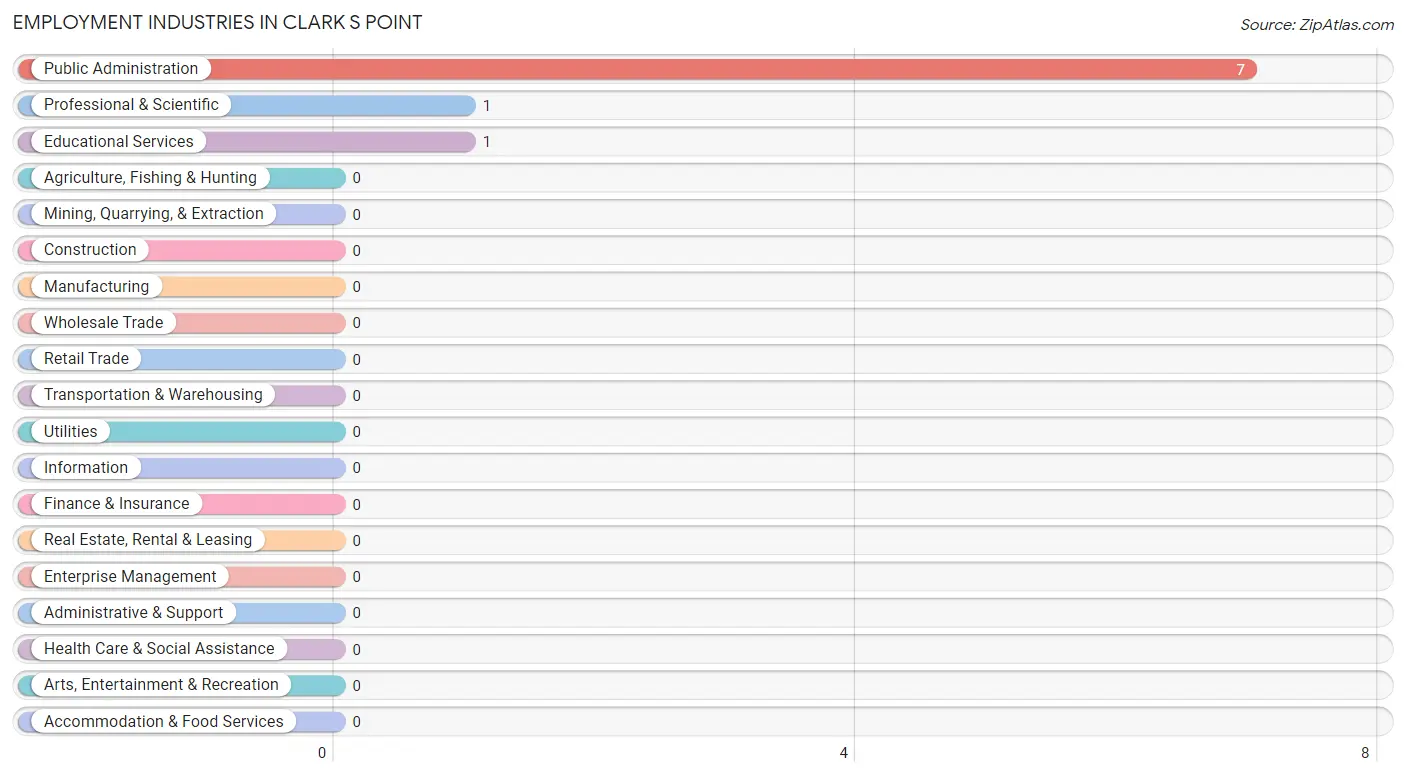
Employment Industries in Clark s Point
The major employment industries in Clark s Point include Public Administration (7 | 77.8%), Professional & Scientific (1 | 11.1%), and Educational Services (1 | 11.1%).
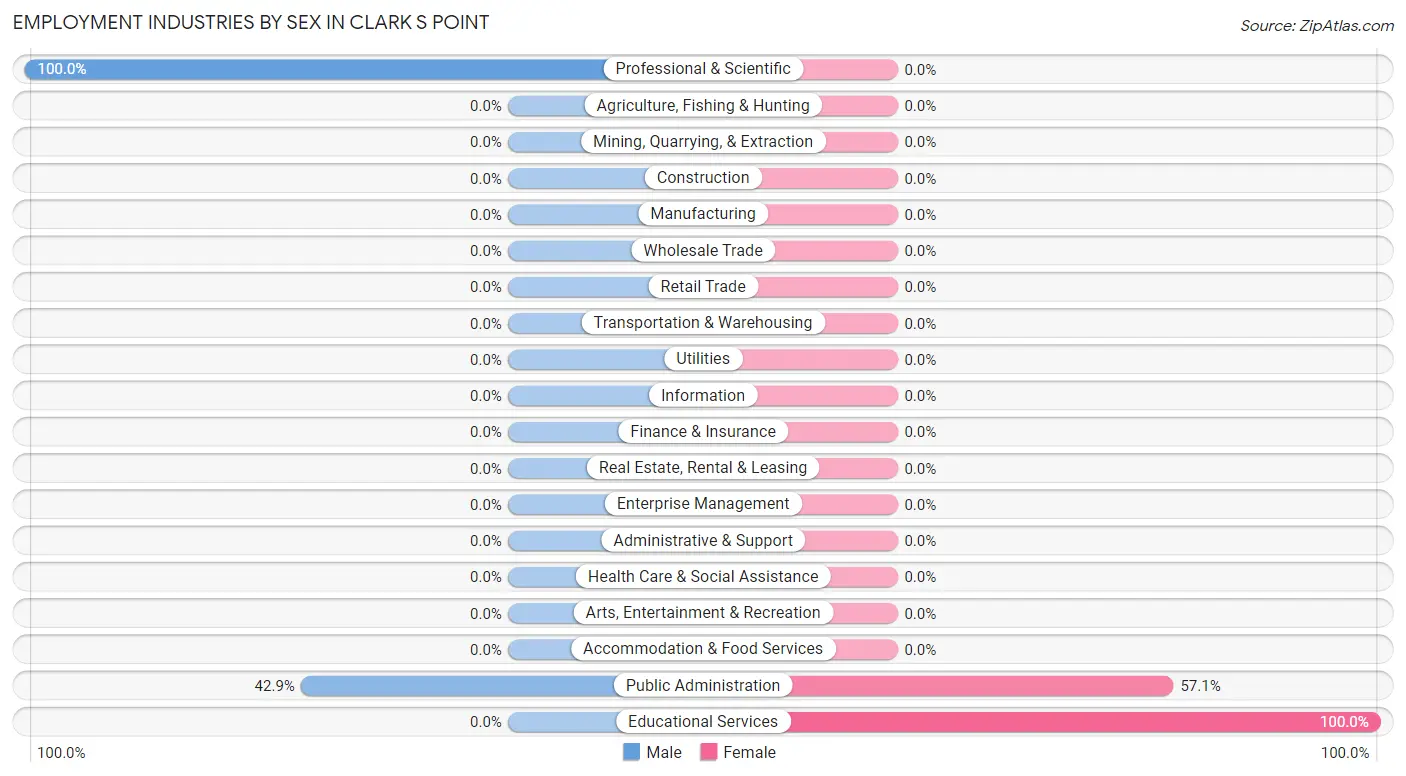
Employment Industries by Sex in Clark s Point
The Clark s Point industries that see more men than women are Professional & Scientific (100.0%), and Public Administration (42.9%), whereas the industries that tend to have a higher number of women are Educational Services (100.0%), and Public Administration (57.1%).
| Industry | Male | Female |
| Agriculture, Fishing & Hunting | 0 (0.0%) | 0 (0.0%) |
| Mining, Quarrying, & Extraction | 0 (0.0%) | 0 (0.0%) |
| Construction | 0 (0.0%) | 0 (0.0%) |
| Manufacturing | 0 (0.0%) | 0 (0.0%) |
| Wholesale Trade | 0 (0.0%) | 0 (0.0%) |
| Retail Trade | 0 (0.0%) | 0 (0.0%) |
| Transportation & Warehousing | 0 (0.0%) | 0 (0.0%) |
| Utilities | 0 (0.0%) | 0 (0.0%) |
| Information | 0 (0.0%) | 0 (0.0%) |
| Finance & Insurance | 0 (0.0%) | 0 (0.0%) |
| Real Estate, Rental & Leasing | 0 (0.0%) | 0 (0.0%) |
| Professional & Scientific | 1 (100.0%) | 0 (0.0%) |
| Enterprise Management | 0 (0.0%) | 0 (0.0%) |
| Administrative & Support | 0 (0.0%) | 0 (0.0%) |
| Educational Services | 0 (0.0%) | 1 (100.0%) |
| Health Care & Social Assistance | 0 (0.0%) | 0 (0.0%) |
| Arts, Entertainment & Recreation | 0 (0.0%) | 0 (0.0%) |
| Accommodation & Food Services | 0 (0.0%) | 0 (0.0%) |
| Public Administration | 3 (42.9%) | 4 (57.1%) |
| Total | 4 (44.4%) | 5 (55.6%) |
Education in Clark s Point
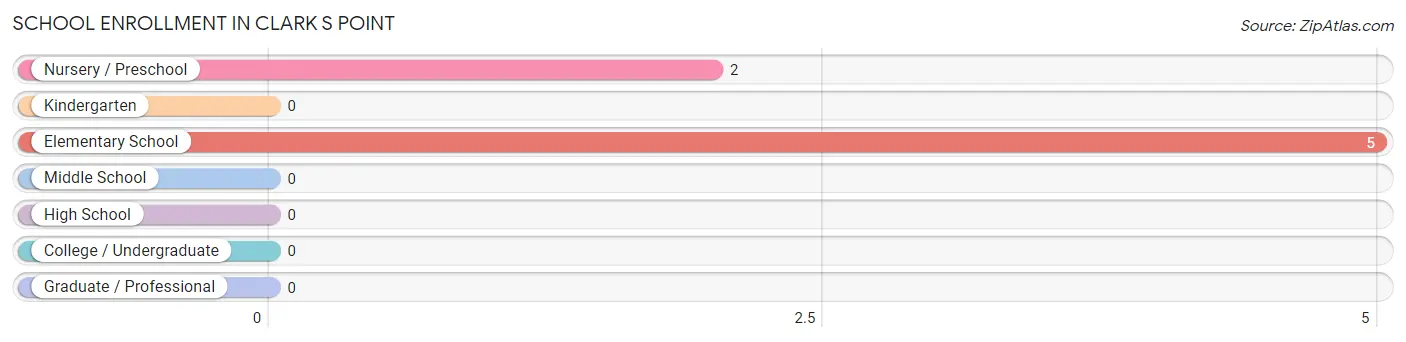
School Enrollment in Clark s Point
The most common levels of schooling among the 7 students in Clark s Point are elementary school (5 | 71.4%), and nursery / preschool (2 | 28.6%).
| School Level | # Students | % Students |
| Nursery / Preschool | 2 | 28.6% |
| Kindergarten | 0 | 0.0% |
| Elementary School | 5 | 71.4% |
| Middle School | 0 | 0.0% |
| High School | 0 | 0.0% |
| College / Undergraduate | 0 | 0.0% |
| Graduate / Professional | 0 | 0.0% |
| Total | 7 | 100.0% |
School Enrollment by Age by Funding Source in Clark s Point
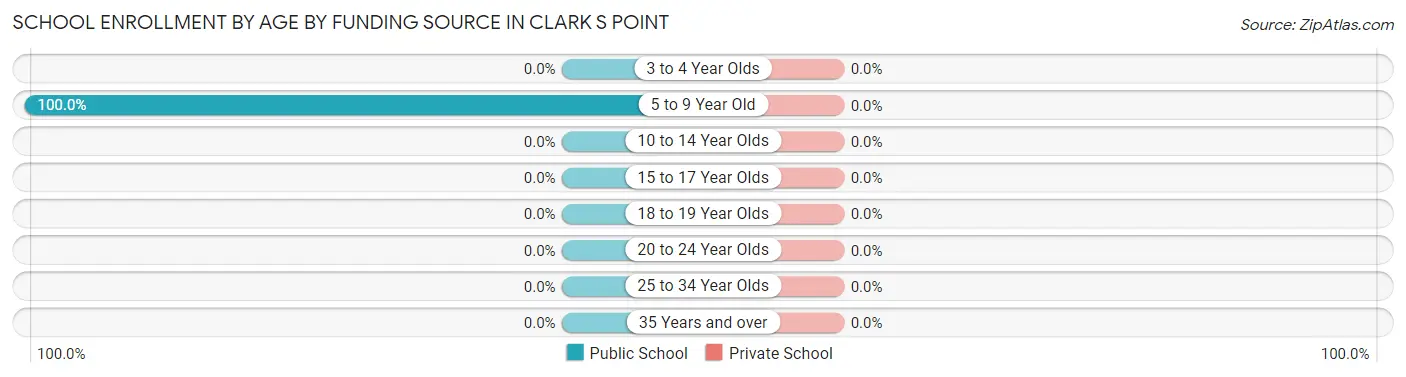
| Age Bracket | Public School | Private School |
| 3 to 4 Year Olds | 0 (0.0%) | 0 (0.0%) |
| 5 to 9 Year Old | 7 (100.0%) | 0 (0.0%) |
| 10 to 14 Year Olds | 0 (0.0%) | 0 (0.0%) |
| 15 to 17 Year Olds | 0 (0.0%) | 0 (0.0%) |
| 18 to 19 Year Olds | 0 (0.0%) | 0 (0.0%) |
| 20 to 24 Year Olds | 0 (0.0%) | 0 (0.0%) |
| 25 to 34 Year Olds | 0 (0.0%) | 0 (0.0%) |
| 35 Years and over | 0 (0.0%) | 0 (0.0%) |
| Total | 7 (100.0%) | 0 (0.0%) |
Educational Attainment by Field of Study in Clark s Point
| Field of Study | # Graduates | % Graduates |
| Computers & Mathematics | 0 | 0.0% |
| Bio, Nature & Agricultural | 0 | 0.0% |
| Physical & Health Sciences | 0 | 0.0% |
| Psychology | 0 | 0.0% |
| Social Sciences | 0 | 0.0% |
| Engineering | 0 | 0.0% |
| Multidisciplinary Studies | 0 | 0.0% |
| Science & Technology | 0 | 0.0% |
| Business | 0 | 0.0% |
| Education | 0 | 0.0% |
| Literature & Languages | 0 | 0.0% |
| Liberal Arts & History | 0 | 0.0% |
| Visual & Performing Arts | 0 | 0.0% |
| Communications | 0 | 0.0% |
| Arts & Humanities | 0 | 0.0% |
| Total | 0 | 0.0% |
Transportation & Commute in Clark s Point
Vehicle Availability by Sex in Clark s Point
The most prevalent vehicle ownership categories in Clark s Point are males with no vehicle (2, accounting for 66.7%) and females with no vehicle (3, making up 40.0%).
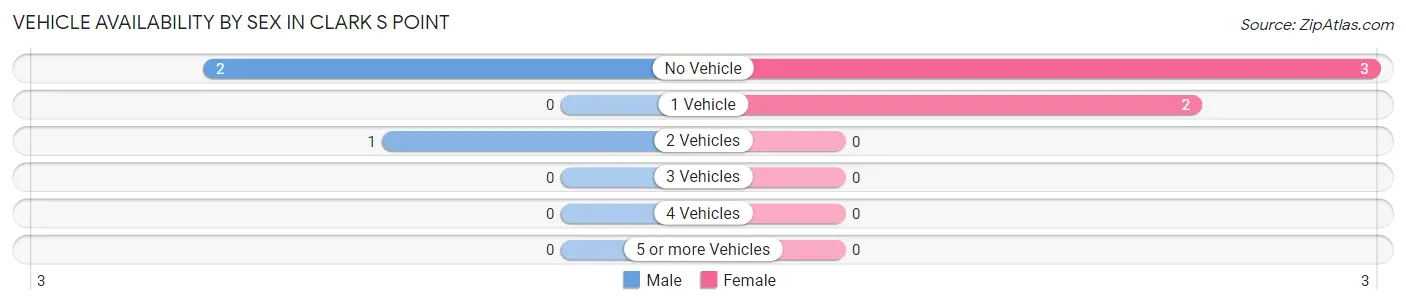
| Vehicles Available | Male | Female |
| No Vehicle | 2 (66.7%) | 3 (60.0%) |
| 1 Vehicle | 0 (0.0%) | 2 (40.0%) |
| 2 Vehicles | 1 (33.3%) | 0 (0.0%) |
| 3 Vehicles | 0 (0.0%) | 0 (0.0%) |
| 4 Vehicles | 0 (0.0%) | 0 (0.0%) |
| 5 or more Vehicles | 0 (0.0%) | 0 (0.0%) |
| Total | 3 (100.0%) | 5 (100.0%) |
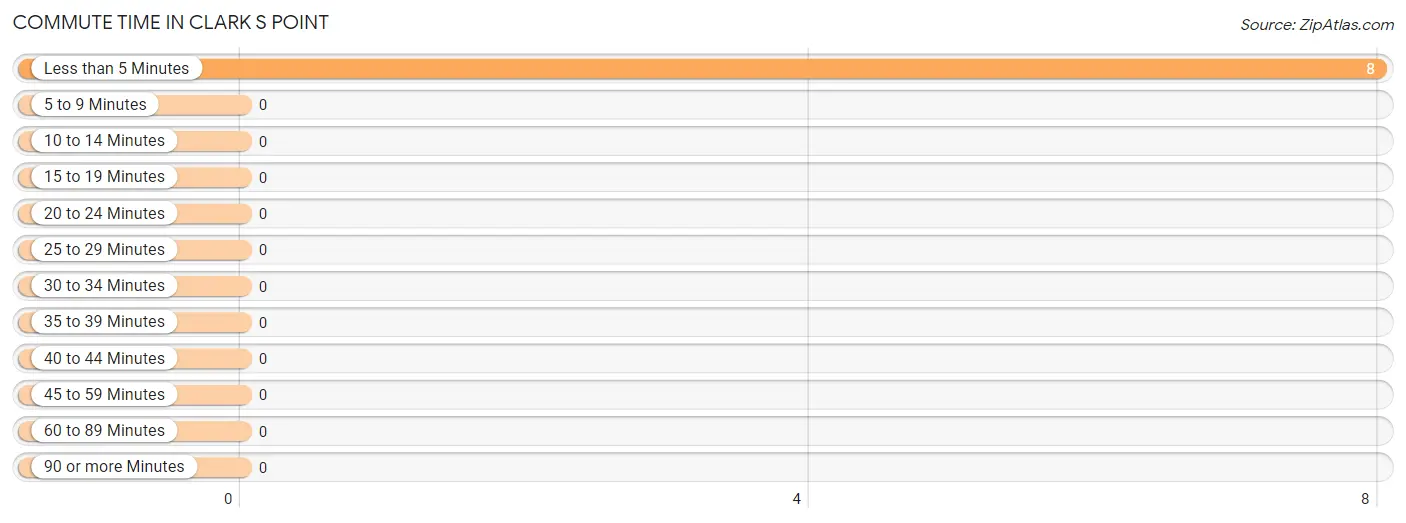
Commute Time in Clark s Point
The most frequently occuring commute durations in Clark s Point are less than 5 minutes (8 commuters, 100.0%), 5 to 9 minutes (0 commuters, 0.0%), and 10 to 14 minutes (0 commuters, 0.0%).
| Commute Time | # Commuters | % Commuters |
| Less than 5 Minutes | 8 | 100.0% |
| 5 to 9 Minutes | 0 | 0.0% |
| 10 to 14 Minutes | 0 | 0.0% |
| 15 to 19 Minutes | 0 | 0.0% |
| 20 to 24 Minutes | 0 | 0.0% |
| 25 to 29 Minutes | 0 | 0.0% |
| 30 to 34 Minutes | 0 | 0.0% |
| 35 to 39 Minutes | 0 | 0.0% |
| 40 to 44 Minutes | 0 | 0.0% |
| 45 to 59 Minutes | 0 | 0.0% |
| 60 to 89 Minutes | 0 | 0.0% |
| 90 or more Minutes | 0 | 0.0% |
Commute Time by Sex in Clark s Point
The most common commute times in Clark s Point are less than 5 minutes (3 commuters, 100.0%) for males and less than 5 minutes (5 commuters, 100.0%) for females.
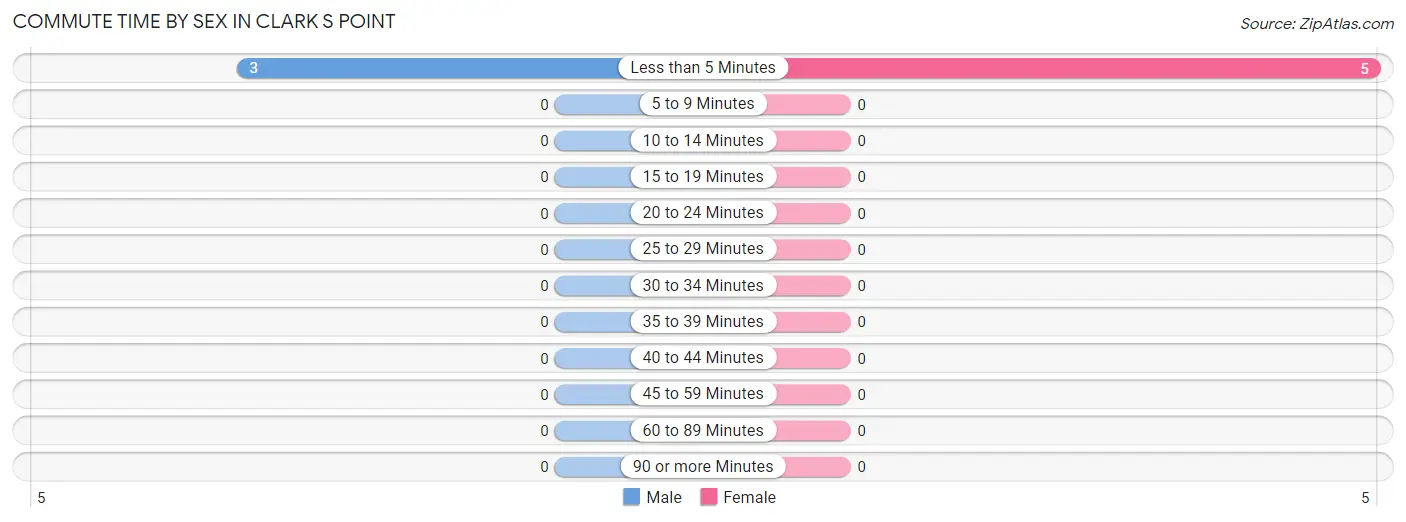
| Commute Time | Male | Female |
| Less than 5 Minutes | 3 (100.0%) | 5 (100.0%) |
| 5 to 9 Minutes | 0 (0.0%) | 0 (0.0%) |
| 10 to 14 Minutes | 0 (0.0%) | 0 (0.0%) |
| 15 to 19 Minutes | 0 (0.0%) | 0 (0.0%) |
| 20 to 24 Minutes | 0 (0.0%) | 0 (0.0%) |
| 25 to 29 Minutes | 0 (0.0%) | 0 (0.0%) |
| 30 to 34 Minutes | 0 (0.0%) | 0 (0.0%) |
| 35 to 39 Minutes | 0 (0.0%) | 0 (0.0%) |
| 40 to 44 Minutes | 0 (0.0%) | 0 (0.0%) |
| 45 to 59 Minutes | 0 (0.0%) | 0 (0.0%) |
| 60 to 89 Minutes | 0 (0.0%) | 0 (0.0%) |
| 90 or more Minutes | 0 (0.0%) | 0 (0.0%) |
Time of Departure to Work by Sex in Clark s Point
The most frequent times of departure to work in Clark s Point are 9:00 AM to 9:59 AM (2, 66.7%) for males and 6:30 AM to 6:59 AM (2, 40.0%) for females.
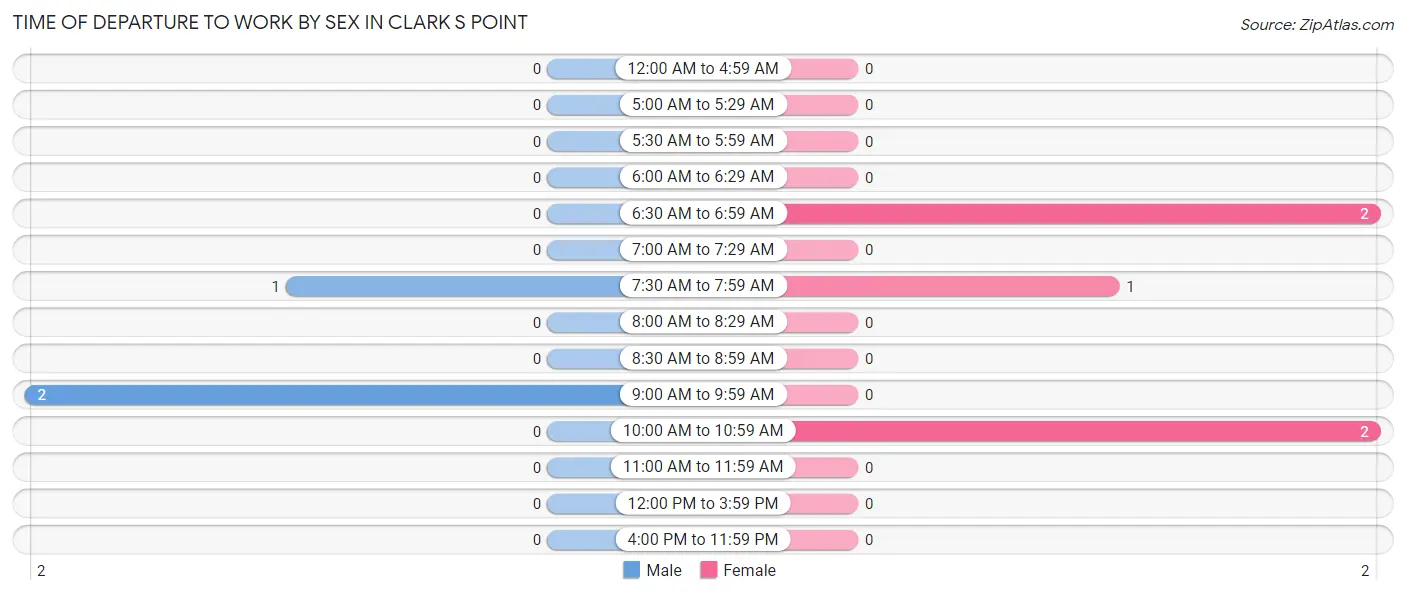
| Time of Departure | Male | Female |
| 12:00 AM to 4:59 AM | 0 (0.0%) | 0 (0.0%) |
| 5:00 AM to 5:29 AM | 0 (0.0%) | 0 (0.0%) |
| 5:30 AM to 5:59 AM | 0 (0.0%) | 0 (0.0%) |
| 6:00 AM to 6:29 AM | 0 (0.0%) | 0 (0.0%) |
| 6:30 AM to 6:59 AM | 0 (0.0%) | 2 (40.0%) |
| 7:00 AM to 7:29 AM | 0 (0.0%) | 0 (0.0%) |
| 7:30 AM to 7:59 AM | 1 (33.3%) | 1 (20.0%) |
| 8:00 AM to 8:29 AM | 0 (0.0%) | 0 (0.0%) |
| 8:30 AM to 8:59 AM | 0 (0.0%) | 0 (0.0%) |
| 9:00 AM to 9:59 AM | 2 (66.7%) | 0 (0.0%) |
| 10:00 AM to 10:59 AM | 0 (0.0%) | 2 (40.0%) |
| 11:00 AM to 11:59 AM | 0 (0.0%) | 0 (0.0%) |
| 12:00 PM to 3:59 PM | 0 (0.0%) | 0 (0.0%) |
| 4:00 PM to 11:59 PM | 0 (0.0%) | 0 (0.0%) |
| Total | 3 (100.0%) | 5 (100.0%) |
Housing Occupancy in Clark s Point
Occupancy by Ownership in Clark s Point
Of the total 10 dwellings in Clark s Point, owner-occupied units account for 7 (70.0%), while renter-occupied units make up 3 (30.0%).
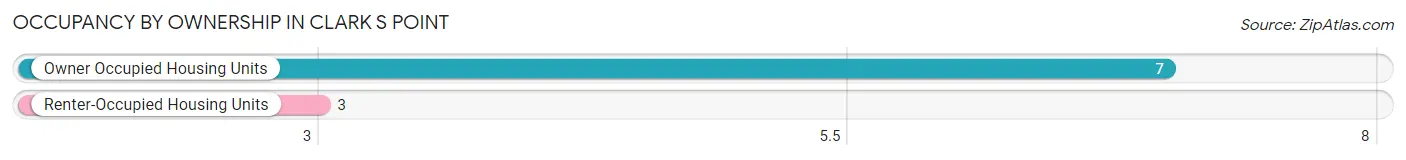
| Occupancy | # Housing Units | % Housing Units |
| Owner Occupied Housing Units | 7 | 70.0% |
| Renter-Occupied Housing Units | 3 | 30.0% |
| Total Occupied Housing Units | 10 | 100.0% |
Occupancy by Household Size in Clark s Point
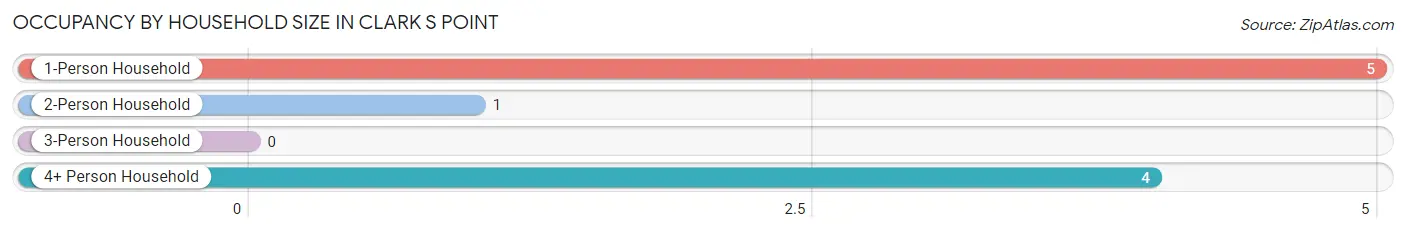
| Household Size | # Housing Units | % Housing Units |
| 1-Person Household | 5 | 50.0% |
| 2-Person Household | 1 | 10.0% |
| 3-Person Household | 0 | 0.0% |
| 4+ Person Household | 4 | 40.0% |
| Total Housing Units | 10 | 100.0% |
Occupancy by Ownership by Household Size in Clark s Point
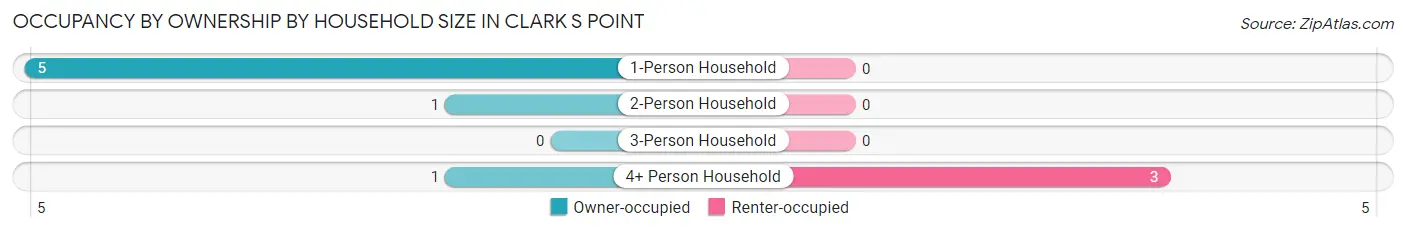
| Household Size | Owner-occupied | Renter-occupied |
| 1-Person Household | 5 (100.0%) | 0 (0.0%) |
| 2-Person Household | 1 (100.0%) | 0 (0.0%) |
| 3-Person Household | 0 (0.0%) | 0 (0.0%) |
| 4+ Person Household | 1 (25.0%) | 3 (75.0%) |
| Total Housing Units | 7 (70.0%) | 3 (30.0%) |
Occupancy by Educational Attainment in Clark s Point
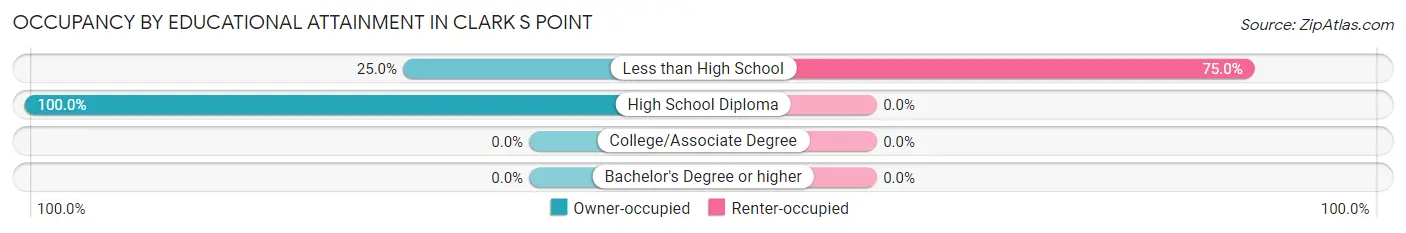
| Household Size | Owner-occupied | Renter-occupied |
| Less than High School | 1 (25.0%) | 3 (75.0%) |
| High School Diploma | 6 (100.0%) | 0 (0.0%) |
| College/Associate Degree | 0 (0.0%) | 0 (0.0%) |
| Bachelor's Degree or higher | 0 (0.0%) | 0 (0.0%) |
Occupancy by Age of Householder in Clark s Point
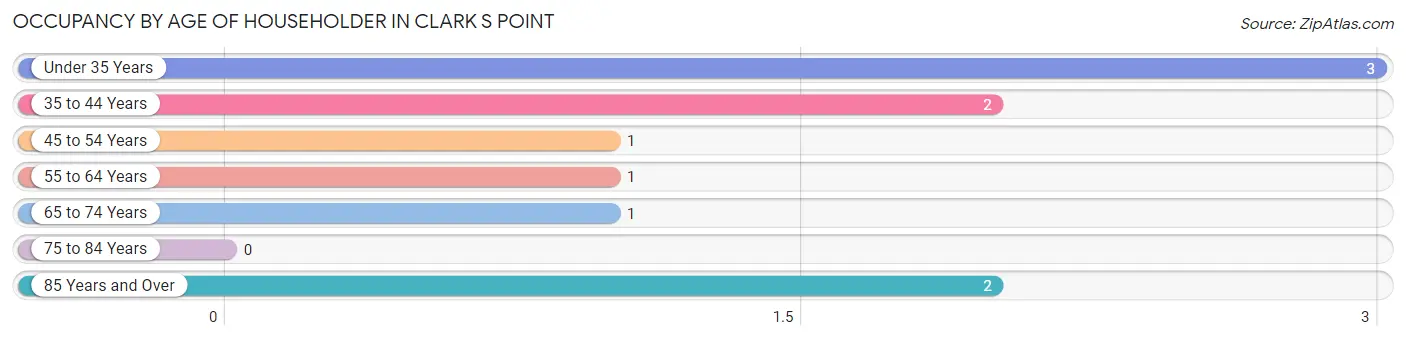
| Age Bracket | # Households | % Households |
| Under 35 Years | 3 | 30.0% |
| 35 to 44 Years | 2 | 20.0% |
| 45 to 54 Years | 1 | 10.0% |
| 55 to 64 Years | 1 | 10.0% |
| 65 to 74 Years | 1 | 10.0% |
| 75 to 84 Years | 0 | 0.0% |
| 85 Years and Over | 2 | 20.0% |
| Total | 10 | 100.0% |
Housing Finances in Clark s Point
Median Income by Occupancy in Clark s Point
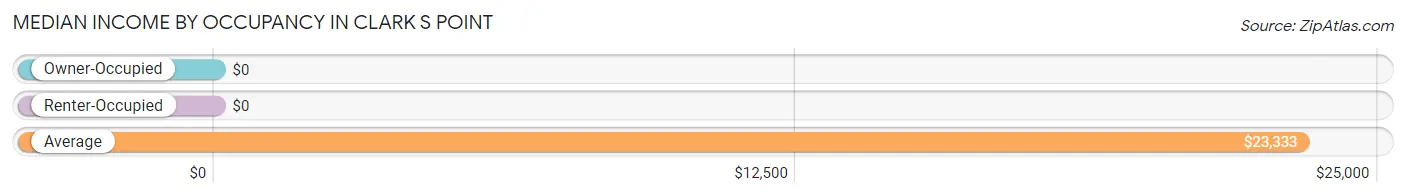
| Occupancy Type | # Households | Median Income |
| Owner-Occupied | 7 (70.0%) | $0 |
| Renter-Occupied | 3 (30.0%) | $0 |
| Average | 10 (100.0%) | $23,333 |
Occupancy by Householder Income Bracket in Clark s Point
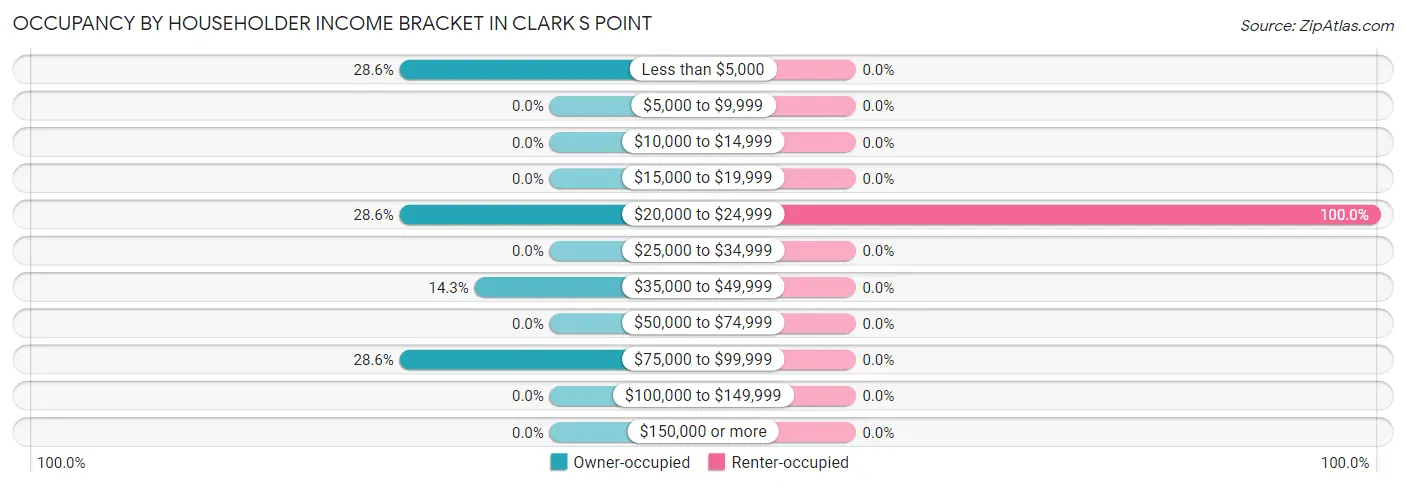
| Income Bracket | Owner-occupied | Renter-occupied |
| Less than $5,000 | 2 (28.6%) | 0 (0.0%) |
| $5,000 to $9,999 | 0 (0.0%) | 0 (0.0%) |
| $10,000 to $14,999 | 0 (0.0%) | 0 (0.0%) |
| $15,000 to $19,999 | 0 (0.0%) | 0 (0.0%) |
| $20,000 to $24,999 | 2 (28.6%) | 3 (100.0%) |
| $25,000 to $34,999 | 0 (0.0%) | 0 (0.0%) |
| $35,000 to $49,999 | 1 (14.3%) | 0 (0.0%) |
| $50,000 to $74,999 | 0 (0.0%) | 0 (0.0%) |
| $75,000 to $99,999 | 2 (28.6%) | 0 (0.0%) |
| $100,000 to $149,999 | 0 (0.0%) | 0 (0.0%) |
| $150,000 or more | 0 (0.0%) | 0 (0.0%) |
| Total | 7 (100.0%) | 3 (100.0%) |
Monthly Housing Cost Tiers in Clark s Point
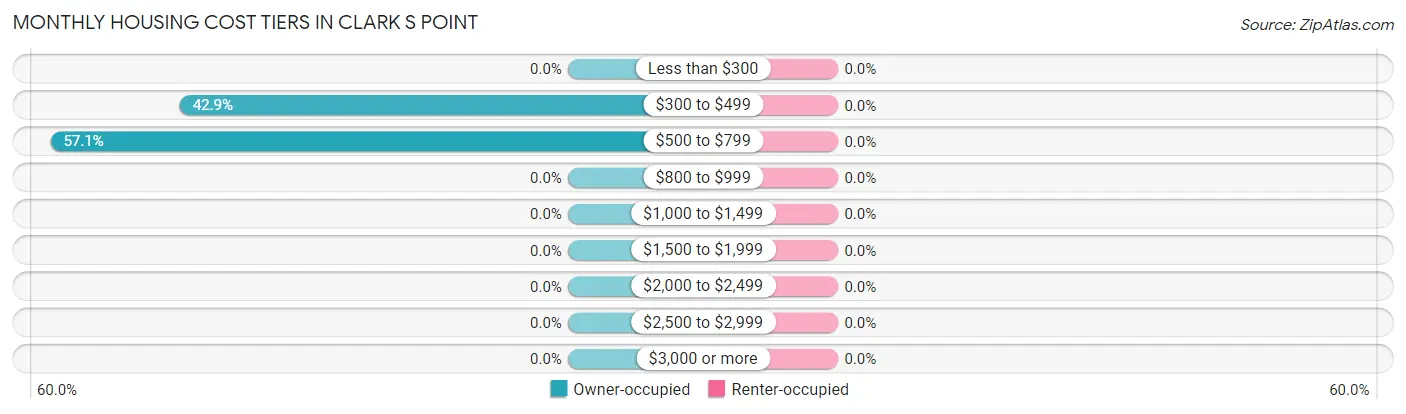
| Monthly Cost | Owner-occupied | Renter-occupied |
| Less than $300 | 0 (0.0%) | 0 (0.0%) |
| $300 to $499 | 3 (42.9%) | 0 (0.0%) |
| $500 to $799 | 4 (57.1%) | 0 (0.0%) |
| $800 to $999 | 0 (0.0%) | 0 (0.0%) |
| $1,000 to $1,499 | 0 (0.0%) | 0 (0.0%) |
| $1,500 to $1,999 | 0 (0.0%) | 0 (0.0%) |
| $2,000 to $2,499 | 0 (0.0%) | 0 (0.0%) |
| $2,500 to $2,999 | 0 (0.0%) | 0 (0.0%) |
| $3,000 or more | 0 (0.0%) | 0 (0.0%) |
| Total | 7 (100.0%) | 3 (100.0%) |
Physical Housing Characteristics in Clark s Point
Housing Structures in Clark s Point
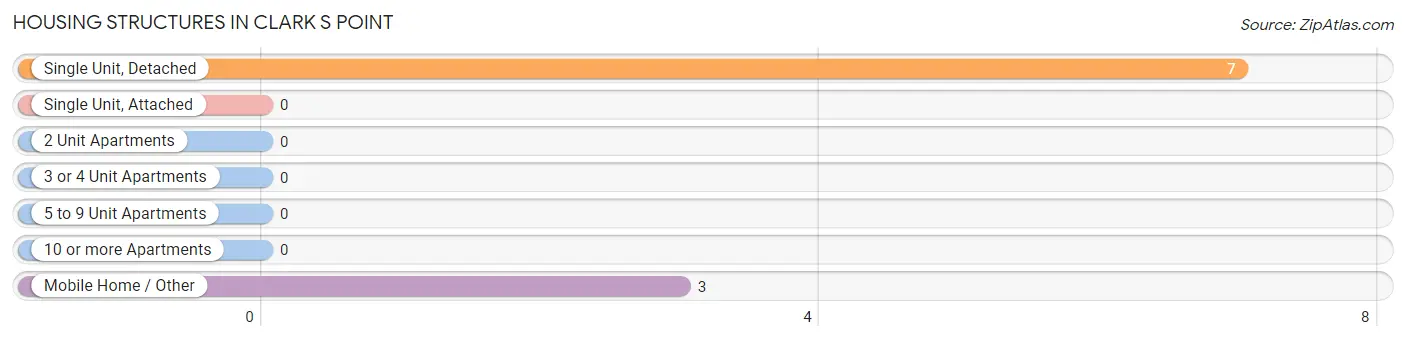
| Structure Type | # Housing Units | % Housing Units |
| Single Unit, Detached | 7 | 70.0% |
| Single Unit, Attached | 0 | 0.0% |
| 2 Unit Apartments | 0 | 0.0% |
| 3 or 4 Unit Apartments | 0 | 0.0% |
| 5 to 9 Unit Apartments | 0 | 0.0% |
| 10 or more Apartments | 0 | 0.0% |
| Mobile Home / Other | 3 | 30.0% |
| Total | 10 | 100.0% |
Housing Structures by Occupancy in Clark s Point
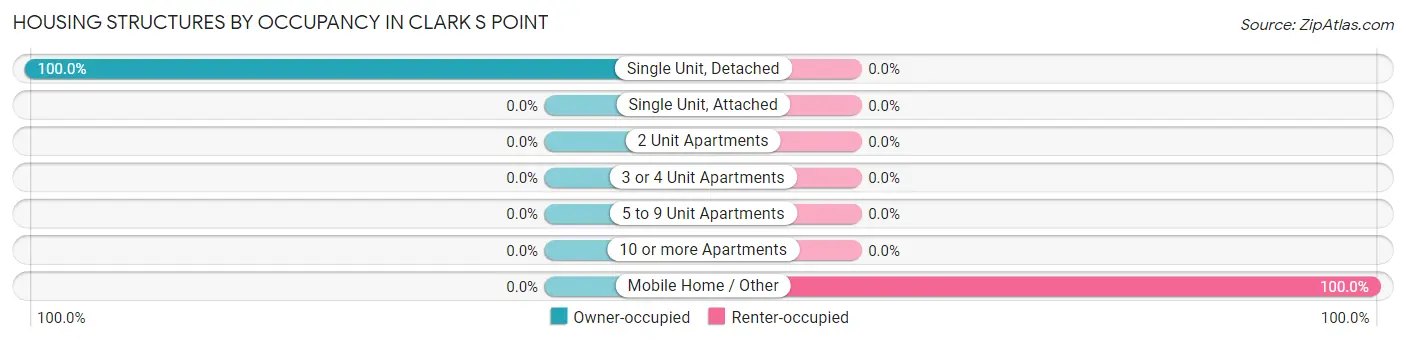
| Structure Type | Owner-occupied | Renter-occupied |
| Single Unit, Detached | 7 (100.0%) | 0 (0.0%) |
| Single Unit, Attached | 0 (0.0%) | 0 (0.0%) |
| 2 Unit Apartments | 0 (0.0%) | 0 (0.0%) |
| 3 or 4 Unit Apartments | 0 (0.0%) | 0 (0.0%) |
| 5 to 9 Unit Apartments | 0 (0.0%) | 0 (0.0%) |
| 10 or more Apartments | 0 (0.0%) | 0 (0.0%) |
| Mobile Home / Other | 0 (0.0%) | 3 (100.0%) |
| Total | 7 (70.0%) | 3 (30.0%) |
Housing Structures by Number of Rooms in Clark s Point
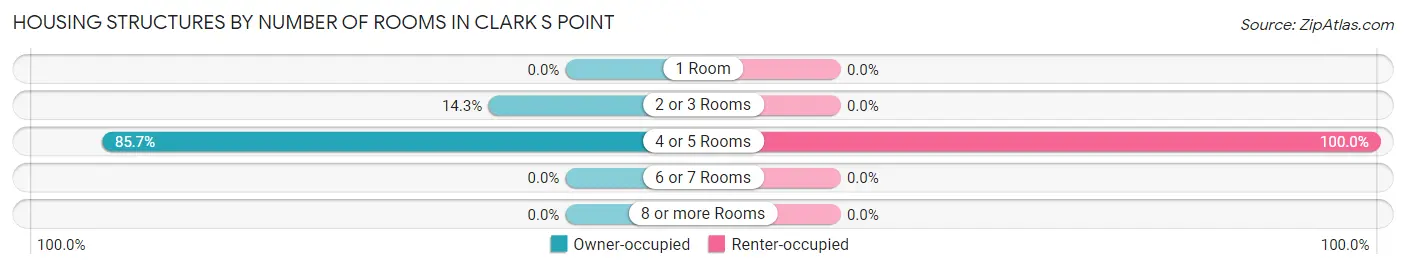
| Number of Rooms | Owner-occupied | Renter-occupied |
| 1 Room | 0 (0.0%) | 0 (0.0%) |
| 2 or 3 Rooms | 1 (14.3%) | 0 (0.0%) |
| 4 or 5 Rooms | 6 (85.7%) | 3 (100.0%) |
| 6 or 7 Rooms | 0 (0.0%) | 0 (0.0%) |
| 8 or more Rooms | 0 (0.0%) | 0 (0.0%) |
| Total | 7 (100.0%) | 3 (100.0%) |
Housing Structure by Heating Type in Clark s Point
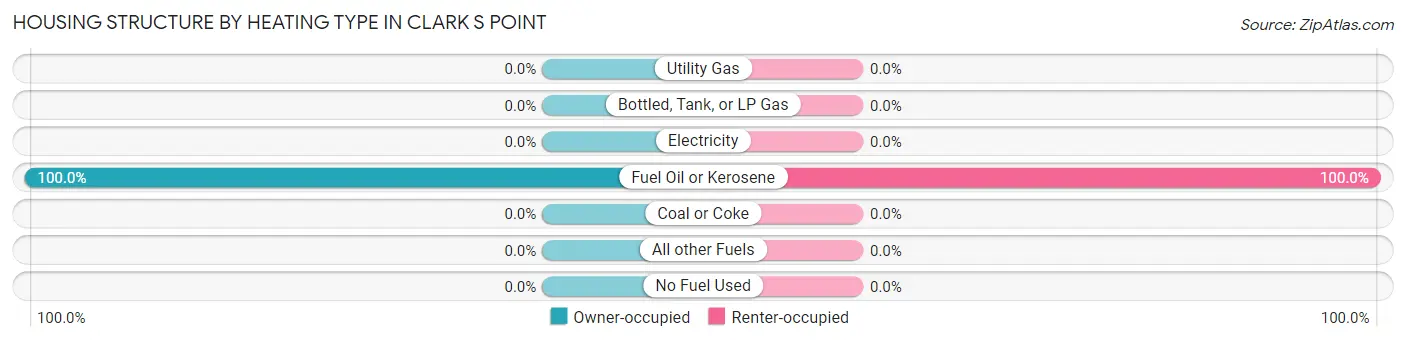
| Heating Type | Owner-occupied | Renter-occupied |
| Utility Gas | 0 (0.0%) | 0 (0.0%) |
| Bottled, Tank, or LP Gas | 0 (0.0%) | 0 (0.0%) |
| Electricity | 0 (0.0%) | 0 (0.0%) |
| Fuel Oil or Kerosene | 7 (100.0%) | 3 (100.0%) |
| Coal or Coke | 0 (0.0%) | 0 (0.0%) |
| All other Fuels | 0 (0.0%) | 0 (0.0%) |
| No Fuel Used | 0 (0.0%) | 0 (0.0%) |
| Total | 7 (100.0%) | 3 (100.0%) |
Household Vehicle Usage in Clark s Point
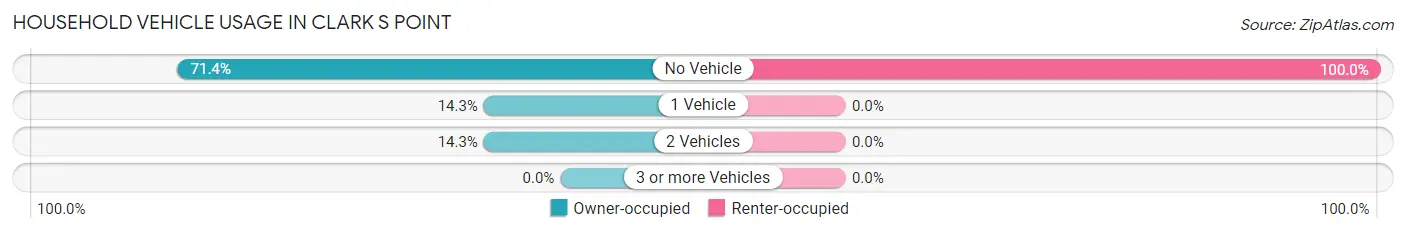
| Vehicles per Household | Owner-occupied | Renter-occupied |
| No Vehicle | 5 (71.4%) | 3 (100.0%) |
| 1 Vehicle | 1 (14.3%) | 0 (0.0%) |
| 2 Vehicles | 1 (14.3%) | 0 (0.0%) |
| 3 or more Vehicles | 0 (0.0%) | 0 (0.0%) |
| Total | 7 (100.0%) | 3 (100.0%) |
Real Estate & Mortgages in Clark s Point
Real Estate and Mortgage Overview in Clark s Point
| Characteristic | Without Mortgage | With Mortgage |
| Housing Units | 7 | 0 |
| Median Property Value | $103,100 | $0 |
| Median Household Income | - | - |
| Monthly Housing Costs | $713 | $0 |
| Real Estate Taxes | - | - |
Property Value by Mortgage Status in Clark s Point
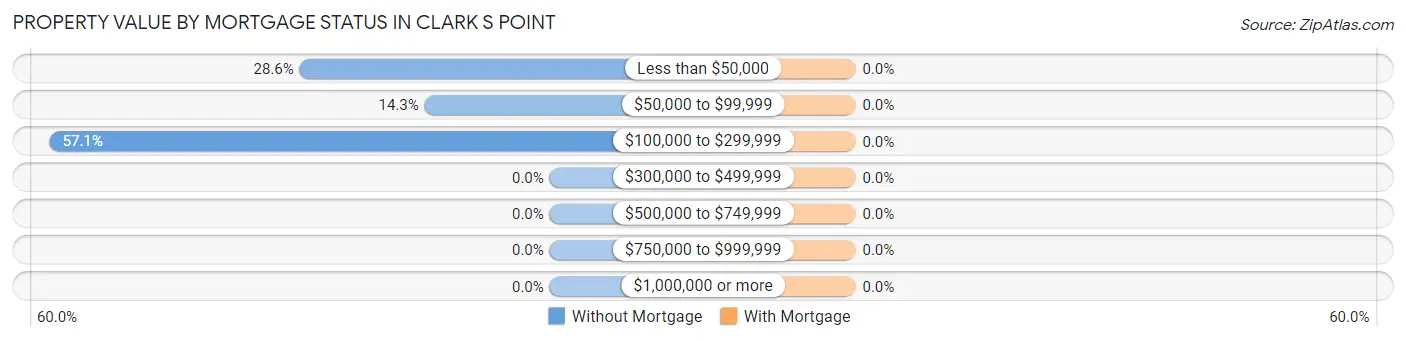
| Property Value | Without Mortgage | With Mortgage |
| Less than $50,000 | 2 (28.6%) | 0 (0.0%) |
| $50,000 to $99,999 | 1 (14.3%) | 0 (0.0%) |
| $100,000 to $299,999 | 4 (57.1%) | 0 (0.0%) |
| $300,000 to $499,999 | 0 (0.0%) | 0 (0.0%) |
| $500,000 to $749,999 | 0 (0.0%) | 0 (0.0%) |
| $750,000 to $999,999 | 0 (0.0%) | 0 (0.0%) |
| $1,000,000 or more | 0 (0.0%) | 0 (0.0%) |
| Total | 7 (100.0%) | 0 (0.0%) |
Household Income by Mortgage Status in Clark s Point
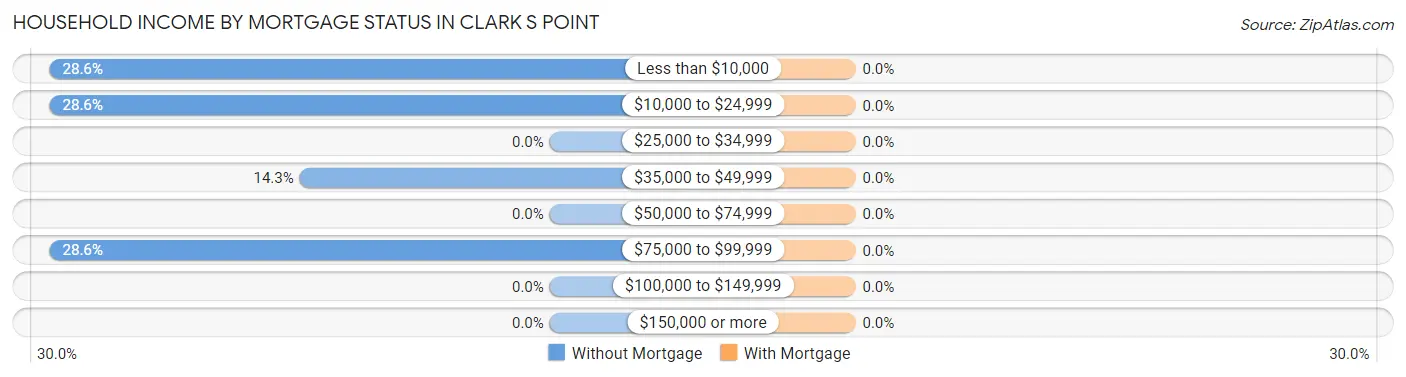
| Household Income | Without Mortgage | With Mortgage |
| Less than $10,000 | 2 (28.6%) | 0 (0.0%) |
| $10,000 to $24,999 | 2 (28.6%) | 0 (0.0%) |
| $25,000 to $34,999 | 0 (0.0%) | 0 (0.0%) |
| $35,000 to $49,999 | 1 (14.3%) | 0 (0.0%) |
| $50,000 to $74,999 | 0 (0.0%) | 0 (0.0%) |
| $75,000 to $99,999 | 2 (28.6%) | 0 (0.0%) |
| $100,000 to $149,999 | 0 (0.0%) | 0 (0.0%) |
| $150,000 or more | 0 (0.0%) | 0 (0.0%) |
| Total | 7 (100.0%) | 0 (0.0%) |
Property Value to Household Income Ratio in Clark s Point
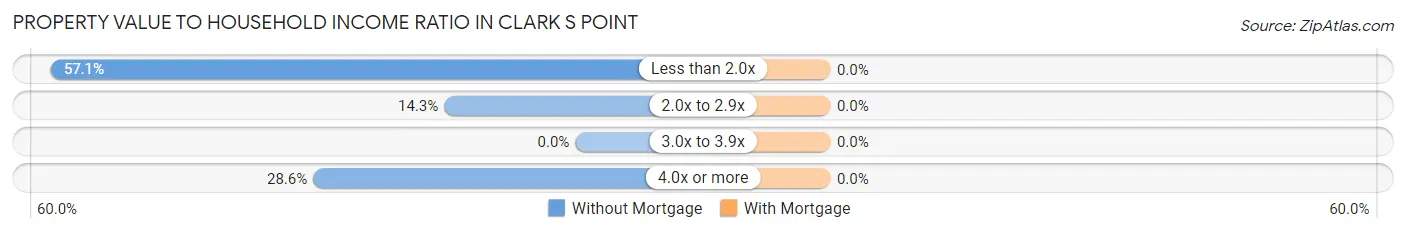
| Value-to-Income Ratio | Without Mortgage | With Mortgage |
| Less than 2.0x | 4 (57.1%) | 0 (0.0%) |
| 2.0x to 2.9x | 1 (14.3%) | 0 (0.0%) |
| 3.0x to 3.9x | 0 (0.0%) | 0 (0.0%) |
| 4.0x or more | 2 (28.6%) | 0 (0.0%) |
| Total | 7 (100.0%) | 0 (0.0%) |
Real Estate Taxes by Mortgage Status in Clark s Point
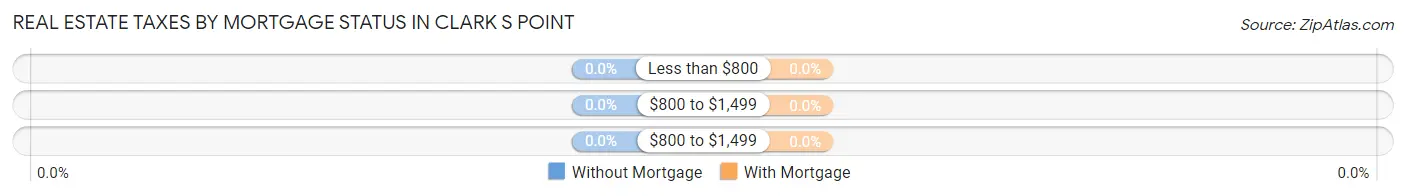
| Property Taxes | Without Mortgage | With Mortgage |
| Less than $800 | 0 (0.0%) | 0 (0.0%) |
| $800 to $1,499 | 0 (0.0%) | 0 (0.0%) |
| $800 to $1,499 | 0 (0.0%) | 0 (0.0%) |
| Total | 7 (100.0%) | 0 (0.0%) |
Health & Disability in Clark s Point
Health Insurance Coverage by Age in Clark s Point
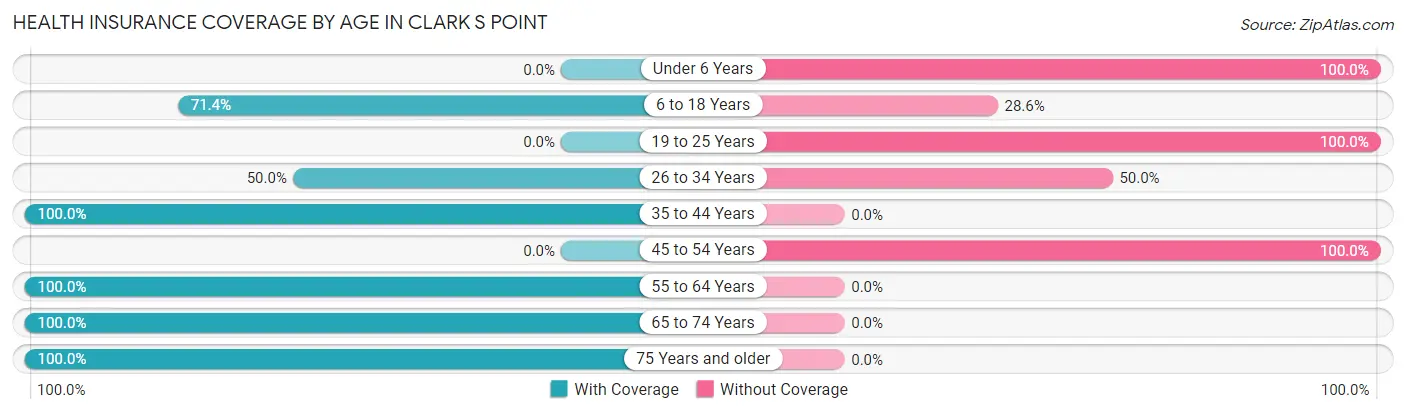
| Age Bracket | With Coverage | Without Coverage |
| Under 6 Years | 0 (0.0%) | 6 (100.0%) |
| 6 to 18 Years | 5 (71.4%) | 2 (28.6%) |
| 19 to 25 Years | 0 (0.0%) | 3 (100.0%) |
| 26 to 34 Years | 2 (50.0%) | 2 (50.0%) |
| 35 to 44 Years | 2 (100.0%) | 0 (0.0%) |
| 45 to 54 Years | 0 (0.0%) | 3 (100.0%) |
| 55 to 64 Years | 1 (100.0%) | 0 (0.0%) |
| 65 to 74 Years | 3 (100.0%) | 0 (0.0%) |
| 75 Years and older | 2 (100.0%) | 0 (0.0%) |
| Total | 15 (48.4%) | 16 (51.6%) |
Health Insurance Coverage by Citizenship Status in Clark s Point
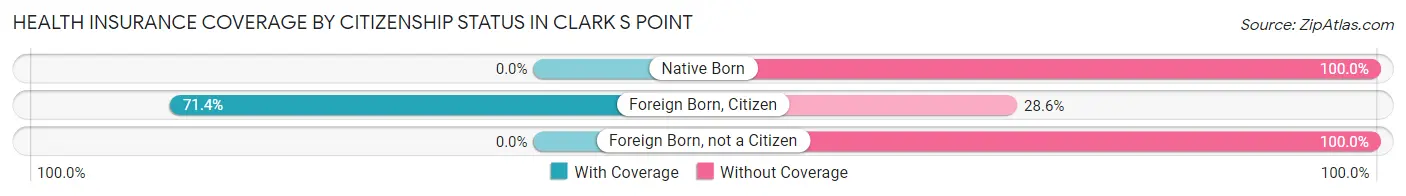
| Citizenship Status | With Coverage | Without Coverage |
| Native Born | 0 (0.0%) | 6 (100.0%) |
| Foreign Born, Citizen | 5 (71.4%) | 2 (28.6%) |
| Foreign Born, not a Citizen | 0 (0.0%) | 3 (100.0%) |
Health Insurance Coverage by Household Income in Clark s Point
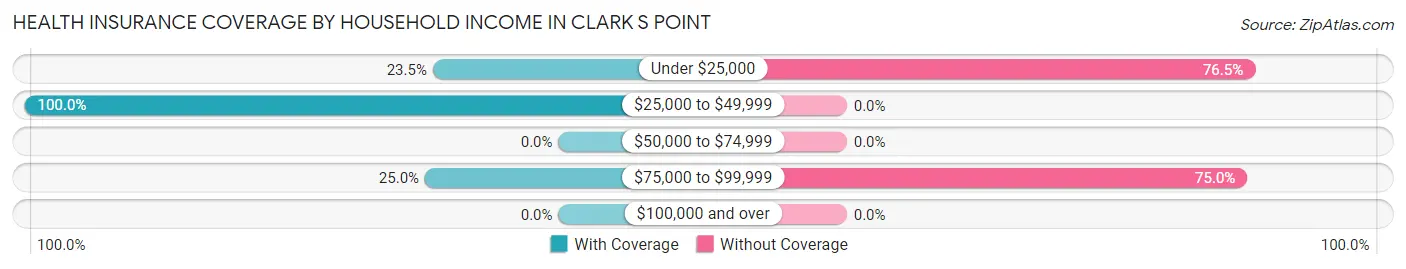
| Household Income | With Coverage | Without Coverage |
| Under $25,000 | 4 (23.5%) | 13 (76.5%) |
| $25,000 to $49,999 | 10 (100.0%) | 0 (0.0%) |
| $50,000 to $74,999 | 0 (0.0%) | 0 (0.0%) |
| $75,000 to $99,999 | 1 (25.0%) | 3 (75.0%) |
| $100,000 and over | 0 (0.0%) | 0 (0.0%) |
Public vs Private Health Insurance Coverage by Age in Clark s Point
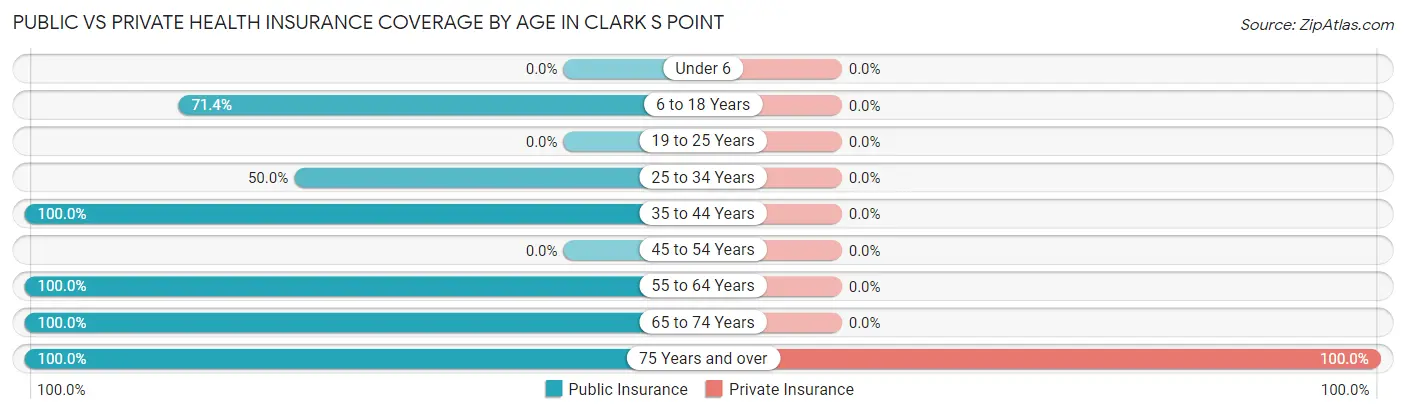
| Age Bracket | Public Insurance | Private Insurance |
| Under 6 | 0 (0.0%) | 0 (0.0%) |
| 6 to 18 Years | 5 (71.4%) | 0 (0.0%) |
| 19 to 25 Years | 0 (0.0%) | 0 (0.0%) |
| 25 to 34 Years | 2 (50.0%) | 0 (0.0%) |
| 35 to 44 Years | 2 (100.0%) | 0 (0.0%) |
| 45 to 54 Years | 0 (0.0%) | 0 (0.0%) |
| 55 to 64 Years | 1 (100.0%) | 0 (0.0%) |
| 65 to 74 Years | 3 (100.0%) | 0 (0.0%) |
| 75 Years and over | 2 (100.0%) | 2 (100.0%) |
| Total | 15 (48.4%) | 2 (6.5%) |
Disability Status by Sex by Age in Clark s Point
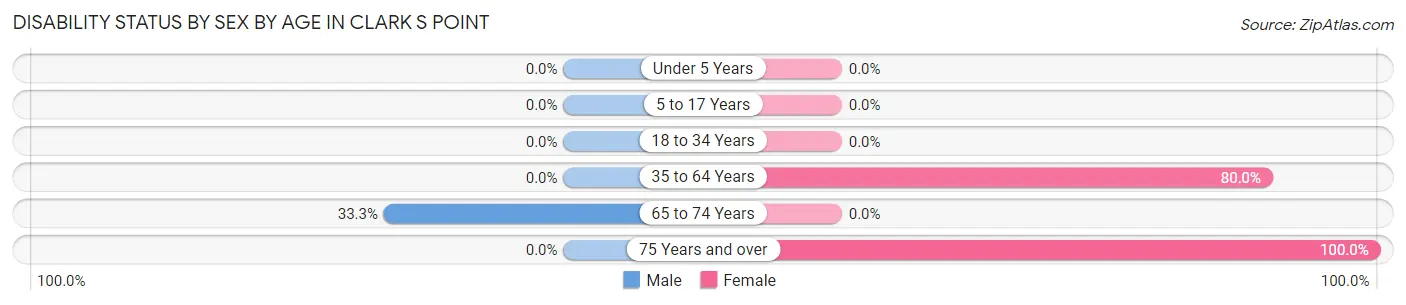
| Age Bracket | Male | Female |
| Under 5 Years | 0 (0.0%) | 0 (0.0%) |
| 5 to 17 Years | 0 (0.0%) | 0 (0.0%) |
| 18 to 34 Years | 0 (0.0%) | 0 (0.0%) |
| 35 to 64 Years | 0 (0.0%) | 4 (80.0%) |
| 65 to 74 Years | 1 (33.3%) | 0 (0.0%) |
| 75 Years and over | 0 (0.0%) | 2 (100.0%) |
Disability Class by Sex by Age in Clark s Point
Disability Class: Hearing Difficulty
| Age Bracket | Male | Female |
| Under 5 Years | 0 (0.0%) | 0 (0.0%) |
| 5 to 17 Years | 0 (0.0%) | 0 (0.0%) |
| 18 to 34 Years | 0 (0.0%) | 0 (0.0%) |
| 35 to 64 Years | 0 (0.0%) | 0 (0.0%) |
| 65 to 74 Years | 0 (0.0%) | 0 (0.0%) |
| 75 Years and over | 0 (0.0%) | 0 (0.0%) |
Disability Class: Vision Difficulty
| Age Bracket | Male | Female |
| Under 5 Years | 0 (0.0%) | 0 (0.0%) |
| 5 to 17 Years | 0 (0.0%) | 0 (0.0%) |
| 18 to 34 Years | 0 (0.0%) | 0 (0.0%) |
| 35 to 64 Years | 0 (0.0%) | 0 (0.0%) |
| 65 to 74 Years | 0 (0.0%) | 0 (0.0%) |
| 75 Years and over | 0 (0.0%) | 0 (0.0%) |
Disability Class: Cognitive Difficulty
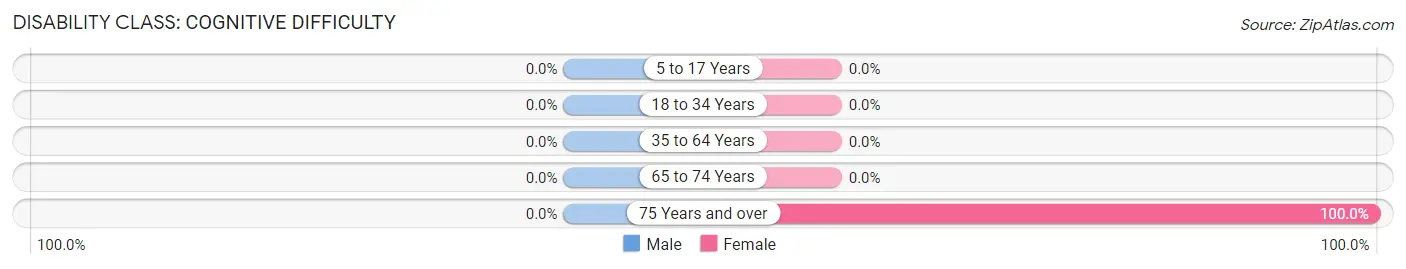
| Age Bracket | Male | Female |
| 5 to 17 Years | 0 (0.0%) | 0 (0.0%) |
| 18 to 34 Years | 0 (0.0%) | 0 (0.0%) |
| 35 to 64 Years | 0 (0.0%) | 0 (0.0%) |
| 65 to 74 Years | 0 (0.0%) | 0 (0.0%) |
| 75 Years and over | 0 (0.0%) | 2 (100.0%) |
Disability Class: Ambulatory Difficulty
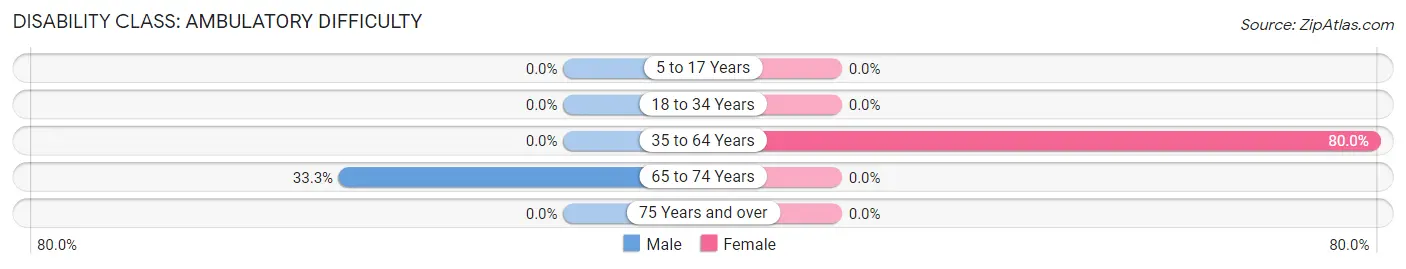
| Age Bracket | Male | Female |
| 5 to 17 Years | 0 (0.0%) | 0 (0.0%) |
| 18 to 34 Years | 0 (0.0%) | 0 (0.0%) |
| 35 to 64 Years | 0 (0.0%) | 4 (80.0%) |
| 65 to 74 Years | 1 (33.3%) | 0 (0.0%) |
| 75 Years and over | 0 (0.0%) | 0 (0.0%) |
Disability Class: Self-Care Difficulty
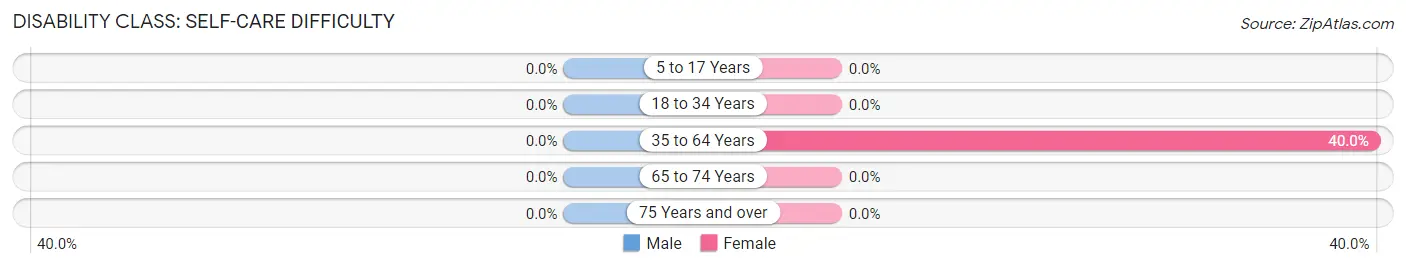
| Age Bracket | Male | Female |
| 5 to 17 Years | 0 (0.0%) | 0 (0.0%) |
| 18 to 34 Years | 0 (0.0%) | 0 (0.0%) |
| 35 to 64 Years | 0 (0.0%) | 2 (40.0%) |
| 65 to 74 Years | 0 (0.0%) | 0 (0.0%) |
| 75 Years and over | 0 (0.0%) | 0 (0.0%) |
Technology Access in Clark s Point
Computing Device Access in Clark s Point
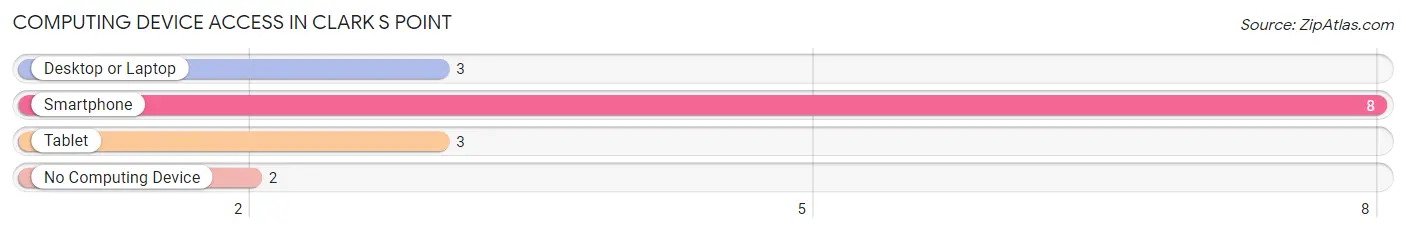
| Device Type | # Households | % Households |
| Desktop or Laptop | 3 | 30.0% |
| Smartphone | 8 | 80.0% |
| Tablet | 3 | 30.0% |
| No Computing Device | 2 | 20.0% |
| Total | 10 | 100.0% |
Internet Access in Clark s Point
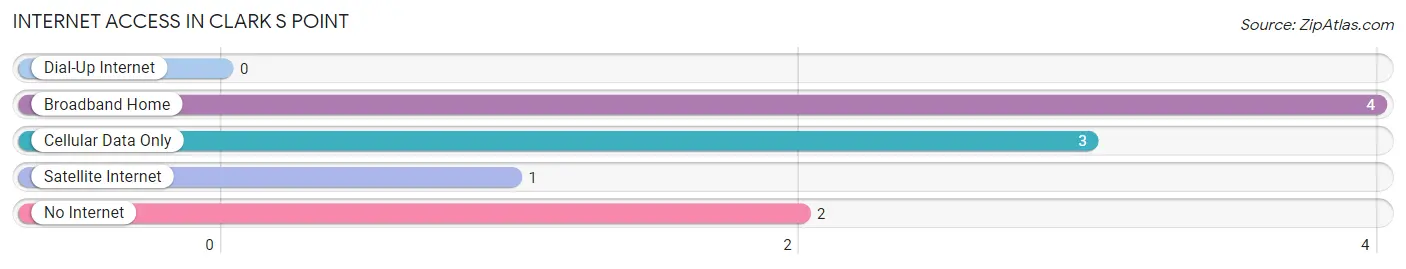
| Internet Type | # Households | % Households |
| Dial-Up Internet | 0 | 0.0% |
| Broadband Home | 4 | 40.0% |
| Cellular Data Only | 3 | 30.0% |
| Satellite Internet | 1 | 10.0% |
| No Internet | 2 | 20.0% |
| Total | 10 | 100.0% |
Clark s Point Summary
Clark's Point is a small unincorporated community located in the Aleutians East Borough of Alaska. It is situated on the western shore of Unalaska Bay, approximately 25 miles southwest of the city of Unalaska. The population of Clark's Point was estimated to be around 100 people in 2020.
History
The area around Clark's Point has been inhabited by the Unangan people for thousands of years. The Unangan people are the indigenous people of the Aleutian Islands and are believed to have first arrived in the area around 10,000 years ago. The Unangan people were semi-nomadic hunter-gatherers who relied on the abundant marine life in the area for sustenance.
The first recorded European contact with the Unangan people of Clark's Point was in 1741 when the Russian explorer Vitus Bering sailed through the area. The Russians established a trading post in the area in 1784 and began trading with the Unangan people. The Russians also introduced the Unangan people to Christianity and established a church in the area.
In 1867, the United States purchased Alaska from Russia and the area around Clark's Point became part of the United States. The United States established a military base in the area in 1941 and the population of Clark's Point began to grow. The military base was closed in 1947 and the population of Clark's Point began to decline.
Geography
Clark's Point is located on the western shore of Unalaska Bay, approximately 25 miles southwest of the city of Unalaska. The area around Clark's Point is mostly flat and is covered in tundra. The climate in the area is subarctic and is characterized by cold winters and mild summers.
The area around Clark's Point is home to a variety of wildlife including sea otters, seals, sea lions, whales, and a variety of birds. The waters around Clark's Point are also home to a variety of fish including salmon, halibut, and cod.
Economy
The economy of Clark's Point is largely based on fishing and subsistence hunting. The waters around Clark's Point are home to a variety of fish including salmon, halibut, and cod. The Unangan people of Clark's Point also rely on subsistence hunting for sustenance.
The area around Clark's Point is also home to a variety of tourist attractions including the Unalaska Bay National Wildlife Refuge and the Unalaska Bay State Marine Park. The Unalaska Bay National Wildlife Refuge is home to a variety of wildlife including sea otters, seals, sea lions, whales, and a variety of birds. The Unalaska Bay State Marine Park is a popular destination for kayaking, fishing, and wildlife viewing.
Demographics
The population of Clark's Point was estimated to be around 100 people in 2020. The majority of the population is of Unangan descent. The Unangan people are the indigenous people of the Aleutian Islands and are believed to have first arrived in the area around 10,000 years ago. The Unangan people of Clark's Point are primarily Roman Catholic.
The majority of the population of Clark's Point is employed in the fishing and tourism industries. The area around Clark's Point is home to a variety of tourist attractions including the Unalaska Bay National Wildlife Refuge and the Unalaska Bay State Marine Park. The Unalaska Bay National Wildlife Refuge is home to a variety of wildlife including sea otters, seals, sea lions, whales, and a variety of birds. The Unalaska Bay State Marine Park is a popular destination for kayaking, fishing, and wildlife viewing.
Common Questions
What is Per Capita Income in Clark s Point?
Per Capita income in Clark s Point is $11,397.
What is the Median Household income in Clark s Point?
Median Household Income in Clark s Point is $23,333.
What is Inequality or Gini Index in Clark s Point?
Inequality or Gini Index in Clark s Point is 0.43.
What is the Total Population of Clark s Point?
Total Population of Clark s Point is 31.
What is the Total Male Population of Clark s Point?
Total Male Population of Clark s Point is 11.
What is the Total Female Population of Clark s Point?
Total Female Population of Clark s Point is 20.
What is the Ratio of Males per 100 Females in Clark s Point?
There are 55.00 Males per 100 Females in Clark s Point.
What is the Ratio of Females per 100 Males in Clark s Point?
There are 181.82 Females per 100 Males in Clark s Point.
What is the Median Population Age in Clark s Point?
Median Population Age in Clark s Point is 24.8 Years.
What is the Average Family Size in Clark s Point
Average Family Size in Clark s Point is 4.8 People.
What is the Average Household Size in Clark s Point
Average Household Size in Clark s Point is 3.1 People.
How Large is the Labor Force in Clark s Point?
There are 12 People in the Labor Forcein in Clark s Point.
What is the Percentage of People in the Labor Force in Clark s Point?
66.7% of People are in the Labor Force in Clark s Point.
What is the Unemployment Rate in Clark s Point?
Unemployment Rate in Clark s Point is 25.0%.