Holy Cross, AK Map & Demographics
Holy Cross Map
Holy Cross Overview
$17,373
PER CAPITA INCOME
$49,063
AVG FAMILY INCOME
$33,571
AVG HOUSEHOLD INCOME
0.43
INEQUALITY / GINI INDEX
277
TOTAL POPULATION
185
MALE POPULATION
92
FEMALE POPULATION
201.09
MALES / 100 FEMALES
49.73
FEMALES / 100 MALES
35.0
MEDIAN AGE
4.2
AVG FAMILY SIZE
2.8
AVG HOUSEHOLD SIZE
123
LABOR FORCE [ PEOPLE ]
59.4%
PERCENT IN LABOR FORCE
12.2%
UNEMPLOYMENT RATE
Holy Cross Zip Codes
Holy Cross Area Codes
Income in Holy Cross
Income Overview in Holy Cross
Per Capita Income in Holy Cross is $17,373, while median incomes of families and households are $49,063 and $33,571 respectively.
| Characteristic | Number | Measure |
| Per Capita Income | 277 | $17,373 |
| Median Family Income | 47 | $49,063 |
| Mean Family Income | 47 | $55,713 |
| Median Household Income | 100 | $33,571 |
| Mean Household Income | 100 | $46,842 |
| Income Deficit | 47 | $0 |
| Wage / Income Gap (%) | 277 | 0.00% |
| Wage / Income Gap ($) | 277 | 100.00¢ per $1 |
| Gini / Inequality Index | 277 | 0.43 |
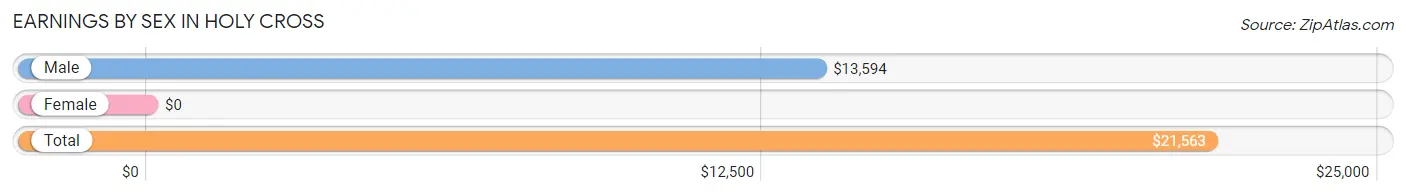
Earnings by Sex in Holy Cross
| Sex | Number | Average Earnings |
| Male | 59 (50.4%) | $13,594 |
| Female | 58 (49.6%) | $0 |
| Total | 117 (100.0%) | $21,563 |
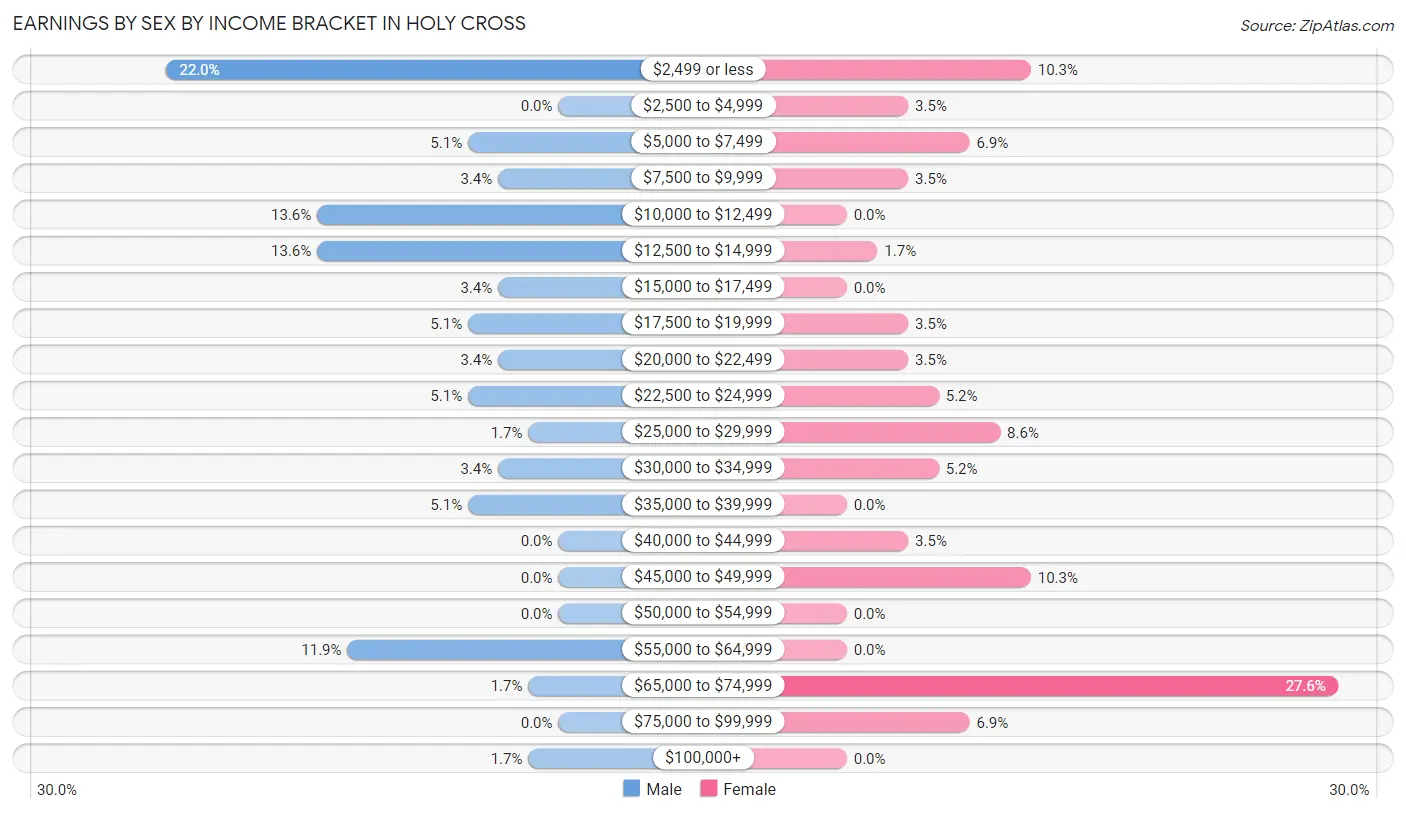
Earnings by Sex by Income Bracket in Holy Cross
The most common earnings brackets in Holy Cross are $2,499 or less for men (13 | 22.0%) and $65,000 to $74,999 for women (16 | 27.6%).
| Income | Male | Female |
| $2,499 or less | 13 (22.0%) | 6 (10.3%) |
| $2,500 to $4,999 | 0 (0.0%) | 2 (3.5%) |
| $5,000 to $7,499 | 3 (5.1%) | 4 (6.9%) |
| $7,500 to $9,999 | 2 (3.4%) | 2 (3.5%) |
| $10,000 to $12,499 | 8 (13.6%) | 0 (0.0%) |
| $12,500 to $14,999 | 8 (13.6%) | 1 (1.7%) |
| $15,000 to $17,499 | 2 (3.4%) | 0 (0.0%) |
| $17,500 to $19,999 | 3 (5.1%) | 2 (3.5%) |
| $20,000 to $22,499 | 2 (3.4%) | 2 (3.5%) |
| $22,500 to $24,999 | 3 (5.1%) | 3 (5.2%) |
| $25,000 to $29,999 | 1 (1.7%) | 5 (8.6%) |
| $30,000 to $34,999 | 2 (3.4%) | 3 (5.2%) |
| $35,000 to $39,999 | 3 (5.1%) | 0 (0.0%) |
| $40,000 to $44,999 | 0 (0.0%) | 2 (3.5%) |
| $45,000 to $49,999 | 0 (0.0%) | 6 (10.3%) |
| $50,000 to $54,999 | 0 (0.0%) | 0 (0.0%) |
| $55,000 to $64,999 | 7 (11.9%) | 0 (0.0%) |
| $65,000 to $74,999 | 1 (1.7%) | 16 (27.6%) |
| $75,000 to $99,999 | 0 (0.0%) | 4 (6.9%) |
| $100,000+ | 1 (1.7%) | 0 (0.0%) |
| Total | 59 (100.0%) | 58 (100.0%) |
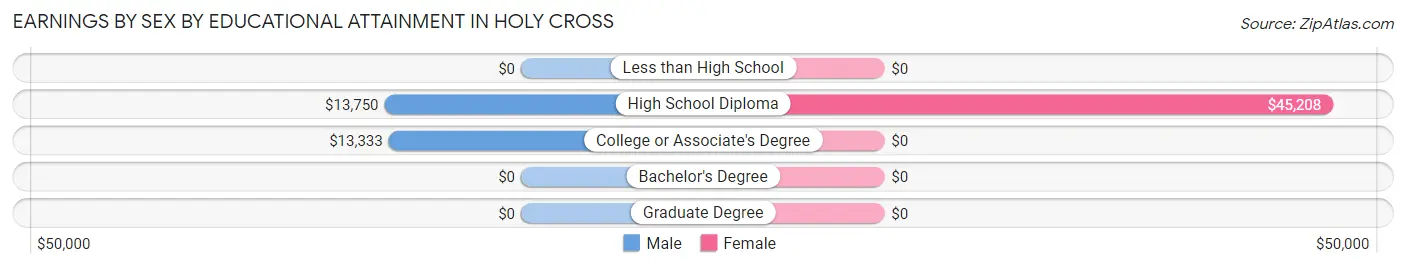
Earnings by Sex by Educational Attainment in Holy Cross
Average earnings in Holy Cross are $14,375 for men and $45,625 for women, a difference of 68.5%. Men with an educational attainment of high school diploma enjoy the highest average annual earnings of $13,750, while those with college or associate's degree education earn the least with $13,333. Women with an educational attainment of high school diploma earn the most with the average annual earnings of $45,208, while those with high school diploma education have the smallest earnings of $45,208.
| Educational Attainment | Male Income | Female Income |
| Less than High School | - | - |
| High School Diploma | $13,750 | $45,208 |
| College or Associate's Degree | $13,333 | $0 |
| Bachelor's Degree | - | - |
| Graduate Degree | - | - |
| Total | $14,375 | $45,625 |
Family Income in Holy Cross
Family Income Brackets in Holy Cross
According to the Holy Cross family income data, there are 11 families falling into the $75,000 to $99,999 income range, which is the most common income bracket and makes up 23.4% of all families.
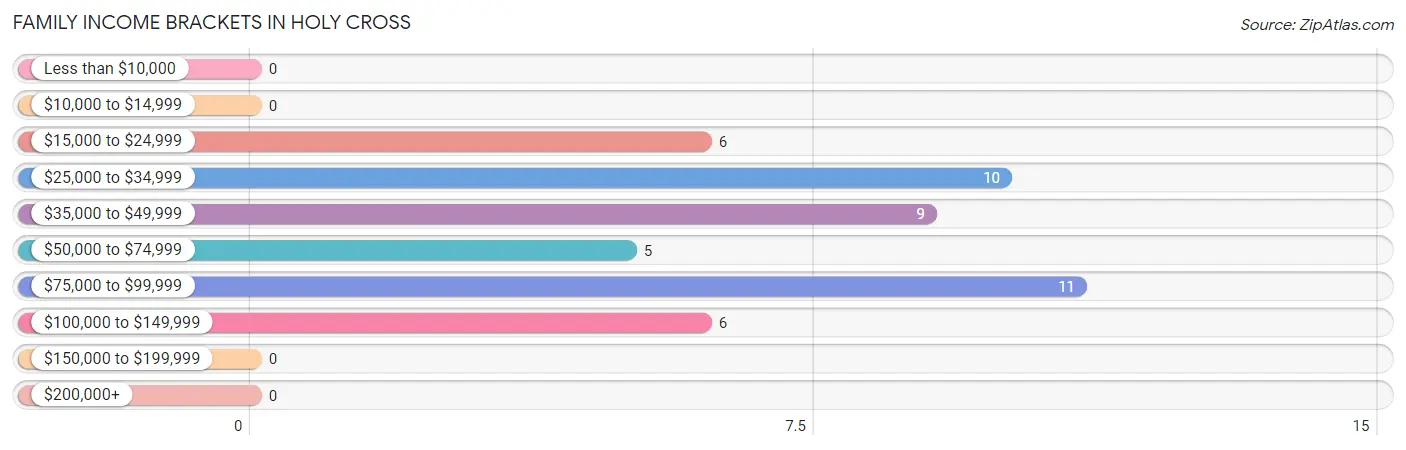
| Income Bracket | # Families | % Families |
| Less than $10,000 | 0 | 0.0% |
| $10,000 to $14,999 | 0 | 0.0% |
| $15,000 to $24,999 | 6 | 12.8% |
| $25,000 to $34,999 | 10 | 21.3% |
| $35,000 to $49,999 | 9 | 19.1% |
| $50,000 to $74,999 | 5 | 10.6% |
| $75,000 to $99,999 | 11 | 23.4% |
| $100,000 to $149,999 | 6 | 12.8% |
| $150,000 to $199,999 | 0 | 0.0% |
| $200,000+ | 0 | 0.0% |
Family Income by Famaliy Size in Holy Cross
4-person families (17 | 36.2%) account for the highest median family income in Holy Cross with $75,568 per family, while 4-person families (17 | 36.2%) have the highest median income of $18,892 per family member.
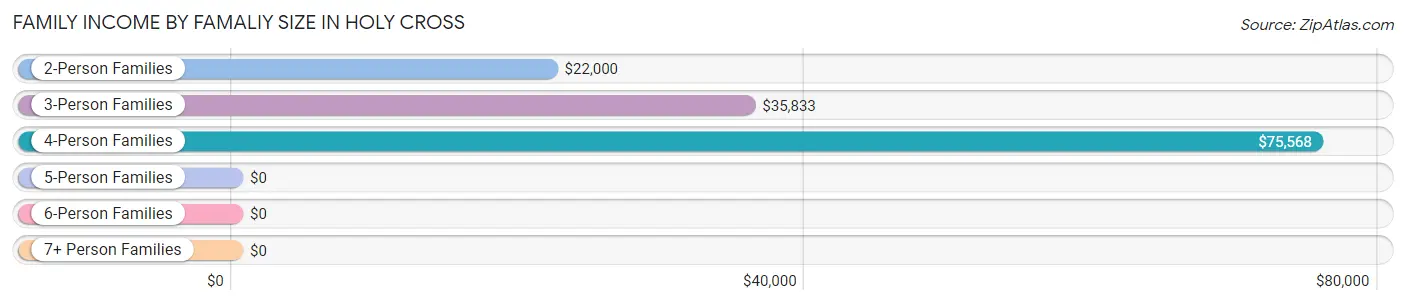
| Income Bracket | # Families | Median Income |
| 2-Person Families | 8 (17.0%) | $22,000 |
| 3-Person Families | 14 (29.8%) | $35,833 |
| 4-Person Families | 17 (36.2%) | $75,568 |
| 5-Person Families | 6 (12.8%) | $0 |
| 6-Person Families | 2 (4.3%) | $0 |
| 7+ Person Families | 0 (0.0%) | $0 |
| Total | 47 (100.0%) | $49,063 |
Family Income by Number of Earners in Holy Cross
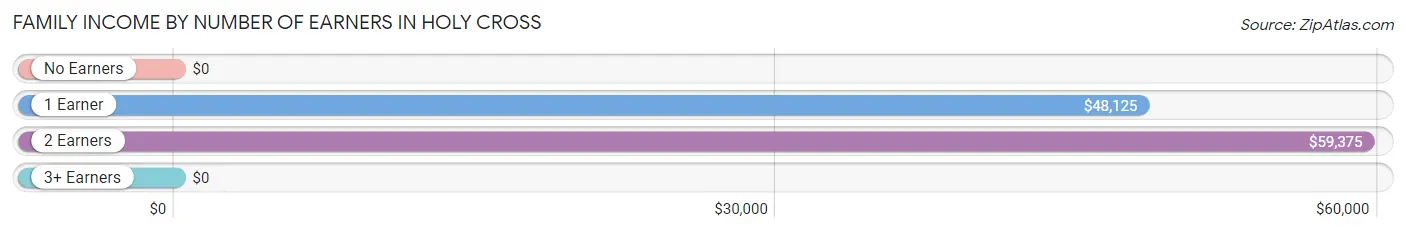
| Number of Earners | # Families | Median Income |
| No Earners | 4 (8.5%) | $0 |
| 1 Earner | 28 (59.6%) | $48,125 |
| 2 Earners | 15 (31.9%) | $59,375 |
| 3+ Earners | 0 (0.0%) | $0 |
| Total | 47 (100.0%) | $49,063 |
Household Income in Holy Cross
Household Income Brackets in Holy Cross
With 28 households falling in the category, the $15,000 to $24,999 income range is the most frequent in Holy Cross, accounting for 28.0% of all households.
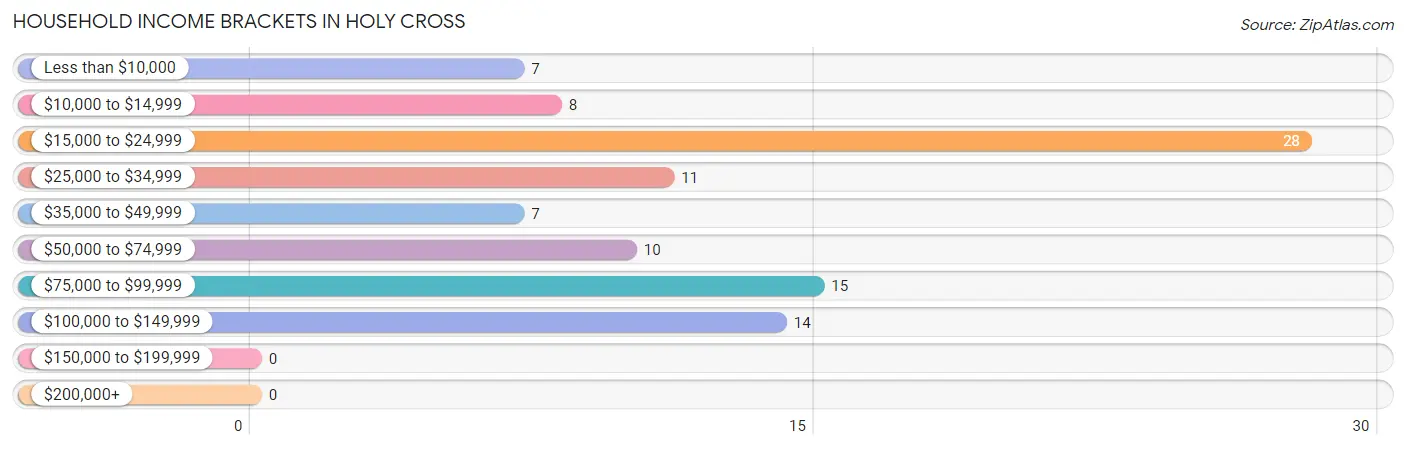
| Income Bracket | # Households | % Households |
| Less than $10,000 | 7 | 7.0% |
| $10,000 to $14,999 | 8 | 8.0% |
| $15,000 to $24,999 | 28 | 28.0% |
| $25,000 to $34,999 | 11 | 11.0% |
| $35,000 to $49,999 | 7 | 7.0% |
| $50,000 to $74,999 | 10 | 10.0% |
| $75,000 to $99,999 | 15 | 15.0% |
| $100,000 to $149,999 | 14 | 14.0% |
| $150,000 to $199,999 | 0 | 0.0% |
| $200,000+ | 0 | 0.0% |
Household Income by Householder Age in Holy Cross
The median household income in Holy Cross is $33,571, with the highest median household income of $54,375 found in the 45 to 64 years age bracket for the primary householder. A total of 35 households (35.0%) fall into this category.
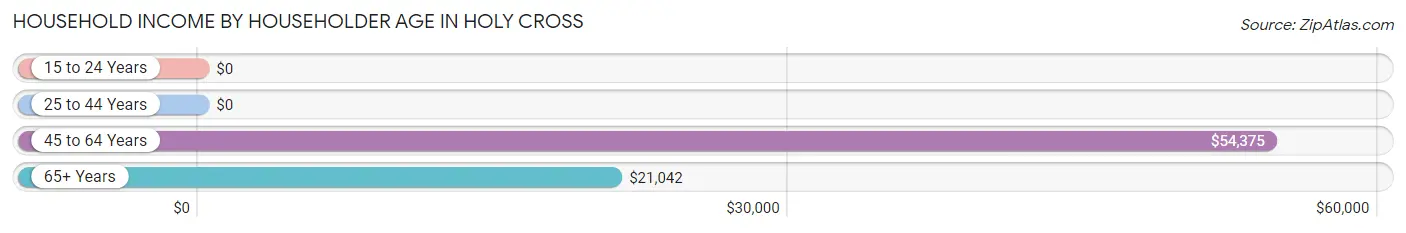
| Income Bracket | # Households | Median Income |
| 15 to 24 Years | 0 (0.0%) | $0 |
| 25 to 44 Years | 34 (34.0%) | $0 |
| 45 to 64 Years | 35 (35.0%) | $54,375 |
| 65+ Years | 31 (31.0%) | $21,042 |
| Total | 100 (100.0%) | $33,571 |
Poverty in Holy Cross
Income Below Poverty by Sex and Age in Holy Cross
With 14.6% poverty level for males and 25.0% for females among the residents of Holy Cross, 35 to 44 year old males and 5 year old females are the most vulnerable to poverty, with 6 males (31.6%) and 3 females (100.0%) in their respective age groups living below the poverty level.
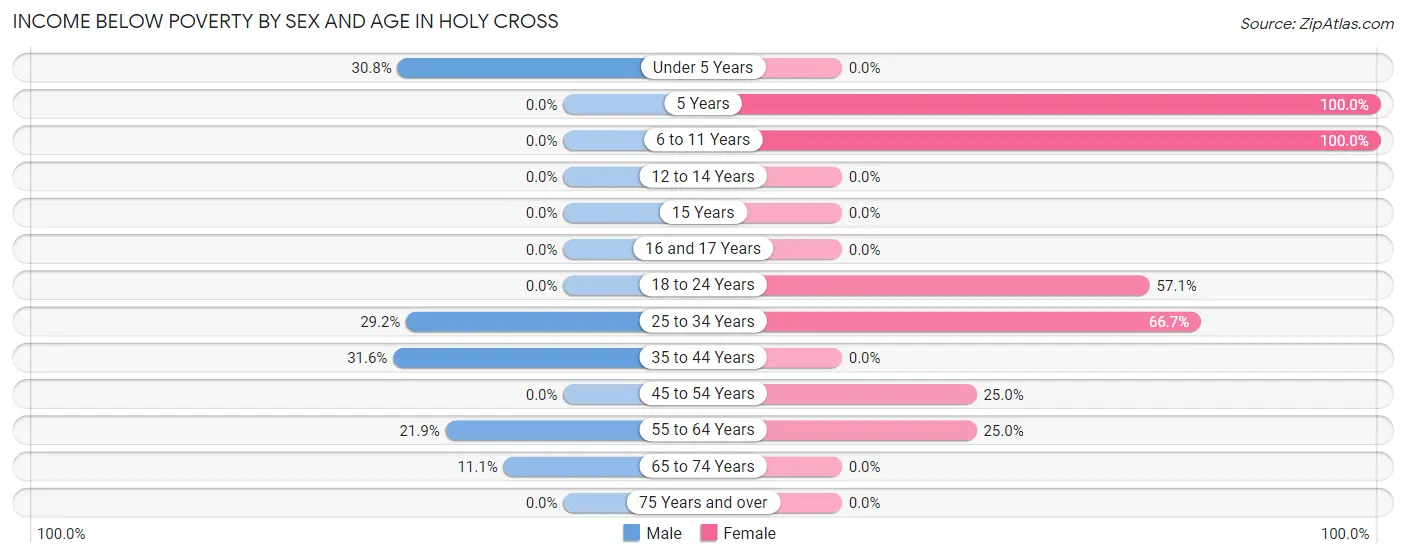
| Age Bracket | Male | Female |
| Under 5 Years | 4 (30.8%) | 0 (0.0%) |
| 5 Years | 0 (0.0%) | 3 (100.0%) |
| 6 to 11 Years | 0 (0.0%) | 3 (100.0%) |
| 12 to 14 Years | 0 (0.0%) | 0 (0.0%) |
| 15 Years | 0 (0.0%) | 0 (0.0%) |
| 16 and 17 Years | 0 (0.0%) | 0 (0.0%) |
| 18 to 24 Years | 0 (0.0%) | 4 (57.1%) |
| 25 to 34 Years | 7 (29.2%) | 4 (66.7%) |
| 35 to 44 Years | 6 (31.6%) | 0 (0.0%) |
| 45 to 54 Years | 0 (0.0%) | 3 (25.0%) |
| 55 to 64 Years | 7 (21.9%) | 6 (25.0%) |
| 65 to 74 Years | 3 (11.1%) | 0 (0.0%) |
| 75 Years and over | 0 (0.0%) | 0 (0.0%) |
| Total | 27 (14.6%) | 23 (25.0%) |
Income Above Poverty by Sex and Age in Holy Cross
According to the poverty statistics in Holy Cross, males aged 5 years and females aged under 5 years are the age groups that are most secure financially, with 100.0% of males and 100.0% of females in these age groups living above the poverty line.
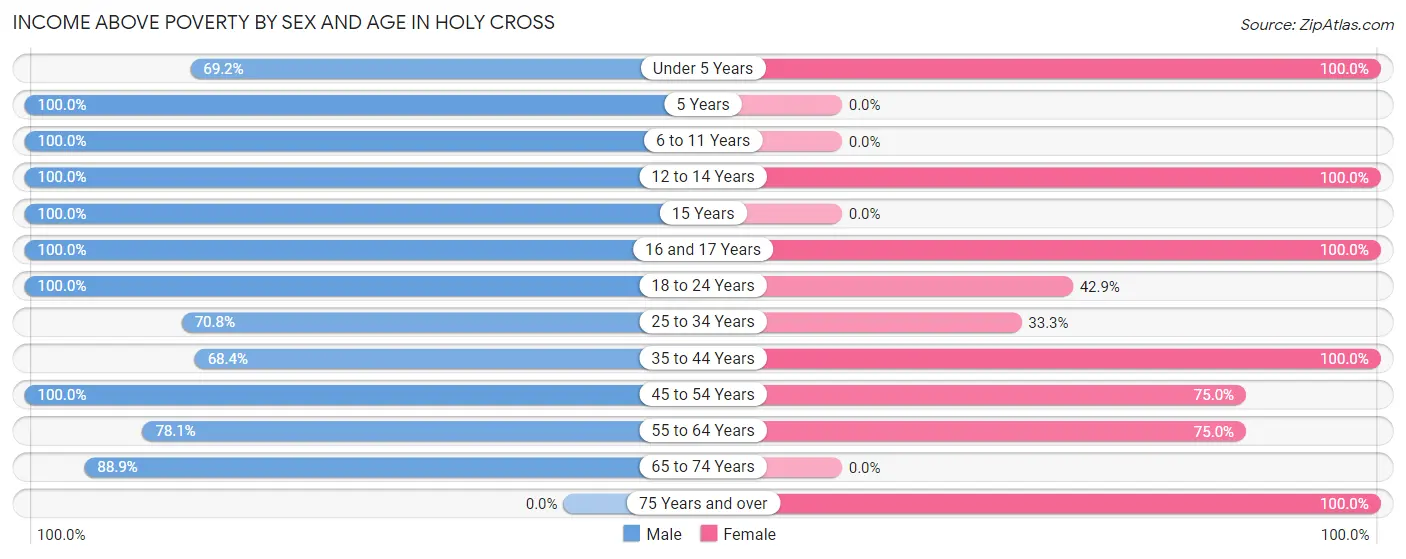
| Age Bracket | Male | Female |
| Under 5 Years | 9 (69.2%) | 5 (100.0%) |
| 5 Years | 3 (100.0%) | 0 (0.0%) |
| 6 to 11 Years | 4 (100.0%) | 0 (0.0%) |
| 12 to 14 Years | 27 (100.0%) | 8 (100.0%) |
| 15 Years | 4 (100.0%) | 0 (0.0%) |
| 16 and 17 Years | 23 (100.0%) | 5 (100.0%) |
| 18 to 24 Years | 3 (100.0%) | 3 (42.9%) |
| 25 to 34 Years | 17 (70.8%) | 2 (33.3%) |
| 35 to 44 Years | 13 (68.4%) | 15 (100.0%) |
| 45 to 54 Years | 6 (100.0%) | 9 (75.0%) |
| 55 to 64 Years | 25 (78.1%) | 18 (75.0%) |
| 65 to 74 Years | 24 (88.9%) | 0 (0.0%) |
| 75 Years and over | 0 (0.0%) | 4 (100.0%) |
| Total | 158 (85.4%) | 69 (75.0%) |
Income Below Poverty Among Married-Couple Families in Holy Cross
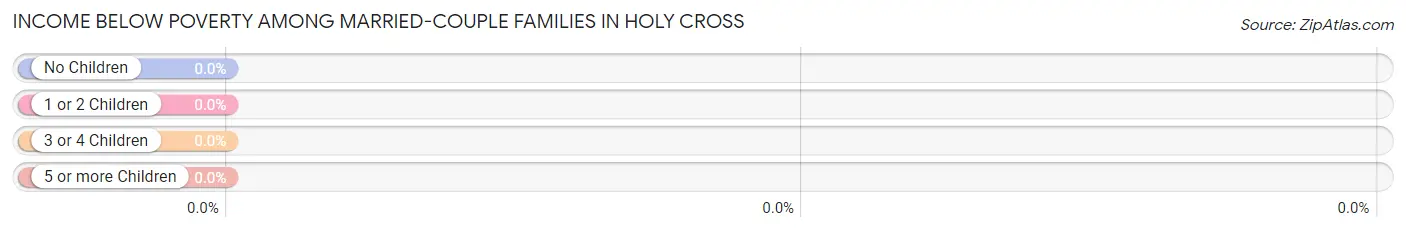
| Children | Above Poverty | Below Poverty |
| No Children | 0 (0.0%) | 0 (0.0%) |
| 1 or 2 Children | 21 (100.0%) | 0 (0.0%) |
| 3 or 4 Children | 0 (0.0%) | 0 (0.0%) |
| 5 or more Children | 0 (0.0%) | 0 (0.0%) |
| Total | 21 (100.0%) | 0 (0.0%) |
Income Below Poverty Among Single-Parent Households in Holy Cross
According to the poverty data in Holy Cross, 28.6% or 2 single-father households and 10.5% or 2 single-mother households are living below the poverty line. Among single-father households, those with 1 or 2 children have the highest poverty rate, with 2 households (100.0%) experiencing poverty. Likewise, among single-mother households, those with 1 or 2 children have the highest poverty rate, with 2 households (15.4%) falling below the poverty line.
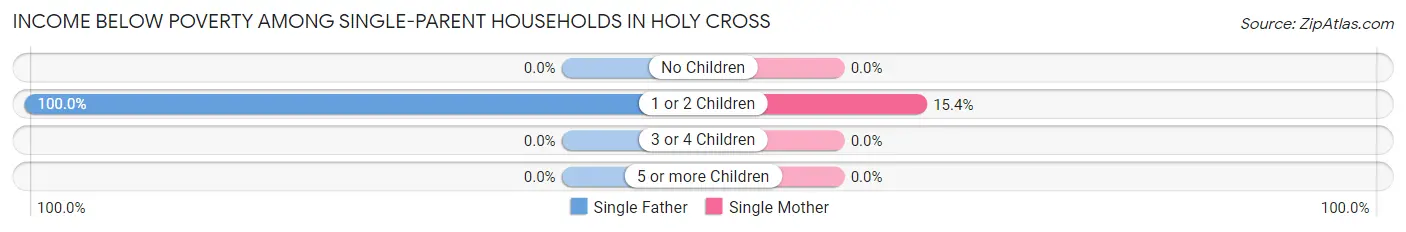
| Children | Single Father | Single Mother |
| No Children | 0 (0.0%) | 0 (0.0%) |
| 1 or 2 Children | 2 (100.0%) | 2 (15.4%) |
| 3 or 4 Children | 0 (0.0%) | 0 (0.0%) |
| 5 or more Children | 0 (0.0%) | 0 (0.0%) |
| Total | 2 (28.6%) | 2 (10.5%) |
Income Below Poverty Among Married-Couple vs Single-Parent Households in Holy Cross
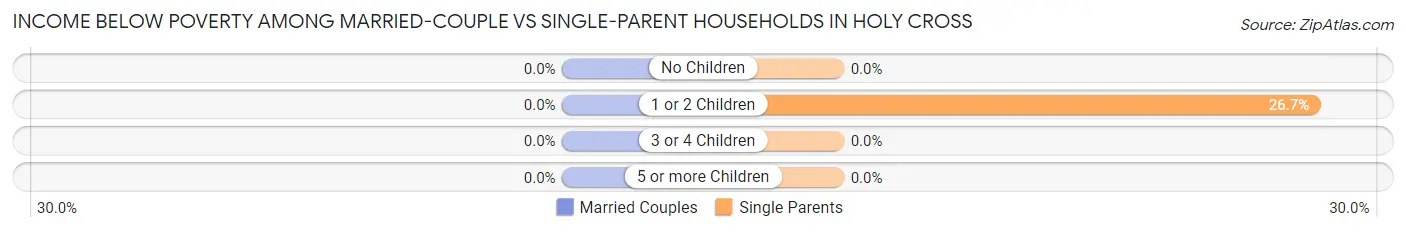
| Children | Married-Couple Families | Single-Parent Households |
| No Children | 0 (0.0%) | 0 (0.0%) |
| 1 or 2 Children | 0 (0.0%) | 4 (26.7%) |
| 3 or 4 Children | 0 (0.0%) | 0 (0.0%) |
| 5 or more Children | 0 (0.0%) | 0 (0.0%) |
| Total | 0 (0.0%) | 4 (15.4%) |
Race in Holy Cross
The most populous races in Holy Cross are Native / Alaskan (254 | 91.7%), Hispanic or Latino (14 | 5.1%), and White / Caucasian (13 | 4.7%).
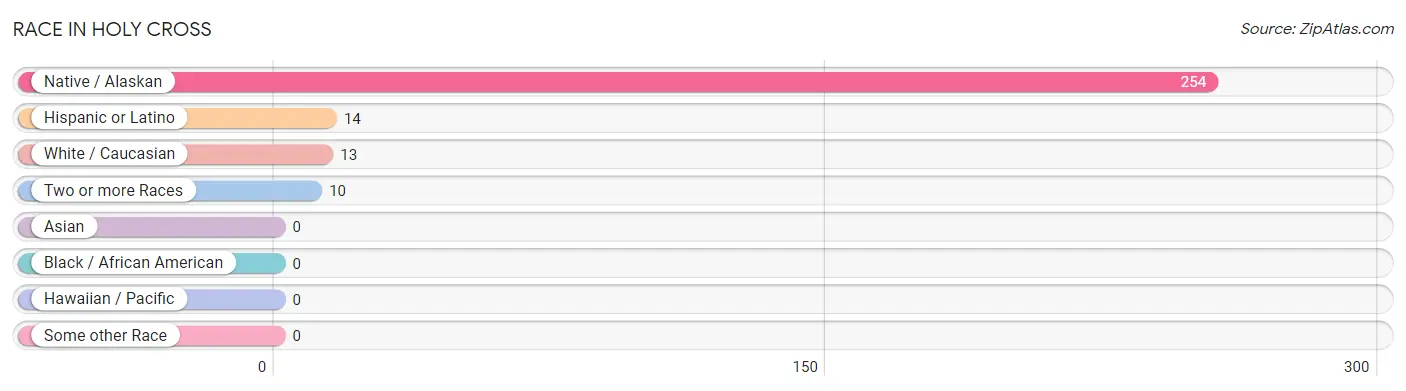
| Race | # Population | % Population |
| Asian | 0 | 0.0% |
| Black / African American | 0 | 0.0% |
| Hawaiian / Pacific | 0 | 0.0% |
| Hispanic or Latino | 14 | 5.1% |
| Native / Alaskan | 254 | 91.7% |
| White / Caucasian | 13 | 4.7% |
| Two or more Races | 10 | 3.6% |
| Some other Race | 0 | 0.0% |
| Total | 277 | 100.0% |
Ancestry in Holy Cross
The most populous ancestries reported in Holy Cross are Alaskan Athabascan (248 | 89.5%), Mexican (14 | 5.1%), Inupiat (10 | 3.6%), French (9 | 3.3%), and German (8 | 2.9%), together accounting for 104.3% of all Holy Cross residents.
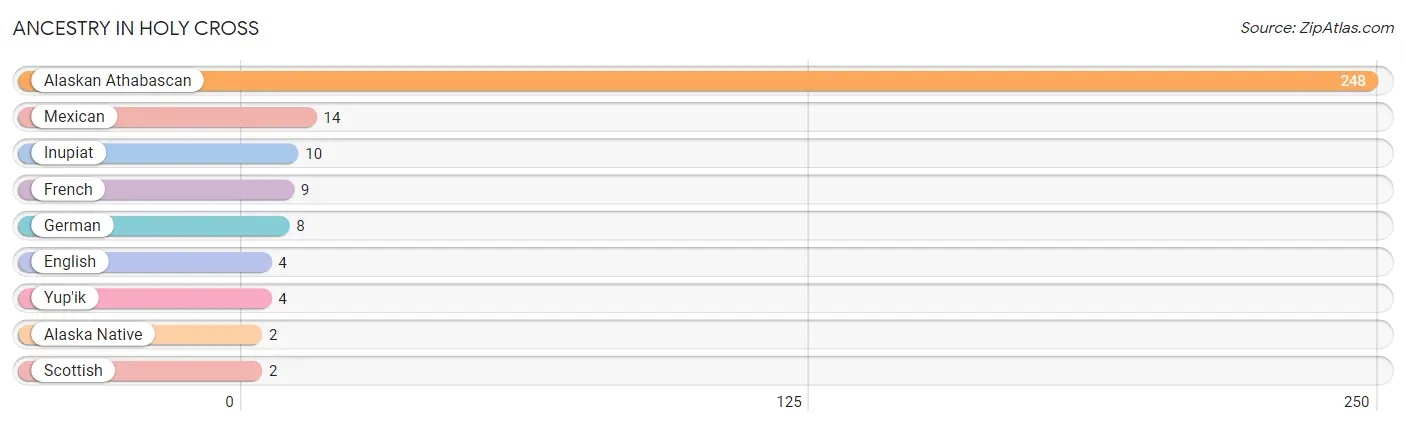
| Ancestry | # Population | % Population |
| Alaska Native | 2 | 0.7% |
| Alaskan Athabascan | 248 | 89.5% |
| English | 4 | 1.4% |
| French | 9 | 3.3% |
| German | 8 | 2.9% |
| Inupiat | 10 | 3.6% |
| Mexican | 14 | 5.1% |
| Scottish | 2 | 0.7% |
| Yup'ik | 4 | 1.4% | View All 9 Rows |
Immigrants in Holy Cross

| Immigration Origin | # Population | % Population | View All 0 Rows |
Sex and Age in Holy Cross
Sex and Age in Holy Cross
The most populous age groups in Holy Cross are 15 to 19 Years (30 | 16.2%) for men and 55 to 59 Years (18 | 19.6%) for women.
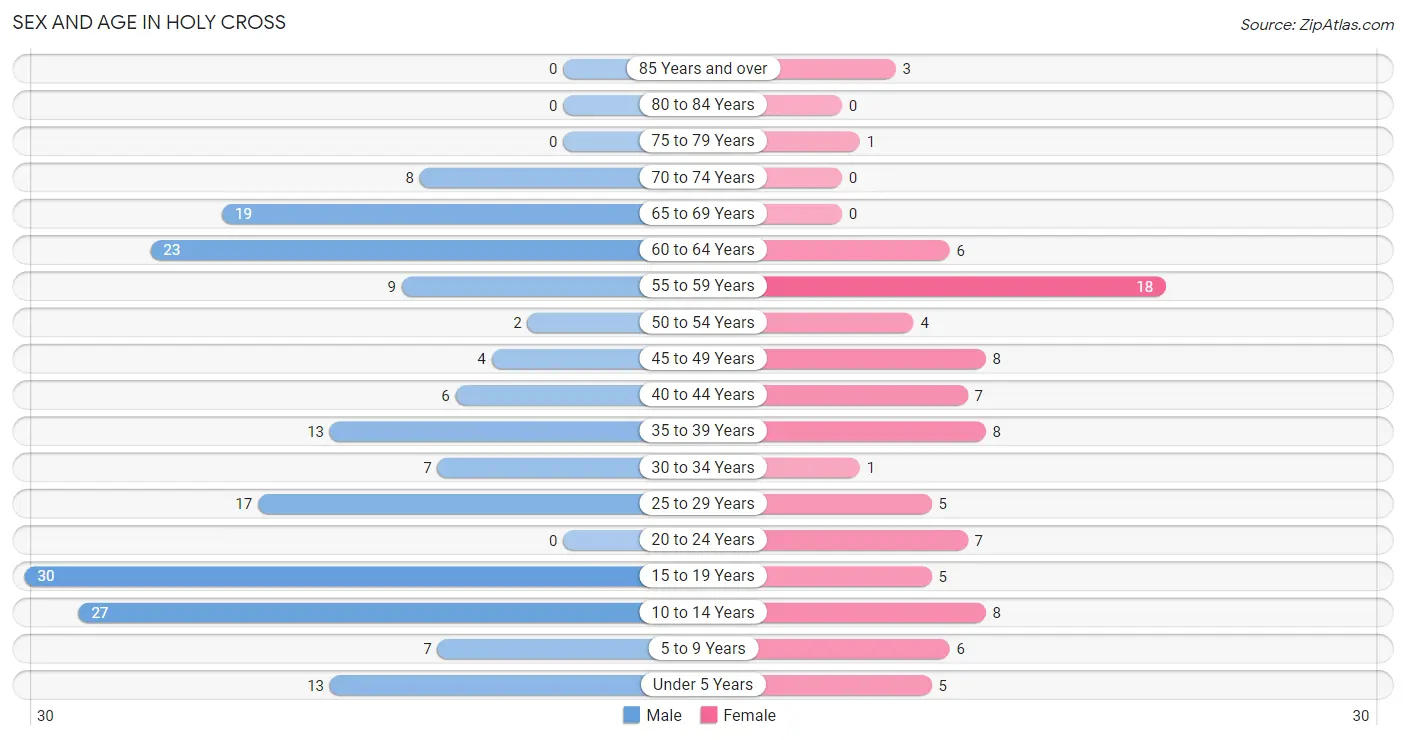
| Age Bracket | Male | Female |
| Under 5 Years | 13 (7.0%) | 5 (5.4%) |
| 5 to 9 Years | 7 (3.8%) | 6 (6.5%) |
| 10 to 14 Years | 27 (14.6%) | 8 (8.7%) |
| 15 to 19 Years | 30 (16.2%) | 5 (5.4%) |
| 20 to 24 Years | 0 (0.0%) | 7 (7.6%) |
| 25 to 29 Years | 17 (9.2%) | 5 (5.4%) |
| 30 to 34 Years | 7 (3.8%) | 1 (1.1%) |
| 35 to 39 Years | 13 (7.0%) | 8 (8.7%) |
| 40 to 44 Years | 6 (3.2%) | 7 (7.6%) |
| 45 to 49 Years | 4 (2.2%) | 8 (8.7%) |
| 50 to 54 Years | 2 (1.1%) | 4 (4.3%) |
| 55 to 59 Years | 9 (4.9%) | 18 (19.6%) |
| 60 to 64 Years | 23 (12.4%) | 6 (6.5%) |
| 65 to 69 Years | 19 (10.3%) | 0 (0.0%) |
| 70 to 74 Years | 8 (4.3%) | 0 (0.0%) |
| 75 to 79 Years | 0 (0.0%) | 1 (1.1%) |
| 80 to 84 Years | 0 (0.0%) | 0 (0.0%) |
| 85 Years and over | 0 (0.0%) | 3 (3.3%) |
| Total | 185 (100.0%) | 92 (100.0%) |
Families and Households in Holy Cross
Median Family Size in Holy Cross
The median family size in Holy Cross is 4.17 persons per family, with married-couple families (21 | 44.7%) accounting for the largest median family size of 5.33 persons per family. On the other hand, single male/father families (7 | 14.9%) represent the smallest median family size with 3.00 persons per family.
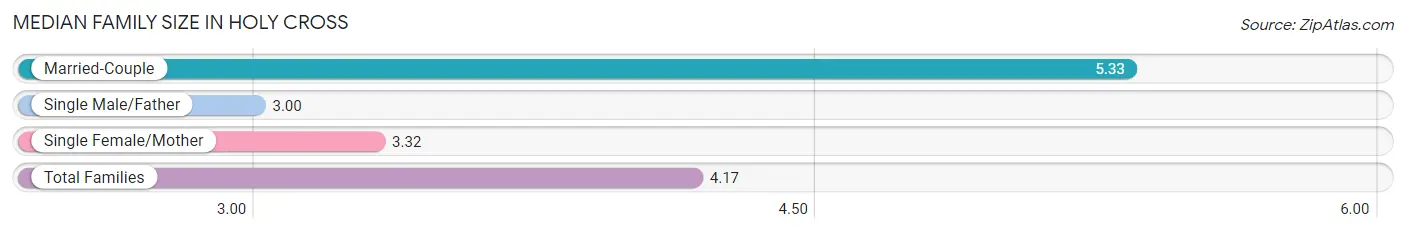
| Family Type | # Families | Family Size |
| Married-Couple | 21 (44.7%) | 5.33 |
| Single Male/Father | 7 (14.9%) | 3.00 |
| Single Female/Mother | 19 (40.4%) | 3.32 |
| Total Families | 47 (100.0%) | 4.17 |
Median Household Size in Holy Cross
The median household size in Holy Cross is 2.77 persons per household, with married-couple households (21 | 21.0%) accounting for the largest median household size of 5.33 persons per household. non-family households (53 | 53.0%) represent the smallest median household size with 1.23 persons per household.
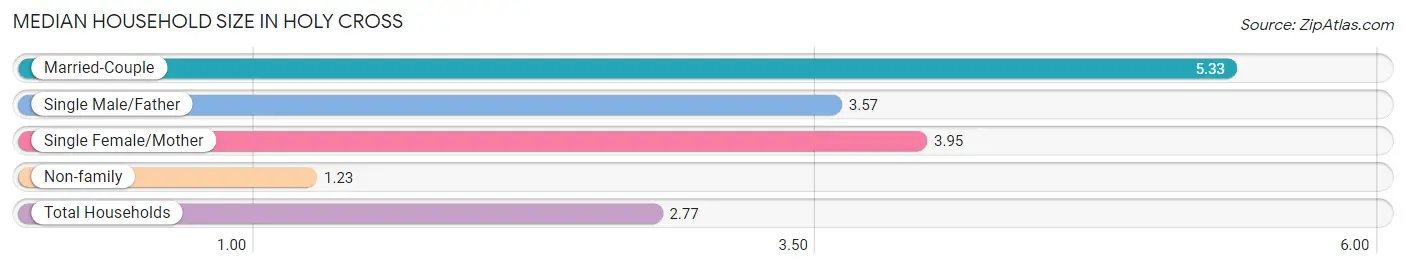
| Household Type | # Households | Household Size |
| Married-Couple | 21 (21.0%) | 5.33 |
| Single Male/Father | 7 (7.0%) | 3.57 |
| Single Female/Mother | 19 (19.0%) | 3.95 |
| Non-family | 53 (53.0%) | 1.23 |
| Total Households | 100 (100.0%) | 2.77 |
Household Size by Marriage Status in Holy Cross
Out of a total of 100 households in Holy Cross, 47 (47.0%) are family households, while 53 (53.0%) are nonfamily households. The most numerous type of family households are 4-person households, comprising 18, and the most common type of nonfamily households are 1-person households, comprising 43.
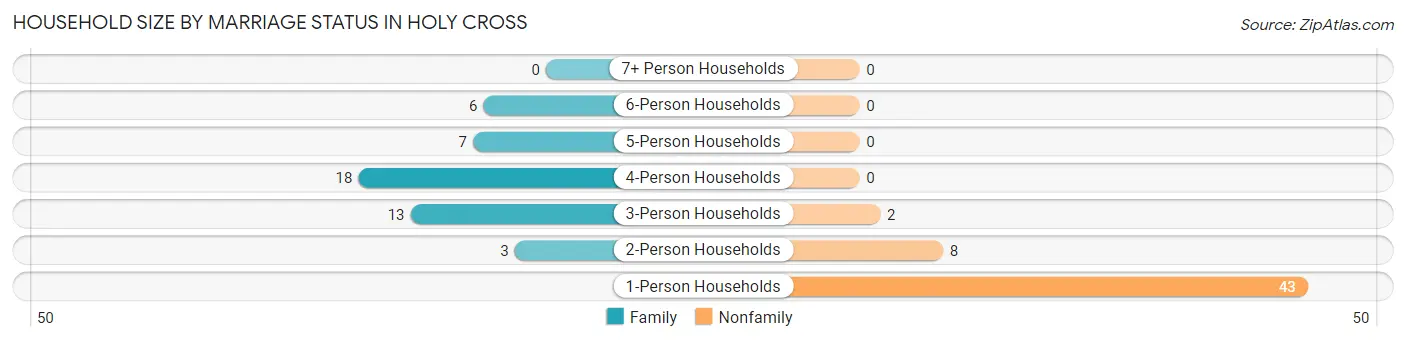
| Household Size | Family Households | Nonfamily Households |
| 1-Person Households | - | 43 (43.0%) |
| 2-Person Households | 3 (3.0%) | 8 (8.0%) |
| 3-Person Households | 13 (13.0%) | 2 (2.0%) |
| 4-Person Households | 18 (18.0%) | 0 (0.0%) |
| 5-Person Households | 7 (7.0%) | 0 (0.0%) |
| 6-Person Households | 6 (6.0%) | 0 (0.0%) |
| 7+ Person Households | 0 (0.0%) | 0 (0.0%) |
| Total | 47 (47.0%) | 53 (53.0%) |
Female Fertility in Holy Cross
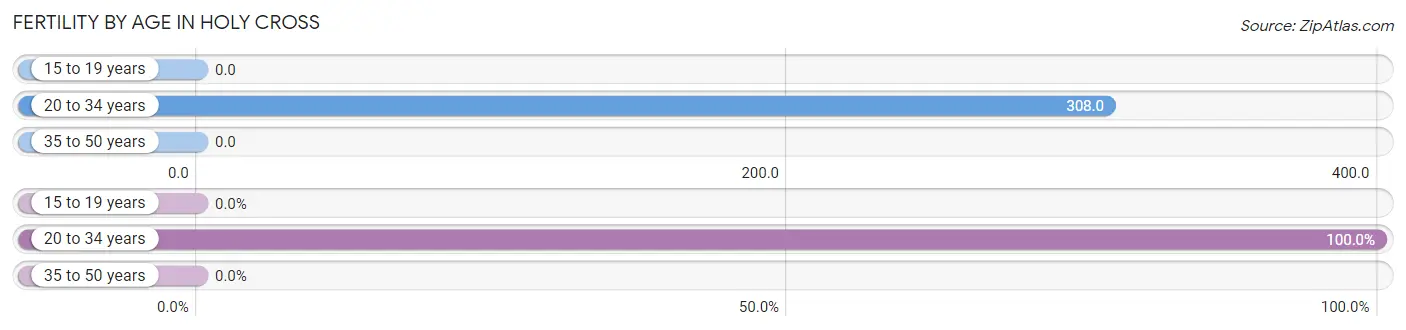
Fertility by Age in Holy Cross
Average fertility rate in Holy Cross is 98.0 births per 1,000 women. Women in the age bracket of 20 to 34 years have the highest fertility rate with 308.0 births per 1,000 women. Women in the age bracket of 20 to 34 years acount for 100.0% of all women with births.
| Age Bracket | Women with Births | Births / 1,000 Women |
| 15 to 19 years | 0 (0.0%) | 0.0 |
| 20 to 34 years | 4 (100.0%) | 308.0 |
| 35 to 50 years | 0 (0.0%) | 0.0 |
| Total | 4 (100.0%) | 98.0 |
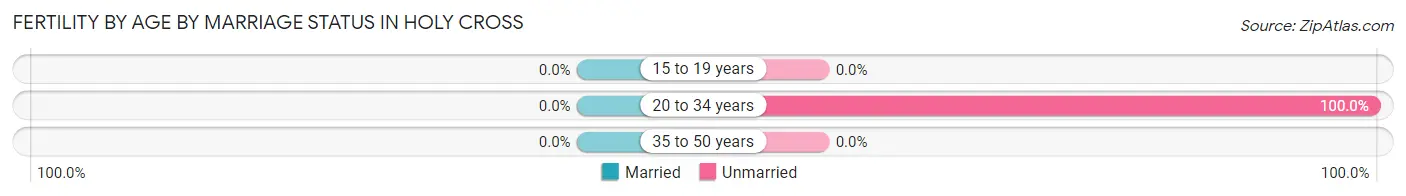
Fertility by Age by Marriage Status in Holy Cross
| Age Bracket | Married | Unmarried |
| 15 to 19 years | 0 (0.0%) | 0 (0.0%) |
| 20 to 34 years | 0 (0.0%) | 4 (100.0%) |
| 35 to 50 years | 0 (0.0%) | 0 (0.0%) |
| Total | 0 (0.0%) | 4 (100.0%) |
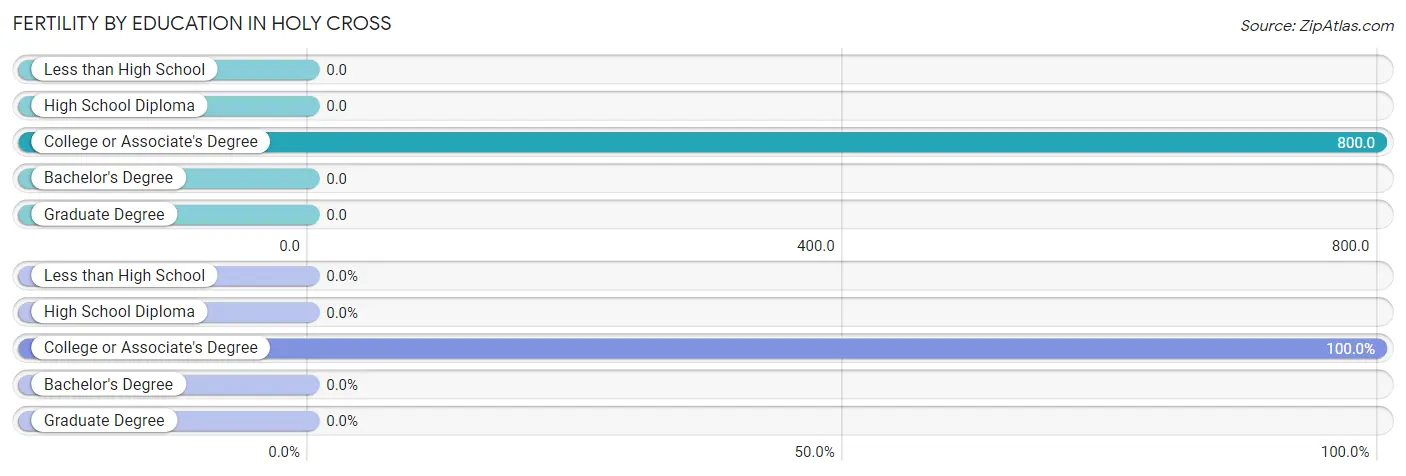
Fertility by Education in Holy Cross
| Educational Attainment | Women with Births | Births / 1,000 Women |
| Less than High School | 0 (0.0%) | 0.0 |
| High School Diploma | 0 (0.0%) | 0.0 |
| College or Associate's Degree | 4 (100.0%) | 800.0 |
| Bachelor's Degree | 0 (0.0%) | 0.0 |
| Graduate Degree | 0 (0.0%) | 0.0 |
| Total | 4 (100.0%) | 98.0 |
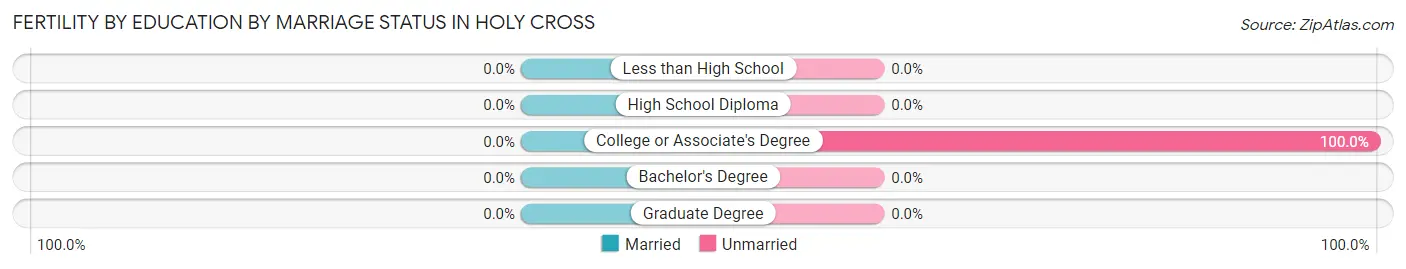
Fertility by Education by Marriage Status in Holy Cross
| Educational Attainment | Married | Unmarried |
| Less than High School | 0 (0.0%) | 0 (0.0%) |
| High School Diploma | 0 (0.0%) | 0 (0.0%) |
| College or Associate's Degree | 0 (0.0%) | 4 (100.0%) |
| Bachelor's Degree | 0 (0.0%) | 0 (0.0%) |
| Graduate Degree | 0 (0.0%) | 0 (0.0%) |
| Total | 0 (0.0%) | 4 (100.0%) |
Employment Characteristics in Holy Cross
Employment by Class of Employer in Holy Cross
Among the 108 employed individuals in Holy Cross, local government employees (40 | 37.0%), private company employees (39 | 36.1%), and unpaid family workers (11 | 10.2%) make up the most common classes of employment.
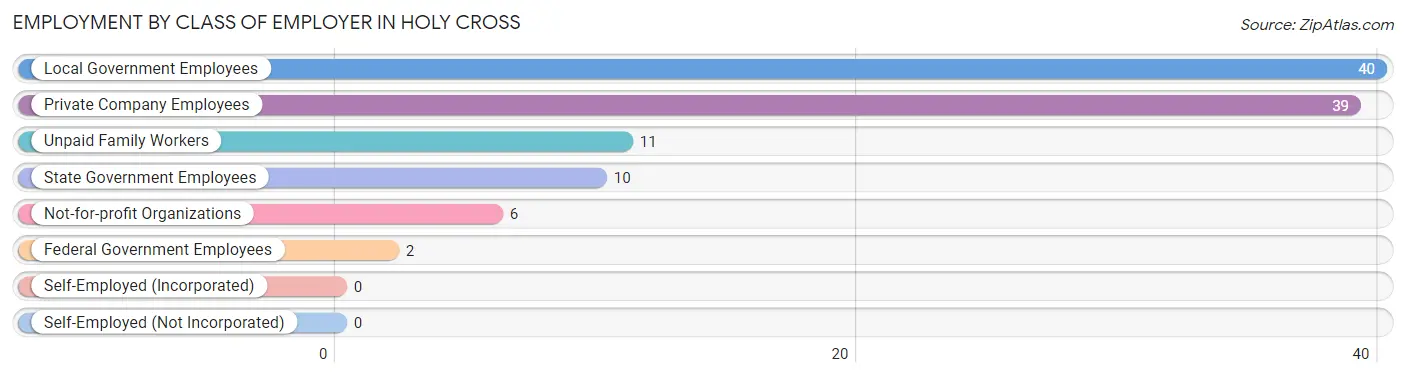
| Employer Class | # Employees | % Employees |
| Private Company Employees | 39 | 36.1% |
| Self-Employed (Incorporated) | 0 | 0.0% |
| Self-Employed (Not Incorporated) | 0 | 0.0% |
| Not-for-profit Organizations | 6 | 5.6% |
| Local Government Employees | 40 | 37.0% |
| State Government Employees | 10 | 9.3% |
| Federal Government Employees | 2 | 1.8% |
| Unpaid Family Workers | 11 | 10.2% |
| Total | 108 | 100.0% |
Employment Status by Age in Holy Cross
According to the labor force statistics for Holy Cross, out of the total population over 16 years of age (207), 59.4% or 123 individuals are in the labor force, with 12.2% or 15 of them unemployed. The age group with the highest labor force participation rate is 20 to 24 years, with 100.0% or 7 individuals in the labor force. Within the labor force, the 20 to 24 years age range has the highest percentage of unemployed individuals, with 42.9% or 3 of them being unemployed.
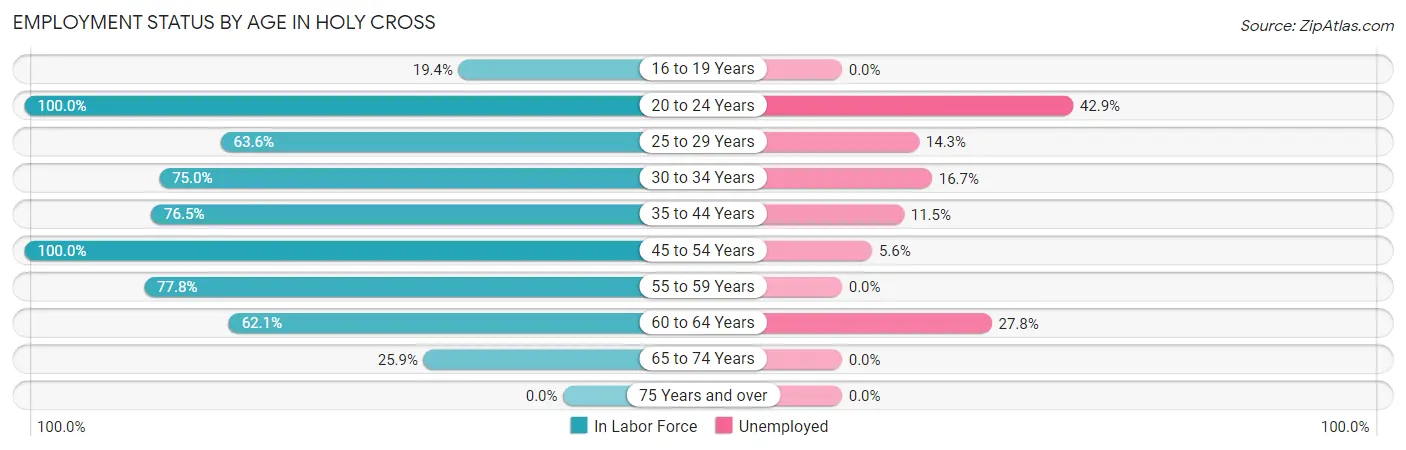
| Age Bracket | In Labor Force | Unemployed |
| 16 to 19 Years | 6 (19.4%) | 0 (0.0%) |
| 20 to 24 Years | 7 (100.0%) | 3 (42.9%) |
| 25 to 29 Years | 14 (63.6%) | 2 (14.3%) |
| 30 to 34 Years | 6 (75.0%) | 1 (16.7%) |
| 35 to 44 Years | 26 (76.5%) | 3 (11.5%) |
| 45 to 54 Years | 18 (100.0%) | 1 (5.6%) |
| 55 to 59 Years | 21 (77.8%) | 0 (0.0%) |
| 60 to 64 Years | 18 (62.1%) | 5 (27.8%) |
| 65 to 74 Years | 7 (25.9%) | 0 (0.0%) |
| 75 Years and over | 0 (0.0%) | 0 (0.0%) |
| Total | 123 (59.4%) | 15 (12.2%) |
Employment Status by Educational Attainment in Holy Cross
According to labor force statistics for Holy Cross, 74.6% of individuals (103) out of the total population between 25 and 64 years of age (138) are in the labor force, with 11.7% or 12 of them being unemployed. The group with the highest labor force participation rate are those with the educational attainment of bachelor's degree or higher, with 100.0% or 5 individuals in the labor force. Within the labor force, individuals with college / associate degree education have the highest percentage of unemployment, with 16.0% or 4 of them being unemployed.
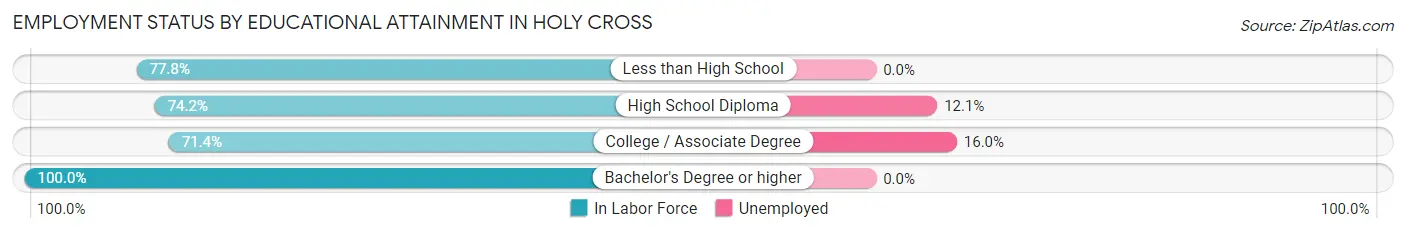
| Educational Attainment | In Labor Force | Unemployed |
| Less than High School | 7 (77.8%) | 0 (0.0%) |
| High School Diploma | 66 (74.2%) | 11 (12.1%) |
| College / Associate Degree | 25 (71.4%) | 6 (16.0%) |
| Bachelor's Degree or higher | 5 (100.0%) | 0 (0.0%) |
| Total | 103 (74.6%) | 16 (11.7%) |
Employment Occupations by Sex in Holy Cross
Management, Business, Science and Arts Occupations
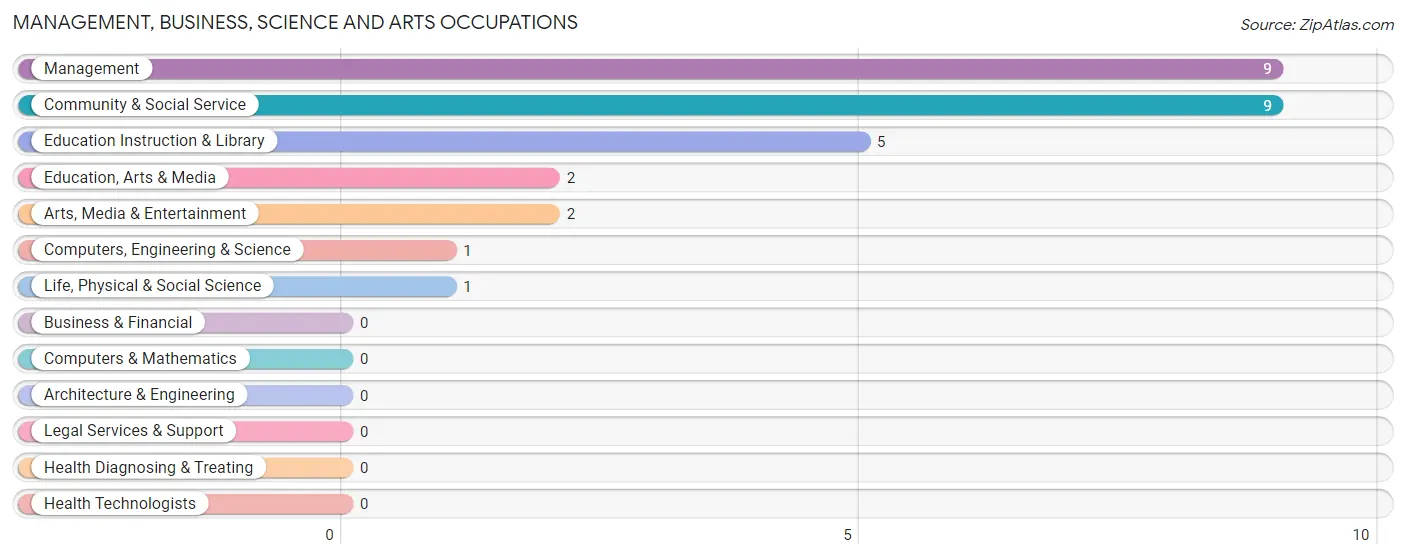
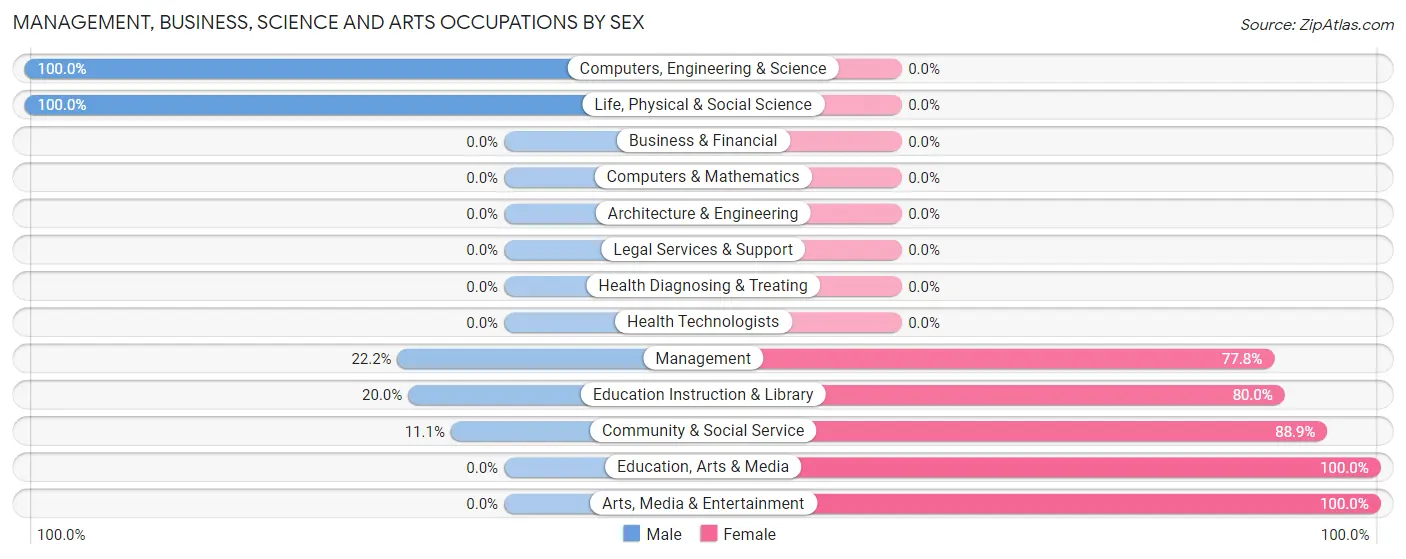
The most common Management, Business, Science and Arts occupations in Holy Cross are Management (9 | 8.3%), Community & Social Service (9 | 8.3%), Education Instruction & Library (5 | 4.6%), Education, Arts & Media (2 | 1.8%), and Arts, Media & Entertainment (2 | 1.8%).
Management, Business, Science and Arts Occupations by Sex
Within the Management, Business, Science and Arts occupations in Holy Cross, the most male-oriented occupations are Computers, Engineering & Science (100.0%), Life, Physical & Social Science (100.0%), and Management (22.2%), while the most female-oriented occupations are Education, Arts & Media (100.0%), Arts, Media & Entertainment (100.0%), and Community & Social Service (88.9%).
| Occupation | Male | Female |
| Management | 2 (22.2%) | 7 (77.8%) |
| Business & Financial | 0 (0.0%) | 0 (0.0%) |
| Computers, Engineering & Science | 1 (100.0%) | 0 (0.0%) |
| Computers & Mathematics | 0 (0.0%) | 0 (0.0%) |
| Architecture & Engineering | 0 (0.0%) | 0 (0.0%) |
| Life, Physical & Social Science | 1 (100.0%) | 0 (0.0%) |
| Community & Social Service | 1 (11.1%) | 8 (88.9%) |
| Education, Arts & Media | 0 (0.0%) | 2 (100.0%) |
| Legal Services & Support | 0 (0.0%) | 0 (0.0%) |
| Education Instruction & Library | 1 (20.0%) | 4 (80.0%) |
| Arts, Media & Entertainment | 0 (0.0%) | 2 (100.0%) |
| Health Diagnosing & Treating | 0 (0.0%) | 0 (0.0%) |
| Health Technologists | 0 (0.0%) | 0 (0.0%) |
| Total (Category) | 4 (21.0%) | 15 (78.9%) |
| Total (Overall) | 53 (49.1%) | 55 (50.9%) |
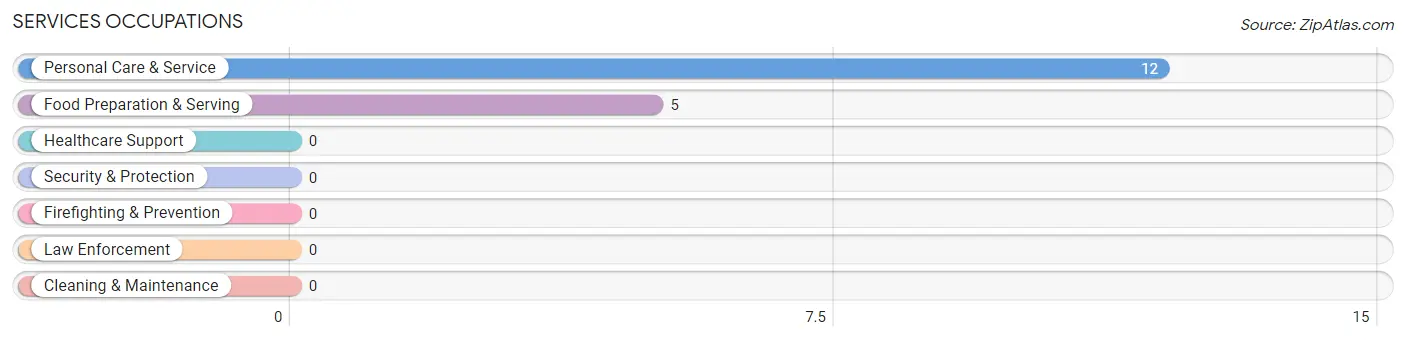
Services Occupations
The most common Services occupations in Holy Cross are Personal Care & Service (12 | 11.1%), and Food Preparation & Serving (5 | 4.6%).
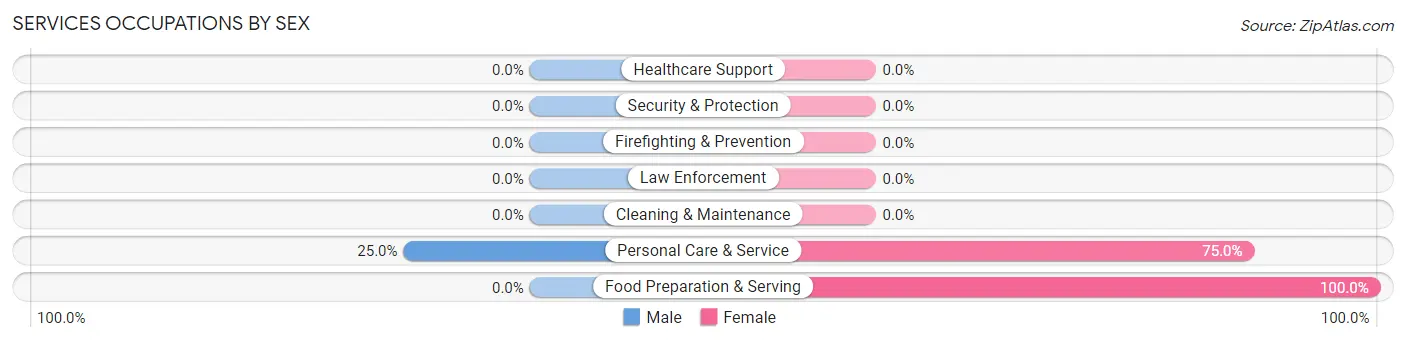
Services Occupations by Sex
| Occupation | Male | Female |
| Healthcare Support | 0 (0.0%) | 0 (0.0%) |
| Security & Protection | 0 (0.0%) | 0 (0.0%) |
| Firefighting & Prevention | 0 (0.0%) | 0 (0.0%) |
| Law Enforcement | 0 (0.0%) | 0 (0.0%) |
| Food Preparation & Serving | 0 (0.0%) | 5 (100.0%) |
| Cleaning & Maintenance | 0 (0.0%) | 0 (0.0%) |
| Personal Care & Service | 3 (25.0%) | 9 (75.0%) |
| Total (Category) | 3 (17.6%) | 14 (82.4%) |
| Total (Overall) | 53 (49.1%) | 55 (50.9%) |
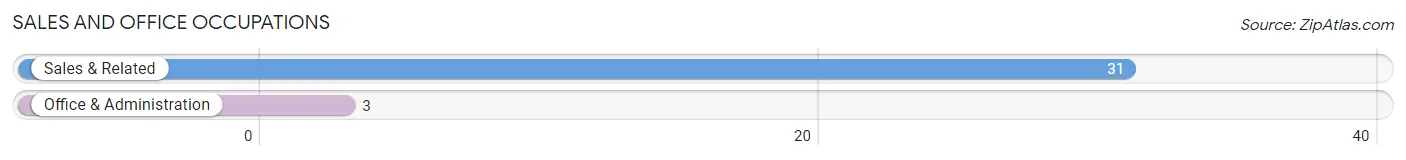
Sales and Office Occupations
The most common Sales and Office occupations in Holy Cross are Sales & Related (31 | 28.7%), and Office & Administration (3 | 2.8%).
Sales and Office Occupations by Sex
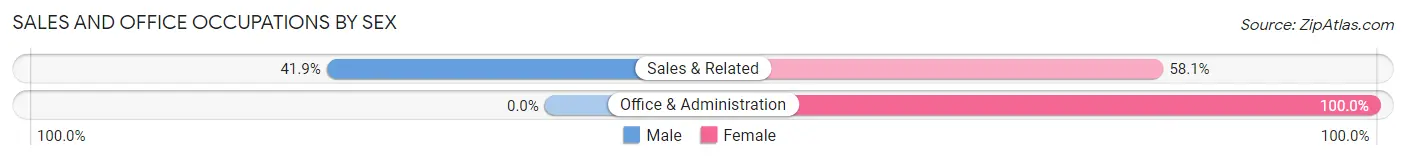
| Occupation | Male | Female |
| Sales & Related | 13 (41.9%) | 18 (58.1%) |
| Office & Administration | 0 (0.0%) | 3 (100.0%) |
| Total (Category) | 13 (38.2%) | 21 (61.8%) |
| Total (Overall) | 53 (49.1%) | 55 (50.9%) |
Natural Resources, Construction and Maintenance Occupations
The most common Natural Resources, Construction and Maintenance occupations in Holy Cross are Construction & Extraction (9 | 8.3%), and Installation, Maintenance & Repair (2 | 1.8%).
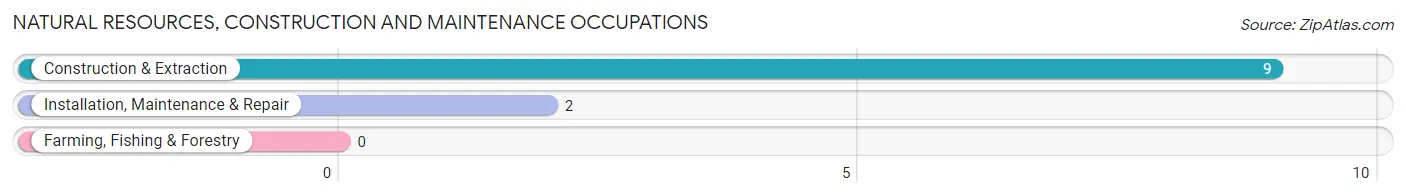
Natural Resources, Construction and Maintenance Occupations by Sex
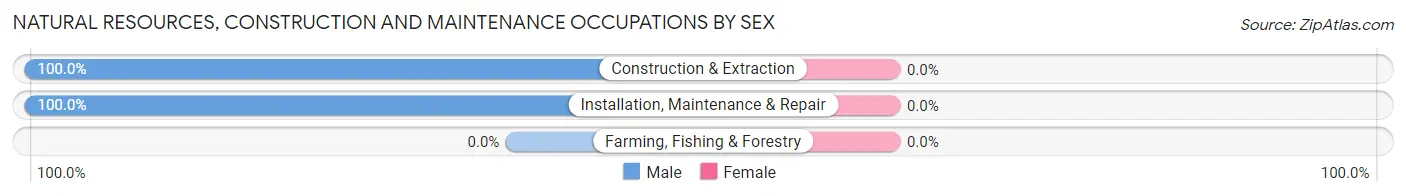
| Occupation | Male | Female |
| Farming, Fishing & Forestry | 0 (0.0%) | 0 (0.0%) |
| Construction & Extraction | 9 (100.0%) | 0 (0.0%) |
| Installation, Maintenance & Repair | 2 (100.0%) | 0 (0.0%) |
| Total (Category) | 11 (100.0%) | 0 (0.0%) |
| Total (Overall) | 53 (49.1%) | 55 (50.9%) |
Production, Transportation and Moving Occupations
The most common Production, Transportation and Moving occupations in Holy Cross are Production (16 | 14.8%), Material Moving (7 | 6.5%), and Transportation (4 | 3.7%).
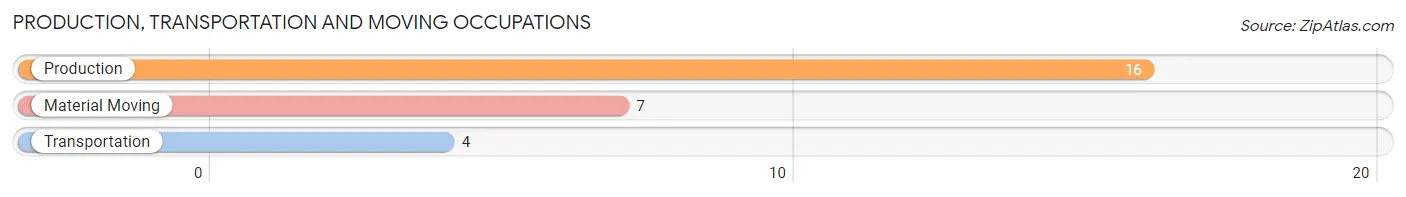
Production, Transportation and Moving Occupations by Sex
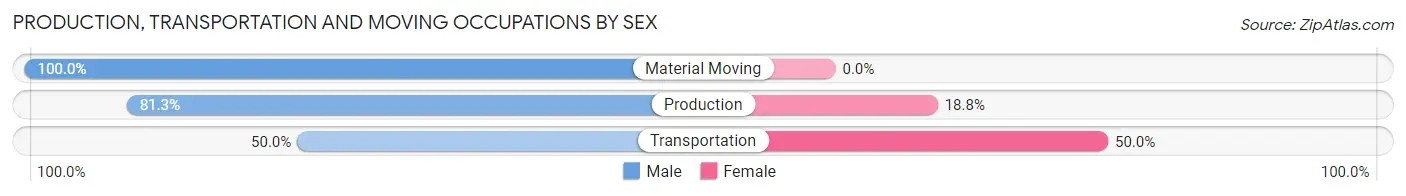
| Occupation | Male | Female |
| Production | 13 (81.2%) | 3 (18.8%) |
| Transportation | 2 (50.0%) | 2 (50.0%) |
| Material Moving | 7 (100.0%) | 0 (0.0%) |
| Total (Category) | 22 (81.5%) | 5 (18.5%) |
| Total (Overall) | 53 (49.1%) | 55 (50.9%) |
Employment Industries by Sex in Holy Cross
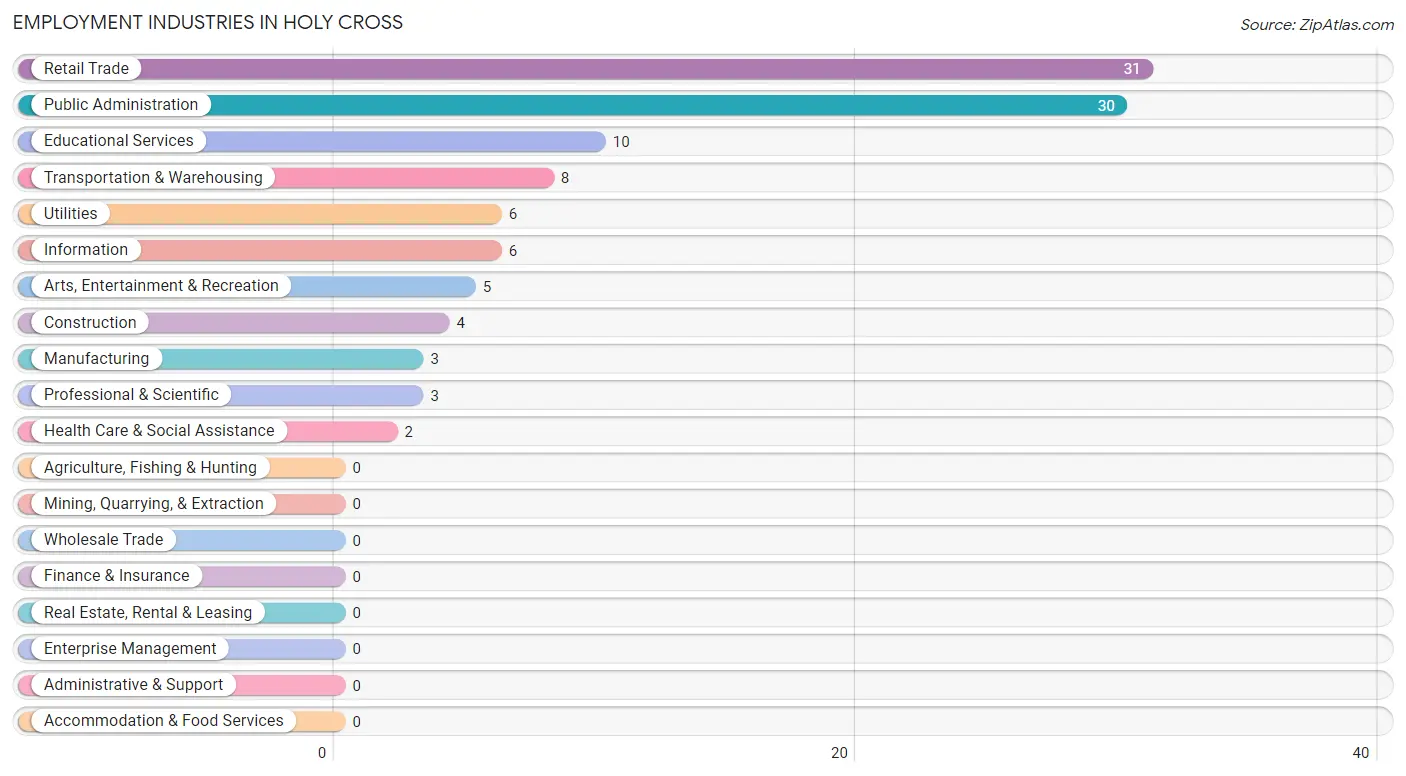
Employment Industries in Holy Cross
The major employment industries in Holy Cross include Retail Trade (31 | 28.7%), Public Administration (30 | 27.8%), Educational Services (10 | 9.3%), Transportation & Warehousing (8 | 7.4%), and Utilities (6 | 5.6%).
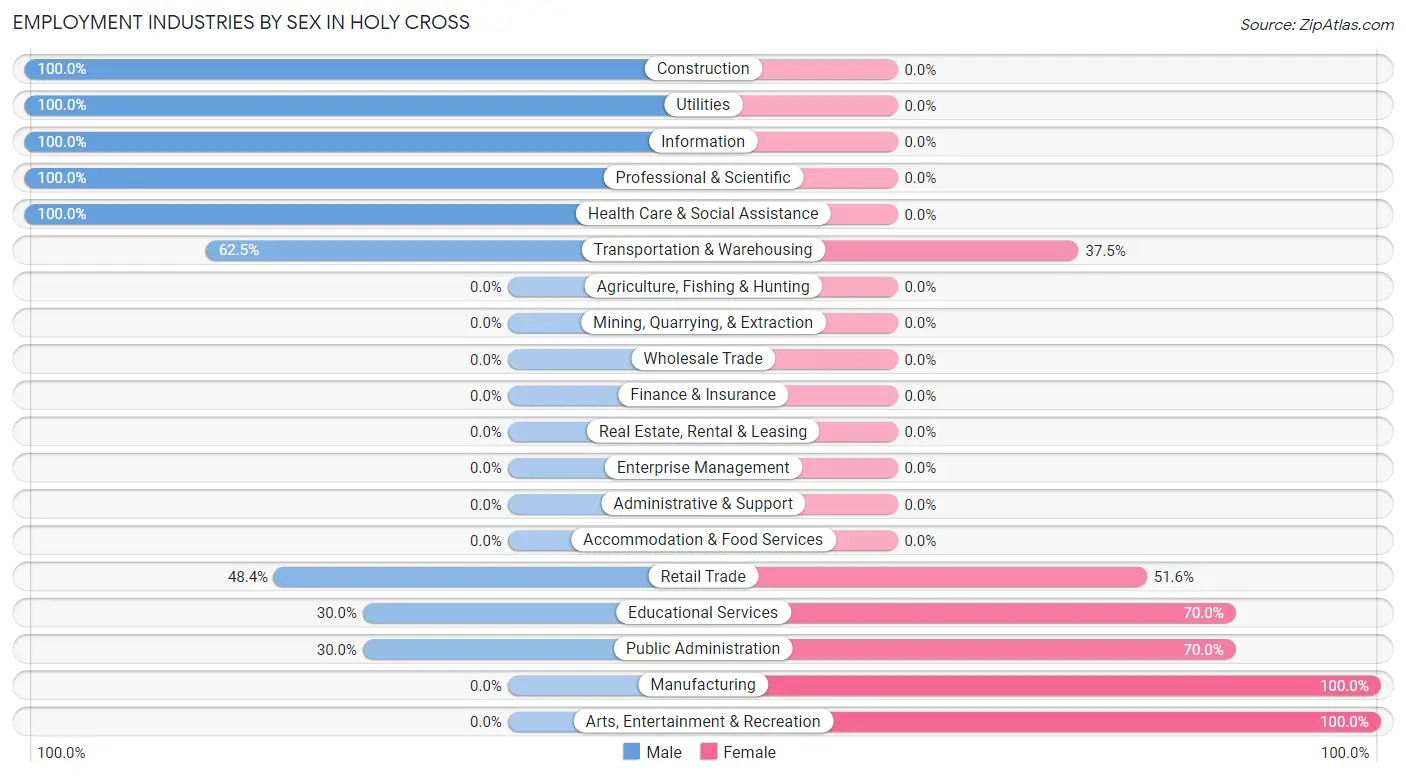
Employment Industries by Sex in Holy Cross
The Holy Cross industries that see more men than women are Construction (100.0%), Utilities (100.0%), and Information (100.0%), whereas the industries that tend to have a higher number of women are Manufacturing (100.0%), Arts, Entertainment & Recreation (100.0%), and Educational Services (70.0%).
| Industry | Male | Female |
| Agriculture, Fishing & Hunting | 0 (0.0%) | 0 (0.0%) |
| Mining, Quarrying, & Extraction | 0 (0.0%) | 0 (0.0%) |
| Construction | 4 (100.0%) | 0 (0.0%) |
| Manufacturing | 0 (0.0%) | 3 (100.0%) |
| Wholesale Trade | 0 (0.0%) | 0 (0.0%) |
| Retail Trade | 15 (48.4%) | 16 (51.6%) |
| Transportation & Warehousing | 5 (62.5%) | 3 (37.5%) |
| Utilities | 6 (100.0%) | 0 (0.0%) |
| Information | 6 (100.0%) | 0 (0.0%) |
| Finance & Insurance | 0 (0.0%) | 0 (0.0%) |
| Real Estate, Rental & Leasing | 0 (0.0%) | 0 (0.0%) |
| Professional & Scientific | 3 (100.0%) | 0 (0.0%) |
| Enterprise Management | 0 (0.0%) | 0 (0.0%) |
| Administrative & Support | 0 (0.0%) | 0 (0.0%) |
| Educational Services | 3 (30.0%) | 7 (70.0%) |
| Health Care & Social Assistance | 2 (100.0%) | 0 (0.0%) |
| Arts, Entertainment & Recreation | 0 (0.0%) | 5 (100.0%) |
| Accommodation & Food Services | 0 (0.0%) | 0 (0.0%) |
| Public Administration | 9 (30.0%) | 21 (70.0%) |
| Total | 53 (49.1%) | 55 (50.9%) |
Education in Holy Cross
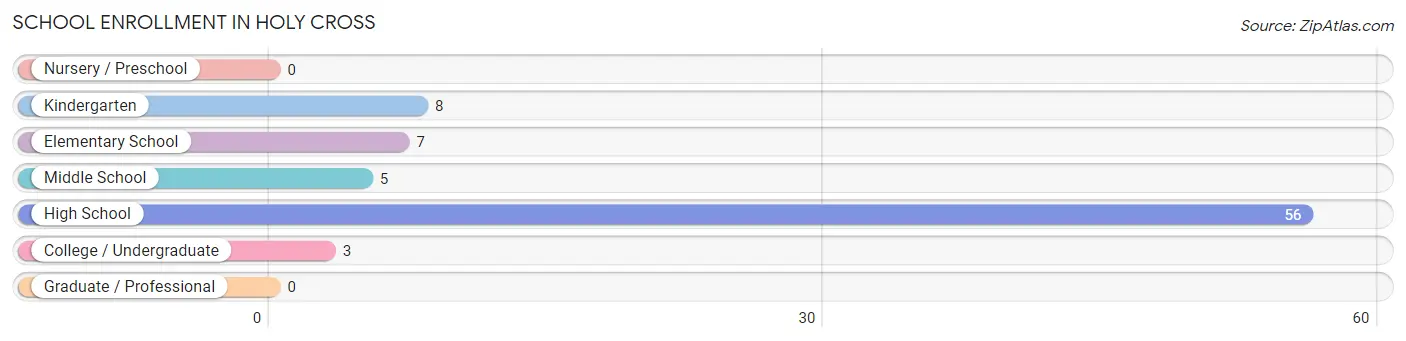
School Enrollment in Holy Cross
The most common levels of schooling among the 79 students in Holy Cross are high school (56 | 70.9%), kindergarten (8 | 10.1%), and elementary school (7 | 8.9%).
| School Level | # Students | % Students |
| Nursery / Preschool | 0 | 0.0% |
| Kindergarten | 8 | 10.1% |
| Elementary School | 7 | 8.9% |
| Middle School | 5 | 6.3% |
| High School | 56 | 70.9% |
| College / Undergraduate | 3 | 3.8% |
| Graduate / Professional | 0 | 0.0% |
| Total | 79 | 100.0% |
School Enrollment by Age by Funding Source in Holy Cross
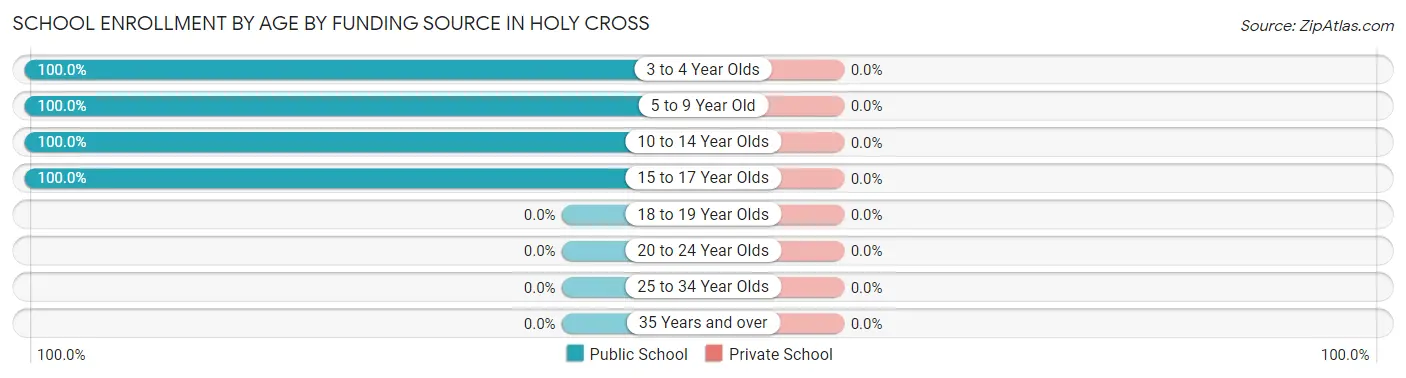
| Age Bracket | Public School | Private School |
| 3 to 4 Year Olds | 2 (100.0%) | 0 (0.0%) |
| 5 to 9 Year Old | 13 (100.0%) | 0 (0.0%) |
| 10 to 14 Year Olds | 32 (100.0%) | 0 (0.0%) |
| 15 to 17 Year Olds | 32 (100.0%) | 0 (0.0%) |
| 18 to 19 Year Olds | 0 (0.0%) | 0 (0.0%) |
| 20 to 24 Year Olds | 0 (0.0%) | 0 (0.0%) |
| 25 to 34 Year Olds | 0 (0.0%) | 0 (0.0%) |
| 35 Years and over | 0 (0.0%) | 0 (0.0%) |
| Total | 79 (100.0%) | 0 (0.0%) |
Educational Attainment by Field of Study in Holy Cross
Social sciences (4 | 80.0%), and bio, nature & agricultural (1 | 20.0%) are the most common fields of study among 5 individuals in Holy Cross who have obtained a bachelor's degree or higher.
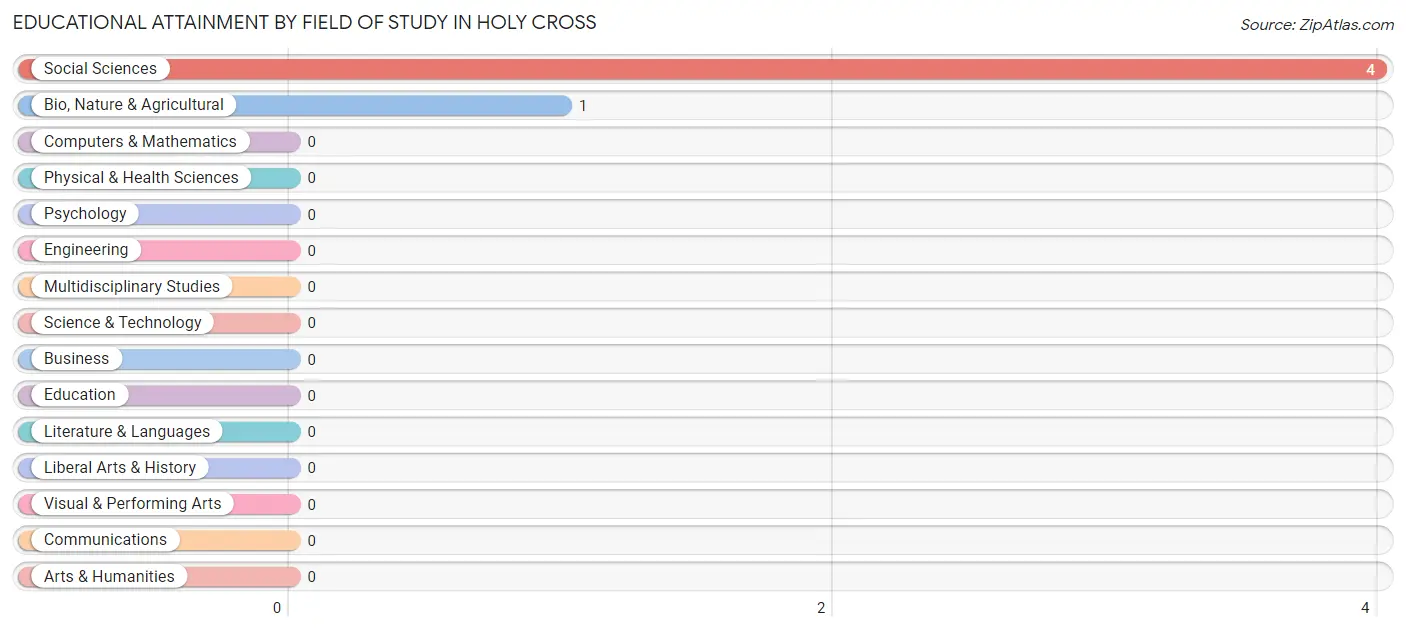
| Field of Study | # Graduates | % Graduates |
| Computers & Mathematics | 0 | 0.0% |
| Bio, Nature & Agricultural | 1 | 20.0% |
| Physical & Health Sciences | 0 | 0.0% |
| Psychology | 0 | 0.0% |
| Social Sciences | 4 | 80.0% |
| Engineering | 0 | 0.0% |
| Multidisciplinary Studies | 0 | 0.0% |
| Science & Technology | 0 | 0.0% |
| Business | 0 | 0.0% |
| Education | 0 | 0.0% |
| Literature & Languages | 0 | 0.0% |
| Liberal Arts & History | 0 | 0.0% |
| Visual & Performing Arts | 0 | 0.0% |
| Communications | 0 | 0.0% |
| Arts & Humanities | 0 | 0.0% |
| Total | 5 | 100.0% |
Transportation & Commute in Holy Cross
Vehicle Availability by Sex in Holy Cross
The most prevalent vehicle ownership categories in Holy Cross are males with no vehicle (34, accounting for 64.1%) and females with no vehicle (27, making up 61.8%).
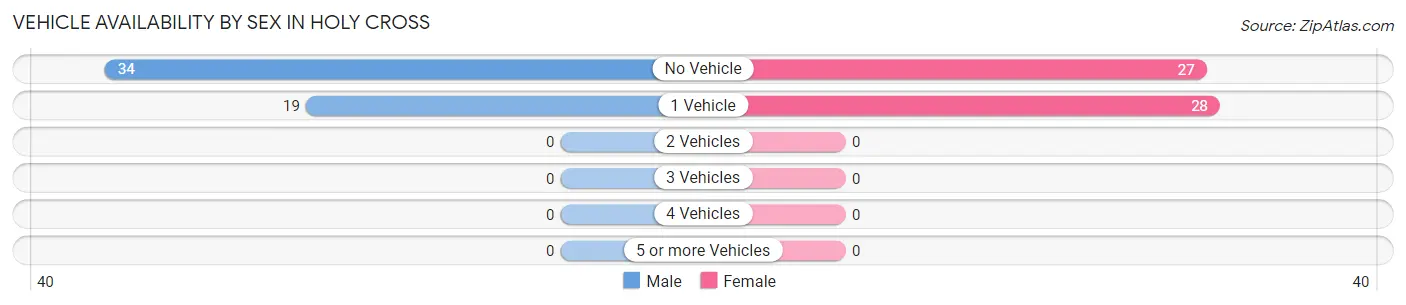
| Vehicles Available | Male | Female |
| No Vehicle | 34 (64.1%) | 27 (49.1%) |
| 1 Vehicle | 19 (35.8%) | 28 (50.9%) |
| 2 Vehicles | 0 (0.0%) | 0 (0.0%) |
| 3 Vehicles | 0 (0.0%) | 0 (0.0%) |
| 4 Vehicles | 0 (0.0%) | 0 (0.0%) |
| 5 or more Vehicles | 0 (0.0%) | 0 (0.0%) |
| Total | 53 (100.0%) | 55 (100.0%) |
Commute Time in Holy Cross
The most frequently occuring commute durations in Holy Cross are less than 5 minutes (46 commuters, 59.0%), 5 to 9 minutes (32 commuters, 41.0%), and 10 to 14 minutes (0 commuters, 0.0%).
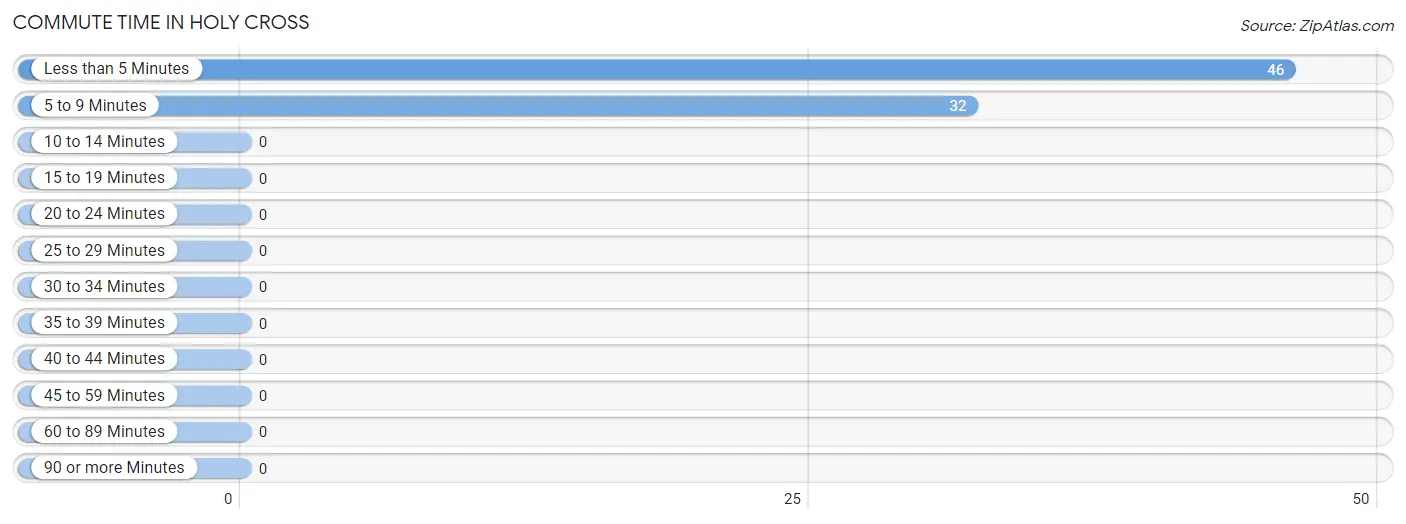
| Commute Time | # Commuters | % Commuters |
| Less than 5 Minutes | 46 | 59.0% |
| 5 to 9 Minutes | 32 | 41.0% |
| 10 to 14 Minutes | 0 | 0.0% |
| 15 to 19 Minutes | 0 | 0.0% |
| 20 to 24 Minutes | 0 | 0.0% |
| 25 to 29 Minutes | 0 | 0.0% |
| 30 to 34 Minutes | 0 | 0.0% |
| 35 to 39 Minutes | 0 | 0.0% |
| 40 to 44 Minutes | 0 | 0.0% |
| 45 to 59 Minutes | 0 | 0.0% |
| 60 to 89 Minutes | 0 | 0.0% |
| 90 or more Minutes | 0 | 0.0% |
Commute Time by Sex in Holy Cross
The most common commute times in Holy Cross are less than 5 minutes (26 commuters, 66.7%) for males and less than 5 minutes (20 commuters, 51.3%) for females.
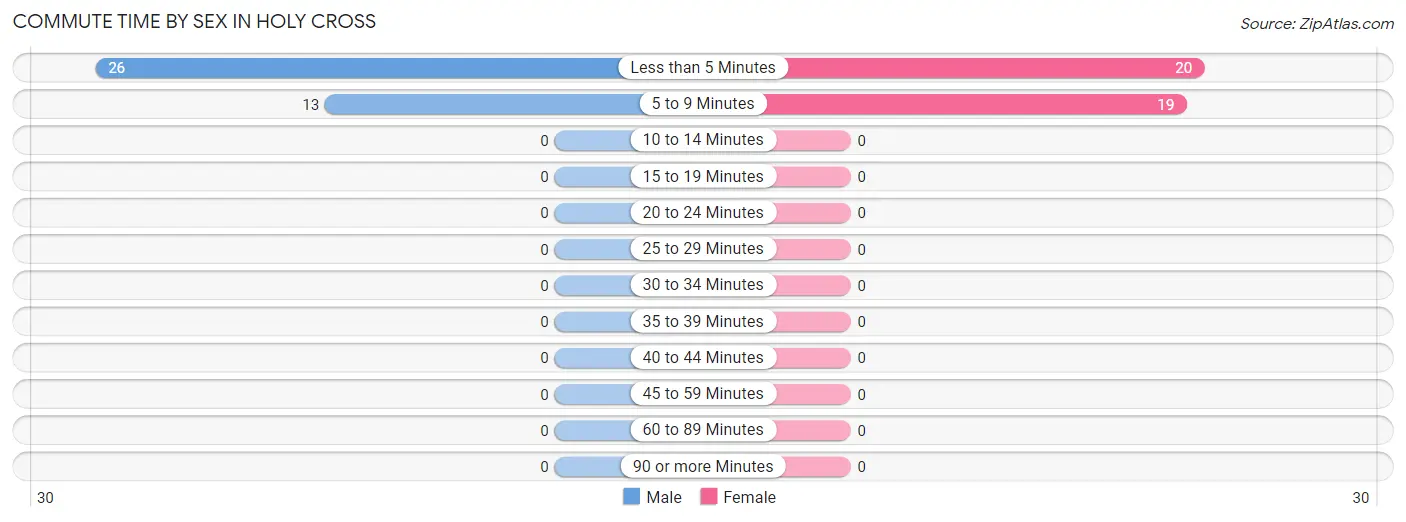
| Commute Time | Male | Female |
| Less than 5 Minutes | 26 (66.7%) | 20 (51.3%) |
| 5 to 9 Minutes | 13 (33.3%) | 19 (48.7%) |
| 10 to 14 Minutes | 0 (0.0%) | 0 (0.0%) |
| 15 to 19 Minutes | 0 (0.0%) | 0 (0.0%) |
| 20 to 24 Minutes | 0 (0.0%) | 0 (0.0%) |
| 25 to 29 Minutes | 0 (0.0%) | 0 (0.0%) |
| 30 to 34 Minutes | 0 (0.0%) | 0 (0.0%) |
| 35 to 39 Minutes | 0 (0.0%) | 0 (0.0%) |
| 40 to 44 Minutes | 0 (0.0%) | 0 (0.0%) |
| 45 to 59 Minutes | 0 (0.0%) | 0 (0.0%) |
| 60 to 89 Minutes | 0 (0.0%) | 0 (0.0%) |
| 90 or more Minutes | 0 (0.0%) | 0 (0.0%) |
Time of Departure to Work by Sex in Holy Cross
The most frequent times of departure to work in Holy Cross are 8:30 AM to 8:59 AM (14, 35.9%) for males and 8:30 AM to 8:59 AM (16, 41.0%) for females.
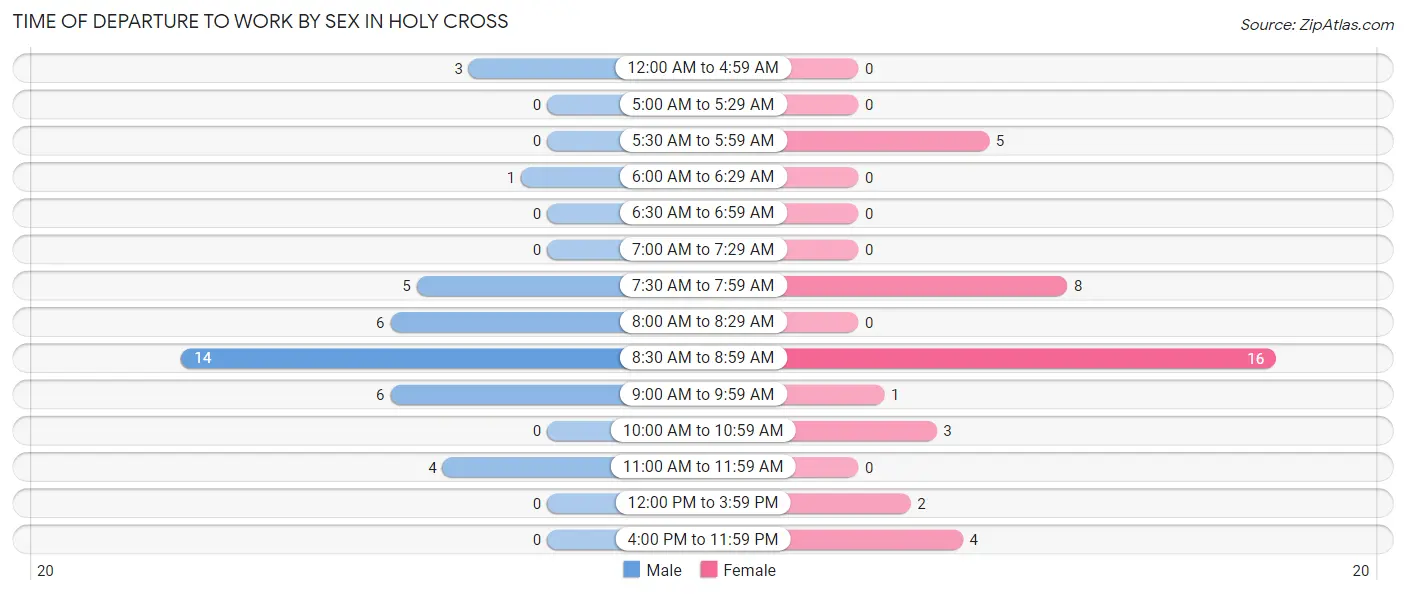
| Time of Departure | Male | Female |
| 12:00 AM to 4:59 AM | 3 (7.7%) | 0 (0.0%) |
| 5:00 AM to 5:29 AM | 0 (0.0%) | 0 (0.0%) |
| 5:30 AM to 5:59 AM | 0 (0.0%) | 5 (12.8%) |
| 6:00 AM to 6:29 AM | 1 (2.6%) | 0 (0.0%) |
| 6:30 AM to 6:59 AM | 0 (0.0%) | 0 (0.0%) |
| 7:00 AM to 7:29 AM | 0 (0.0%) | 0 (0.0%) |
| 7:30 AM to 7:59 AM | 5 (12.8%) | 8 (20.5%) |
| 8:00 AM to 8:29 AM | 6 (15.4%) | 0 (0.0%) |
| 8:30 AM to 8:59 AM | 14 (35.9%) | 16 (41.0%) |
| 9:00 AM to 9:59 AM | 6 (15.4%) | 1 (2.6%) |
| 10:00 AM to 10:59 AM | 0 (0.0%) | 3 (7.7%) |
| 11:00 AM to 11:59 AM | 4 (10.3%) | 0 (0.0%) |
| 12:00 PM to 3:59 PM | 0 (0.0%) | 2 (5.1%) |
| 4:00 PM to 11:59 PM | 0 (0.0%) | 4 (10.3%) |
| Total | 39 (100.0%) | 39 (100.0%) |
Housing Occupancy in Holy Cross
Occupancy by Ownership in Holy Cross
Of the total 100 dwellings in Holy Cross, owner-occupied units account for 82 (82.0%), while renter-occupied units make up 18 (18.0%).
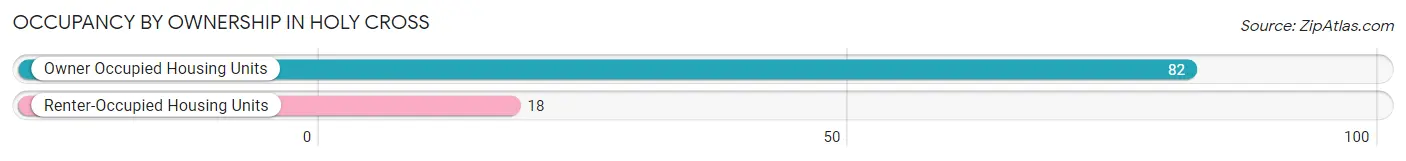
| Occupancy | # Housing Units | % Housing Units |
| Owner Occupied Housing Units | 82 | 82.0% |
| Renter-Occupied Housing Units | 18 | 18.0% |
| Total Occupied Housing Units | 100 | 100.0% |
Occupancy by Household Size in Holy Cross
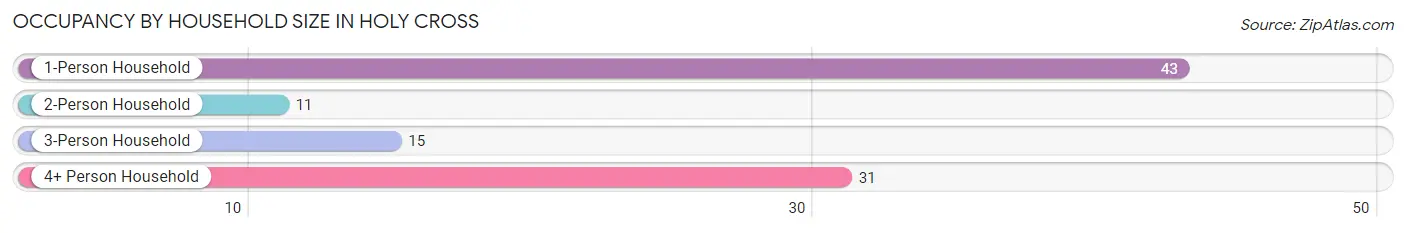
| Household Size | # Housing Units | % Housing Units |
| 1-Person Household | 43 | 43.0% |
| 2-Person Household | 11 | 11.0% |
| 3-Person Household | 15 | 15.0% |
| 4+ Person Household | 31 | 31.0% |
| Total Housing Units | 100 | 100.0% |
Occupancy by Ownership by Household Size in Holy Cross
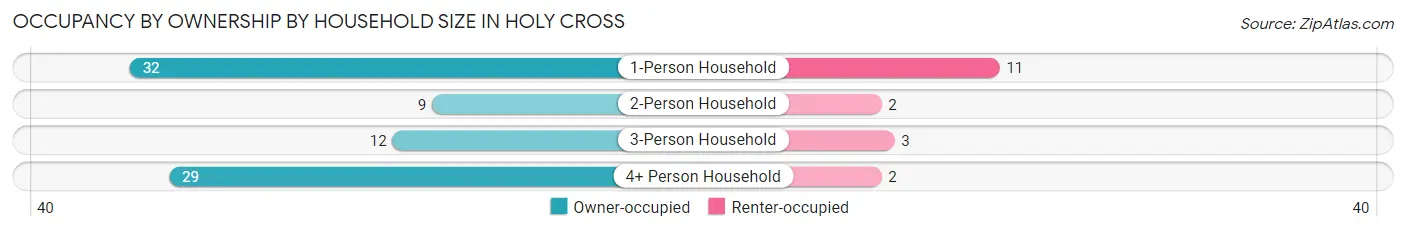
| Household Size | Owner-occupied | Renter-occupied |
| 1-Person Household | 32 (74.4%) | 11 (25.6%) |
| 2-Person Household | 9 (81.8%) | 2 (18.2%) |
| 3-Person Household | 12 (80.0%) | 3 (20.0%) |
| 4+ Person Household | 29 (93.5%) | 2 (6.5%) |
| Total Housing Units | 82 (82.0%) | 18 (18.0%) |
Occupancy by Educational Attainment in Holy Cross
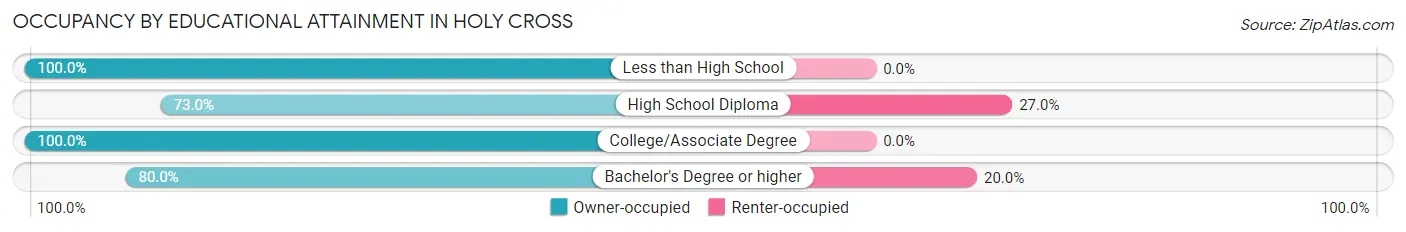
| Household Size | Owner-occupied | Renter-occupied |
| Less than High School | 8 (100.0%) | 0 (0.0%) |
| High School Diploma | 46 (73.0%) | 17 (27.0%) |
| College/Associate Degree | 24 (100.0%) | 0 (0.0%) |
| Bachelor's Degree or higher | 4 (80.0%) | 1 (20.0%) |
Occupancy by Age of Householder in Holy Cross
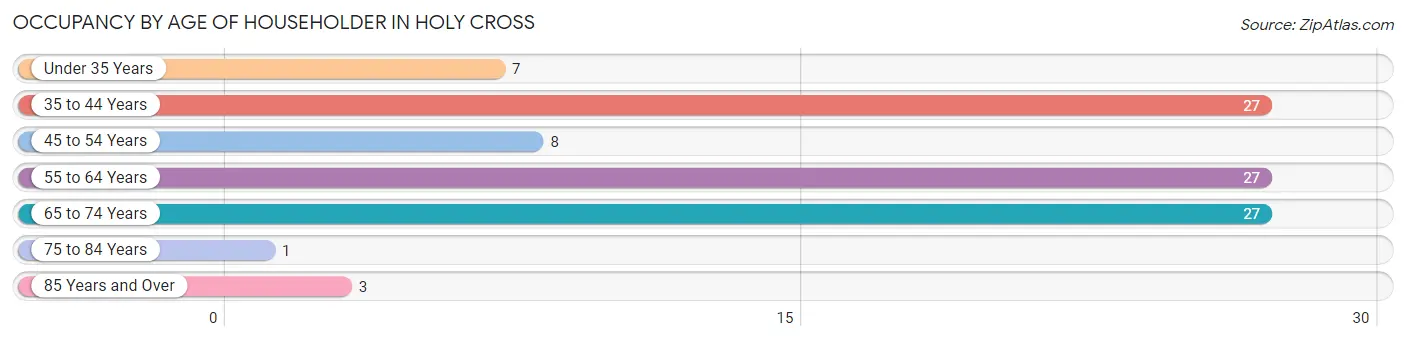
| Age Bracket | # Households | % Households |
| Under 35 Years | 7 | 7.0% |
| 35 to 44 Years | 27 | 27.0% |
| 45 to 54 Years | 8 | 8.0% |
| 55 to 64 Years | 27 | 27.0% |
| 65 to 74 Years | 27 | 27.0% |
| 75 to 84 Years | 1 | 1.0% |
| 85 Years and Over | 3 | 3.0% |
| Total | 100 | 100.0% |
Housing Finances in Holy Cross
Median Income by Occupancy in Holy Cross
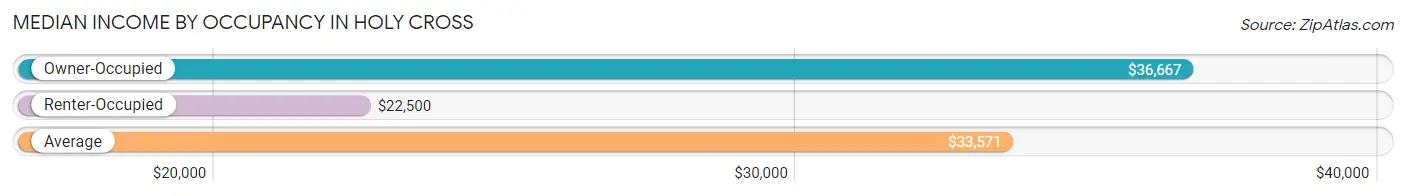
| Occupancy Type | # Households | Median Income |
| Owner-Occupied | 82 (82.0%) | $36,667 |
| Renter-Occupied | 18 (18.0%) | $22,500 |
| Average | 100 (100.0%) | $33,571 |
Occupancy by Householder Income Bracket in Holy Cross
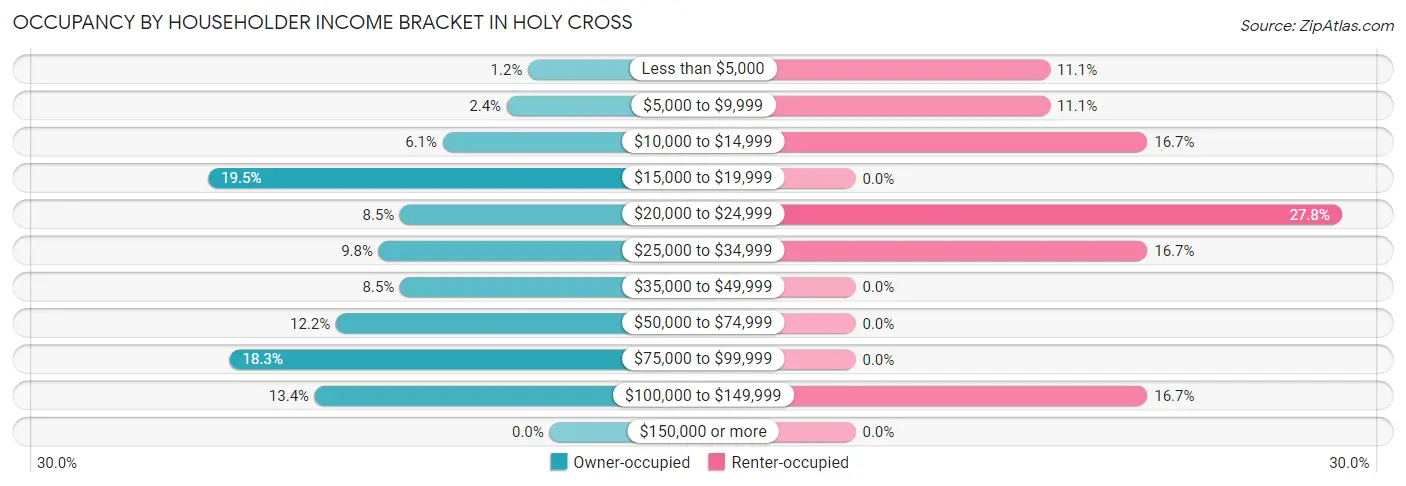
| Income Bracket | Owner-occupied | Renter-occupied |
| Less than $5,000 | 1 (1.2%) | 2 (11.1%) |
| $5,000 to $9,999 | 2 (2.4%) | 2 (11.1%) |
| $10,000 to $14,999 | 5 (6.1%) | 3 (16.7%) |
| $15,000 to $19,999 | 16 (19.5%) | 0 (0.0%) |
| $20,000 to $24,999 | 7 (8.5%) | 5 (27.8%) |
| $25,000 to $34,999 | 8 (9.8%) | 3 (16.7%) |
| $35,000 to $49,999 | 7 (8.5%) | 0 (0.0%) |
| $50,000 to $74,999 | 10 (12.2%) | 0 (0.0%) |
| $75,000 to $99,999 | 15 (18.3%) | 0 (0.0%) |
| $100,000 to $149,999 | 11 (13.4%) | 3 (16.7%) |
| $150,000 or more | 0 (0.0%) | 0 (0.0%) |
| Total | 82 (100.0%) | 18 (100.0%) |
Monthly Housing Cost Tiers in Holy Cross
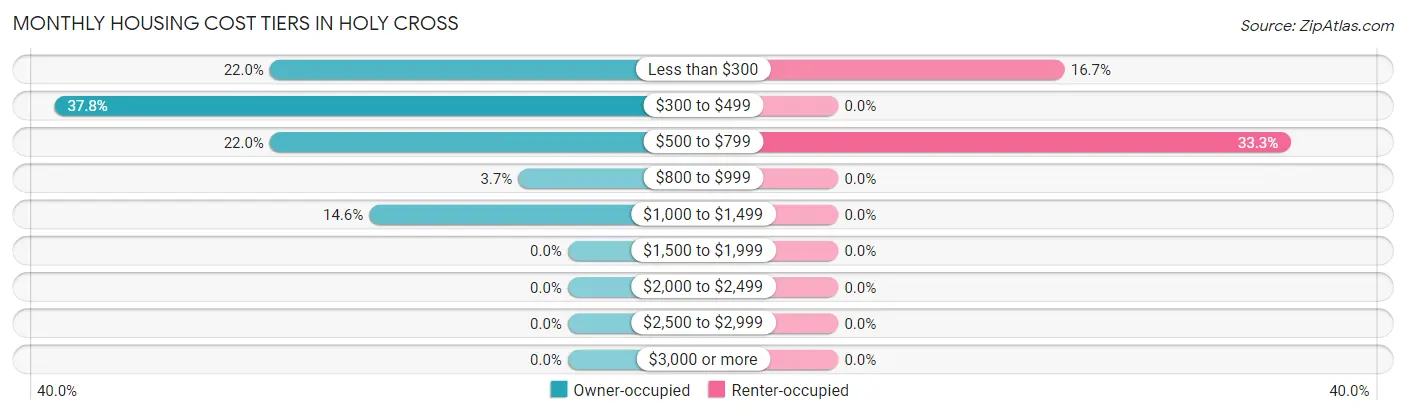
| Monthly Cost | Owner-occupied | Renter-occupied |
| Less than $300 | 18 (22.0%) | 3 (16.7%) |
| $300 to $499 | 31 (37.8%) | 0 (0.0%) |
| $500 to $799 | 18 (22.0%) | 6 (33.3%) |
| $800 to $999 | 3 (3.7%) | 0 (0.0%) |
| $1,000 to $1,499 | 12 (14.6%) | 0 (0.0%) |
| $1,500 to $1,999 | 0 (0.0%) | 0 (0.0%) |
| $2,000 to $2,499 | 0 (0.0%) | 0 (0.0%) |
| $2,500 to $2,999 | 0 (0.0%) | 0 (0.0%) |
| $3,000 or more | 0 (0.0%) | 0 (0.0%) |
| Total | 82 (100.0%) | 18 (100.0%) |
Physical Housing Characteristics in Holy Cross
Housing Structures in Holy Cross
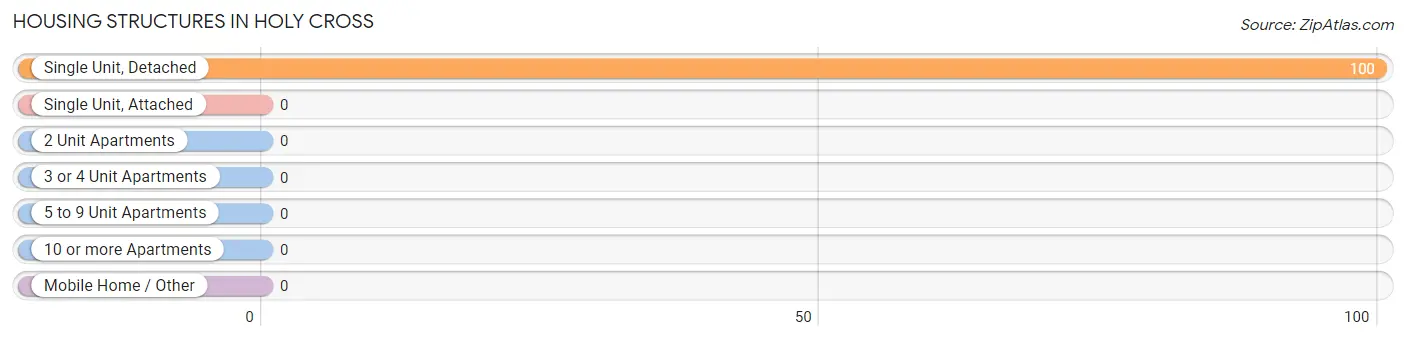
| Structure Type | # Housing Units | % Housing Units |
| Single Unit, Detached | 100 | 100.0% |
| Single Unit, Attached | 0 | 0.0% |
| 2 Unit Apartments | 0 | 0.0% |
| 3 or 4 Unit Apartments | 0 | 0.0% |
| 5 to 9 Unit Apartments | 0 | 0.0% |
| 10 or more Apartments | 0 | 0.0% |
| Mobile Home / Other | 0 | 0.0% |
| Total | 100 | 100.0% |
Housing Structures by Occupancy in Holy Cross
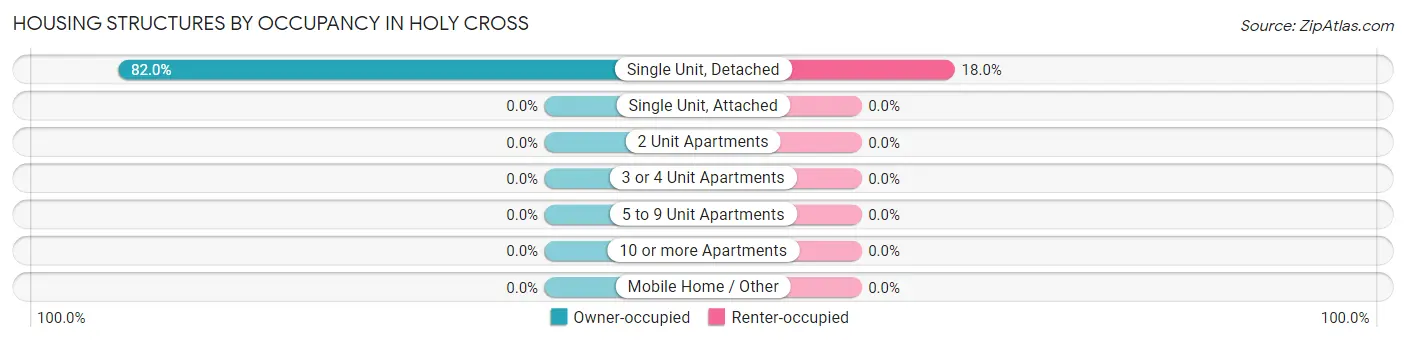
| Structure Type | Owner-occupied | Renter-occupied |
| Single Unit, Detached | 82 (82.0%) | 18 (18.0%) |
| Single Unit, Attached | 0 (0.0%) | 0 (0.0%) |
| 2 Unit Apartments | 0 (0.0%) | 0 (0.0%) |
| 3 or 4 Unit Apartments | 0 (0.0%) | 0 (0.0%) |
| 5 to 9 Unit Apartments | 0 (0.0%) | 0 (0.0%) |
| 10 or more Apartments | 0 (0.0%) | 0 (0.0%) |
| Mobile Home / Other | 0 (0.0%) | 0 (0.0%) |
| Total | 82 (82.0%) | 18 (18.0%) |
Housing Structures by Number of Rooms in Holy Cross
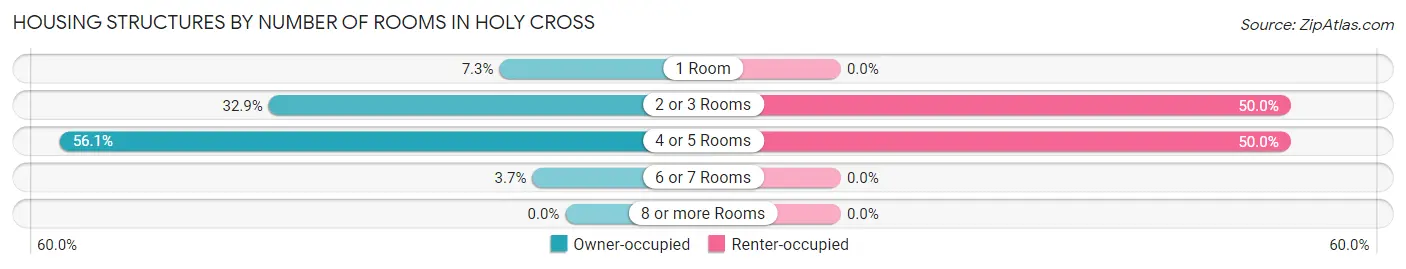
| Number of Rooms | Owner-occupied | Renter-occupied |
| 1 Room | 6 (7.3%) | 0 (0.0%) |
| 2 or 3 Rooms | 27 (32.9%) | 9 (50.0%) |
| 4 or 5 Rooms | 46 (56.1%) | 9 (50.0%) |
| 6 or 7 Rooms | 3 (3.7%) | 0 (0.0%) |
| 8 or more Rooms | 0 (0.0%) | 0 (0.0%) |
| Total | 82 (100.0%) | 18 (100.0%) |
Housing Structure by Heating Type in Holy Cross
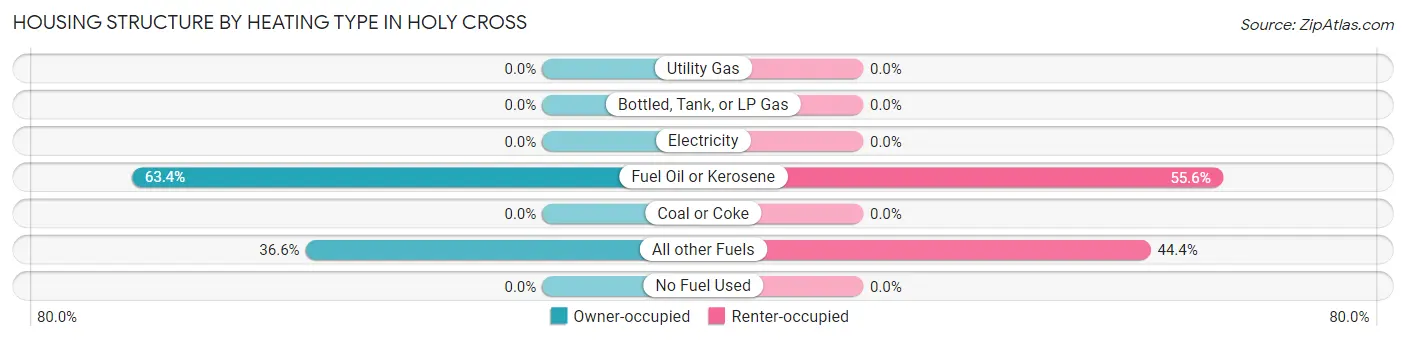
| Heating Type | Owner-occupied | Renter-occupied |
| Utility Gas | 0 (0.0%) | 0 (0.0%) |
| Bottled, Tank, or LP Gas | 0 (0.0%) | 0 (0.0%) |
| Electricity | 0 (0.0%) | 0 (0.0%) |
| Fuel Oil or Kerosene | 52 (63.4%) | 10 (55.6%) |
| Coal or Coke | 0 (0.0%) | 0 (0.0%) |
| All other Fuels | 30 (36.6%) | 8 (44.4%) |
| No Fuel Used | 0 (0.0%) | 0 (0.0%) |
| Total | 82 (100.0%) | 18 (100.0%) |
Household Vehicle Usage in Holy Cross
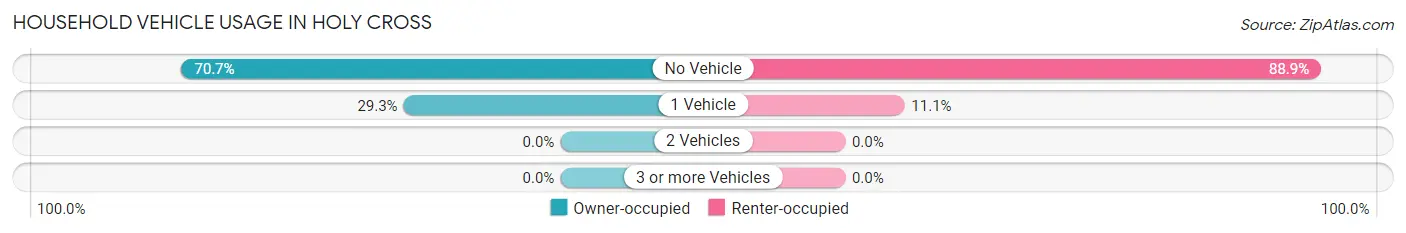
| Vehicles per Household | Owner-occupied | Renter-occupied |
| No Vehicle | 58 (70.7%) | 16 (88.9%) |
| 1 Vehicle | 24 (29.3%) | 2 (11.1%) |
| 2 Vehicles | 0 (0.0%) | 0 (0.0%) |
| 3 or more Vehicles | 0 (0.0%) | 0 (0.0%) |
| Total | 82 (100.0%) | 18 (100.0%) |
Real Estate & Mortgages in Holy Cross
Real Estate and Mortgage Overview in Holy Cross
| Characteristic | Without Mortgage | With Mortgage |
| Housing Units | 76 | 6 |
| Median Property Value | $48,900 | $283,300 |
| Median Household Income | $34,375 | $0 |
| Monthly Housing Costs | $387 | $0 |
| Real Estate Taxes | - | - |
Property Value by Mortgage Status in Holy Cross
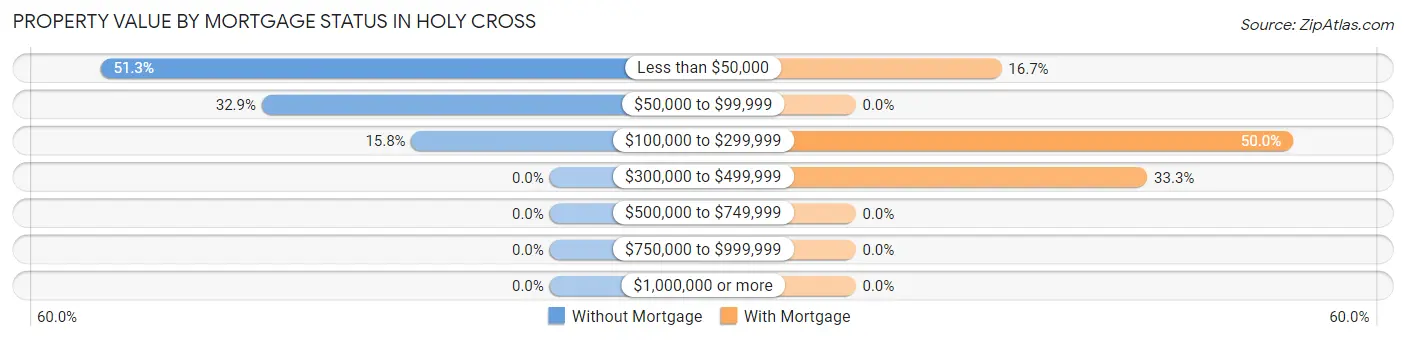
| Property Value | Without Mortgage | With Mortgage |
| Less than $50,000 | 39 (51.3%) | 1 (16.7%) |
| $50,000 to $99,999 | 25 (32.9%) | 0 (0.0%) |
| $100,000 to $299,999 | 12 (15.8%) | 3 (50.0%) |
| $300,000 to $499,999 | 0 (0.0%) | 2 (33.3%) |
| $500,000 to $749,999 | 0 (0.0%) | 0 (0.0%) |
| $750,000 to $999,999 | 0 (0.0%) | 0 (0.0%) |
| $1,000,000 or more | 0 (0.0%) | 0 (0.0%) |
| Total | 76 (100.0%) | 6 (100.0%) |
Household Income by Mortgage Status in Holy Cross
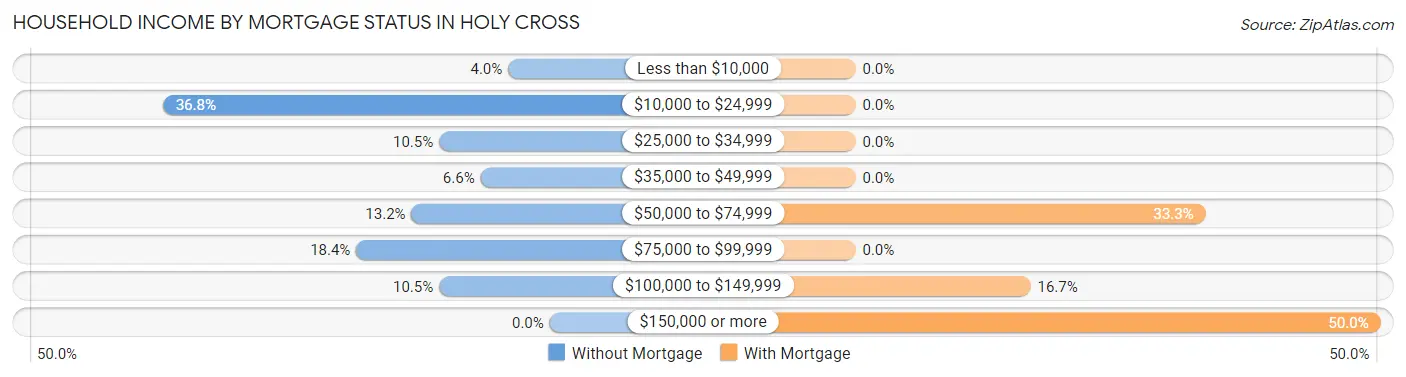
| Household Income | Without Mortgage | With Mortgage |
| Less than $10,000 | 3 (4.0%) | 0 (0.0%) |
| $10,000 to $24,999 | 28 (36.8%) | 0 (0.0%) |
| $25,000 to $34,999 | 8 (10.5%) | 0 (0.0%) |
| $35,000 to $49,999 | 5 (6.6%) | 0 (0.0%) |
| $50,000 to $74,999 | 10 (13.2%) | 2 (33.3%) |
| $75,000 to $99,999 | 14 (18.4%) | 0 (0.0%) |
| $100,000 to $149,999 | 8 (10.5%) | 1 (16.7%) |
| $150,000 or more | 0 (0.0%) | 3 (50.0%) |
| Total | 76 (100.0%) | 6 (100.0%) |
Property Value to Household Income Ratio in Holy Cross
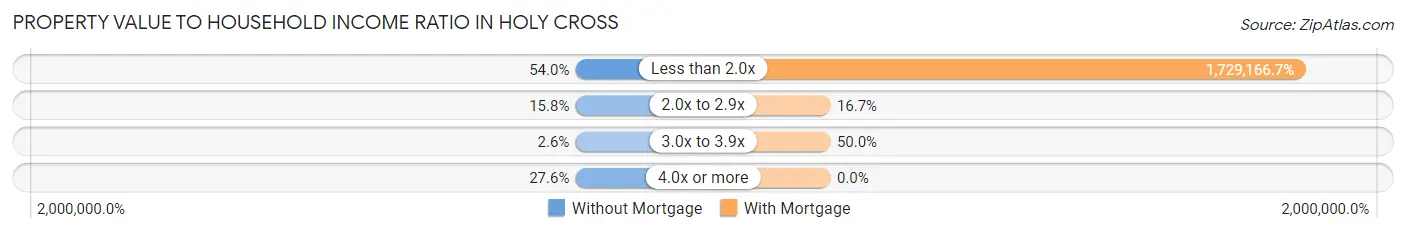
| Value-to-Income Ratio | Without Mortgage | With Mortgage |
| Less than 2.0x | 41 (53.9%) | 103,750 (1,729,166.7%) |
| 2.0x to 2.9x | 12 (15.8%) | 1 (16.7%) |
| 3.0x to 3.9x | 2 (2.6%) | 3 (50.0%) |
| 4.0x or more | 21 (27.6%) | 0 (0.0%) |
| Total | 76 (100.0%) | 6 (100.0%) |
Real Estate Taxes by Mortgage Status in Holy Cross
| Property Taxes | Without Mortgage | With Mortgage |
| Less than $800 | 0 (0.0%) | 0 (0.0%) |
| $800 to $1,499 | 0 (0.0%) | 0 (0.0%) |
| $800 to $1,499 | 0 (0.0%) | 0 (0.0%) |
| Total | 76 (100.0%) | 6 (100.0%) |
Health & Disability in Holy Cross
Health Insurance Coverage by Age in Holy Cross
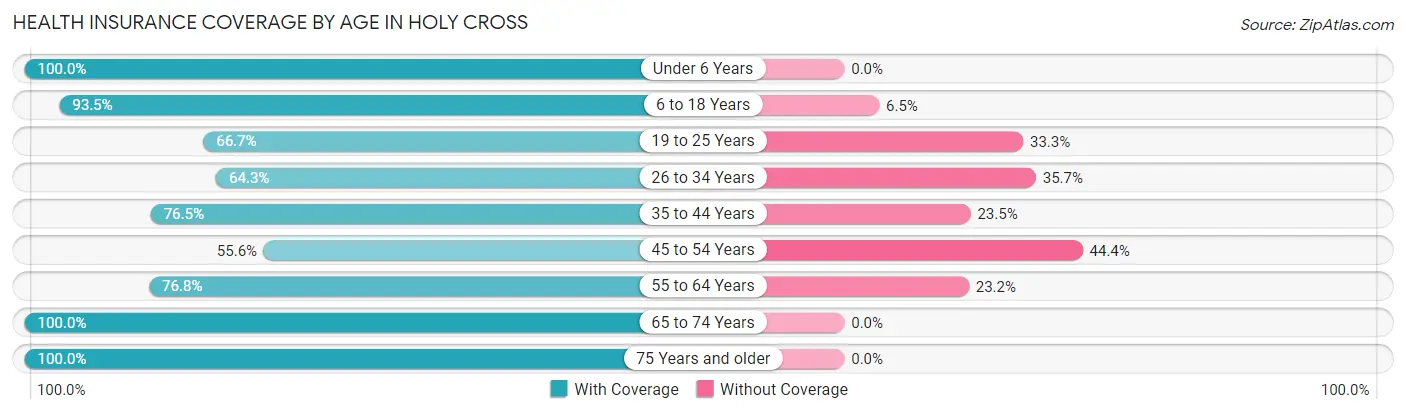
| Age Bracket | With Coverage | Without Coverage |
| Under 6 Years | 24 (100.0%) | 0 (0.0%) |
| 6 to 18 Years | 72 (93.5%) | 5 (6.5%) |
| 19 to 25 Years | 6 (66.7%) | 3 (33.3%) |
| 26 to 34 Years | 18 (64.3%) | 10 (35.7%) |
| 35 to 44 Years | 26 (76.5%) | 8 (23.5%) |
| 45 to 54 Years | 10 (55.6%) | 8 (44.4%) |
| 55 to 64 Years | 43 (76.8%) | 13 (23.2%) |
| 65 to 74 Years | 27 (100.0%) | 0 (0.0%) |
| 75 Years and older | 4 (100.0%) | 0 (0.0%) |
| Total | 230 (83.0%) | 47 (17.0%) |
Health Insurance Coverage by Citizenship Status in Holy Cross
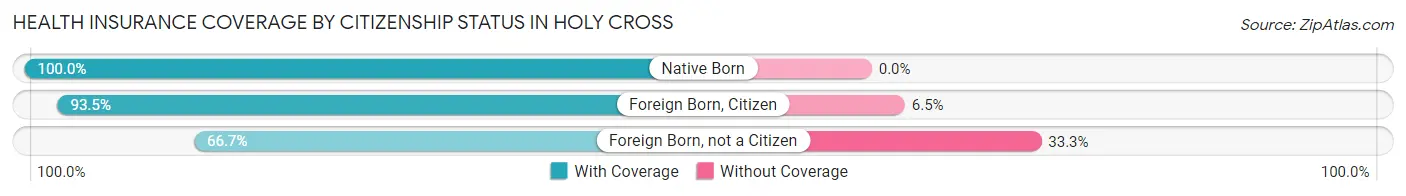
| Citizenship Status | With Coverage | Without Coverage |
| Native Born | 24 (100.0%) | 0 (0.0%) |
| Foreign Born, Citizen | 72 (93.5%) | 5 (6.5%) |
| Foreign Born, not a Citizen | 6 (66.7%) | 3 (33.3%) |
Health Insurance Coverage by Household Income in Holy Cross
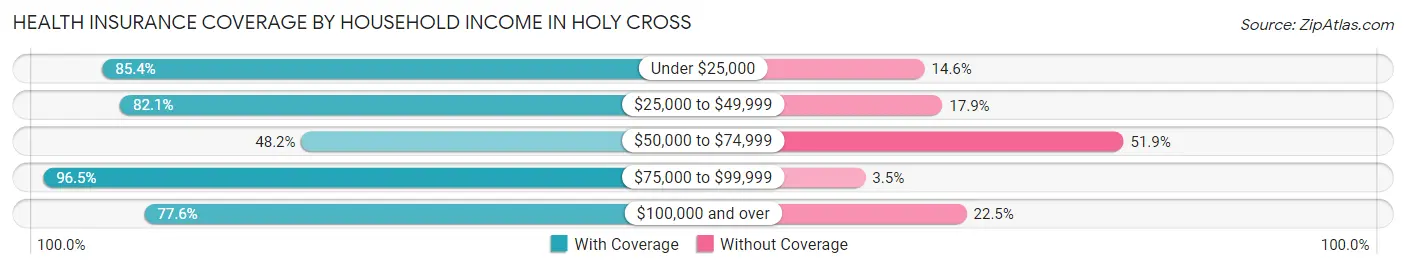
| Household Income | With Coverage | Without Coverage |
| Under $25,000 | 41 (85.4%) | 7 (14.6%) |
| $25,000 to $49,999 | 55 (82.1%) | 12 (17.9%) |
| $50,000 to $74,999 | 13 (48.1%) | 14 (51.8%) |
| $75,000 to $99,999 | 83 (96.5%) | 3 (3.5%) |
| $100,000 and over | 38 (77.5%) | 11 (22.5%) |
Public vs Private Health Insurance Coverage by Age in Holy Cross
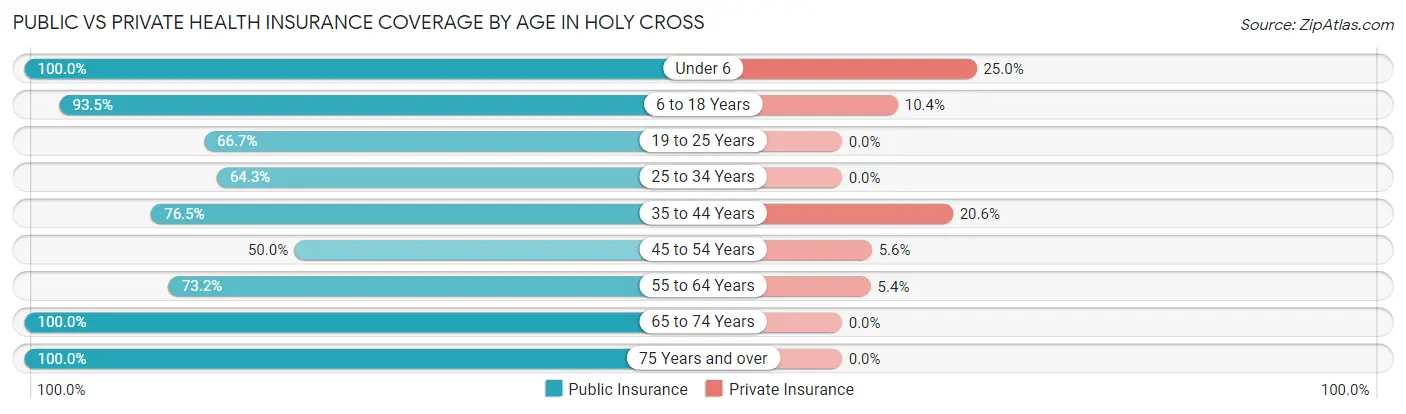
| Age Bracket | Public Insurance | Private Insurance |
| Under 6 | 24 (100.0%) | 6 (25.0%) |
| 6 to 18 Years | 72 (93.5%) | 8 (10.4%) |
| 19 to 25 Years | 6 (66.7%) | 0 (0.0%) |
| 25 to 34 Years | 18 (64.3%) | 0 (0.0%) |
| 35 to 44 Years | 26 (76.5%) | 7 (20.6%) |
| 45 to 54 Years | 9 (50.0%) | 1 (5.6%) |
| 55 to 64 Years | 41 (73.2%) | 3 (5.4%) |
| 65 to 74 Years | 27 (100.0%) | 0 (0.0%) |
| 75 Years and over | 4 (100.0%) | 0 (0.0%) |
| Total | 227 (82.0%) | 25 (9.0%) |
Disability Status by Sex by Age in Holy Cross
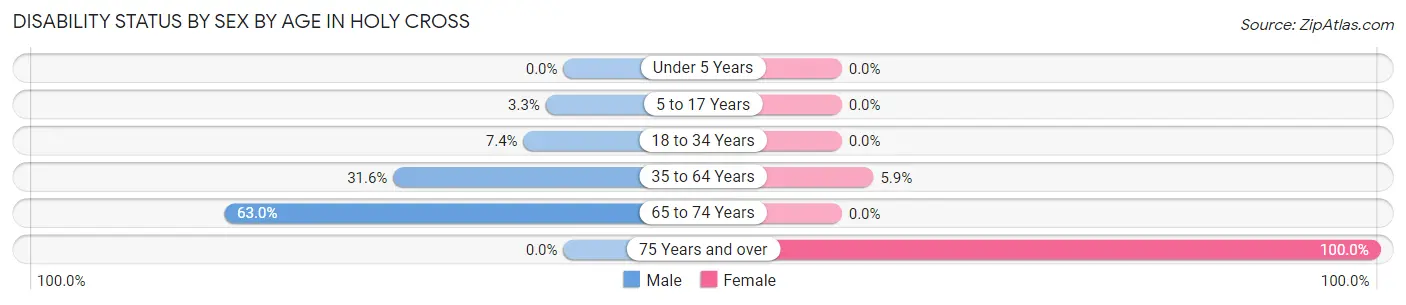
| Age Bracket | Male | Female |
| Under 5 Years | 0 (0.0%) | 0 (0.0%) |
| 5 to 17 Years | 2 (3.3%) | 0 (0.0%) |
| 18 to 34 Years | 2 (7.4%) | 0 (0.0%) |
| 35 to 64 Years | 18 (31.6%) | 3 (5.9%) |
| 65 to 74 Years | 17 (63.0%) | 0 (0.0%) |
| 75 Years and over | 0 (0.0%) | 4 (100.0%) |
Disability Class by Sex by Age in Holy Cross
Disability Class: Hearing Difficulty

| Age Bracket | Male | Female |
| Under 5 Years | 0 (0.0%) | 0 (0.0%) |
| 5 to 17 Years | 2 (3.3%) | 0 (0.0%) |
| 18 to 34 Years | 0 (0.0%) | 0 (0.0%) |
| 35 to 64 Years | 16 (28.1%) | 1 (2.0%) |
| 65 to 74 Years | 17 (63.0%) | 0 (0.0%) |
| 75 Years and over | 0 (0.0%) | 4 (100.0%) |
Disability Class: Vision Difficulty
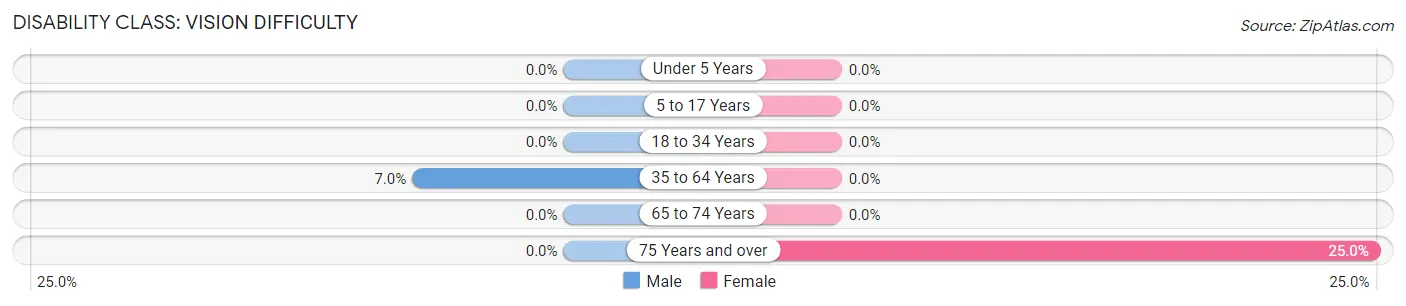
| Age Bracket | Male | Female |
| Under 5 Years | 0 (0.0%) | 0 (0.0%) |
| 5 to 17 Years | 0 (0.0%) | 0 (0.0%) |
| 18 to 34 Years | 0 (0.0%) | 0 (0.0%) |
| 35 to 64 Years | 4 (7.0%) | 0 (0.0%) |
| 65 to 74 Years | 0 (0.0%) | 0 (0.0%) |
| 75 Years and over | 0 (0.0%) | 1 (25.0%) |
Disability Class: Cognitive Difficulty
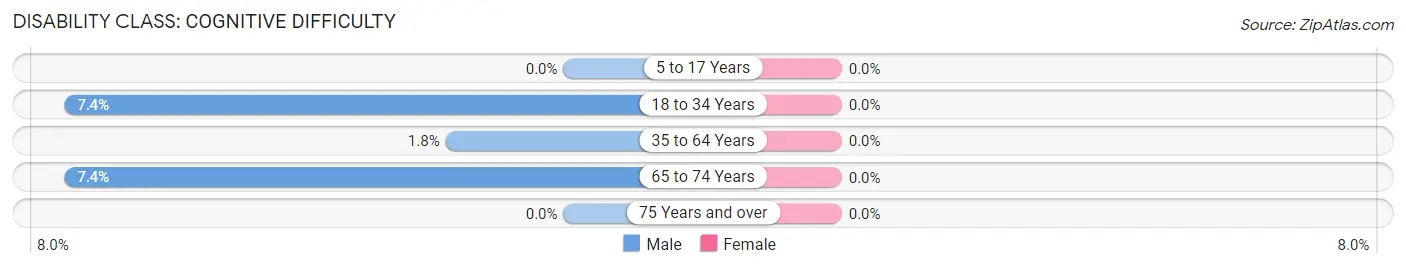
| Age Bracket | Male | Female |
| 5 to 17 Years | 0 (0.0%) | 0 (0.0%) |
| 18 to 34 Years | 2 (7.4%) | 0 (0.0%) |
| 35 to 64 Years | 1 (1.8%) | 0 (0.0%) |
| 65 to 74 Years | 2 (7.4%) | 0 (0.0%) |
| 75 Years and over | 0 (0.0%) | 0 (0.0%) |
Disability Class: Ambulatory Difficulty
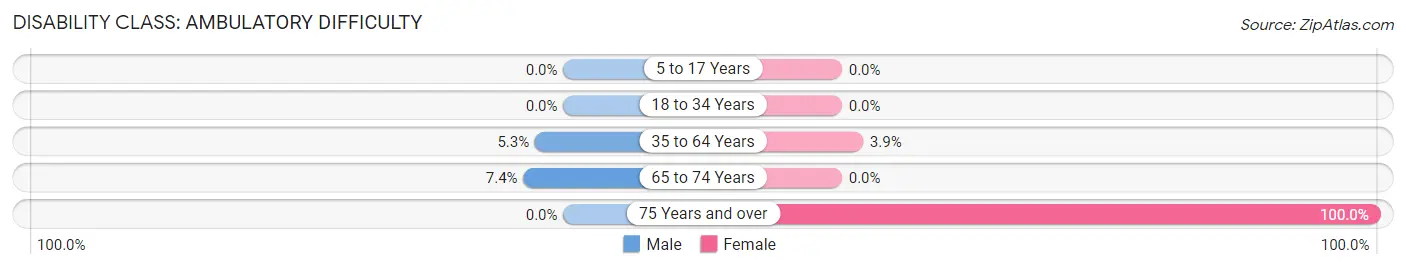
| Age Bracket | Male | Female |
| 5 to 17 Years | 0 (0.0%) | 0 (0.0%) |
| 18 to 34 Years | 0 (0.0%) | 0 (0.0%) |
| 35 to 64 Years | 3 (5.3%) | 2 (3.9%) |
| 65 to 74 Years | 2 (7.4%) | 0 (0.0%) |
| 75 Years and over | 0 (0.0%) | 4 (100.0%) |
Disability Class: Self-Care Difficulty
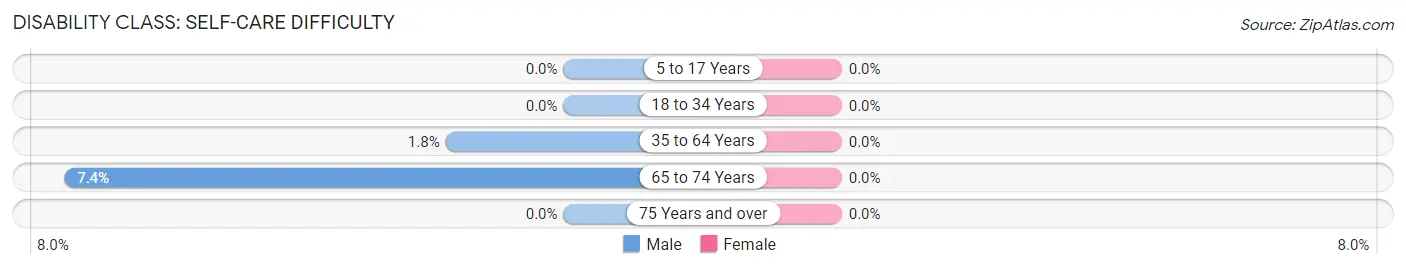
| Age Bracket | Male | Female |
| 5 to 17 Years | 0 (0.0%) | 0 (0.0%) |
| 18 to 34 Years | 0 (0.0%) | 0 (0.0%) |
| 35 to 64 Years | 1 (1.8%) | 0 (0.0%) |
| 65 to 74 Years | 2 (7.4%) | 0 (0.0%) |
| 75 Years and over | 0 (0.0%) | 0 (0.0%) |
Technology Access in Holy Cross
Computing Device Access in Holy Cross
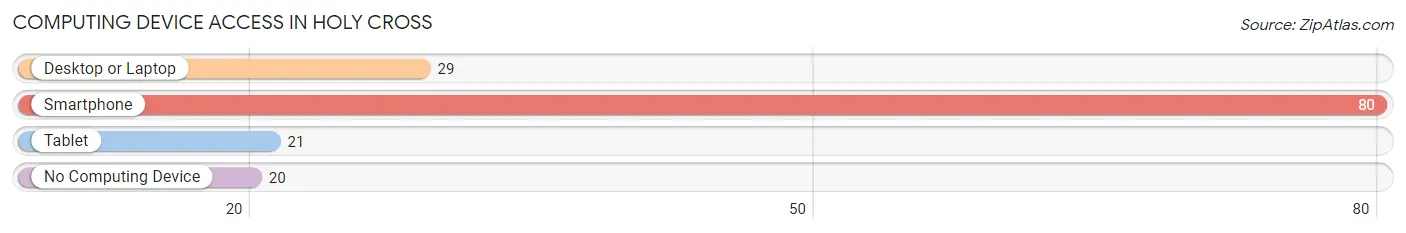
| Device Type | # Households | % Households |
| Desktop or Laptop | 29 | 29.0% |
| Smartphone | 80 | 80.0% |
| Tablet | 21 | 21.0% |
| No Computing Device | 20 | 20.0% |
| Total | 100 | 100.0% |
Internet Access in Holy Cross
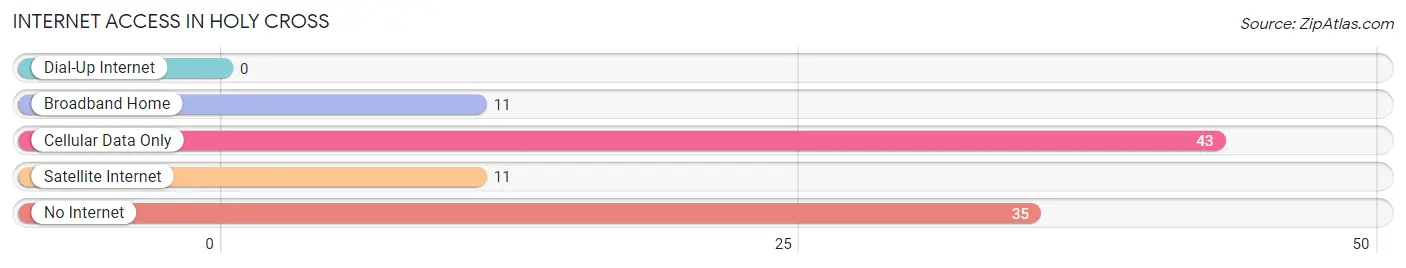
| Internet Type | # Households | % Households |
| Dial-Up Internet | 0 | 0.0% |
| Broadband Home | 11 | 11.0% |
| Cellular Data Only | 43 | 43.0% |
| Satellite Internet | 11 | 11.0% |
| No Internet | 35 | 35.0% |
| Total | 100 | 100.0% |
Holy Cross Summary
Cross, Alaska is a small unincorporated community located in the Yukon-Koyukuk Census Area of the U.S. state of Alaska. It is situated on the south bank of the Yukon River, approximately 40 miles (64 km) east of the city of Galena. The population of Cross was estimated to be 28 in 2019.
History
Cross was originally established as a trading post in the late 19th century. It was named after a nearby creek, which was named after a local Native American chief. The trading post was operated by the Alaska Commercial Company, which was the main supplier of goods to the local population.
In the early 20th century, Cross became a popular stop for travelers on the Yukon River. It was also a popular destination for gold prospectors during the Klondike Gold Rush.
In the 1950s, Cross was the site of a U.S. Air Force radar station. The station was part of the Distant Early Warning (DEW) Line, which was a system of radar stations designed to detect incoming Soviet bombers. The station was decommissioned in the late 1960s.
Geography
Cross is located in the Yukon-Koyukuk Census Area of Alaska. It is situated on the south bank of the Yukon River, approximately 40 miles (64 km) east of the city of Galena. The community is located in a flat, low-lying area, with the surrounding terrain consisting of rolling hills and low mountains.
The climate in Cross is subarctic, with long, cold winters and short, mild summers. The average temperature in January is -20°F (-29°C), while the average temperature in July is 57°F (14°C). The average annual precipitation is 11 inches (279 mm).
Economy
Cross is a small, rural community with a limited economy. The primary industries in the area are subsistence fishing and hunting, as well as tourism. The community is also home to a small number of businesses, including a general store, a restaurant, and a gas station.
Demographics
As of 2019, the population of Cross was estimated to be 28. The racial makeup of the community is predominantly Native American, with the majority of the population being of Yup'ik descent. The median age in Cross is 33.5 years, and the median household income is $25,000.
Conclusion
Cross, Alaska is a small unincorporated community located in the Yukon-Koyukuk Census Area of the U.S. state of Alaska. It was originally established as a trading post in the late 19th century, and became a popular stop for travelers on the Yukon River during the Klondike Gold Rush. The population of Cross was estimated to be 28 in 2019, and the primary industries in the area are subsistence fishing and hunting, as well as tourism. The racial makeup of the community is predominantly Native American, with the majority of the population being of Yup'ik descent.
Common Questions
What is Per Capita Income in Holy Cross?
Per Capita income in Holy Cross is $17,373.
What is the Median Family Income in Holy Cross?
Median Family Income in Holy Cross is $49,063.
What is the Median Household income in Holy Cross?
Median Household Income in Holy Cross is $33,571.
What is Inequality or Gini Index in Holy Cross?
Inequality or Gini Index in Holy Cross is 0.43.
What is the Total Population of Holy Cross?
Total Population of Holy Cross is 277.
What is the Total Male Population of Holy Cross?
Total Male Population of Holy Cross is 185.
What is the Total Female Population of Holy Cross?
Total Female Population of Holy Cross is 92.
What is the Ratio of Males per 100 Females in Holy Cross?
There are 201.09 Males per 100 Females in Holy Cross.
What is the Ratio of Females per 100 Males in Holy Cross?
There are 49.73 Females per 100 Males in Holy Cross.
What is the Median Population Age in Holy Cross?
Median Population Age in Holy Cross is 35.0 Years.
What is the Average Family Size in Holy Cross
Average Family Size in Holy Cross is 4.2 People.
What is the Average Household Size in Holy Cross
Average Household Size in Holy Cross is 2.8 People.
How Large is the Labor Force in Holy Cross?
There are 123 People in the Labor Forcein in Holy Cross.
What is the Percentage of People in the Labor Force in Holy Cross?
59.4% of People are in the Labor Force in Holy Cross.
What is the Unemployment Rate in Holy Cross?
Unemployment Rate in Holy Cross is 12.2%.