Newtok, AK Map & Demographics
Newtok Map
Newtok Overview
$12,669
PER CAPITA INCOME
$51,250
AVG FAMILY INCOME
$34,583
AVG HOUSEHOLD INCOME
19.0%
WAGE / INCOME GAP [ % ]
81.0¢/ $1
WAGE / INCOME GAP [ $ ]
0.30
INEQUALITY / GINI INDEX
96
TOTAL POPULATION
53
MALE POPULATION
43
FEMALE POPULATION
123.26
MALES / 100 FEMALES
81.13
FEMALES / 100 MALES
31.2
MEDIAN AGE
5.2
AVG FAMILY SIZE
3.6
AVG HOUSEHOLD SIZE
39
LABOR FORCE [ PEOPLE ]
52.7%
PERCENT IN LABOR FORCE
25.6%
UNEMPLOYMENT RATE
Newtok Area Codes
Income in Newtok
Income Overview in Newtok
Per Capita Income in Newtok is $12,669, while median incomes of families and households are $51,250 and $34,583 respectively.
| Characteristic | Number | Measure |
| Per Capita Income | 96 | $12,669 |
| Median Family Income | 16 | $51,250 |
| Mean Family Income | 16 | $49,256 |
| Median Household Income | 27 | $34,583 |
| Mean Household Income | 27 | $42,922 |
| Income Deficit | 16 | $0 |
| Wage / Income Gap (%) | 96 | 19.05% |
| Wage / Income Gap ($) | 96 | 80.95¢ per $1 |
| Gini / Inequality Index | 96 | 0.30 |
Earnings by Sex in Newtok
Average Earnings in Newtok are $16,250, $14,167 for men and $17,500 for women, a difference of 19.1%.
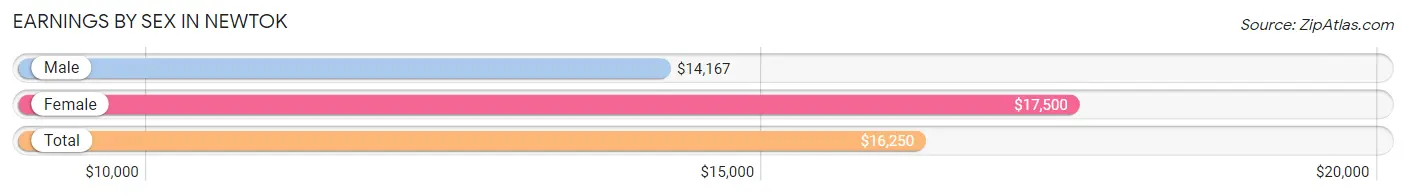
| Sex | Number | Average Earnings |
| Male | 24 (52.2%) | $14,167 |
| Female | 22 (47.8%) | $17,500 |
| Total | 46 (100.0%) | $16,250 |
Earnings by Sex by Income Bracket in Newtok
The most common earnings brackets in Newtok are $2,499 or less for men (5 | 20.8%) and $2,499 or less for women (7 | 31.8%).
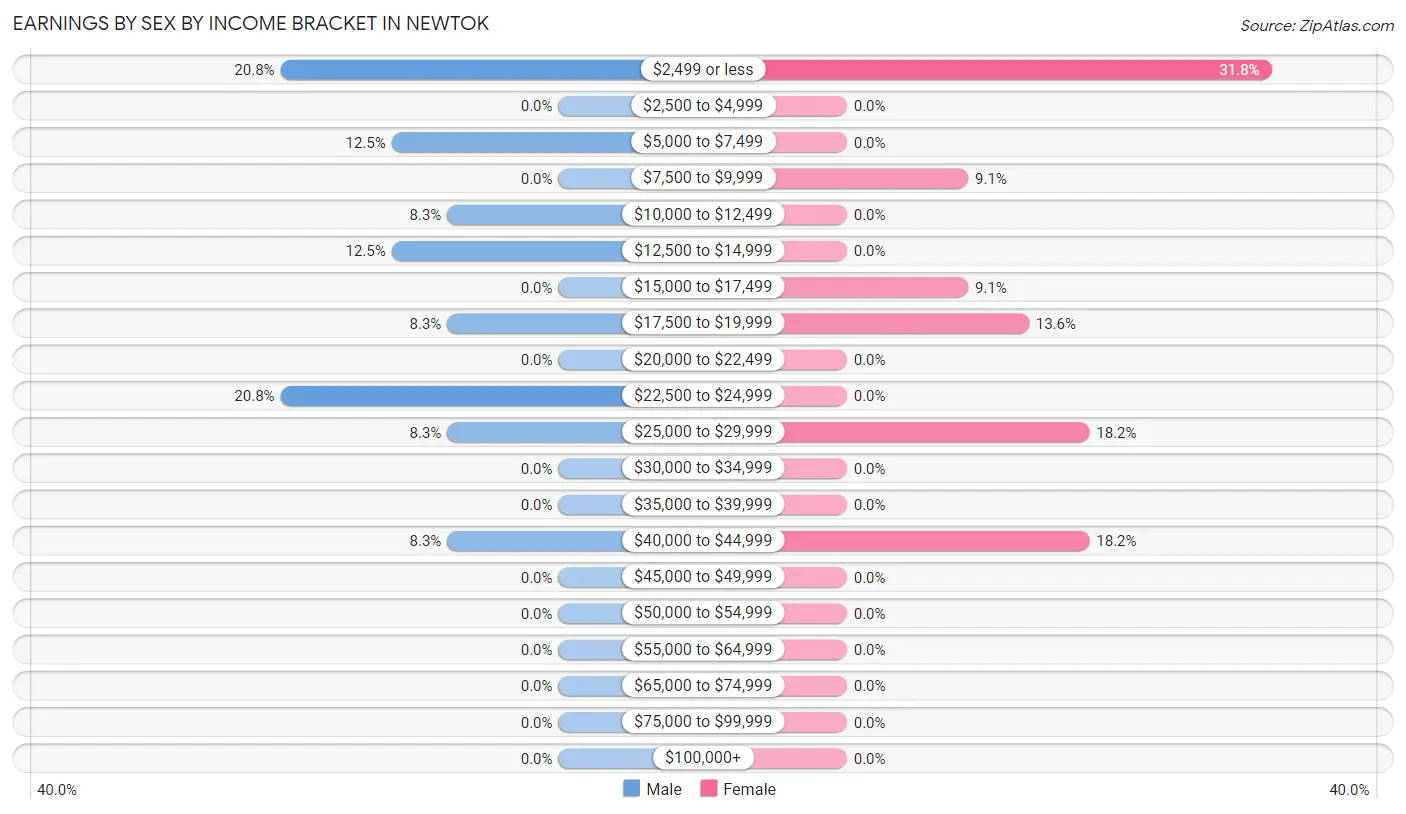
| Income | Male | Female |
| $2,499 or less | 5 (20.8%) | 7 (31.8%) |
| $2,500 to $4,999 | 0 (0.0%) | 0 (0.0%) |
| $5,000 to $7,499 | 3 (12.5%) | 0 (0.0%) |
| $7,500 to $9,999 | 0 (0.0%) | 2 (9.1%) |
| $10,000 to $12,499 | 2 (8.3%) | 0 (0.0%) |
| $12,500 to $14,999 | 3 (12.5%) | 0 (0.0%) |
| $15,000 to $17,499 | 0 (0.0%) | 2 (9.1%) |
| $17,500 to $19,999 | 2 (8.3%) | 3 (13.6%) |
| $20,000 to $22,499 | 0 (0.0%) | 0 (0.0%) |
| $22,500 to $24,999 | 5 (20.8%) | 0 (0.0%) |
| $25,000 to $29,999 | 2 (8.3%) | 4 (18.2%) |
| $30,000 to $34,999 | 0 (0.0%) | 0 (0.0%) |
| $35,000 to $39,999 | 0 (0.0%) | 0 (0.0%) |
| $40,000 to $44,999 | 2 (8.3%) | 4 (18.2%) |
| $45,000 to $49,999 | 0 (0.0%) | 0 (0.0%) |
| $50,000 to $54,999 | 0 (0.0%) | 0 (0.0%) |
| $55,000 to $64,999 | 0 (0.0%) | 0 (0.0%) |
| $65,000 to $74,999 | 0 (0.0%) | 0 (0.0%) |
| $75,000 to $99,999 | 0 (0.0%) | 0 (0.0%) |
| $100,000+ | 0 (0.0%) | 0 (0.0%) |
| Total | 24 (100.0%) | 22 (100.0%) |
Earnings by Sex by Educational Attainment in Newtok
Average earnings in Newtok are $19,375 for men and $27,813 for women, a difference of 30.3%. Men with an educational attainment of high school diploma enjoy the highest average annual earnings of $23,750, while those with high school diploma education earn the least with $23,750. Women with an educational attainment of high school diploma earn the most with the average annual earnings of $27,813, while those with high school diploma education have the smallest earnings of $27,813.
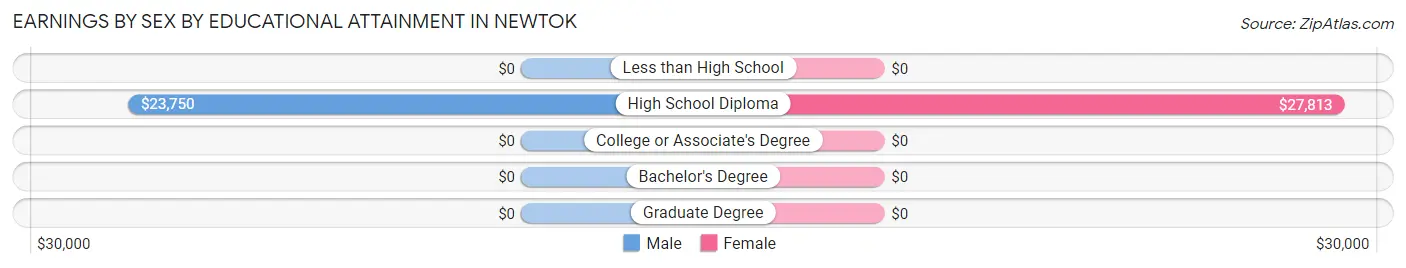
| Educational Attainment | Male Income | Female Income |
| Less than High School | - | - |
| High School Diploma | $23,750 | $27,813 |
| College or Associate's Degree | - | - |
| Bachelor's Degree | - | - |
| Graduate Degree | - | - |
| Total | $19,375 | $27,813 |
Family Income in Newtok
Family Income Brackets in Newtok
According to the Newtok family income data, there are 7 families falling into the $50,000 to $74,999 income range, which is the most common income bracket and makes up 43.8% of all families.
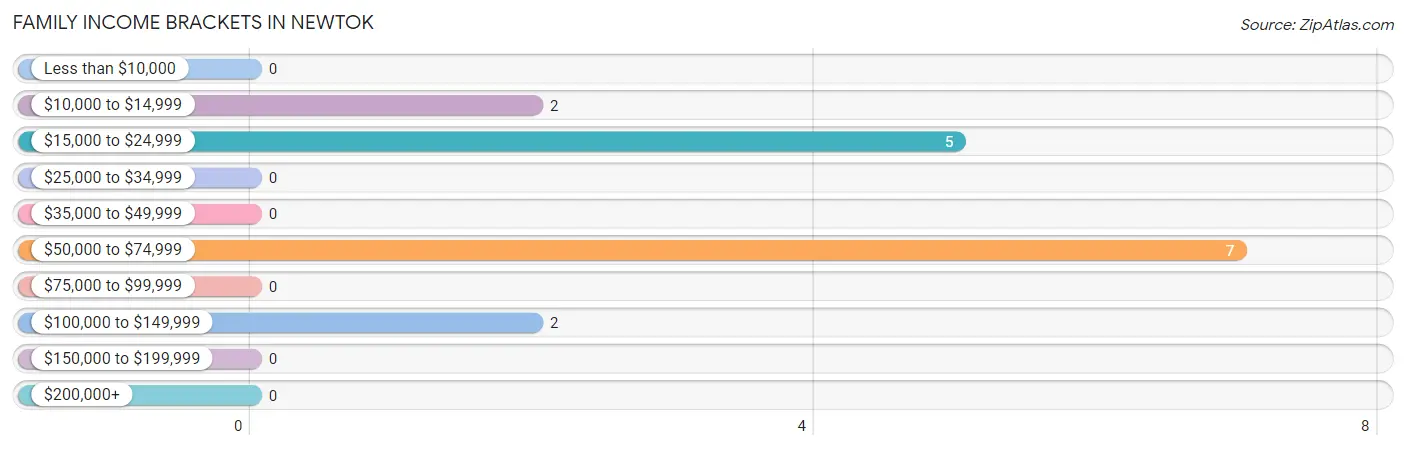
| Income Bracket | # Families | % Families |
| Less than $10,000 | 0 | 0.0% |
| $10,000 to $14,999 | 2 | 12.5% |
| $15,000 to $24,999 | 5 | 31.3% |
| $25,000 to $34,999 | 0 | 0.0% |
| $35,000 to $49,999 | 0 | 0.0% |
| $50,000 to $74,999 | 7 | 43.8% |
| $75,000 to $99,999 | 0 | 0.0% |
| $100,000 to $149,999 | 2 | 12.5% |
| $150,000 to $199,999 | 0 | 0.0% |
| $200,000+ | 0 | 0.0% |
Family Income by Famaliy Size in Newtok
| Income Bracket | # Families | Median Income |
| 2-Person Families | 2 (12.5%) | $0 |
| 3-Person Families | 6 (37.5%) | $0 |
| 4-Person Families | 2 (12.5%) | $0 |
| 5-Person Families | 2 (12.5%) | $0 |
| 6-Person Families | 0 (0.0%) | $0 |
| 7+ Person Families | 4 (25.0%) | $0 |
| Total | 16 (100.0%) | $51,250 |
Family Income by Number of Earners in Newtok
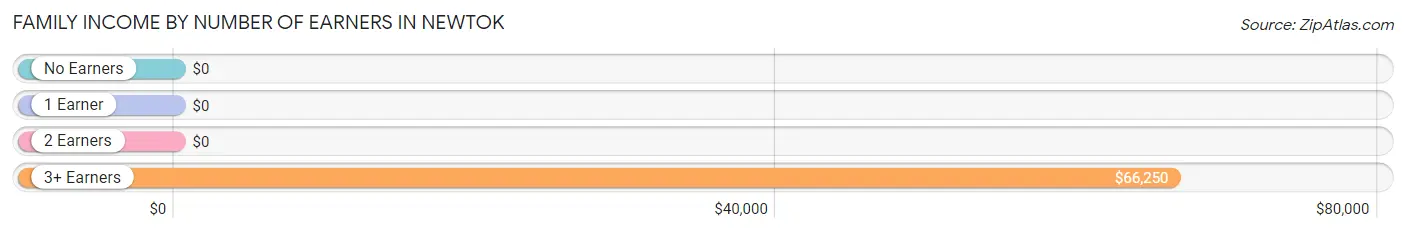
| Number of Earners | # Families | Median Income |
| No Earners | 2 (12.5%) | $0 |
| 1 Earner | 5 (31.2%) | $0 |
| 2 Earners | 3 (18.8%) | $0 |
| 3+ Earners | 6 (37.5%) | $66,250 |
| Total | 16 (100.0%) | $51,250 |
Household Income in Newtok
Household Income Brackets in Newtok
With 7 households falling in the category, the $15,000 to $24,999 income range is the most frequent in Newtok, accounting for 25.9% of all households.
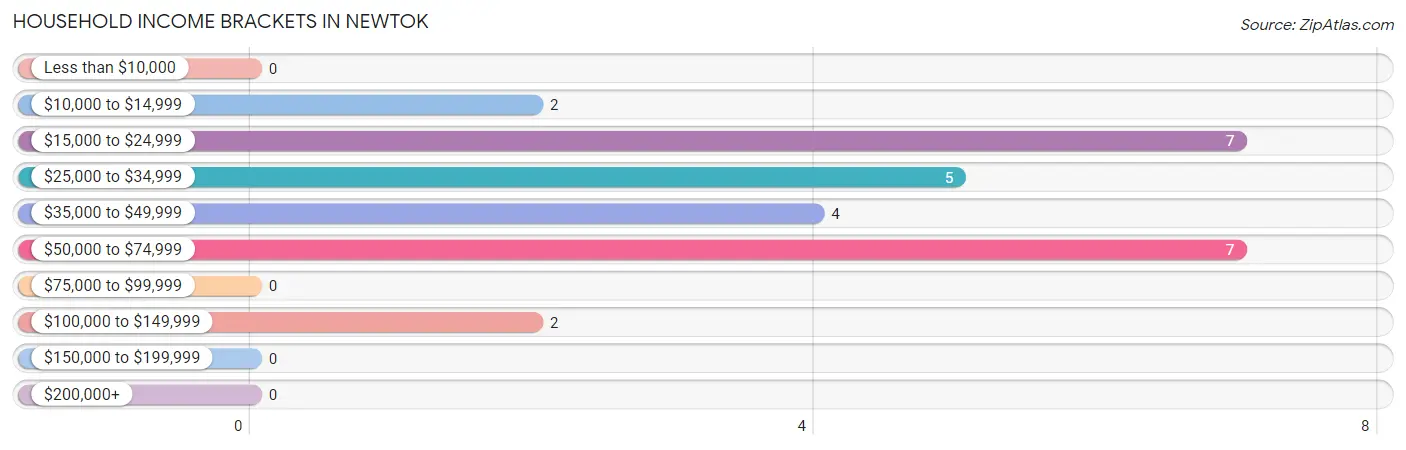
| Income Bracket | # Households | % Households |
| Less than $10,000 | 0 | 0.0% |
| $10,000 to $14,999 | 2 | 7.4% |
| $15,000 to $24,999 | 7 | 25.9% |
| $25,000 to $34,999 | 5 | 18.5% |
| $35,000 to $49,999 | 4 | 14.8% |
| $50,000 to $74,999 | 7 | 25.9% |
| $75,000 to $99,999 | 0 | 0.0% |
| $100,000 to $149,999 | 2 | 7.4% |
| $150,000 to $199,999 | 0 | 0.0% |
| $200,000+ | 0 | 0.0% |
Household Income by Householder Age in Newtok
The median household income in Newtok is $34,583, with the highest median household income of $50,625 found in the 45 to 64 years age bracket for the primary householder. A total of 7 households (25.9%) fall into this category.
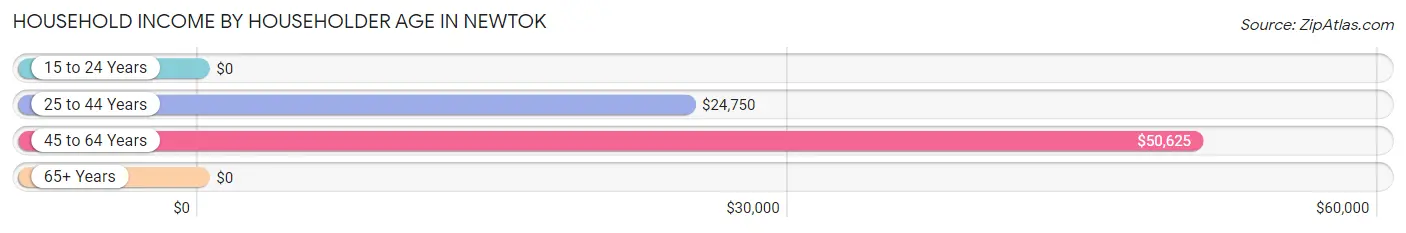
| Income Bracket | # Households | Median Income |
| 15 to 24 Years | 0 (0.0%) | $0 |
| 25 to 44 Years | 9 (33.3%) | $24,750 |
| 45 to 64 Years | 7 (25.9%) | $50,625 |
| 65+ Years | 11 (40.7%) | $0 |
| Total | 27 (100.0%) | $34,583 |
Poverty in Newtok
Income Below Poverty by Sex and Age in Newtok
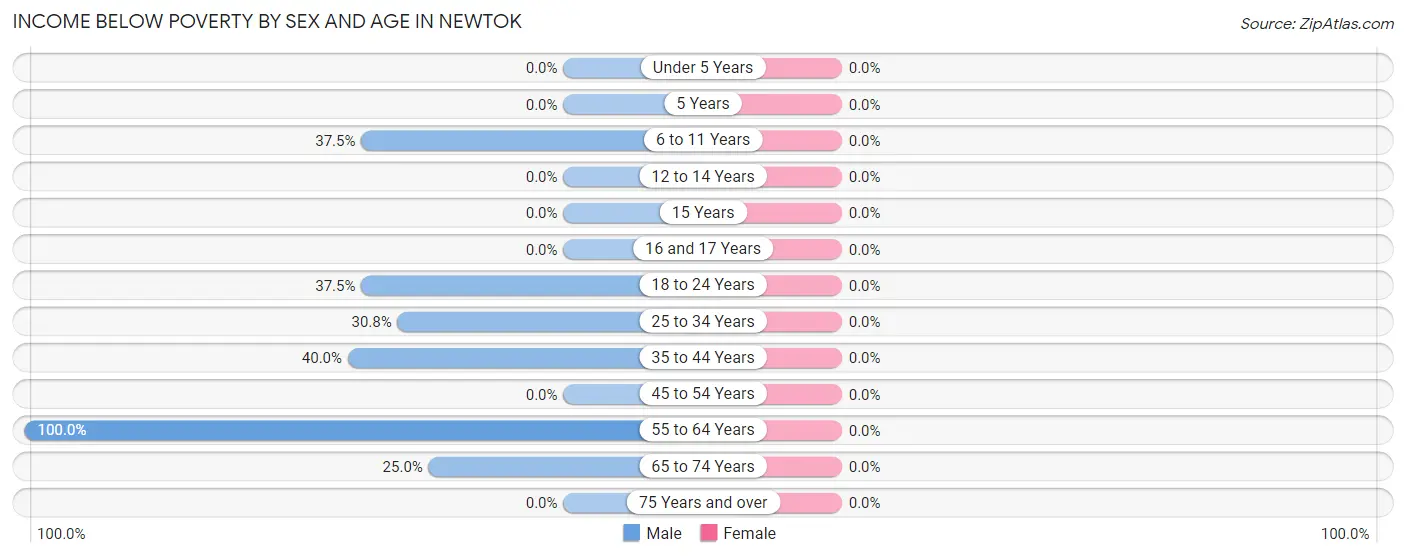
| Age Bracket | Male | Female |
| Under 5 Years | 0 (0.0%) | 0 (0.0%) |
| 5 Years | 0 (0.0%) | 0 (0.0%) |
| 6 to 11 Years | 3 (37.5%) | 0 (0.0%) |
| 12 to 14 Years | 0 (0.0%) | 0 (0.0%) |
| 15 Years | 0 (0.0%) | 0 (0.0%) |
| 16 and 17 Years | 0 (0.0%) | 0 (0.0%) |
| 18 to 24 Years | 3 (37.5%) | 0 (0.0%) |
| 25 to 34 Years | 4 (30.8%) | 0 (0.0%) |
| 35 to 44 Years | 2 (40.0%) | 0 (0.0%) |
| 45 to 54 Years | 0 (0.0%) | 0 (0.0%) |
| 55 to 64 Years | 3 (100.0%) | 0 (0.0%) |
| 65 to 74 Years | 2 (25.0%) | 0 (0.0%) |
| 75 Years and over | 0 (0.0%) | 0 (0.0%) |
| Total | 17 (32.1%) | 0 (0.0%) |
Income Above Poverty by Sex and Age in Newtok
According to the poverty statistics in Newtok, males aged under 5 years and females aged under 5 years are the age groups that are most secure financially, with 100.0% of males and 100.0% of females in these age groups living above the poverty line.
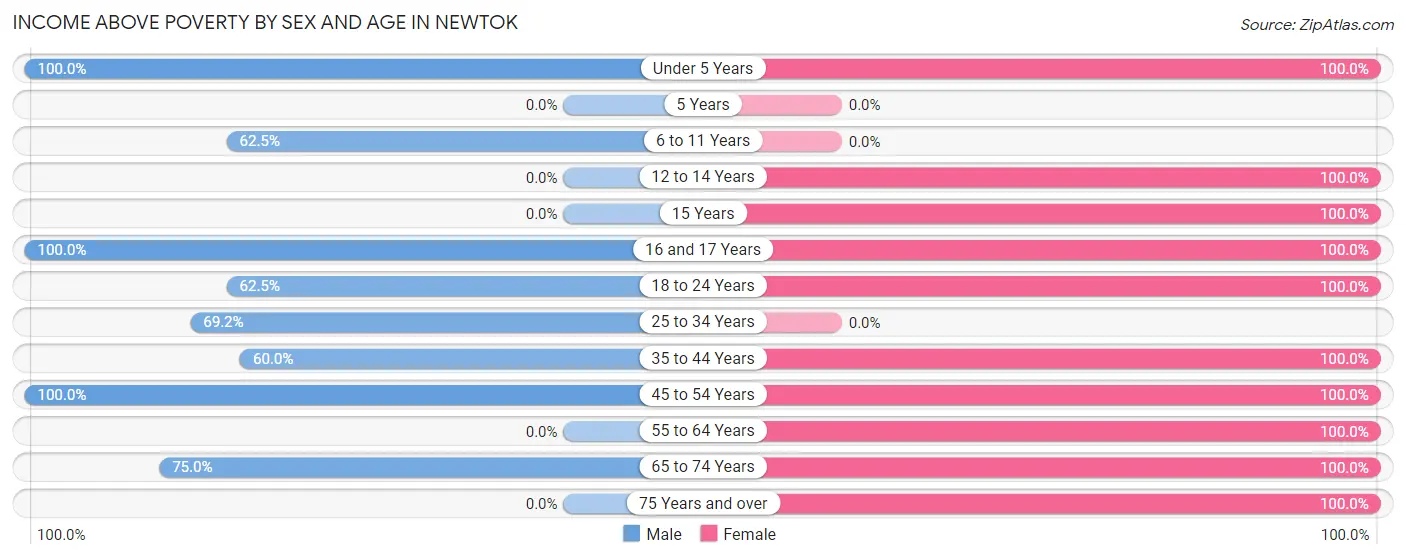
| Age Bracket | Male | Female |
| Under 5 Years | 3 (100.0%) | 4 (100.0%) |
| 5 Years | 0 (0.0%) | 0 (0.0%) |
| 6 to 11 Years | 5 (62.5%) | 0 (0.0%) |
| 12 to 14 Years | 0 (0.0%) | 3 (100.0%) |
| 15 Years | 0 (0.0%) | 4 (100.0%) |
| 16 and 17 Years | 3 (100.0%) | 4 (100.0%) |
| 18 to 24 Years | 5 (62.5%) | 8 (100.0%) |
| 25 to 34 Years | 9 (69.2%) | 0 (0.0%) |
| 35 to 44 Years | 3 (60.0%) | 8 (100.0%) |
| 45 to 54 Years | 2 (100.0%) | 5 (100.0%) |
| 55 to 64 Years | 0 (0.0%) | 2 (100.0%) |
| 65 to 74 Years | 6 (75.0%) | 2 (100.0%) |
| 75 Years and over | 0 (0.0%) | 3 (100.0%) |
| Total | 36 (67.9%) | 43 (100.0%) |
Income Below Poverty Among Married-Couple Families in Newtok
| Children | Above Poverty | Below Poverty |
| No Children | 0 (0.0%) | 0 (0.0%) |
| 1 or 2 Children | 0 (0.0%) | 0 (0.0%) |
| 3 or 4 Children | 4 (100.0%) | 0 (0.0%) |
| 5 or more Children | 0 (0.0%) | 0 (0.0%) |
| Total | 4 (100.0%) | 0 (0.0%) |
Income Below Poverty Among Single-Parent Households in Newtok
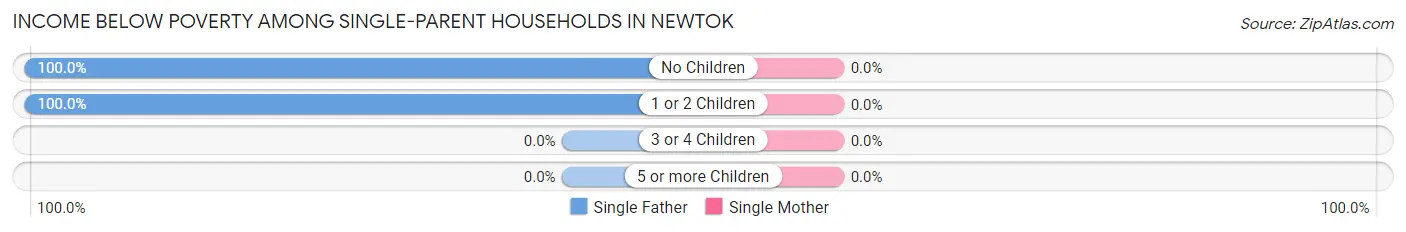
| Children | Single Father | Single Mother |
| No Children | 2 (100.0%) | 0 (0.0%) |
| 1 or 2 Children | 2 (100.0%) | 0 (0.0%) |
| 3 or 4 Children | 0 (0.0%) | 0 (0.0%) |
| 5 or more Children | 0 (0.0%) | 0 (0.0%) |
| Total | 4 (100.0%) | 0 (0.0%) |
Income Below Poverty Among Married-Couple vs Single-Parent Households in Newtok
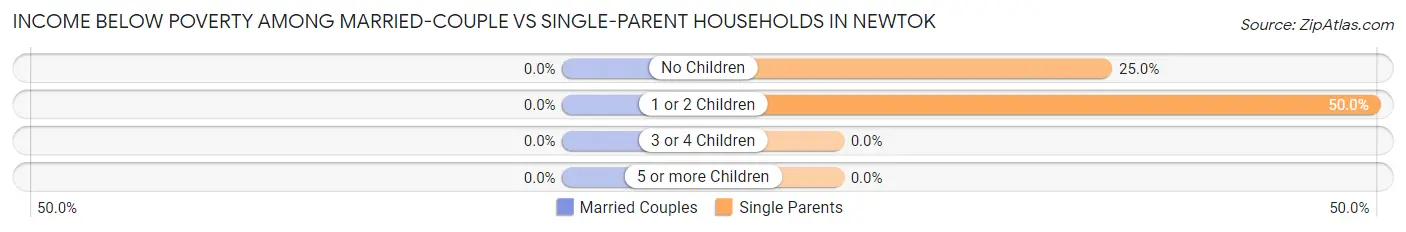
| Children | Married-Couple Families | Single-Parent Households |
| No Children | 0 (0.0%) | 2 (25.0%) |
| 1 or 2 Children | 0 (0.0%) | 2 (50.0%) |
| 3 or 4 Children | 0 (0.0%) | 0 (0.0%) |
| 5 or more Children | 0 (0.0%) | 0 (0.0%) |
| Total | 0 (0.0%) | 4 (33.3%) |
Race in Newtok
The most populous races in Newtok are Native / Alaskan (92 | 95.8%), and Two or more Races (4 | 4.2%).
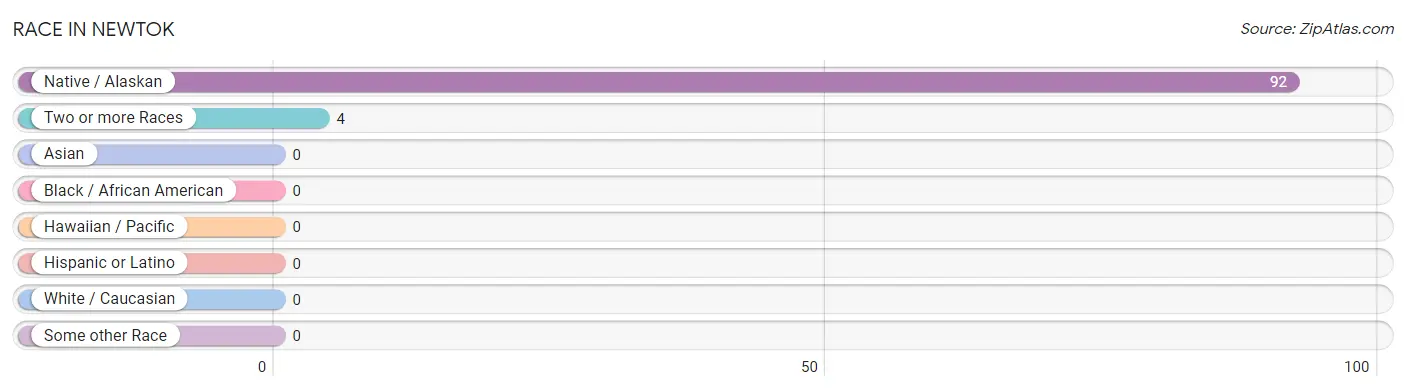
| Race | # Population | % Population |
| Asian | 0 | 0.0% |
| Black / African American | 0 | 0.0% |
| Hawaiian / Pacific | 0 | 0.0% |
| Hispanic or Latino | 0 | 0.0% |
| Native / Alaskan | 92 | 95.8% |
| White / Caucasian | 0 | 0.0% |
| Two or more Races | 4 | 4.2% |
| Some other Race | 0 | 0.0% |
| Total | 96 | 100.0% |
Ancestry in Newtok
The most populous ancestries reported in Newtok are , and Yup'ik (96 | 100.0%), together accounting for 100.0% of all Newtok residents.

| Ancestry | # Population | % Population |
| Yup'ik | 96 | 100.0% | View All 1 Rows |
Immigrants in Newtok

| Immigration Origin | # Population | % Population | View All 0 Rows |
Sex and Age in Newtok
Sex and Age in Newtok
The most populous age groups in Newtok are 30 to 34 Years (11 | 20.7%) for men and 15 to 19 Years (13 | 30.2%) for women.
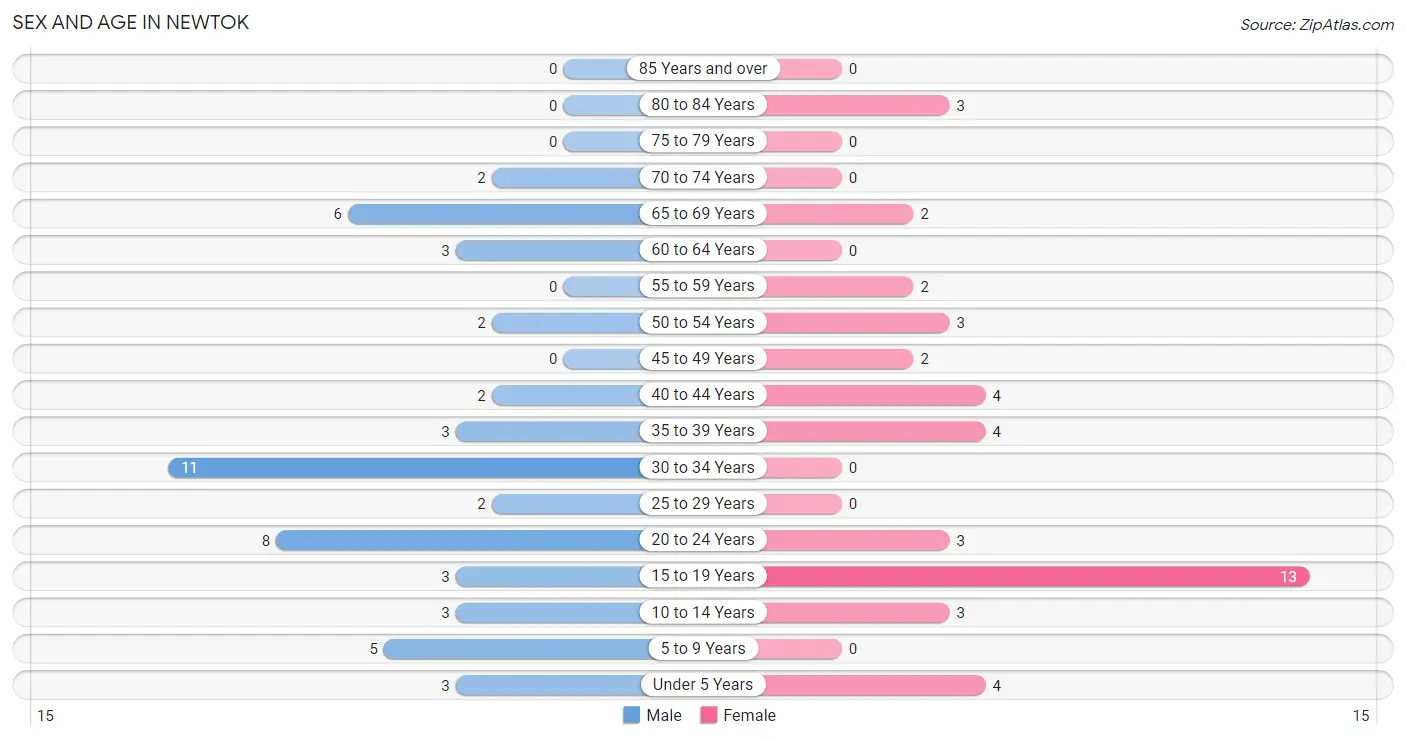
| Age Bracket | Male | Female |
| Under 5 Years | 3 (5.7%) | 4 (9.3%) |
| 5 to 9 Years | 5 (9.4%) | 0 (0.0%) |
| 10 to 14 Years | 3 (5.7%) | 3 (7.0%) |
| 15 to 19 Years | 3 (5.7%) | 13 (30.2%) |
| 20 to 24 Years | 8 (15.1%) | 3 (7.0%) |
| 25 to 29 Years | 2 (3.8%) | 0 (0.0%) |
| 30 to 34 Years | 11 (20.7%) | 0 (0.0%) |
| 35 to 39 Years | 3 (5.7%) | 4 (9.3%) |
| 40 to 44 Years | 2 (3.8%) | 4 (9.3%) |
| 45 to 49 Years | 0 (0.0%) | 2 (4.6%) |
| 50 to 54 Years | 2 (3.8%) | 3 (7.0%) |
| 55 to 59 Years | 0 (0.0%) | 2 (4.6%) |
| 60 to 64 Years | 3 (5.7%) | 0 (0.0%) |
| 65 to 69 Years | 6 (11.3%) | 2 (4.6%) |
| 70 to 74 Years | 2 (3.8%) | 0 (0.0%) |
| 75 to 79 Years | 0 (0.0%) | 0 (0.0%) |
| 80 to 84 Years | 0 (0.0%) | 3 (7.0%) |
| 85 Years and over | 0 (0.0%) | 0 (0.0%) |
| Total | 53 (100.0%) | 43 (100.0%) |
Families and Households in Newtok
Median Family Size in Newtok
The median family size in Newtok is 5.19 persons per family, with married-couple families (4 | 25.0%) accounting for the largest median family size of 9.75 persons per family. On the other hand, single female/mother families (8 | 50.0%) represent the smallest median family size with 3.63 persons per family.
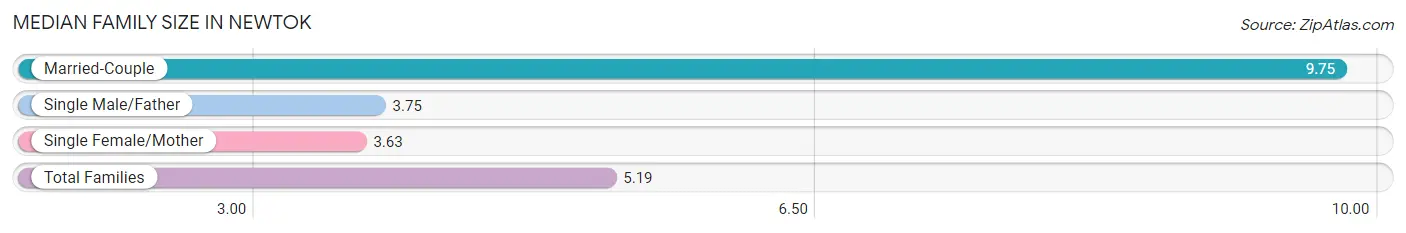
| Family Type | # Families | Family Size |
| Married-Couple | 4 (25.0%) | 9.75 |
| Single Male/Father | 4 (25.0%) | 3.75 |
| Single Female/Mother | 8 (50.0%) | 3.63 |
| Total Families | 16 (100.0%) | 5.19 |
Median Household Size in Newtok
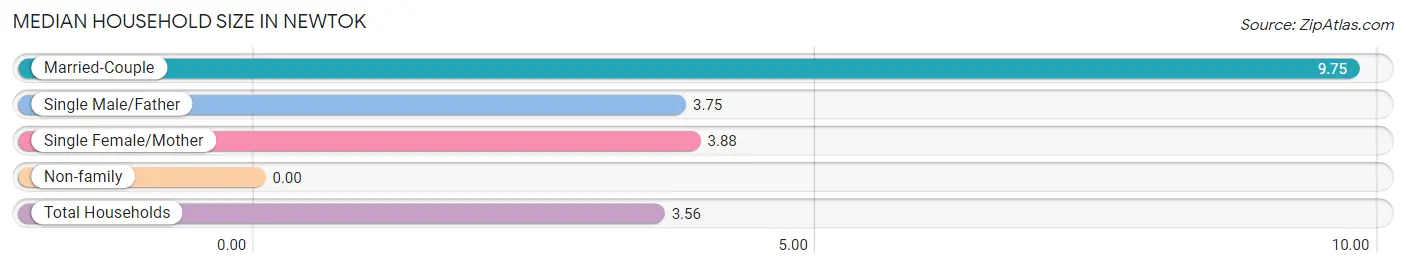
| Household Type | # Households | Household Size |
| Married-Couple | 4 (14.8%) | 9.75 |
| Single Male/Father | 4 (14.8%) | 3.75 |
| Single Female/Mother | 8 (29.6%) | 3.88 |
| Non-family | 11 (40.7%) | - |
| Total Households | 27 (100.0%) | 3.56 |
Household Size by Marriage Status in Newtok
Out of a total of 27 households in Newtok, 16 (59.3%) are family households, while 11 (40.7%) are nonfamily households. The most numerous type of family households are 4-person households, comprising 5, and the most common type of nonfamily households are 1-person households, comprising 11.
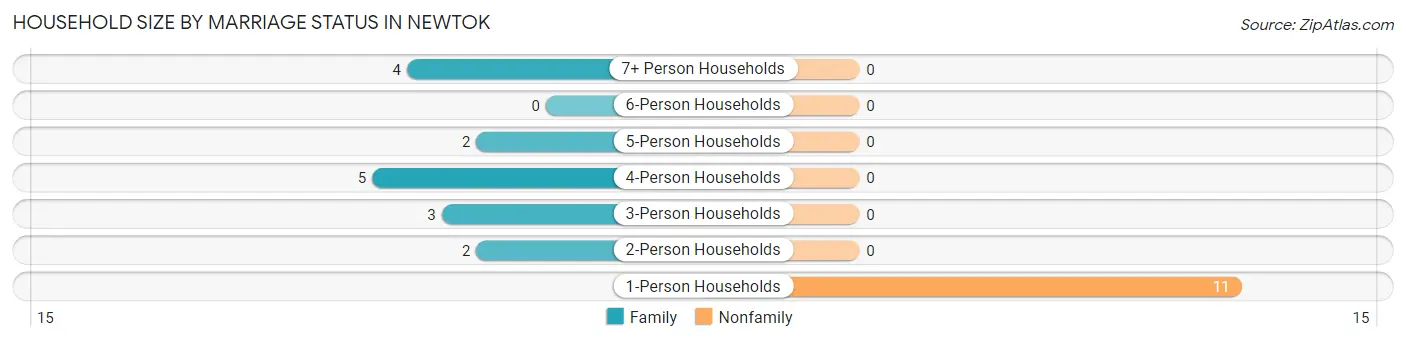
| Household Size | Family Households | Nonfamily Households |
| 1-Person Households | - | 11 (40.7%) |
| 2-Person Households | 2 (7.4%) | 0 (0.0%) |
| 3-Person Households | 3 (11.1%) | 0 (0.0%) |
| 4-Person Households | 5 (18.5%) | 0 (0.0%) |
| 5-Person Households | 2 (7.4%) | 0 (0.0%) |
| 6-Person Households | 0 (0.0%) | 0 (0.0%) |
| 7+ Person Households | 4 (14.8%) | 0 (0.0%) |
| Total | 16 (59.3%) | 11 (40.7%) |
Female Fertility in Newtok
Fertility by Age in Newtok
| Age Bracket | Women with Births | Births / 1,000 Women |
| 15 to 19 years | 0 (0.0%) | 0.0 |
| 20 to 34 years | 0 (0.0%) | 0.0 |
| 35 to 50 years | 0 (0.0%) | 0.0 |
| Total | 0 (0.0%) | 0.0 |
Fertility by Age by Marriage Status in Newtok
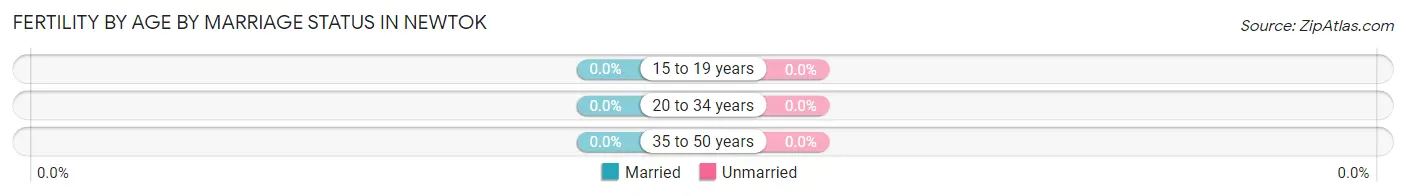
| Age Bracket | Married | Unmarried |
| 15 to 19 years | 0 (0.0%) | 0 (0.0%) |
| 20 to 34 years | 0 (0.0%) | 0 (0.0%) |
| 35 to 50 years | 0 (0.0%) | 0 (0.0%) |
| Total | 0 (0.0%) | 0 (0.0%) |
Fertility by Education in Newtok
| Educational Attainment | Women with Births | Births / 1,000 Women |
| Less than High School | 0 (0.0%) | 0.0 |
| High School Diploma | 0 (0.0%) | 0.0 |
| College or Associate's Degree | 0 (0.0%) | 0.0 |
| Bachelor's Degree | 0 (0.0%) | 0.0 |
| Graduate Degree | 0 (0.0%) | 0.0 |
| Total | 0 (0.0%) | 0.0 |
Fertility by Education by Marriage Status in Newtok
| Educational Attainment | Married | Unmarried |
| Less than High School | 0 (0.0%) | 0 (0.0%) |
| High School Diploma | 0 (0.0%) | 0 (0.0%) |
| College or Associate's Degree | 0 (0.0%) | 0 (0.0%) |
| Bachelor's Degree | 0 (0.0%) | 0 (0.0%) |
| Graduate Degree | 0 (0.0%) | 0 (0.0%) |
| Total | 0 (0.0%) | 0 (0.0%) |
Employment Characteristics in Newtok
Employment by Class of Employer in Newtok
Among the 29 employed individuals in Newtok, state government employees (14 | 48.3%), private company employees (8 | 27.6%), and local government employees (7 | 24.1%) make up the most common classes of employment.
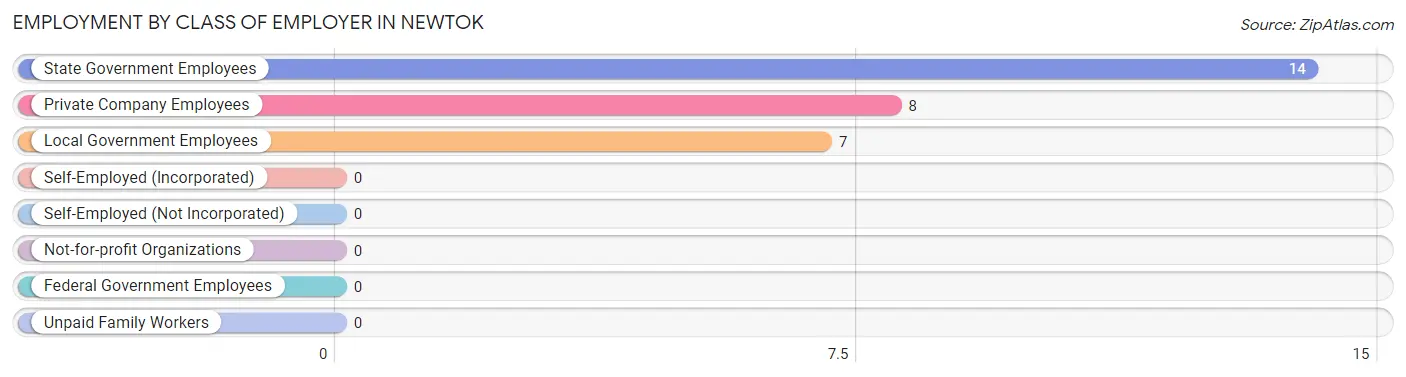
| Employer Class | # Employees | % Employees |
| Private Company Employees | 8 | 27.6% |
| Self-Employed (Incorporated) | 0 | 0.0% |
| Self-Employed (Not Incorporated) | 0 | 0.0% |
| Not-for-profit Organizations | 0 | 0.0% |
| Local Government Employees | 7 | 24.1% |
| State Government Employees | 14 | 48.3% |
| Federal Government Employees | 0 | 0.0% |
| Unpaid Family Workers | 0 | 0.0% |
| Total | 29 | 100.0% |
Employment Status by Age in Newtok
According to the labor force statistics for Newtok, out of the total population over 16 years of age (74), 52.7% or 39 individuals are in the labor force, with 25.6% or 10 of them unemployed. The age group with the highest labor force participation rate is 25 to 29 years, with 100.0% or 2 individuals in the labor force. Within the labor force, the 16 to 19 years age range has the highest percentage of unemployed individuals, with 100.0% or 2 of them being unemployed.
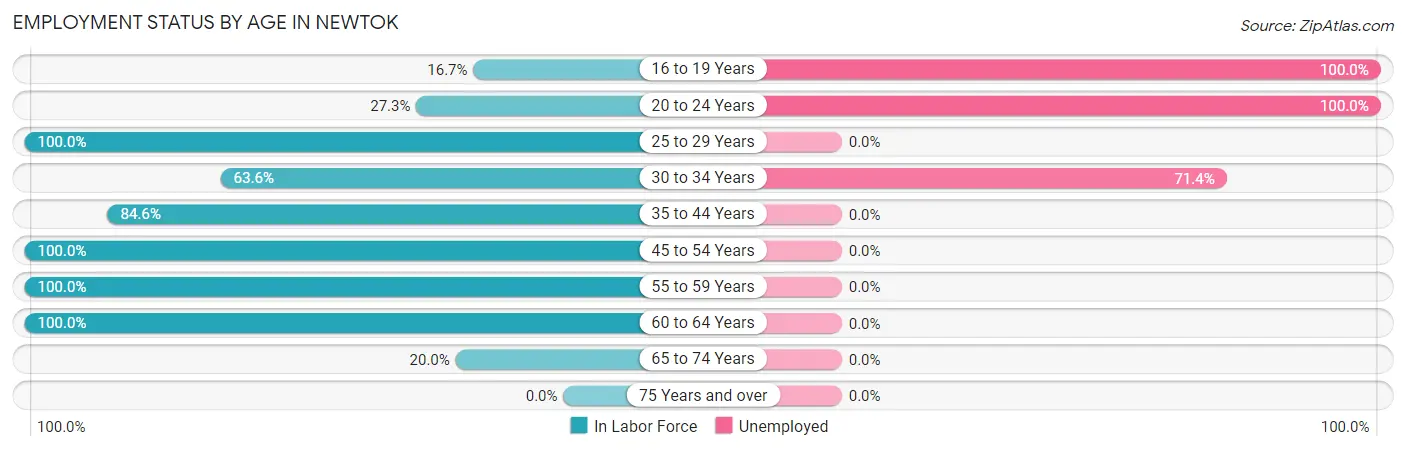
| Age Bracket | In Labor Force | Unemployed |
| 16 to 19 Years | 2 (16.7%) | 2 (100.0%) |
| 20 to 24 Years | 3 (27.3%) | 3 (100.0%) |
| 25 to 29 Years | 2 (100.0%) | 0 (0.0%) |
| 30 to 34 Years | 7 (63.6%) | 5 (71.4%) |
| 35 to 44 Years | 11 (84.6%) | 0 (0.0%) |
| 45 to 54 Years | 7 (100.0%) | 0 (0.0%) |
| 55 to 59 Years | 2 (100.0%) | 0 (0.0%) |
| 60 to 64 Years | 3 (100.0%) | 0 (0.0%) |
| 65 to 74 Years | 2 (20.0%) | 0 (0.0%) |
| 75 Years and over | 0 (0.0%) | 0 (0.0%) |
| Total | 39 (52.7%) | 10 (25.6%) |
Employment Status by Educational Attainment in Newtok
According to labor force statistics for Newtok, 84.2% of individuals (32) out of the total population between 25 and 64 years of age (38) are in the labor force, with 15.6% or 5 of them being unemployed. The group with the highest labor force participation rate are those with the educational attainment of less than high school, with 100.0% or 5 individuals in the labor force. Within the labor force, individuals with less than high school education have the highest percentage of unemployment, with 100.0% or 5 of them being unemployed.
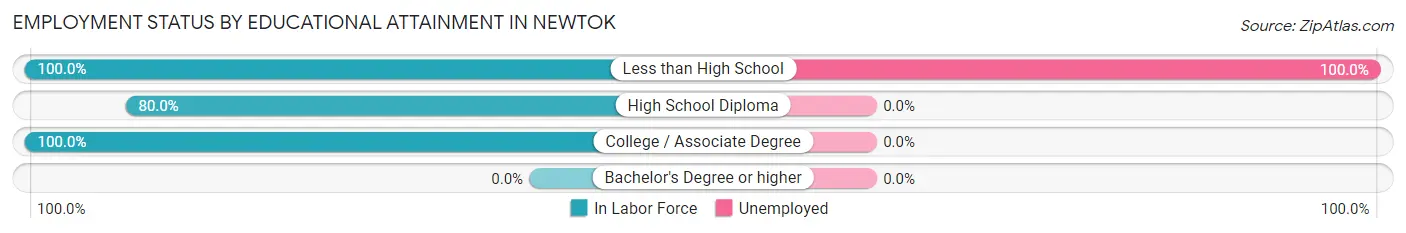
| Educational Attainment | In Labor Force | Unemployed |
| Less than High School | 5 (100.0%) | 5 (100.0%) |
| High School Diploma | 24 (80.0%) | 0 (0.0%) |
| College / Associate Degree | 3 (100.0%) | 0 (0.0%) |
| Bachelor's Degree or higher | 0 (0.0%) | 0 (0.0%) |
| Total | 32 (84.2%) | 6 (15.6%) |
Employment Occupations by Sex in Newtok
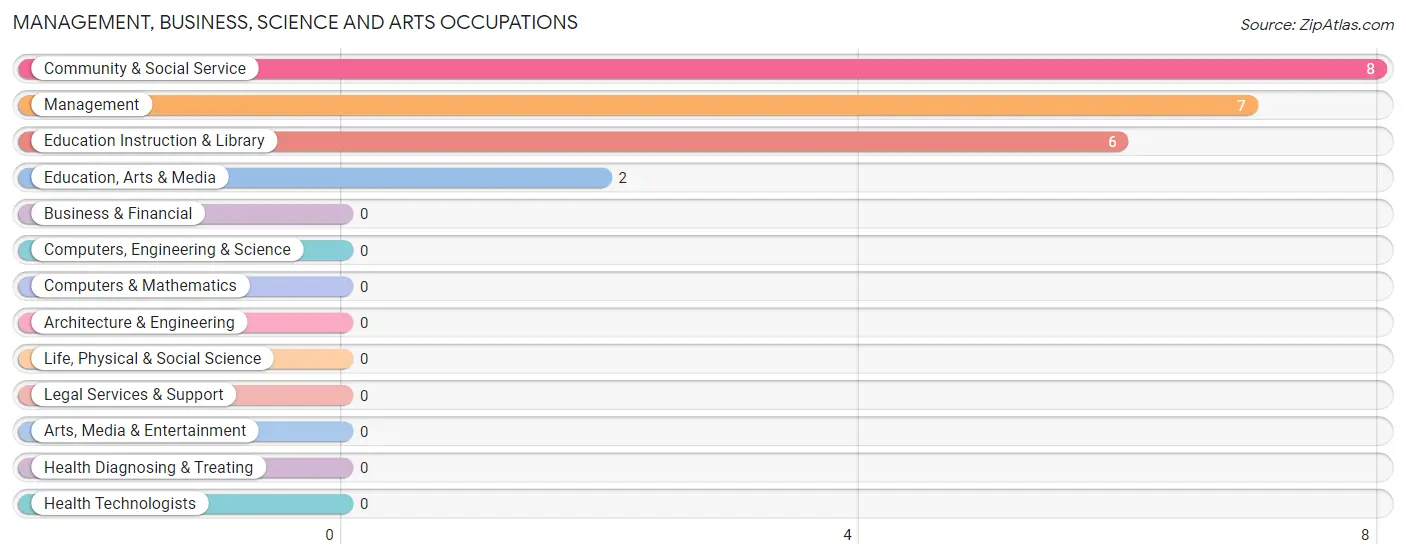
Management, Business, Science and Arts Occupations
The most common Management, Business, Science and Arts occupations in Newtok are Community & Social Service (8 | 27.6%), Management (7 | 24.1%), Education Instruction & Library (6 | 20.7%), and Education, Arts & Media (2 | 6.9%).
Management, Business, Science and Arts Occupations by Sex
Within the Management, Business, Science and Arts occupations in Newtok, the most male-oriented occupations are Education, Arts & Media (100.0%), Community & Social Service (50.0%), and Management (42.9%), while the most female-oriented occupations are Education Instruction & Library (66.7%), Management (57.1%), and Community & Social Service (50.0%).
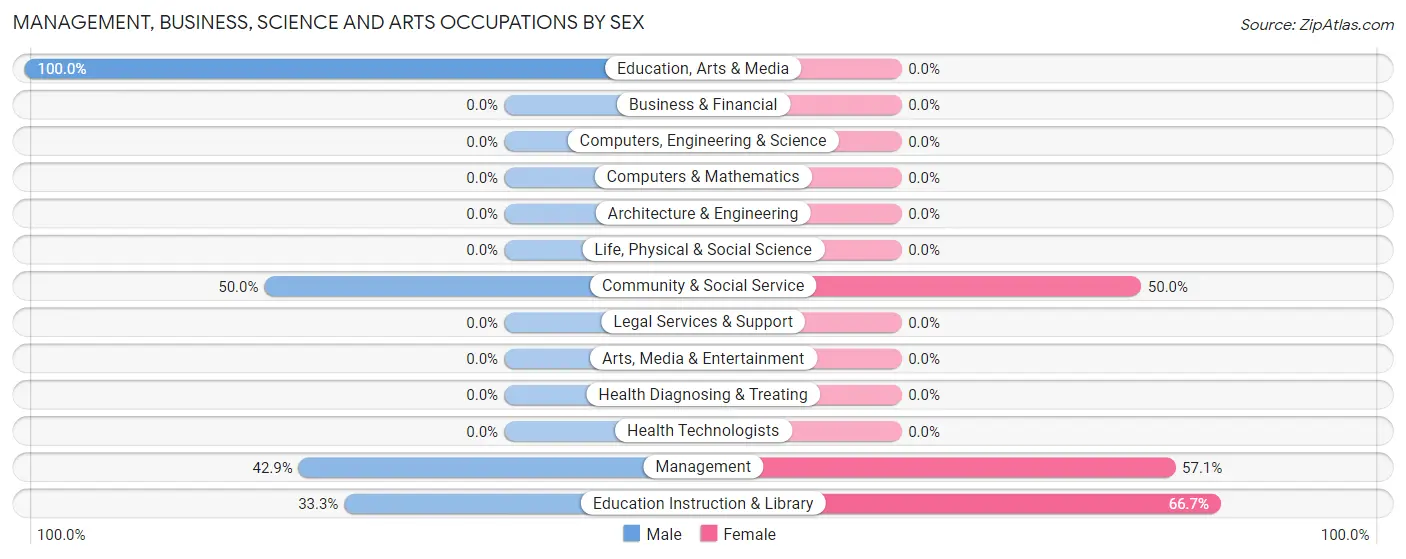
| Occupation | Male | Female |
| Management | 3 (42.9%) | 4 (57.1%) |
| Business & Financial | 0 (0.0%) | 0 (0.0%) |
| Computers, Engineering & Science | 0 (0.0%) | 0 (0.0%) |
| Computers & Mathematics | 0 (0.0%) | 0 (0.0%) |
| Architecture & Engineering | 0 (0.0%) | 0 (0.0%) |
| Life, Physical & Social Science | 0 (0.0%) | 0 (0.0%) |
| Community & Social Service | 4 (50.0%) | 4 (50.0%) |
| Education, Arts & Media | 2 (100.0%) | 0 (0.0%) |
| Legal Services & Support | 0 (0.0%) | 0 (0.0%) |
| Education Instruction & Library | 2 (33.3%) | 4 (66.7%) |
| Arts, Media & Entertainment | 0 (0.0%) | 0 (0.0%) |
| Health Diagnosing & Treating | 0 (0.0%) | 0 (0.0%) |
| Health Technologists | 0 (0.0%) | 0 (0.0%) |
| Total (Category) | 7 (46.7%) | 8 (53.3%) |
| Total (Overall) | 14 (48.3%) | 15 (51.7%) |
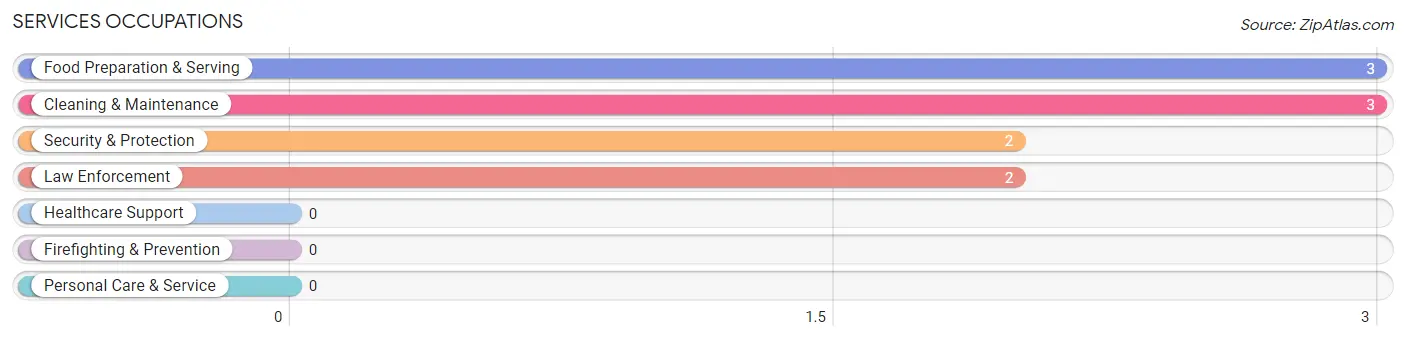
Services Occupations
The most common Services occupations in Newtok are Food Preparation & Serving (3 | 10.3%), Cleaning & Maintenance (3 | 10.3%), Security & Protection (2 | 6.9%), and Law Enforcement (2 | 6.9%).
Services Occupations by Sex
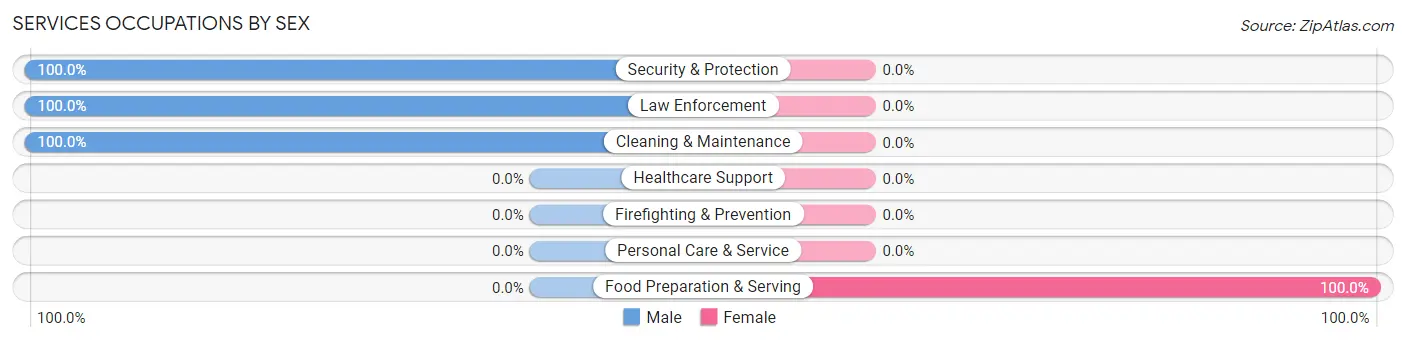
| Occupation | Male | Female |
| Healthcare Support | 0 (0.0%) | 0 (0.0%) |
| Security & Protection | 2 (100.0%) | 0 (0.0%) |
| Firefighting & Prevention | 0 (0.0%) | 0 (0.0%) |
| Law Enforcement | 2 (100.0%) | 0 (0.0%) |
| Food Preparation & Serving | 0 (0.0%) | 3 (100.0%) |
| Cleaning & Maintenance | 3 (100.0%) | 0 (0.0%) |
| Personal Care & Service | 0 (0.0%) | 0 (0.0%) |
| Total (Category) | 5 (62.5%) | 3 (37.5%) |
| Total (Overall) | 14 (48.3%) | 15 (51.7%) |
Sales and Office Occupations
The most common Sales and Office occupations in Newtok are , and Sales & Related (6 | 20.7%).
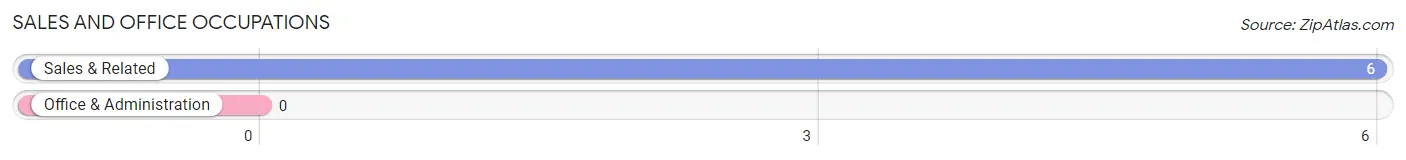
Sales and Office Occupations by Sex
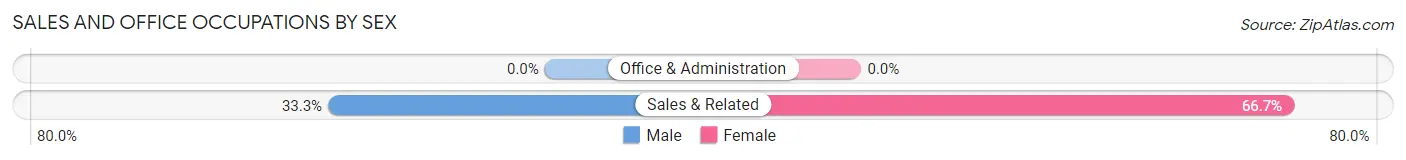
| Occupation | Male | Female |
| Sales & Related | 2 (33.3%) | 4 (66.7%) |
| Office & Administration | 0 (0.0%) | 0 (0.0%) |
| Total (Category) | 2 (33.3%) | 4 (66.7%) |
| Total (Overall) | 14 (48.3%) | 15 (51.7%) |
Natural Resources, Construction and Maintenance Occupations
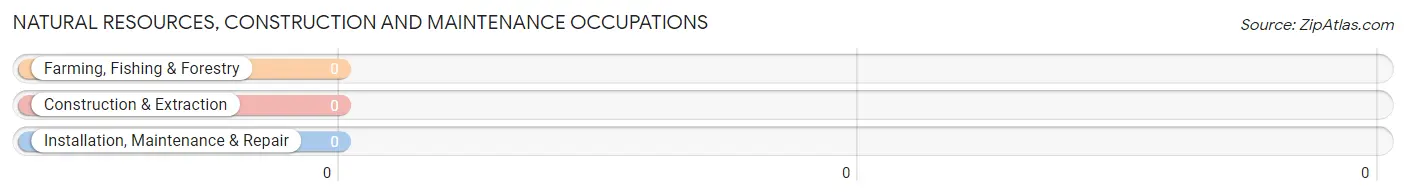
Natural Resources, Construction and Maintenance Occupations by Sex
| Occupation | Male | Female |
| Farming, Fishing & Forestry | 0 (0.0%) | 0 (0.0%) |
| Construction & Extraction | 0 (0.0%) | 0 (0.0%) |
| Installation, Maintenance & Repair | 0 (0.0%) | 0 (0.0%) |
| Total (Category) | 0 (0.0%) | 0 (0.0%) |
| Total (Overall) | 14 (48.3%) | 15 (51.7%) |
Production, Transportation and Moving Occupations
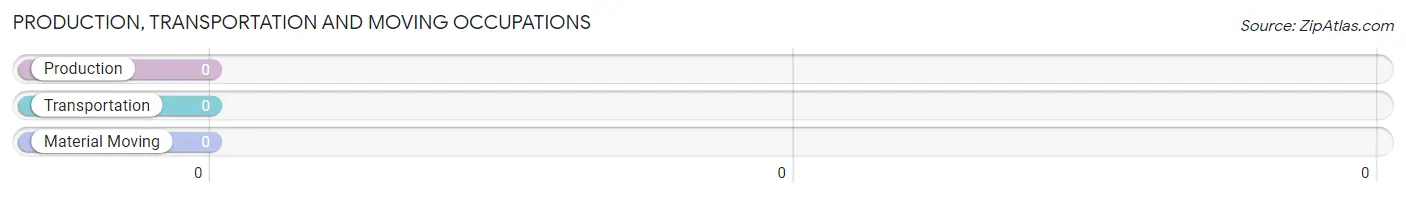
Production, Transportation and Moving Occupations by Sex
| Occupation | Male | Female |
| Production | 0 (0.0%) | 0 (0.0%) |
| Transportation | 0 (0.0%) | 0 (0.0%) |
| Material Moving | 0 (0.0%) | 0 (0.0%) |
| Total (Category) | 0 (0.0%) | 0 (0.0%) |
| Total (Overall) | 14 (48.3%) | 15 (51.7%) |
Employment Industries by Sex in Newtok
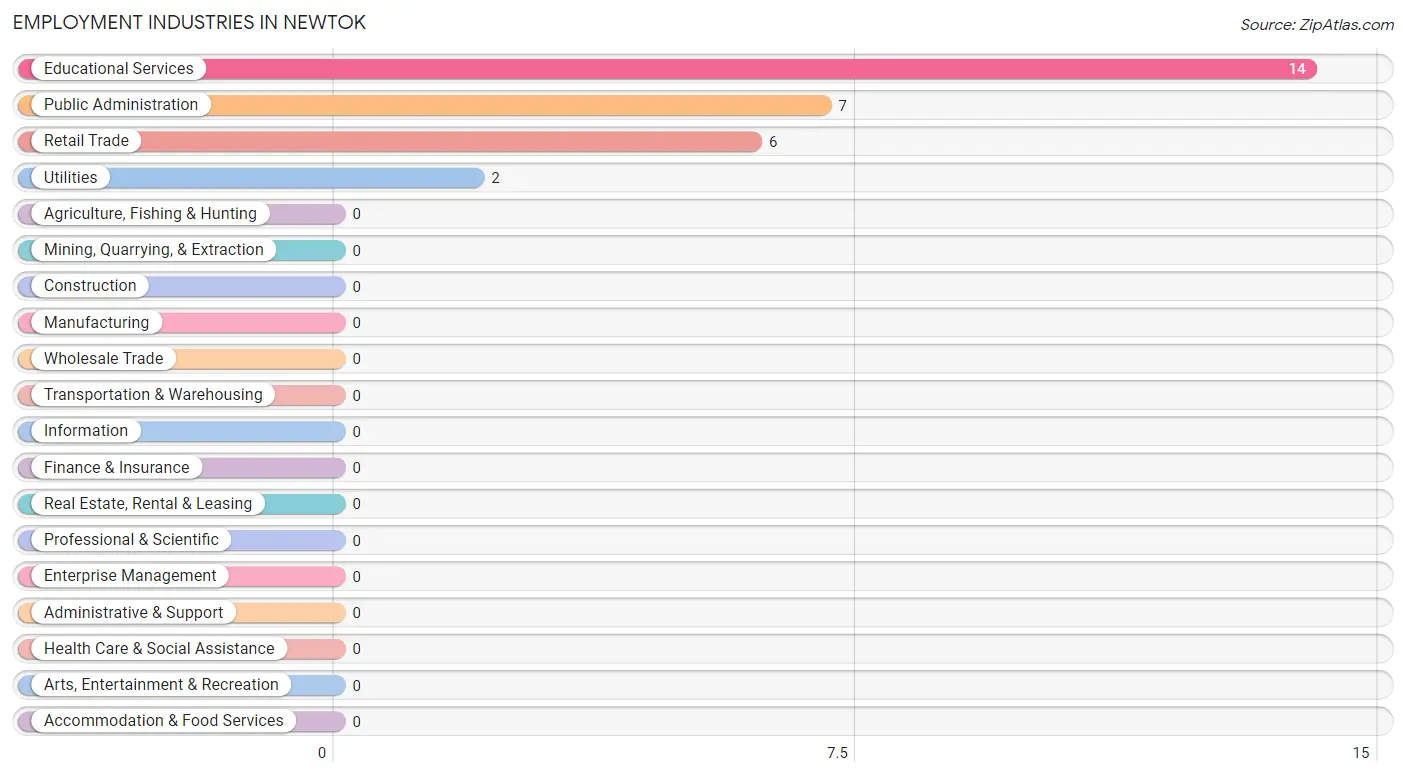
Employment Industries in Newtok
The major employment industries in Newtok include Educational Services (14 | 48.3%), Public Administration (7 | 24.1%), Retail Trade (6 | 20.7%), and Utilities (2 | 6.9%).
Employment Industries by Sex in Newtok
The Newtok industries that see more men than women are Public Administration (71.4%), Educational Services (50.0%), and Retail Trade (33.3%), whereas the industries that tend to have a higher number of women are Utilities (100.0%), Retail Trade (66.7%), and Educational Services (50.0%).
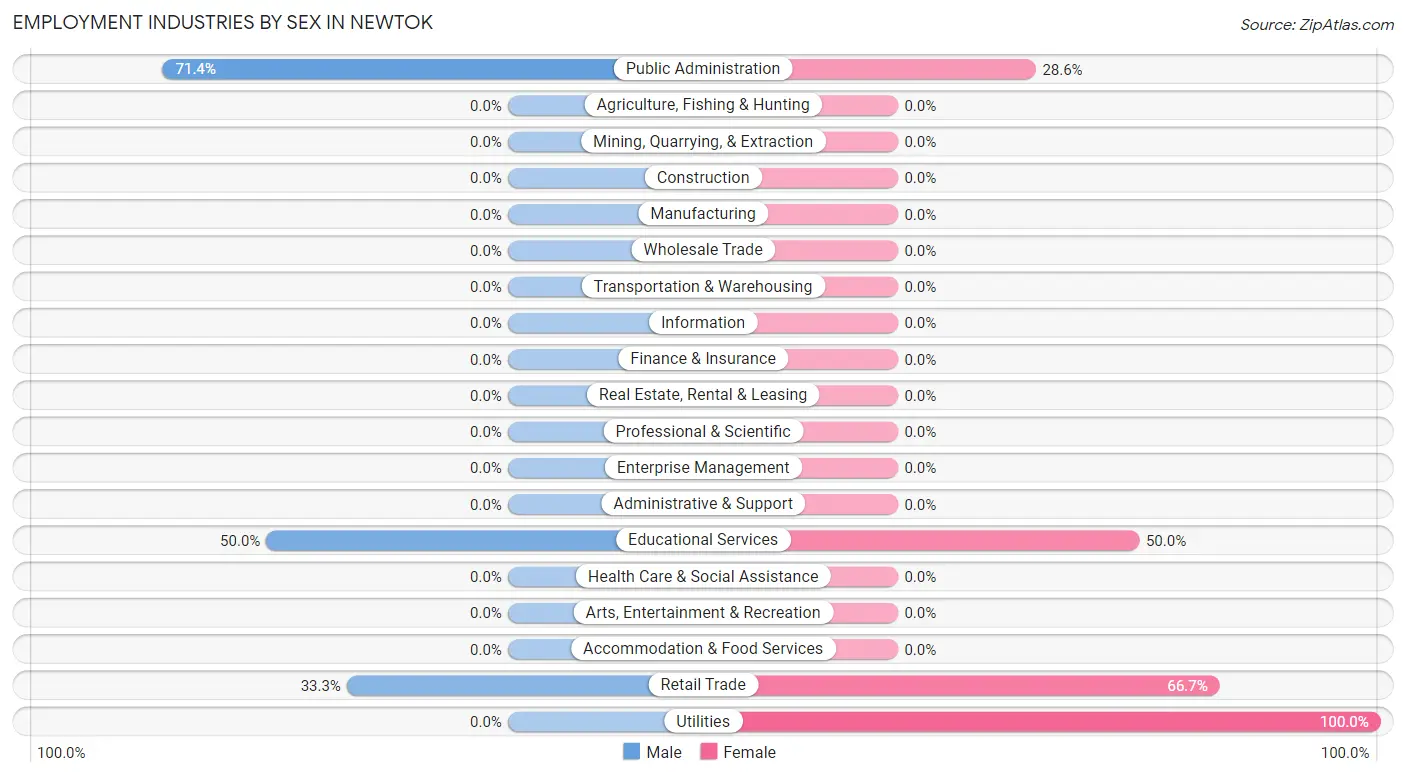
| Industry | Male | Female |
| Agriculture, Fishing & Hunting | 0 (0.0%) | 0 (0.0%) |
| Mining, Quarrying, & Extraction | 0 (0.0%) | 0 (0.0%) |
| Construction | 0 (0.0%) | 0 (0.0%) |
| Manufacturing | 0 (0.0%) | 0 (0.0%) |
| Wholesale Trade | 0 (0.0%) | 0 (0.0%) |
| Retail Trade | 2 (33.3%) | 4 (66.7%) |
| Transportation & Warehousing | 0 (0.0%) | 0 (0.0%) |
| Utilities | 0 (0.0%) | 2 (100.0%) |
| Information | 0 (0.0%) | 0 (0.0%) |
| Finance & Insurance | 0 (0.0%) | 0 (0.0%) |
| Real Estate, Rental & Leasing | 0 (0.0%) | 0 (0.0%) |
| Professional & Scientific | 0 (0.0%) | 0 (0.0%) |
| Enterprise Management | 0 (0.0%) | 0 (0.0%) |
| Administrative & Support | 0 (0.0%) | 0 (0.0%) |
| Educational Services | 7 (50.0%) | 7 (50.0%) |
| Health Care & Social Assistance | 0 (0.0%) | 0 (0.0%) |
| Arts, Entertainment & Recreation | 0 (0.0%) | 0 (0.0%) |
| Accommodation & Food Services | 0 (0.0%) | 0 (0.0%) |
| Public Administration | 5 (71.4%) | 2 (28.6%) |
| Total | 14 (48.3%) | 15 (51.7%) |
Education in Newtok
School Enrollment in Newtok
The most common levels of schooling among the 24 students in Newtok are high school (12 | 50.0%), middle school (7 | 29.2%), and elementary school (3 | 12.5%).
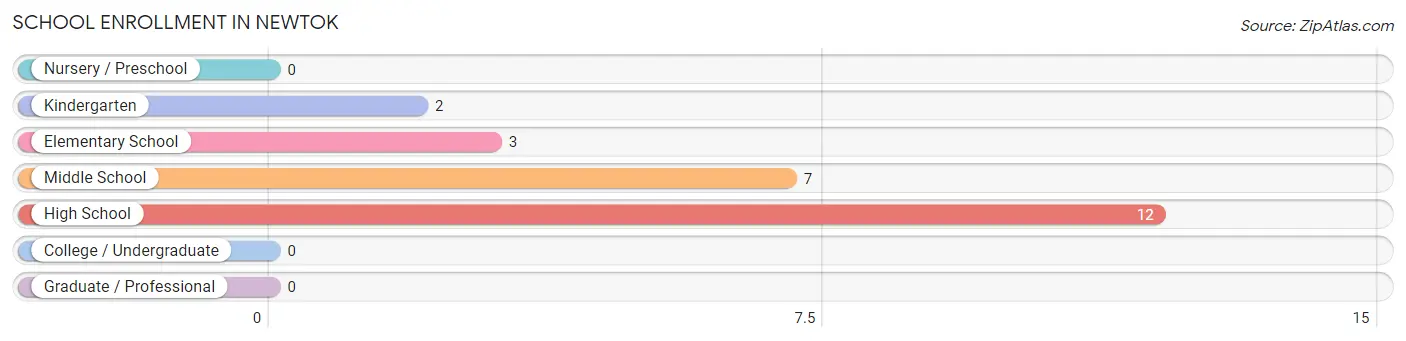
| School Level | # Students | % Students |
| Nursery / Preschool | 0 | 0.0% |
| Kindergarten | 2 | 8.3% |
| Elementary School | 3 | 12.5% |
| Middle School | 7 | 29.2% |
| High School | 12 | 50.0% |
| College / Undergraduate | 0 | 0.0% |
| Graduate / Professional | 0 | 0.0% |
| Total | 24 | 100.0% |
School Enrollment by Age by Funding Source in Newtok
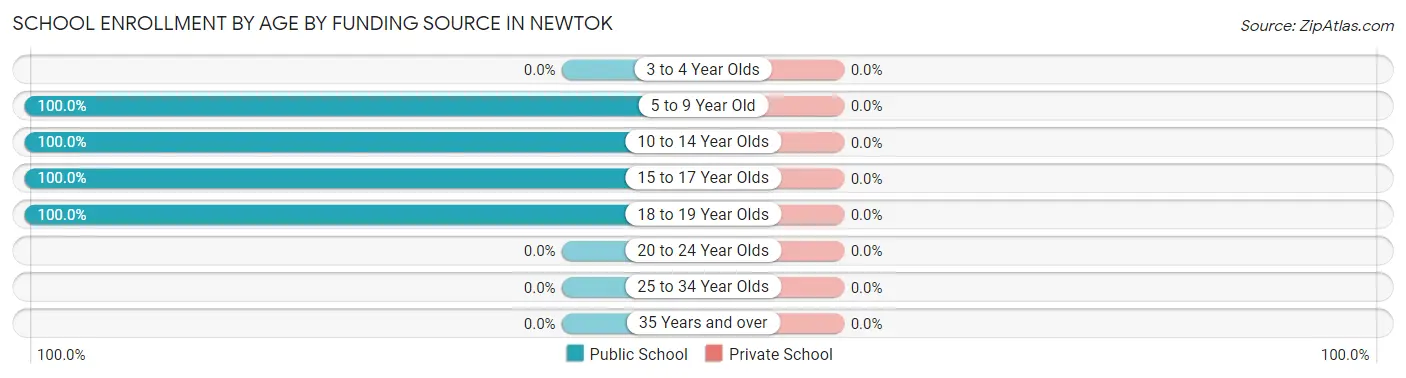
| Age Bracket | Public School | Private School |
| 3 to 4 Year Olds | 0 (0.0%) | 0 (0.0%) |
| 5 to 9 Year Old | 2 (100.0%) | 0 (0.0%) |
| 10 to 14 Year Olds | 6 (100.0%) | 0 (0.0%) |
| 15 to 17 Year Olds | 11 (100.0%) | 0 (0.0%) |
| 18 to 19 Year Olds | 5 (100.0%) | 0 (0.0%) |
| 20 to 24 Year Olds | 0 (0.0%) | 0 (0.0%) |
| 25 to 34 Year Olds | 0 (0.0%) | 0 (0.0%) |
| 35 Years and over | 0 (0.0%) | 0 (0.0%) |
| Total | 24 (100.0%) | 0 (0.0%) |
Educational Attainment by Field of Study in Newtok
| Field of Study | # Graduates | % Graduates |
| Computers & Mathematics | 0 | 0.0% |
| Bio, Nature & Agricultural | 0 | 0.0% |
| Physical & Health Sciences | 0 | 0.0% |
| Psychology | 0 | 0.0% |
| Social Sciences | 0 | 0.0% |
| Engineering | 0 | 0.0% |
| Multidisciplinary Studies | 0 | 0.0% |
| Science & Technology | 0 | 0.0% |
| Business | 0 | 0.0% |
| Education | 0 | 0.0% |
| Literature & Languages | 0 | 0.0% |
| Liberal Arts & History | 0 | 0.0% |
| Visual & Performing Arts | 0 | 0.0% |
| Communications | 0 | 0.0% |
| Arts & Humanities | 0 | 0.0% |
| Total | 0 | 0.0% |
Transportation & Commute in Newtok
Vehicle Availability by Sex in Newtok
The most prevalent vehicle ownership categories in Newtok are males with no vehicle (14, accounting for 100.0%) and females with no vehicle (15, making up 93.3%).
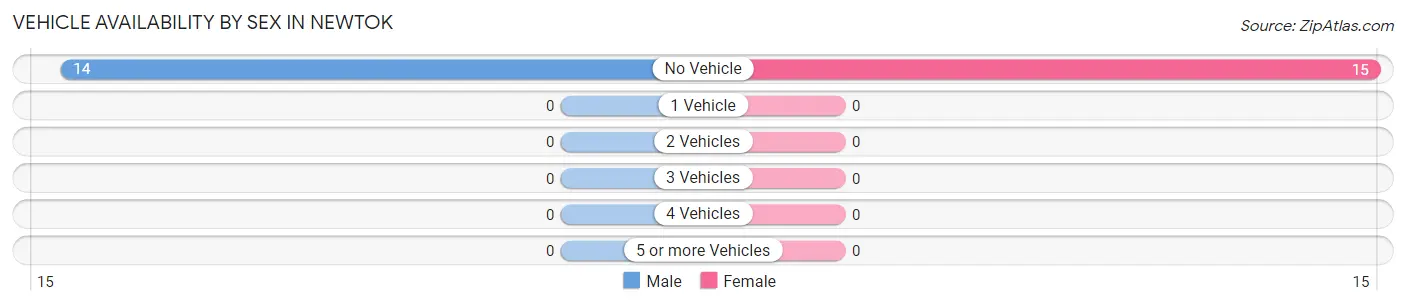
| Vehicles Available | Male | Female |
| No Vehicle | 14 (100.0%) | 15 (100.0%) |
| 1 Vehicle | 0 (0.0%) | 0 (0.0%) |
| 2 Vehicles | 0 (0.0%) | 0 (0.0%) |
| 3 Vehicles | 0 (0.0%) | 0 (0.0%) |
| 4 Vehicles | 0 (0.0%) | 0 (0.0%) |
| 5 or more Vehicles | 0 (0.0%) | 0 (0.0%) |
| Total | 14 (100.0%) | 15 (100.0%) |
Commute Time in Newtok
The most frequently occuring commute durations in Newtok are 5 to 9 minutes (13 commuters, 44.8%), less than 5 minutes (10 commuters, 34.5%), and 10 to 14 minutes (4 commuters, 13.8%).
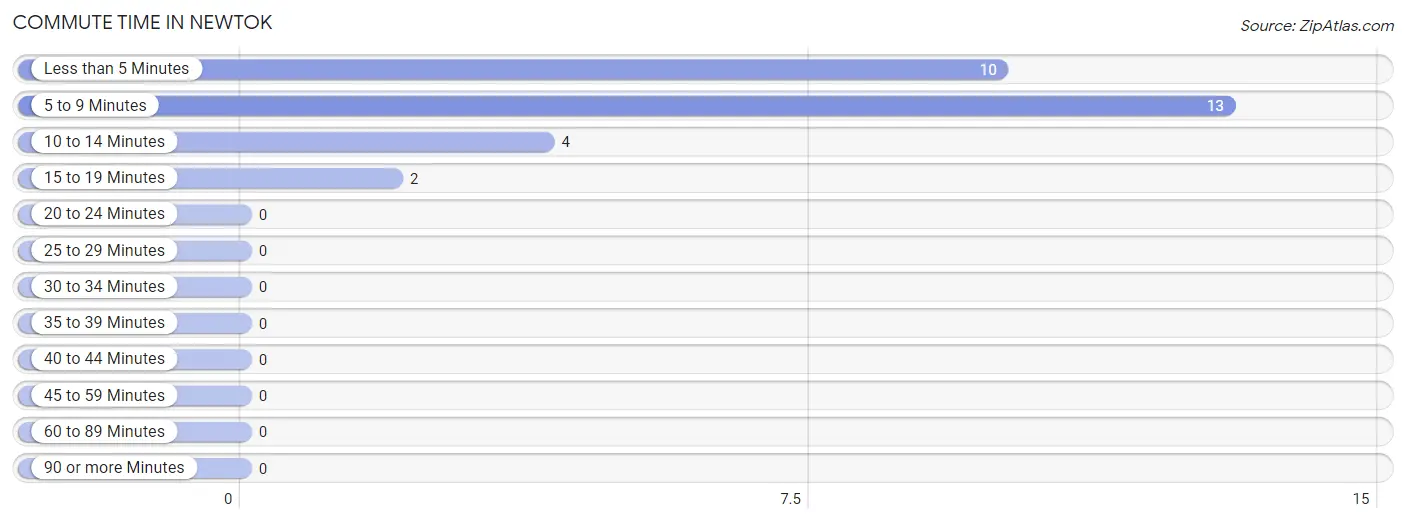
| Commute Time | # Commuters | % Commuters |
| Less than 5 Minutes | 10 | 34.5% |
| 5 to 9 Minutes | 13 | 44.8% |
| 10 to 14 Minutes | 4 | 13.8% |
| 15 to 19 Minutes | 2 | 6.9% |
| 20 to 24 Minutes | 0 | 0.0% |
| 25 to 29 Minutes | 0 | 0.0% |
| 30 to 34 Minutes | 0 | 0.0% |
| 35 to 39 Minutes | 0 | 0.0% |
| 40 to 44 Minutes | 0 | 0.0% |
| 45 to 59 Minutes | 0 | 0.0% |
| 60 to 89 Minutes | 0 | 0.0% |
| 90 or more Minutes | 0 | 0.0% |
Commute Time by Sex in Newtok
The most common commute times in Newtok are 5 to 9 minutes (6 commuters, 42.9%) for males and 5 to 9 minutes (7 commuters, 46.7%) for females.
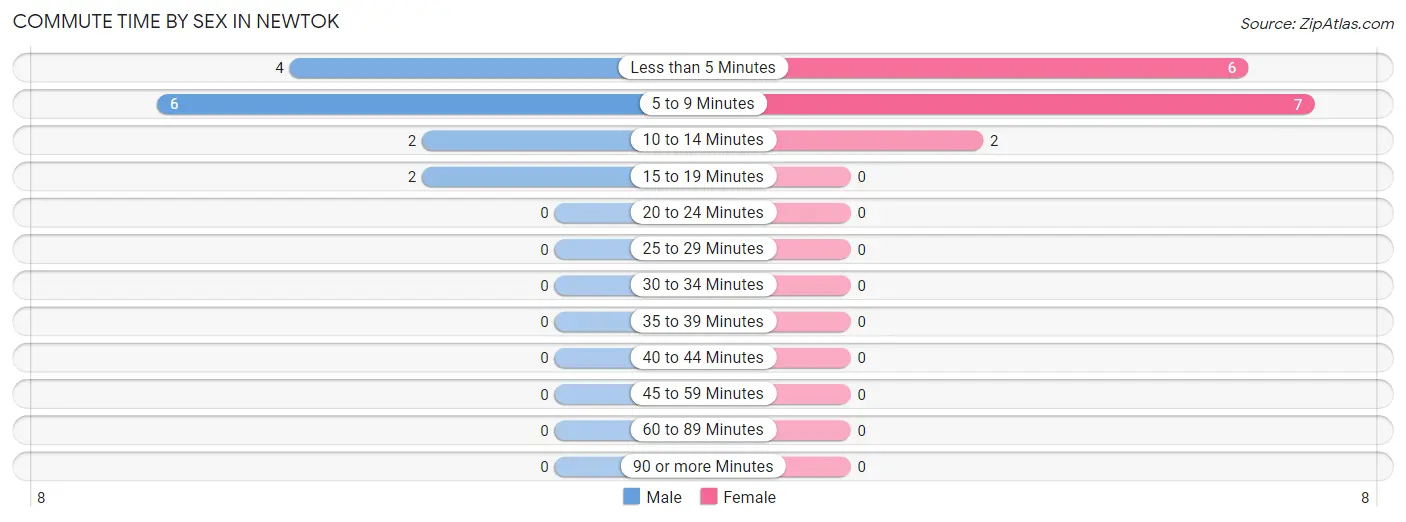
| Commute Time | Male | Female |
| Less than 5 Minutes | 4 (28.6%) | 6 (40.0%) |
| 5 to 9 Minutes | 6 (42.9%) | 7 (46.7%) |
| 10 to 14 Minutes | 2 (14.3%) | 2 (13.3%) |
| 15 to 19 Minutes | 2 (14.3%) | 0 (0.0%) |
| 20 to 24 Minutes | 0 (0.0%) | 0 (0.0%) |
| 25 to 29 Minutes | 0 (0.0%) | 0 (0.0%) |
| 30 to 34 Minutes | 0 (0.0%) | 0 (0.0%) |
| 35 to 39 Minutes | 0 (0.0%) | 0 (0.0%) |
| 40 to 44 Minutes | 0 (0.0%) | 0 (0.0%) |
| 45 to 59 Minutes | 0 (0.0%) | 0 (0.0%) |
| 60 to 89 Minutes | 0 (0.0%) | 0 (0.0%) |
| 90 or more Minutes | 0 (0.0%) | 0 (0.0%) |
Time of Departure to Work by Sex in Newtok
The most frequent times of departure to work in Newtok are 9:00 AM to 9:59 AM (4, 28.6%) for males and 12:00 AM to 4:59 AM (4, 26.7%) for females.
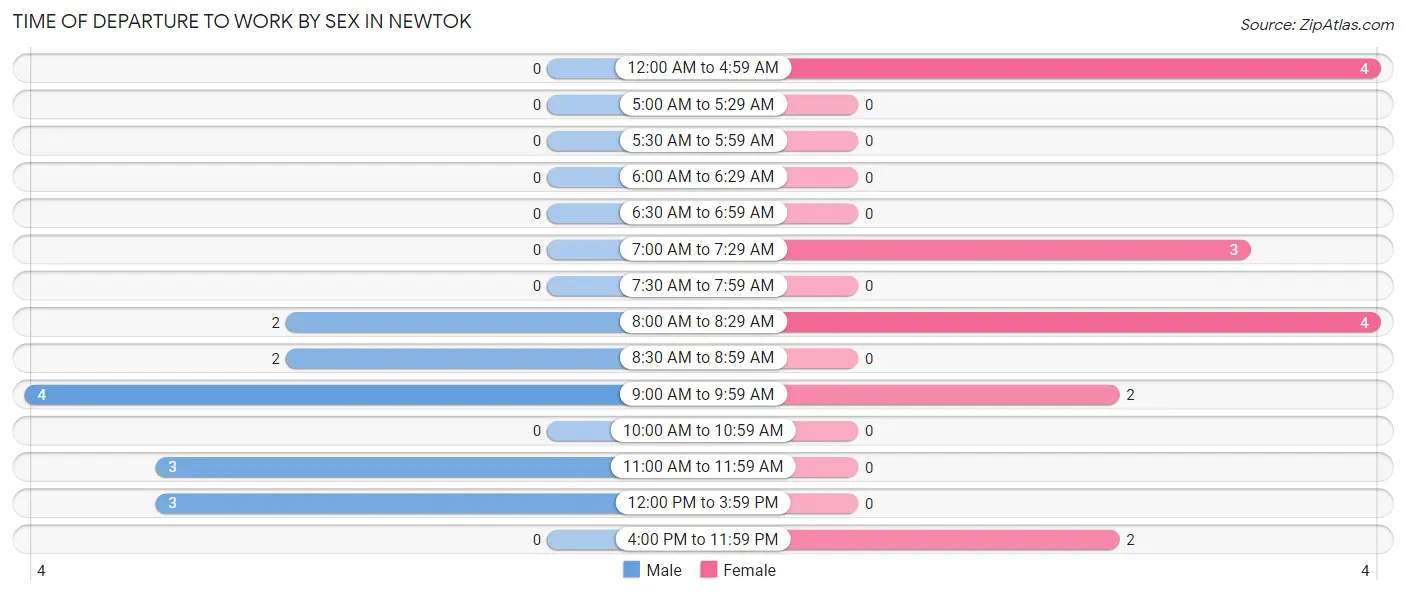
| Time of Departure | Male | Female |
| 12:00 AM to 4:59 AM | 0 (0.0%) | 4 (26.7%) |
| 5:00 AM to 5:29 AM | 0 (0.0%) | 0 (0.0%) |
| 5:30 AM to 5:59 AM | 0 (0.0%) | 0 (0.0%) |
| 6:00 AM to 6:29 AM | 0 (0.0%) | 0 (0.0%) |
| 6:30 AM to 6:59 AM | 0 (0.0%) | 0 (0.0%) |
| 7:00 AM to 7:29 AM | 0 (0.0%) | 3 (20.0%) |
| 7:30 AM to 7:59 AM | 0 (0.0%) | 0 (0.0%) |
| 8:00 AM to 8:29 AM | 2 (14.3%) | 4 (26.7%) |
| 8:30 AM to 8:59 AM | 2 (14.3%) | 0 (0.0%) |
| 9:00 AM to 9:59 AM | 4 (28.6%) | 2 (13.3%) |
| 10:00 AM to 10:59 AM | 0 (0.0%) | 0 (0.0%) |
| 11:00 AM to 11:59 AM | 3 (21.4%) | 0 (0.0%) |
| 12:00 PM to 3:59 PM | 3 (21.4%) | 0 (0.0%) |
| 4:00 PM to 11:59 PM | 0 (0.0%) | 2 (13.3%) |
| Total | 14 (100.0%) | 15 (100.0%) |
Housing Occupancy in Newtok
Occupancy by Ownership in Newtok
Of the total 27 dwellings in Newtok, owner-occupied units account for 19 (70.4%), while renter-occupied units make up 8 (29.6%).
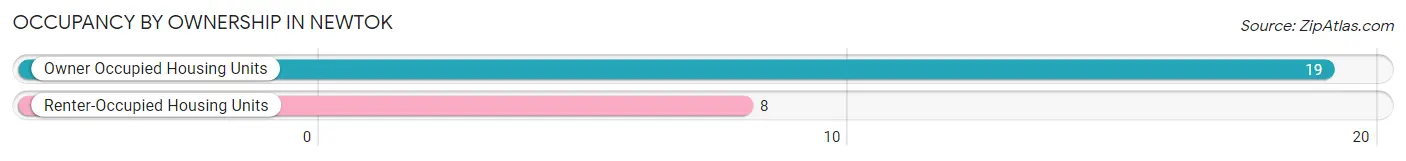
| Occupancy | # Housing Units | % Housing Units |
| Owner Occupied Housing Units | 19 | 70.4% |
| Renter-Occupied Housing Units | 8 | 29.6% |
| Total Occupied Housing Units | 27 | 100.0% |
Occupancy by Household Size in Newtok
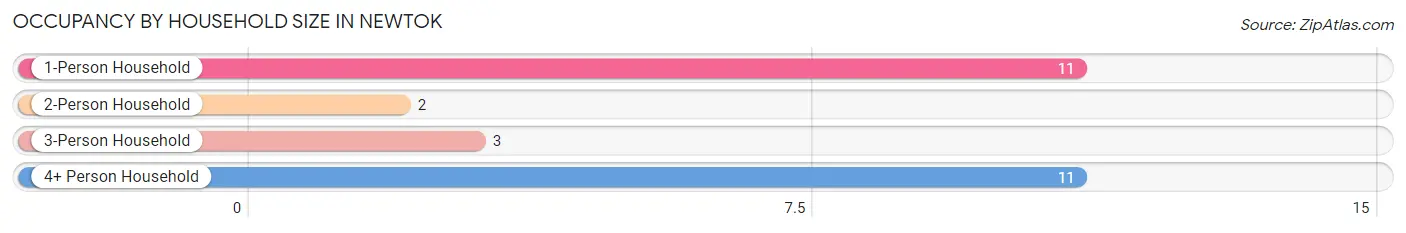
| Household Size | # Housing Units | % Housing Units |
| 1-Person Household | 11 | 40.7% |
| 2-Person Household | 2 | 7.4% |
| 3-Person Household | 3 | 11.1% |
| 4+ Person Household | 11 | 40.7% |
| Total Housing Units | 27 | 100.0% |
Occupancy by Ownership by Household Size in Newtok
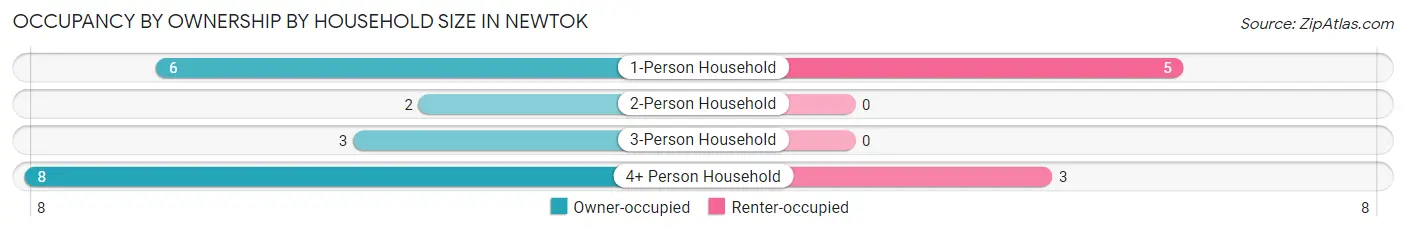
| Household Size | Owner-occupied | Renter-occupied |
| 1-Person Household | 6 (54.5%) | 5 (45.5%) |
| 2-Person Household | 2 (100.0%) | 0 (0.0%) |
| 3-Person Household | 3 (100.0%) | 0 (0.0%) |
| 4+ Person Household | 8 (72.7%) | 3 (27.3%) |
| Total Housing Units | 19 (70.4%) | 8 (29.6%) |
Occupancy by Educational Attainment in Newtok
| Household Size | Owner-occupied | Renter-occupied |
| Less than High School | 7 (100.0%) | 0 (0.0%) |
| High School Diploma | 12 (66.7%) | 6 (33.3%) |
| College/Associate Degree | 0 (0.0%) | 2 (100.0%) |
| Bachelor's Degree or higher | 0 (0.0%) | 0 (0.0%) |
Occupancy by Age of Householder in Newtok
| Age Bracket | # Households | % Households |
| Under 35 Years | 2 | 7.4% |
| 35 to 44 Years | 7 | 25.9% |
| 45 to 54 Years | 5 | 18.5% |
| 55 to 64 Years | 2 | 7.4% |
| 65 to 74 Years | 8 | 29.6% |
| 75 to 84 Years | 3 | 11.1% |
| 85 Years and Over | 0 | 0.0% |
| Total | 27 | 100.0% |
Housing Finances in Newtok
Median Income by Occupancy in Newtok
| Occupancy Type | # Households | Median Income |
| Owner-Occupied | 19 (70.4%) | $44,688 |
| Renter-Occupied | 8 (29.6%) | $26,250 |
| Average | 27 (100.0%) | $34,583 |
Occupancy by Householder Income Bracket in Newtok
| Income Bracket | Owner-occupied | Renter-occupied |
| Less than $5,000 | 0 (0.0%) | 0 (0.0%) |
| $5,000 to $9,999 | 0 (0.0%) | 0 (0.0%) |
| $10,000 to $14,999 | 2 (10.5%) | 0 (0.0%) |
| $15,000 to $19,999 | 0 (0.0%) | 0 (0.0%) |
| $20,000 to $24,999 | 4 (21.0%) | 3 (37.5%) |
| $25,000 to $34,999 | 0 (0.0%) | 5 (62.5%) |
| $35,000 to $49,999 | 4 (21.0%) | 0 (0.0%) |
| $50,000 to $74,999 | 7 (36.8%) | 0 (0.0%) |
| $75,000 to $99,999 | 0 (0.0%) | 0 (0.0%) |
| $100,000 to $149,999 | 2 (10.5%) | 0 (0.0%) |
| $150,000 or more | 0 (0.0%) | 0 (0.0%) |
| Total | 19 (100.0%) | 8 (100.0%) |
Monthly Housing Cost Tiers in Newtok
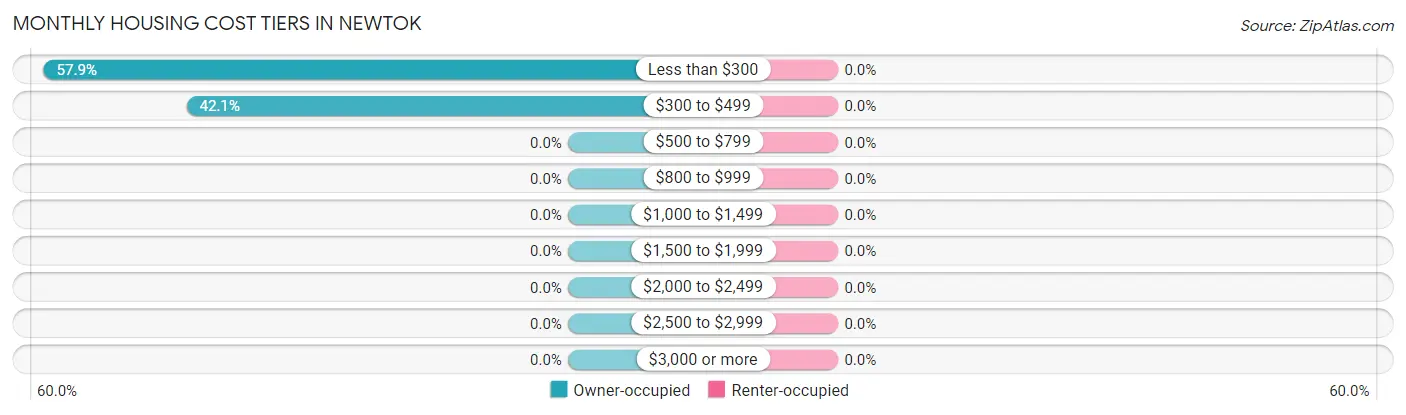
| Monthly Cost | Owner-occupied | Renter-occupied |
| Less than $300 | 11 (57.9%) | 0 (0.0%) |
| $300 to $499 | 8 (42.1%) | 0 (0.0%) |
| $500 to $799 | 0 (0.0%) | 0 (0.0%) |
| $800 to $999 | 0 (0.0%) | 0 (0.0%) |
| $1,000 to $1,499 | 0 (0.0%) | 0 (0.0%) |
| $1,500 to $1,999 | 0 (0.0%) | 0 (0.0%) |
| $2,000 to $2,499 | 0 (0.0%) | 0 (0.0%) |
| $2,500 to $2,999 | 0 (0.0%) | 0 (0.0%) |
| $3,000 or more | 0 (0.0%) | 0 (0.0%) |
| Total | 19 (100.0%) | 8 (100.0%) |
Physical Housing Characteristics in Newtok
Housing Structures in Newtok
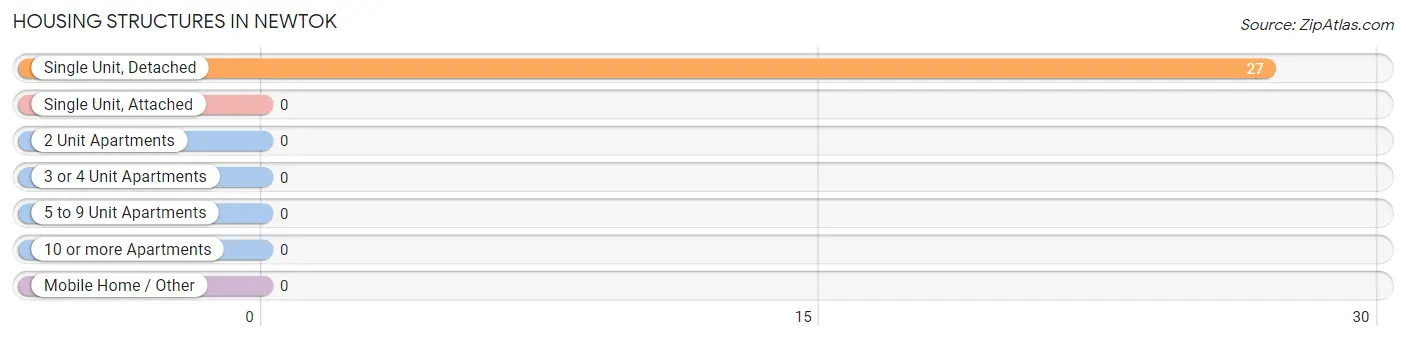
| Structure Type | # Housing Units | % Housing Units |
| Single Unit, Detached | 27 | 100.0% |
| Single Unit, Attached | 0 | 0.0% |
| 2 Unit Apartments | 0 | 0.0% |
| 3 or 4 Unit Apartments | 0 | 0.0% |
| 5 to 9 Unit Apartments | 0 | 0.0% |
| 10 or more Apartments | 0 | 0.0% |
| Mobile Home / Other | 0 | 0.0% |
| Total | 27 | 100.0% |
Housing Structures by Occupancy in Newtok
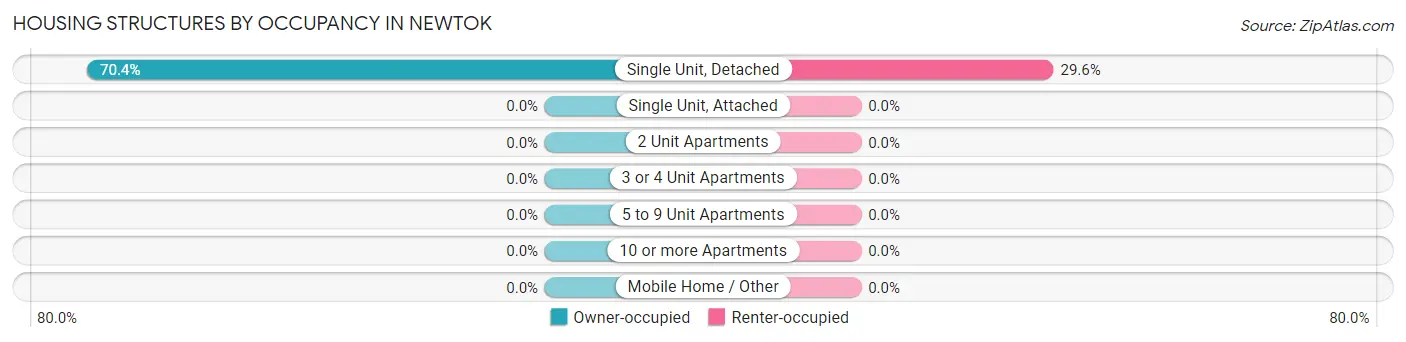
| Structure Type | Owner-occupied | Renter-occupied |
| Single Unit, Detached | 19 (70.4%) | 8 (29.6%) |
| Single Unit, Attached | 0 (0.0%) | 0 (0.0%) |
| 2 Unit Apartments | 0 (0.0%) | 0 (0.0%) |
| 3 or 4 Unit Apartments | 0 (0.0%) | 0 (0.0%) |
| 5 to 9 Unit Apartments | 0 (0.0%) | 0 (0.0%) |
| 10 or more Apartments | 0 (0.0%) | 0 (0.0%) |
| Mobile Home / Other | 0 (0.0%) | 0 (0.0%) |
| Total | 19 (70.4%) | 8 (29.6%) |
Housing Structures by Number of Rooms in Newtok
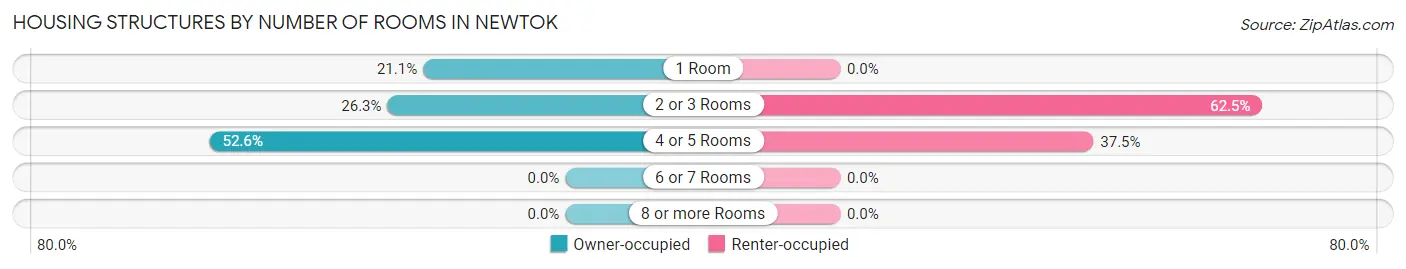
| Number of Rooms | Owner-occupied | Renter-occupied |
| 1 Room | 4 (21.0%) | 0 (0.0%) |
| 2 or 3 Rooms | 5 (26.3%) | 5 (62.5%) |
| 4 or 5 Rooms | 10 (52.6%) | 3 (37.5%) |
| 6 or 7 Rooms | 0 (0.0%) | 0 (0.0%) |
| 8 or more Rooms | 0 (0.0%) | 0 (0.0%) |
| Total | 19 (100.0%) | 8 (100.0%) |
Housing Structure by Heating Type in Newtok
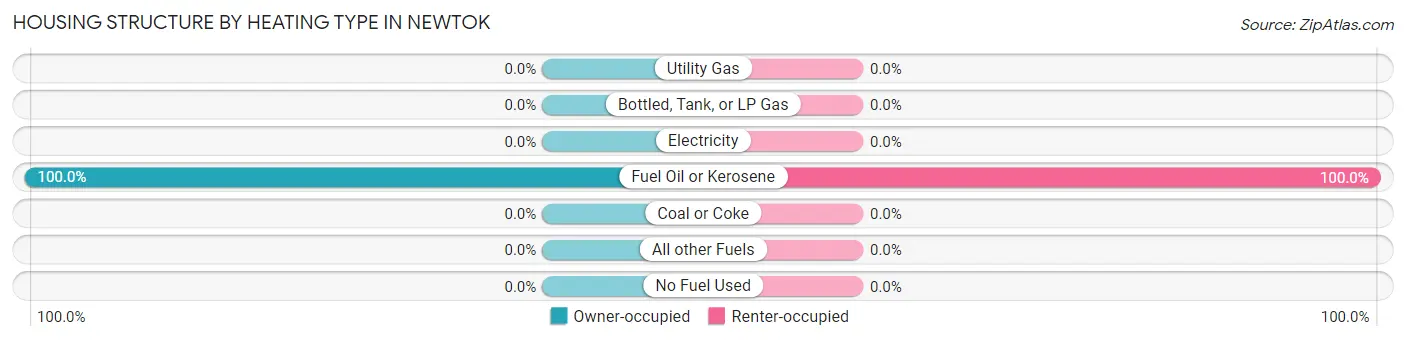
| Heating Type | Owner-occupied | Renter-occupied |
| Utility Gas | 0 (0.0%) | 0 (0.0%) |
| Bottled, Tank, or LP Gas | 0 (0.0%) | 0 (0.0%) |
| Electricity | 0 (0.0%) | 0 (0.0%) |
| Fuel Oil or Kerosene | 19 (100.0%) | 8 (100.0%) |
| Coal or Coke | 0 (0.0%) | 0 (0.0%) |
| All other Fuels | 0 (0.0%) | 0 (0.0%) |
| No Fuel Used | 0 (0.0%) | 0 (0.0%) |
| Total | 19 (100.0%) | 8 (100.0%) |
Household Vehicle Usage in Newtok
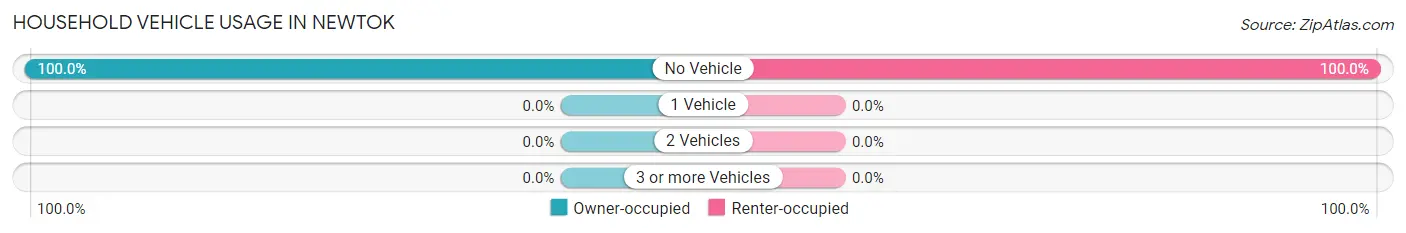
| Vehicles per Household | Owner-occupied | Renter-occupied |
| No Vehicle | 19 (100.0%) | 8 (100.0%) |
| 1 Vehicle | 0 (0.0%) | 0 (0.0%) |
| 2 Vehicles | 0 (0.0%) | 0 (0.0%) |
| 3 or more Vehicles | 0 (0.0%) | 0 (0.0%) |
| Total | 19 (100.0%) | 8 (100.0%) |
Real Estate & Mortgages in Newtok
Real Estate and Mortgage Overview in Newtok
| Characteristic | Without Mortgage | With Mortgage |
| Housing Units | 19 | 0 |
| Median Property Value | $75,000 | $0 |
| Median Household Income | $44,688 | $0 |
| Monthly Housing Costs | $213 | $0 |
| Real Estate Taxes | - | - |
Property Value by Mortgage Status in Newtok
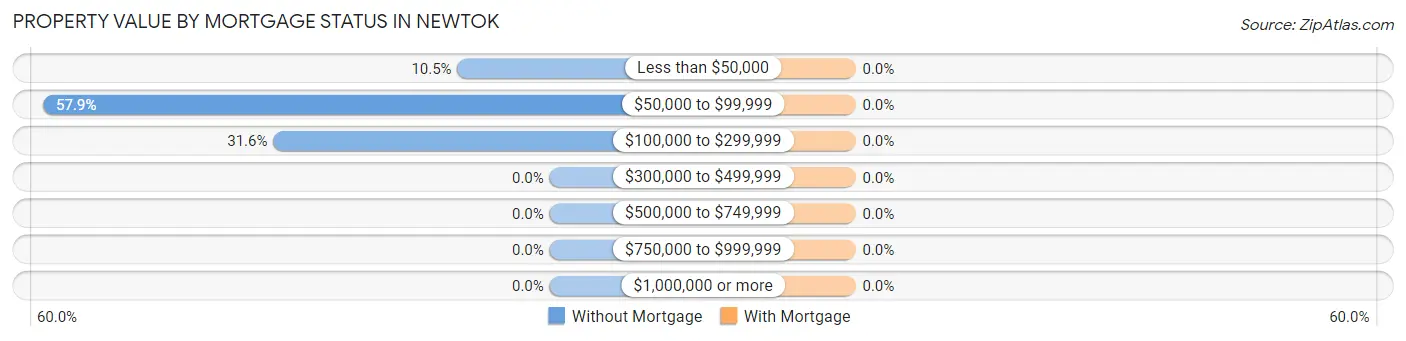
| Property Value | Without Mortgage | With Mortgage |
| Less than $50,000 | 2 (10.5%) | 0 (0.0%) |
| $50,000 to $99,999 | 11 (57.9%) | 0 (0.0%) |
| $100,000 to $299,999 | 6 (31.6%) | 0 (0.0%) |
| $300,000 to $499,999 | 0 (0.0%) | 0 (0.0%) |
| $500,000 to $749,999 | 0 (0.0%) | 0 (0.0%) |
| $750,000 to $999,999 | 0 (0.0%) | 0 (0.0%) |
| $1,000,000 or more | 0 (0.0%) | 0 (0.0%) |
| Total | 19 (100.0%) | 0 (0.0%) |
Household Income by Mortgage Status in Newtok
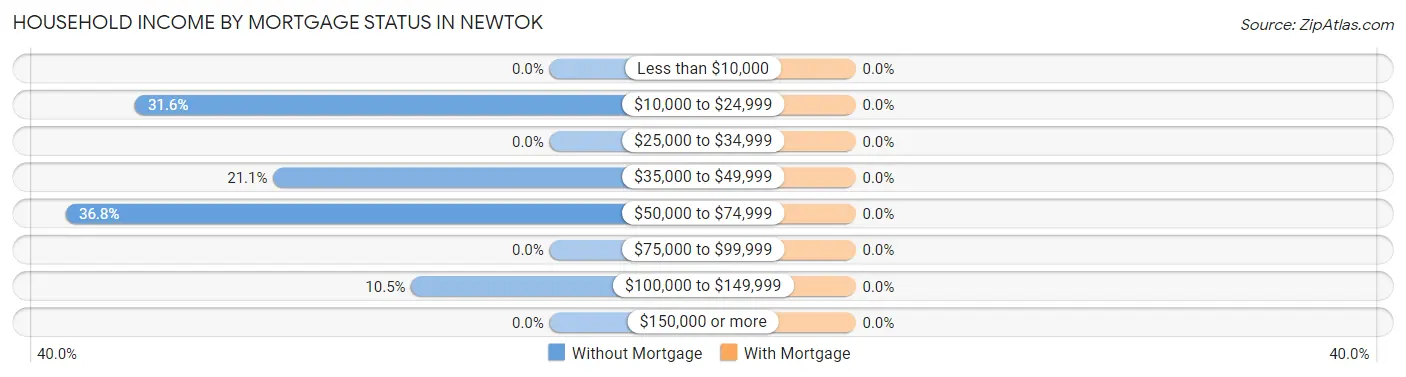
| Household Income | Without Mortgage | With Mortgage |
| Less than $10,000 | 0 (0.0%) | 0 (0.0%) |
| $10,000 to $24,999 | 6 (31.6%) | 0 (0.0%) |
| $25,000 to $34,999 | 0 (0.0%) | 0 (0.0%) |
| $35,000 to $49,999 | 4 (21.0%) | 0 (0.0%) |
| $50,000 to $74,999 | 7 (36.8%) | 0 (0.0%) |
| $75,000 to $99,999 | 0 (0.0%) | 0 (0.0%) |
| $100,000 to $149,999 | 2 (10.5%) | 0 (0.0%) |
| $150,000 or more | 0 (0.0%) | 0 (0.0%) |
| Total | 19 (100.0%) | 0 (0.0%) |
Property Value to Household Income Ratio in Newtok
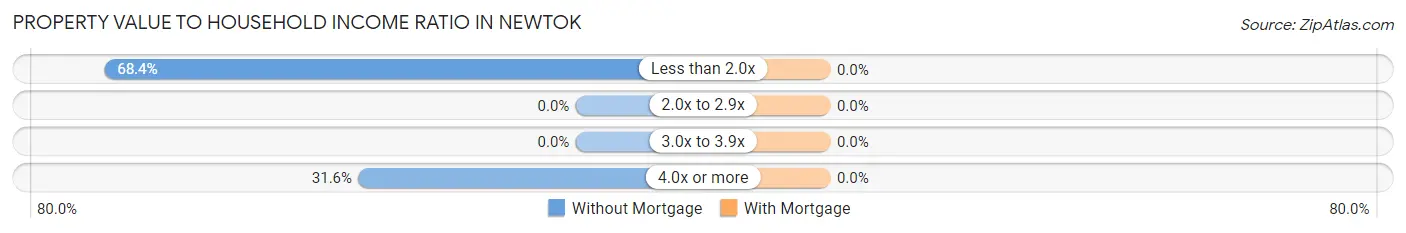
| Value-to-Income Ratio | Without Mortgage | With Mortgage |
| Less than 2.0x | 13 (68.4%) | 0 (0.0%) |
| 2.0x to 2.9x | 0 (0.0%) | 0 (0.0%) |
| 3.0x to 3.9x | 0 (0.0%) | 0 (0.0%) |
| 4.0x or more | 6 (31.6%) | 0 (0.0%) |
| Total | 19 (100.0%) | 0 (0.0%) |
Real Estate Taxes by Mortgage Status in Newtok
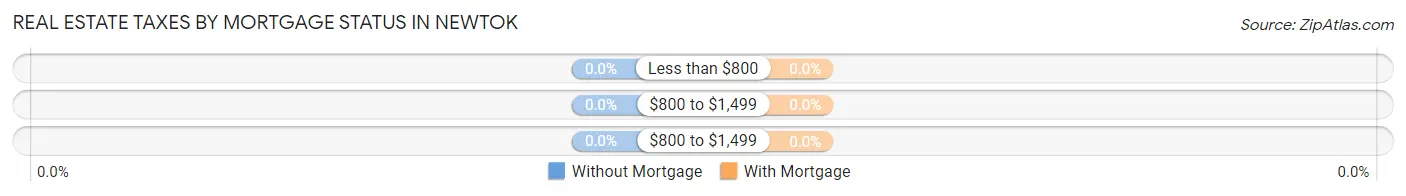
| Property Taxes | Without Mortgage | With Mortgage |
| Less than $800 | 0 (0.0%) | 0 (0.0%) |
| $800 to $1,499 | 0 (0.0%) | 0 (0.0%) |
| $800 to $1,499 | 0 (0.0%) | 0 (0.0%) |
| Total | 19 (100.0%) | 0 (0.0%) |
Health & Disability in Newtok
Health Insurance Coverage by Age in Newtok
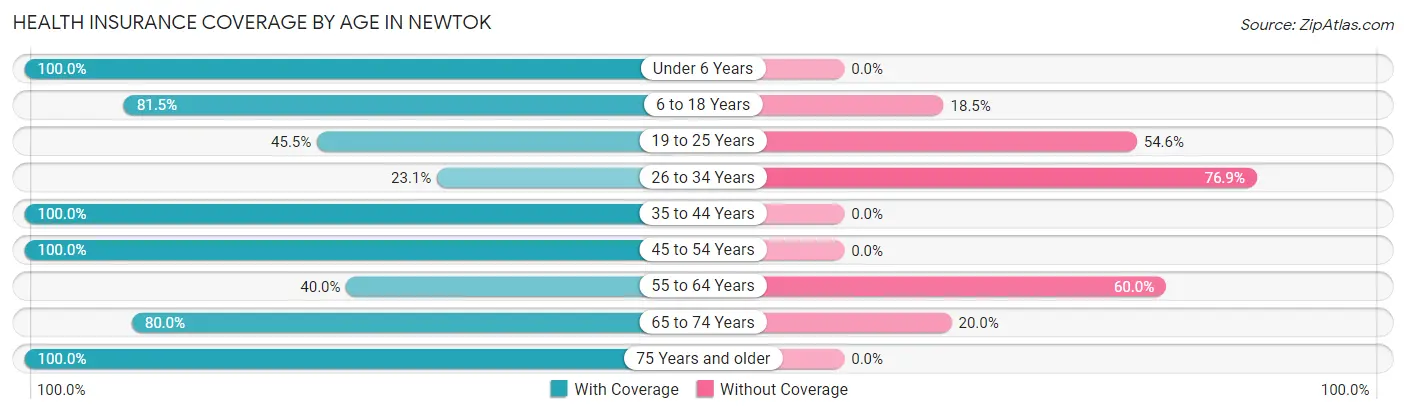
| Age Bracket | With Coverage | Without Coverage |
| Under 6 Years | 7 (100.0%) | 0 (0.0%) |
| 6 to 18 Years | 22 (81.5%) | 5 (18.5%) |
| 19 to 25 Years | 5 (45.5%) | 6 (54.5%) |
| 26 to 34 Years | 3 (23.1%) | 10 (76.9%) |
| 35 to 44 Years | 13 (100.0%) | 0 (0.0%) |
| 45 to 54 Years | 7 (100.0%) | 0 (0.0%) |
| 55 to 64 Years | 2 (40.0%) | 3 (60.0%) |
| 65 to 74 Years | 8 (80.0%) | 2 (20.0%) |
| 75 Years and older | 3 (100.0%) | 0 (0.0%) |
| Total | 70 (72.9%) | 26 (27.1%) |
Health Insurance Coverage by Citizenship Status in Newtok
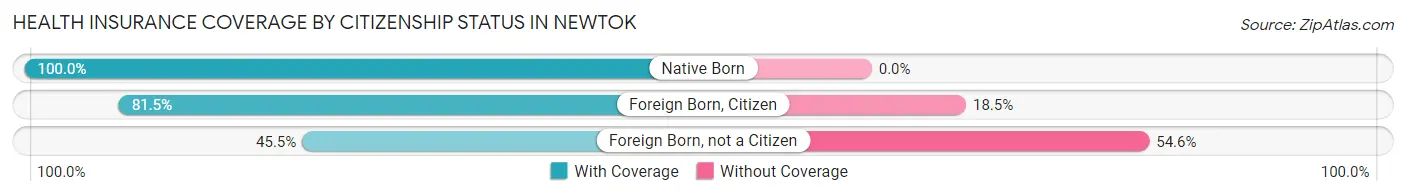
| Citizenship Status | With Coverage | Without Coverage |
| Native Born | 7 (100.0%) | 0 (0.0%) |
| Foreign Born, Citizen | 22 (81.5%) | 5 (18.5%) |
| Foreign Born, not a Citizen | 5 (45.5%) | 6 (54.5%) |
Health Insurance Coverage by Household Income in Newtok
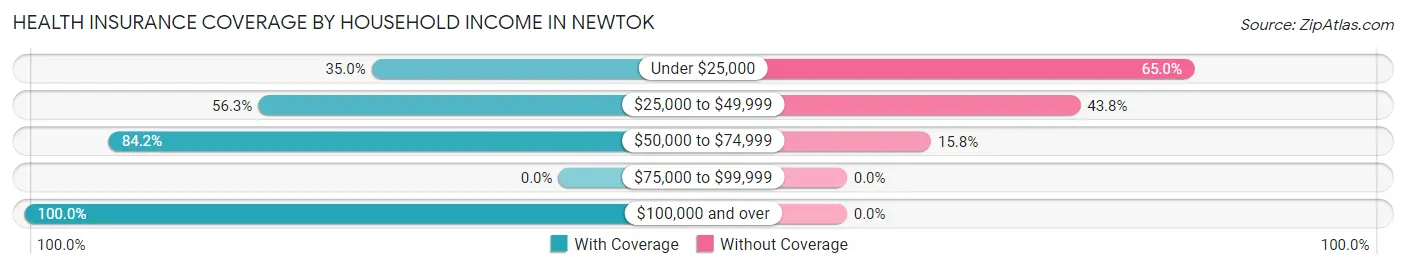
| Household Income | With Coverage | Without Coverage |
| Under $25,000 | 7 (35.0%) | 13 (65.0%) |
| $25,000 to $49,999 | 9 (56.2%) | 7 (43.8%) |
| $50,000 to $74,999 | 32 (84.2%) | 6 (15.8%) |
| $75,000 to $99,999 | 0 (0.0%) | 0 (0.0%) |
| $100,000 and over | 22 (100.0%) | 0 (0.0%) |
Public vs Private Health Insurance Coverage by Age in Newtok
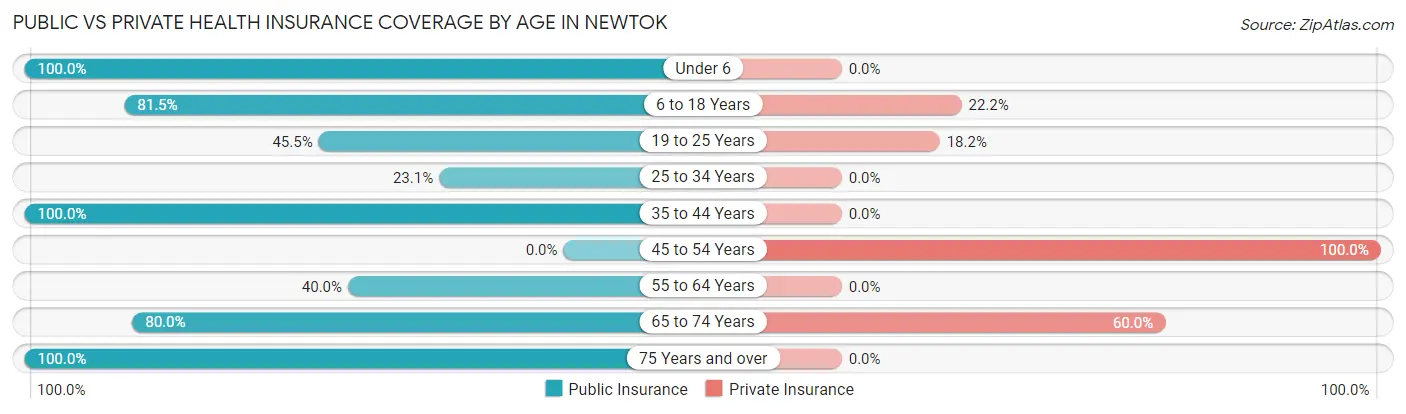
| Age Bracket | Public Insurance | Private Insurance |
| Under 6 | 7 (100.0%) | 0 (0.0%) |
| 6 to 18 Years | 22 (81.5%) | 6 (22.2%) |
| 19 to 25 Years | 5 (45.5%) | 2 (18.2%) |
| 25 to 34 Years | 3 (23.1%) | 0 (0.0%) |
| 35 to 44 Years | 13 (100.0%) | 0 (0.0%) |
| 45 to 54 Years | 0 (0.0%) | 7 (100.0%) |
| 55 to 64 Years | 2 (40.0%) | 0 (0.0%) |
| 65 to 74 Years | 8 (80.0%) | 6 (60.0%) |
| 75 Years and over | 3 (100.0%) | 0 (0.0%) |
| Total | 63 (65.6%) | 21 (21.9%) |
Disability Status by Sex by Age in Newtok
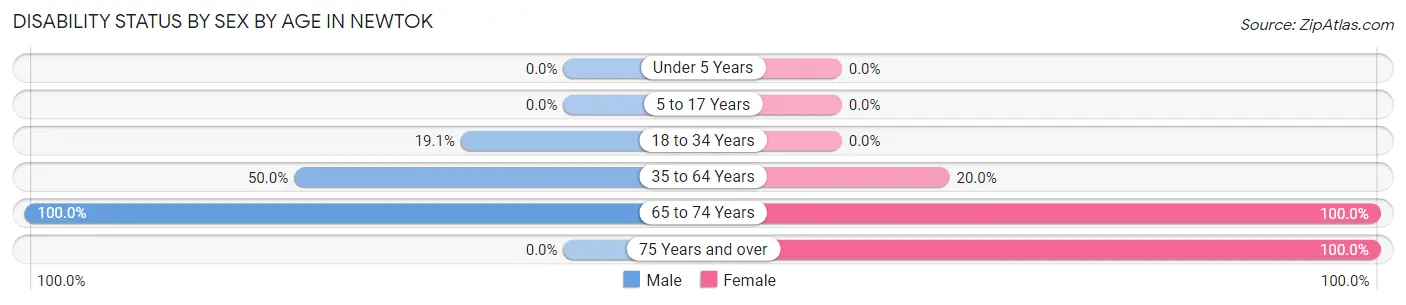
| Age Bracket | Male | Female |
| Under 5 Years | 0 (0.0%) | 0 (0.0%) |
| 5 to 17 Years | 0 (0.0%) | 0 (0.0%) |
| 18 to 34 Years | 4 (19.1%) | 0 (0.0%) |
| 35 to 64 Years | 5 (50.0%) | 3 (20.0%) |
| 65 to 74 Years | 8 (100.0%) | 2 (100.0%) |
| 75 Years and over | 0 (0.0%) | 3 (100.0%) |
Disability Class by Sex by Age in Newtok
Disability Class: Hearing Difficulty
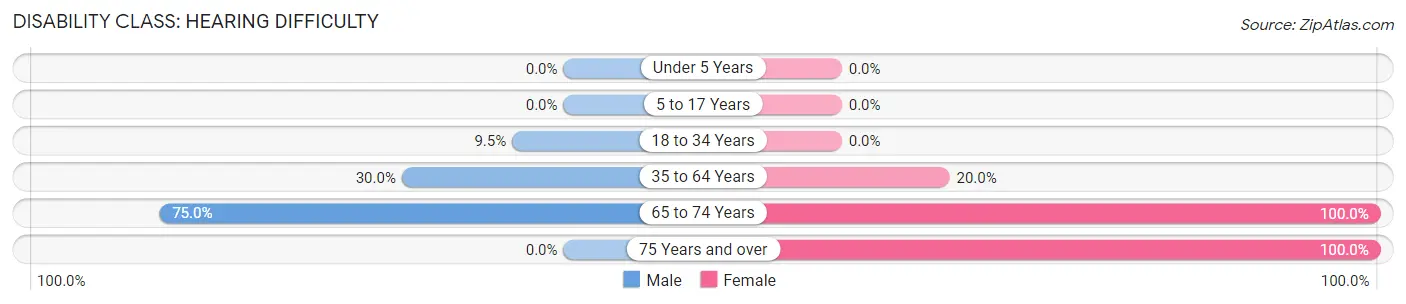
| Age Bracket | Male | Female |
| Under 5 Years | 0 (0.0%) | 0 (0.0%) |
| 5 to 17 Years | 0 (0.0%) | 0 (0.0%) |
| 18 to 34 Years | 2 (9.5%) | 0 (0.0%) |
| 35 to 64 Years | 3 (30.0%) | 3 (20.0%) |
| 65 to 74 Years | 6 (75.0%) | 2 (100.0%) |
| 75 Years and over | 0 (0.0%) | 3 (100.0%) |
Disability Class: Vision Difficulty
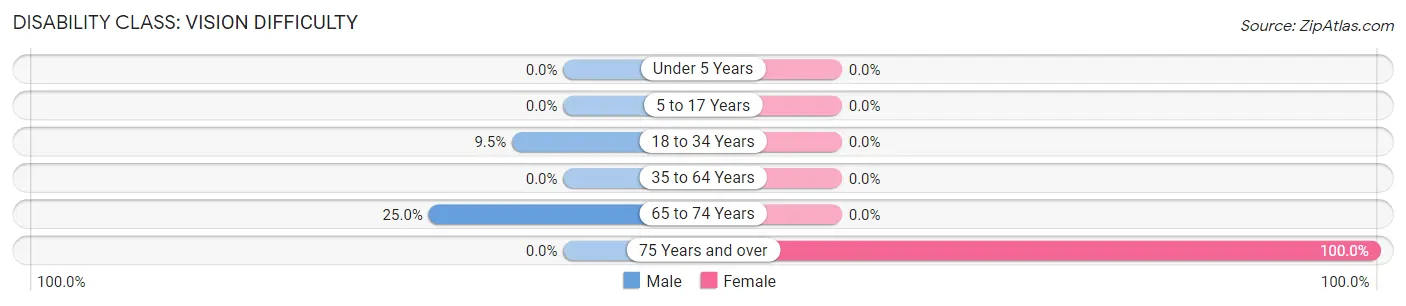
| Age Bracket | Male | Female |
| Under 5 Years | 0 (0.0%) | 0 (0.0%) |
| 5 to 17 Years | 0 (0.0%) | 0 (0.0%) |
| 18 to 34 Years | 2 (9.5%) | 0 (0.0%) |
| 35 to 64 Years | 0 (0.0%) | 0 (0.0%) |
| 65 to 74 Years | 2 (25.0%) | 0 (0.0%) |
| 75 Years and over | 0 (0.0%) | 3 (100.0%) |
Disability Class: Cognitive Difficulty
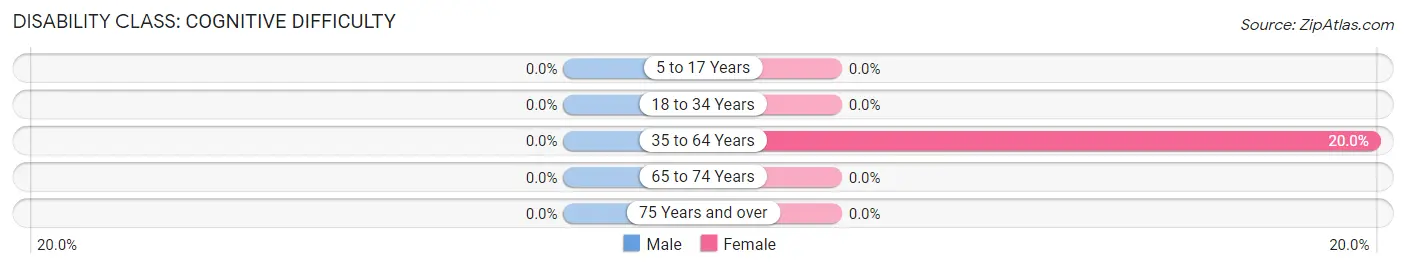
| Age Bracket | Male | Female |
| 5 to 17 Years | 0 (0.0%) | 0 (0.0%) |
| 18 to 34 Years | 0 (0.0%) | 0 (0.0%) |
| 35 to 64 Years | 0 (0.0%) | 3 (20.0%) |
| 65 to 74 Years | 0 (0.0%) | 0 (0.0%) |
| 75 Years and over | 0 (0.0%) | 0 (0.0%) |
Disability Class: Ambulatory Difficulty
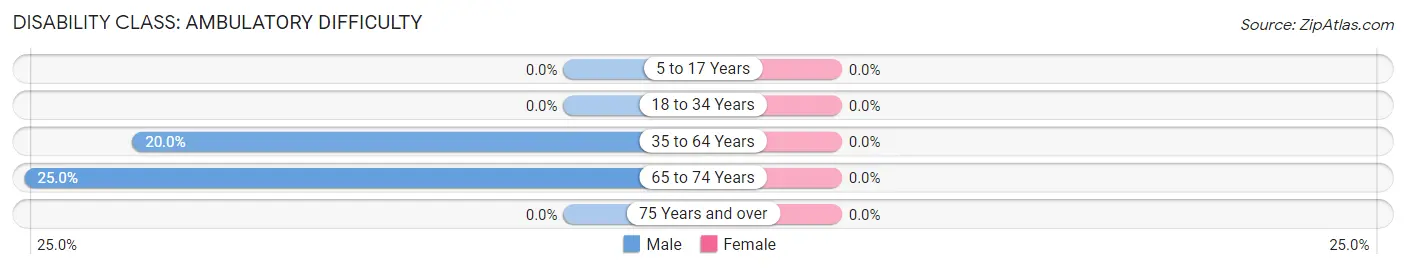
| Age Bracket | Male | Female |
| 5 to 17 Years | 0 (0.0%) | 0 (0.0%) |
| 18 to 34 Years | 0 (0.0%) | 0 (0.0%) |
| 35 to 64 Years | 2 (20.0%) | 0 (0.0%) |
| 65 to 74 Years | 2 (25.0%) | 0 (0.0%) |
| 75 Years and over | 0 (0.0%) | 0 (0.0%) |
Disability Class: Self-Care Difficulty
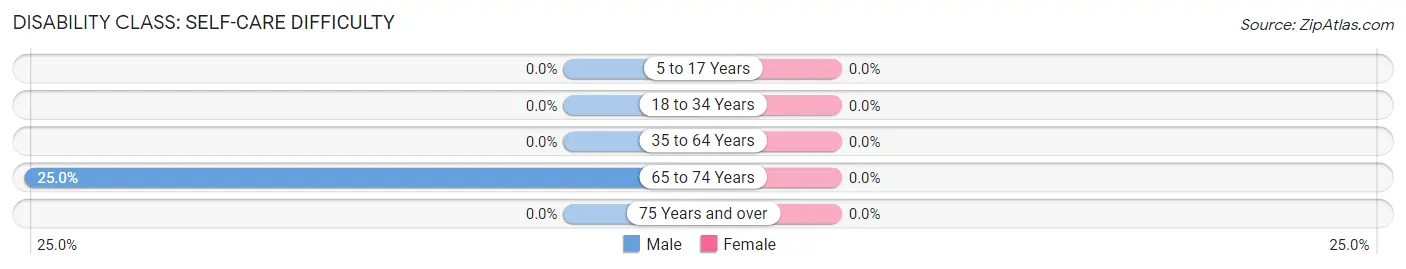
| Age Bracket | Male | Female |
| 5 to 17 Years | 0 (0.0%) | 0 (0.0%) |
| 18 to 34 Years | 0 (0.0%) | 0 (0.0%) |
| 35 to 64 Years | 0 (0.0%) | 0 (0.0%) |
| 65 to 74 Years | 2 (25.0%) | 0 (0.0%) |
| 75 Years and over | 0 (0.0%) | 0 (0.0%) |
Technology Access in Newtok
Computing Device Access in Newtok
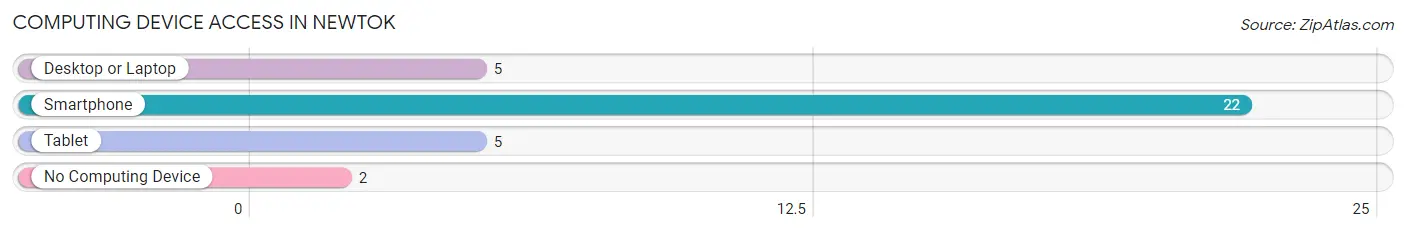
| Device Type | # Households | % Households |
| Desktop or Laptop | 5 | 18.5% |
| Smartphone | 22 | 81.5% |
| Tablet | 5 | 18.5% |
| No Computing Device | 2 | 7.4% |
| Total | 27 | 100.0% |
Internet Access in Newtok
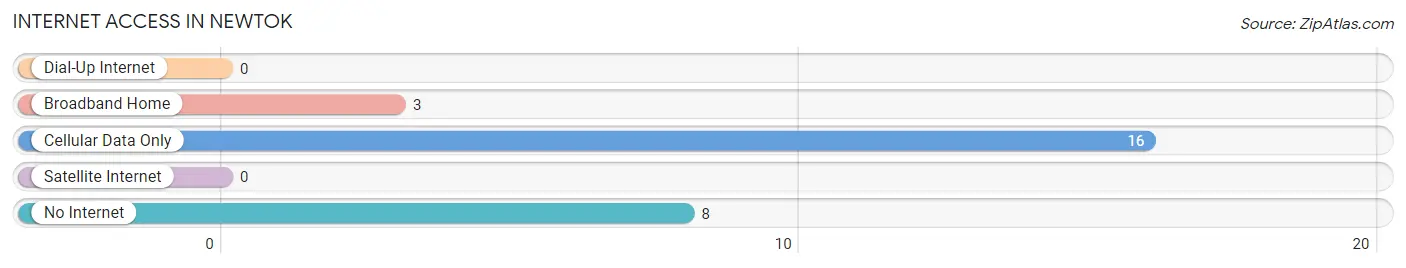
| Internet Type | # Households | % Households |
| Dial-Up Internet | 0 | 0.0% |
| Broadband Home | 3 | 11.1% |
| Cellular Data Only | 16 | 59.3% |
| Satellite Internet | 0 | 0.0% |
| No Internet | 8 | 29.6% |
| Total | 27 | 100.0% |
Newtok Summary
Newtok, Alaska is a small village located on the banks of the Ninglick River in the Yukon-Kuskokwim Delta region of Alaska. It is the largest Yup'ik Eskimo village in the state, with a population of approximately 400 people. The village is located approximately 10 miles from the Bering Sea coast and is accessible only by air or boat.
Geography
Newtok is located in the Yukon-Kuskokwim Delta region of Alaska, approximately 10 miles from the Bering Sea coast. The village is situated on the banks of the Ninglick River, which is a major tributary of the Kuskokwim River. The area is characterized by low-lying tundra and wetlands, with the Ninglick River providing a major source of transportation and sustenance for the village. The climate in the area is generally cold and wet, with temperatures ranging from -20°F in the winter to 60°F in the summer.
Economy
The economy of Newtok is largely based on subsistence activities, such as fishing, hunting, and gathering. The village is also home to a small commercial fishing fleet, which provides employment for some of the residents. The village also receives some income from the sale of handicrafts and other items to tourists.
Demographics
As of the 2010 census, the population of Newtok was 393, with a median age of 24.7 years. The majority of the population (95.2%) is Native American, with the majority of the population (90.2%) being Yup'ik Eskimo. The village is also home to a small population of non-Native Americans, primarily of European descent.
History
Newtok was first established in the late 19th century by Yup'ik Eskimos who had migrated from the nearby village of Nunam Iqua. The village was originally known as Mertarvik, which means "place of the people" in Yup'ik. In the early 20th century, the village was renamed Newtok, which means "new village" in Yup'ik.
In the 1950s, the village was relocated to its current location due to the erosion of the Ninglick River. The relocation was part of a larger effort to protect the village from the effects of climate change and rising sea levels. In recent years, the village has been working to relocate again due to the continued erosion of the Ninglick River.
Conclusion
Newtok, Alaska is a small Yup'ik Eskimo village located in the Yukon-Kuskokwim Delta region of Alaska. The village is home to approximately 400 people and is largely dependent on subsistence activities for its economy. The village is also facing the effects of climate change and rising sea levels, which has led to the need for relocation. Despite these challenges, the village remains a vibrant and resilient community.
Common Questions
What is Per Capita Income in Newtok?
Per Capita income in Newtok is $12,669.
What is the Median Family Income in Newtok?
Median Family Income in Newtok is $51,250.
What is the Median Household income in Newtok?
Median Household Income in Newtok is $34,583.
What is Income or Wage Gap in Newtok?
Income or Wage Gap in Newtok is 19.0%.
Women in Newtok earn 81.0 cents for every dollar earned by a man.
What is Inequality or Gini Index in Newtok?
Inequality or Gini Index in Newtok is 0.30.
What is the Total Population of Newtok?
Total Population of Newtok is 96.
What is the Total Male Population of Newtok?
Total Male Population of Newtok is 53.
What is the Total Female Population of Newtok?
Total Female Population of Newtok is 43.
What is the Ratio of Males per 100 Females in Newtok?
There are 123.26 Males per 100 Females in Newtok.
What is the Ratio of Females per 100 Males in Newtok?
There are 81.13 Females per 100 Males in Newtok.
What is the Median Population Age in Newtok?
Median Population Age in Newtok is 31.2 Years.
What is the Average Family Size in Newtok
Average Family Size in Newtok is 5.2 People.
What is the Average Household Size in Newtok
Average Household Size in Newtok is 3.6 People.
How Large is the Labor Force in Newtok?
There are 39 People in the Labor Forcein in Newtok.
What is the Percentage of People in the Labor Force in Newtok?
52.7% of People are in the Labor Force in Newtok.
What is the Unemployment Rate in Newtok?
Unemployment Rate in Newtok is 25.6%.